Article

Building a Persuasive Virtual Dietitian

by
Luca Anselma
*,† and
Alessandro Mazzei
*,†
Dipartimento di Informatica, Università degli Studi di Torino, corso Svizzera 185, 10149 Torino, Italy
*
Authors to whom correspondence should be addressed.
These authors contributed equally to this work.
Informatics 2020, 7(3), 27; https://doi.org/10.3390/informatics7030027
Submission received: 1 July 2020 / Revised: 24 July 2020 / Accepted: 27 July 2020 / Published: 30 July 2020
(This article belongs to the Special Issue Feature Papers: Health Informatics)

Abstract

:
This paper describes the Multimedia Application for Diet Management (MADiMan), a system that supports users in managing their diets while admitting diet transgressions. MADiMan consists of a numerical reasoner that takes into account users’ dietary constraints and automatically adapts the users’ diet, and of a natural language generation (NLG) system that automatically creates textual messages for explaining the results provided by the reasoner with the aim of persuading users to stick to a healthy diet. In the first part of the paper, we introduce the MADiMan system and, in particular, the basic mechanisms related to reasoning, data interpretation and content selection for a numeric data-to-text NLG system. We also discuss a number of factors influencing the design of the textual messages produced. In particular, we describe in detail the design of the sentence-aggregation procedure, which determines the compactness of the final message by applying two aggregation strategies. In the second part of the paper, we present the app that we developed, CheckYourMeal!, and the results of two human-based quantitative evaluations of the NLG module conducted using CheckYourMeal! in a simulation. The first evaluation, conducted with twenty users, ascertained both the perceived usefulness of graphics/text and the appeal, easiness and persuasiveness of the textual messages. The second evaluation, conducted with thirty-nine users, ascertained their persuasive power. The evaluations were based on the analysis of questionnaires and of logged data of users’ behaviour. Both evaluations showed significant results.

1. Introduction

The pervasiveness of computers allows them to communicate with humans anytime and anywhere. As a consequence, humans are often surrounded by a huge amount of information deriving from automatic computation. There are two big issues arising from this scenario, which are the information overloading and the comprehensibility of the results. In many situations, multimedia communication can help people to overcome these problems. For instance, infographics have shown their applicability in a number of contexts [1], but it has been proven that graphics are useful only for trained users [2]. As a consequence, computers can effectively communicate with not-trained users only by using the most sophisticated technology that nature gave to human beings, that is natural language.
Indeed, a number of studies have proven a higher comprehensibility of natural language with respect to graphics in some specific technical communications. For instance, in the medical domain, an experiment with human evaluation showed that it was possible to automatically generate helpful natural language summaries for physicians and nurses from an electronic patient record system in a neonatal intensive-care unit [3,4]. A similar experimentation in an intensive-care unit confirmed the utility of natural language descriptions for clinicians [5]. In a different domain, that is weather forecasts, the automatic generation of messages concerning uncertain weather data can improve the performances of the users participating to a simulation experiment [6].
The use of natural language for human–computer interaction is the standard modality of interaction in the case of virtual assistants. Virtual assistants can play an important role in fulfilling a virtuous behaviour in many human activities by providing a stimulus when needed—Fogg called it kairos [7]. For example, when a person goes to a restaurant and is presented with a menu, she/he might not know how to make a correct decision according to his/her diet. A virtual dietitian, that is a virtual assistant in the diet domain, might prove to be useful by providing three facilities. First, it enhances the users’ abilities to recognize healthy dishes by exploiting reasoning mechanisms. Second, it provides a persuasive stimulus at the right time, i.e., when users must choose the dishes to eat. Third, it helps users in devising the consequences of a diet transgression [8].
The great importance of persuasive technologies for health and wellness is proven by the amount of studies on this specific topic, e.g., the survey [9] analysed 85 works published between 2000 and 2015. In particular, the eating domain represents a major application of persuasive technologies: in [9], twenty-five percent of the analysed works regarded the eating domain.
This paper addresses persuasive natural language message generation (NLG) in the domain of dietary regimens. We describe the implementation of the NLG module of the diet management system called MADiMan (Multimedia Application for Diet Management) [10]. The goal of MADiMan is to build a complete computer infrastructure for helping people to follow a healthy diet.
In previous work, we discussed the general architecture of the MADiMan system [10,11] and the capacity of the reasoning module with a number of simulation experiments with virtual agents based on hospital menus [12] and on Mediterranean menus [13,14]. The research questions that we explore in this paper concern the NLG module of MADiMan, which has been partially previously described in some preliminary work [15,16]. In particular, in this paper, we want to investigate the design, the implementation and the evaluation of (1) the optimal linguistic shaping in the message generation and (2) the persuasive power of the messages that should guide users toward an optimal dietary choice. We answer both of these research questions by describing the NLG algorithms and by designing and performing two simulation experiments with humans. In fact, in order to evaluate the system, we used quantitative methods based both on questionnaires and on logged data analysis. In this regard, it is worth noting that a recent survey on persuasive technologies [9] reports that “the most commonly used approach for collecting quantitative data was questionnaire/survey”, while only a few studies ( 13 % , 11 / 85 ) used logged data analysis.
The paper is structured as follows. In Section 2, we discuss the related work. In Section 3, we give a description of the MADiMan system and, specifically, a detailed description of the NLG module. In particular, in Section 3.1, we introduce the MADiMan project, and in Section 3.2, we introduce the reasoning framework based on simple temporal problems (STPs). In Section 3.3, we illustrate in detail the NLG module of the MADiMan project. In particular, Section 3.3.1 regards the data interpretation and content selection process that converts into a symbolic form the numeric output of the reasoner; Section 3.3.2 regards the design of the messages produced by the realization engine; Section 3.3.3 illustrates two algorithms that we use for message aggregation. In Section 4, we discuss the experimental setting used for the simulation experiments with humans. In particular, in Section 4.1, we describe the first experiment designed to quantitatively evaluate message appeal by varying two specific linguistic features, i.e., the aggregation strategy and the lexical choice procedure. Both of these features influence the compactness and the variety of the messages. In Section 4.2, we describe a second experiment primarily designed to quantitatively evaluate the persuasive power of the messages. For both experiments, we show the results of a human-based evaluation performed with questionnaires. Moreover, for the second experiment, we provide also a measure of the textual message’s persuasive power obtained by logging the behaviour of the users in reaction to the messages. Finally, Section 5 closes the paper with some concluding remarks and future work.
A preliminary version of this paper has been published in the proceedings of the International Conference on Natural Language Generation 2018 (INLG) [16]).

2. Related Work

In the literature, there is an increasing number of projects concerning the application of NLG for supporting people to adopt a virtuous behaviour, e.g., [17,18,19,20,21]. For instance, in the pioneering work [17], a tailored email was automatically generated and sent with the aim to help people with quitting smoke. The basic idea was to characterize a user on the basis of the answers given to a form and to personalize the email by using this information. The experimentation, performed with control groups, showed that tailoring did not give any added value to the persuasive power of the messages, and, in the authors’ opinion, many factors in the design of the NLG system could cause this result.
Many works tackled the application of NLG for presenting the results of automated reasoning, e.g., [22,23,24]. Furthermore, many theoretical works on the design of persuasive textual and multimedia messages have been recently proposed. We can split these studies into two classes. The first class is composed by works dealing with the persuasion from an empirical point of view, by using strategies and methods typical of the psychology and of the interaction design [7,17,18,25], while the second class is composed of works dealing with the persuasion from a theoretical point of view, exploiting strategies and methods common in cognitive science [26,27,28]. For instance, in [25], Cialdini identified six characteristic human patterns: (1) reciprocity: people feel obligated to return a favour, (2) scarcity: people will value scarce products, (3) authority: people value the opinion of experts, (4) consistency: people do as they said they would, (5) consensus: people do as other people do and (6) liking: we say yes to people we like. A different perspective on persuasion was considered in [27], where low-level linguistic strategies, e.g., the use of adverbs, were considered.
Guerini et al.’s persuasive strategies taxonomy [28] proposes a classification that starts from belief-desire-intention (BDI) modelling of the agent involved. In this way, the authors were able to decompose and organize the various components that play a role in persuasion actions.
In [29], the authors presented a framework for designing and evaluating persuasive systems, i.e., the persuasive systems design. The authors defined the development of a persuasive system as a three-step process: (1) understanding the persuasion process, (2) analysing the persuasion context and (3) designing the system qualities. Moreover, they proposed twenty-eight design guidelines for designing persuasive systems. Many of the guidelines proposed in [29] have been followed by the MADiMan system. In particular, the reduction effort principle is followed since MADiMan simplifies the analysis of a meal; the social role principle is followed since MADiMan impersonates a dietitian; the expertise and verifiability principles are followed since the MADiMan message is based on numerical computation.
MADiMan carries out numerical computation integrating food energy values with diet requirements and then presents the result of such computation in natural language. A key point is the composition of information regarding the different macronutrients. Thus, we could classify the MADiMan NLG module as a data-to-text system, which can be seen as a sort of transformation channel that converts numeric information into textual information [30]. Reference [31] is a recent survey of data-to-text technology with a focus on the healthcare setting. The authors considered several kinds of data sources and a categorized overview of NLG applications for transforming these data sources to text. MADiMan particularly fits the “data-to-text for patient engagement” category, that is empowering users in making their own choices on diet. Indeed, the idea to present a message conveying information about the appropriateness of a specific meal allows for “…informing patients adequately about their health status and treatment options for building up trust between patient and doctor” [31].
Four recent data-to-text systems, similar to MADiMan in motivations and techniques, were described in [20,21,32,33].
In [32], the authors presented “a motivational platform for supporting the monitoring of users’ behaviours and for persuading them to follow healthy lifestyles”, which is a flexible computational architecture to merge general principles about persuasion strategies with specific domain knowledge in order to guide users toward a healthy behaviour. The authors provided a case study based on food intake and physical activity that implemented an ontological reasoner that checked the fulfilment of a number of logical constraints. Moreover, reference [32] adopted a template-based generation of tailored messages based on a rich taxonomy of persuasion strategies. In contrast with [32], the data managed by MADiMan are essentially numeric and the reasoning module is based on numeric constraints rather than on ontologies. Moreover, MADiMan adopts a linguistically sound NLG pipeline rather than linear templates.
In [20], a weekly report regarding a user’s car driving style was generated by using telematic data collected from an accelerometer and a GPS receiver. Similar to MADiMan, (i) some persuasive strategies inspired by captology (computer as persuasive technology [7]) were used and (ii) a complete linguistically-sound NLG pipeline was applied; moreover, (iii) the SimpleNLG realizer was used. However, in contrast to MADiMan, where the domain concerns wellness and the messages are generated for each meal of the week in a simulation context, a report was generated weekly, and the experimentation was conducted in a real-world scenario for five weeks.
In [33], the authors reported the results of a quantitative and qualitative evaluation of How was School Today?, an NLG system for helping the verbal communication of children with complex communication needs. The system was able to structure, verbalize and pronounce a personal story based on a number of records concerning the daily activity of a person. They used a very simple NLG pipeline based on fixed schema for sentence planning and the use of SimpleNLG for realization (cf. Section 3.3.2). In particular, reference [33] proposed three different clustering strategies for selecting and merging the daily events in the story. The three strategies were based on the time, the location and the voice recordings of the events. They evaluated the strategies by asking the parents and grandparents of the children that took part in the experimentation to complete a questionnaire. The experimentation showed that the voice-recording clustering was perceived as the preferred strategy for event clustering. Note that, similar to the experimentation presented in this paper (see Section 4), reference [33] focused on the NLG engineering problem of aggregation. However, in contrast to our approach, which focuses on the syntactic aggregation of sentences, reference [33] used clustering for the semantic aggregation of the events.
In [21], a customized linguistic report on household energy consumption was bimonthly generated with the aim of helping people to save energy. By using theories from the NLG field, from the computational theory of perceptions and from fuzzy sets, the authors provided a detailed description of a case study based on real databases and attitudinal and physical taxonomies. In particular, they used taxonomies to personalize a number of report templates, which generated linguistic suggestions to improve the daily energy consumption. Therefore, in contrast to MADiMan, the persuasion strategy was based on user tailoring rather than on general theories of linguistic persuasion.

3. Reasoning and Generating Messages in the Diet Domain

In this section, we describe the MADiMan architecture and the Reasoner module, and we introduce the NLG module.

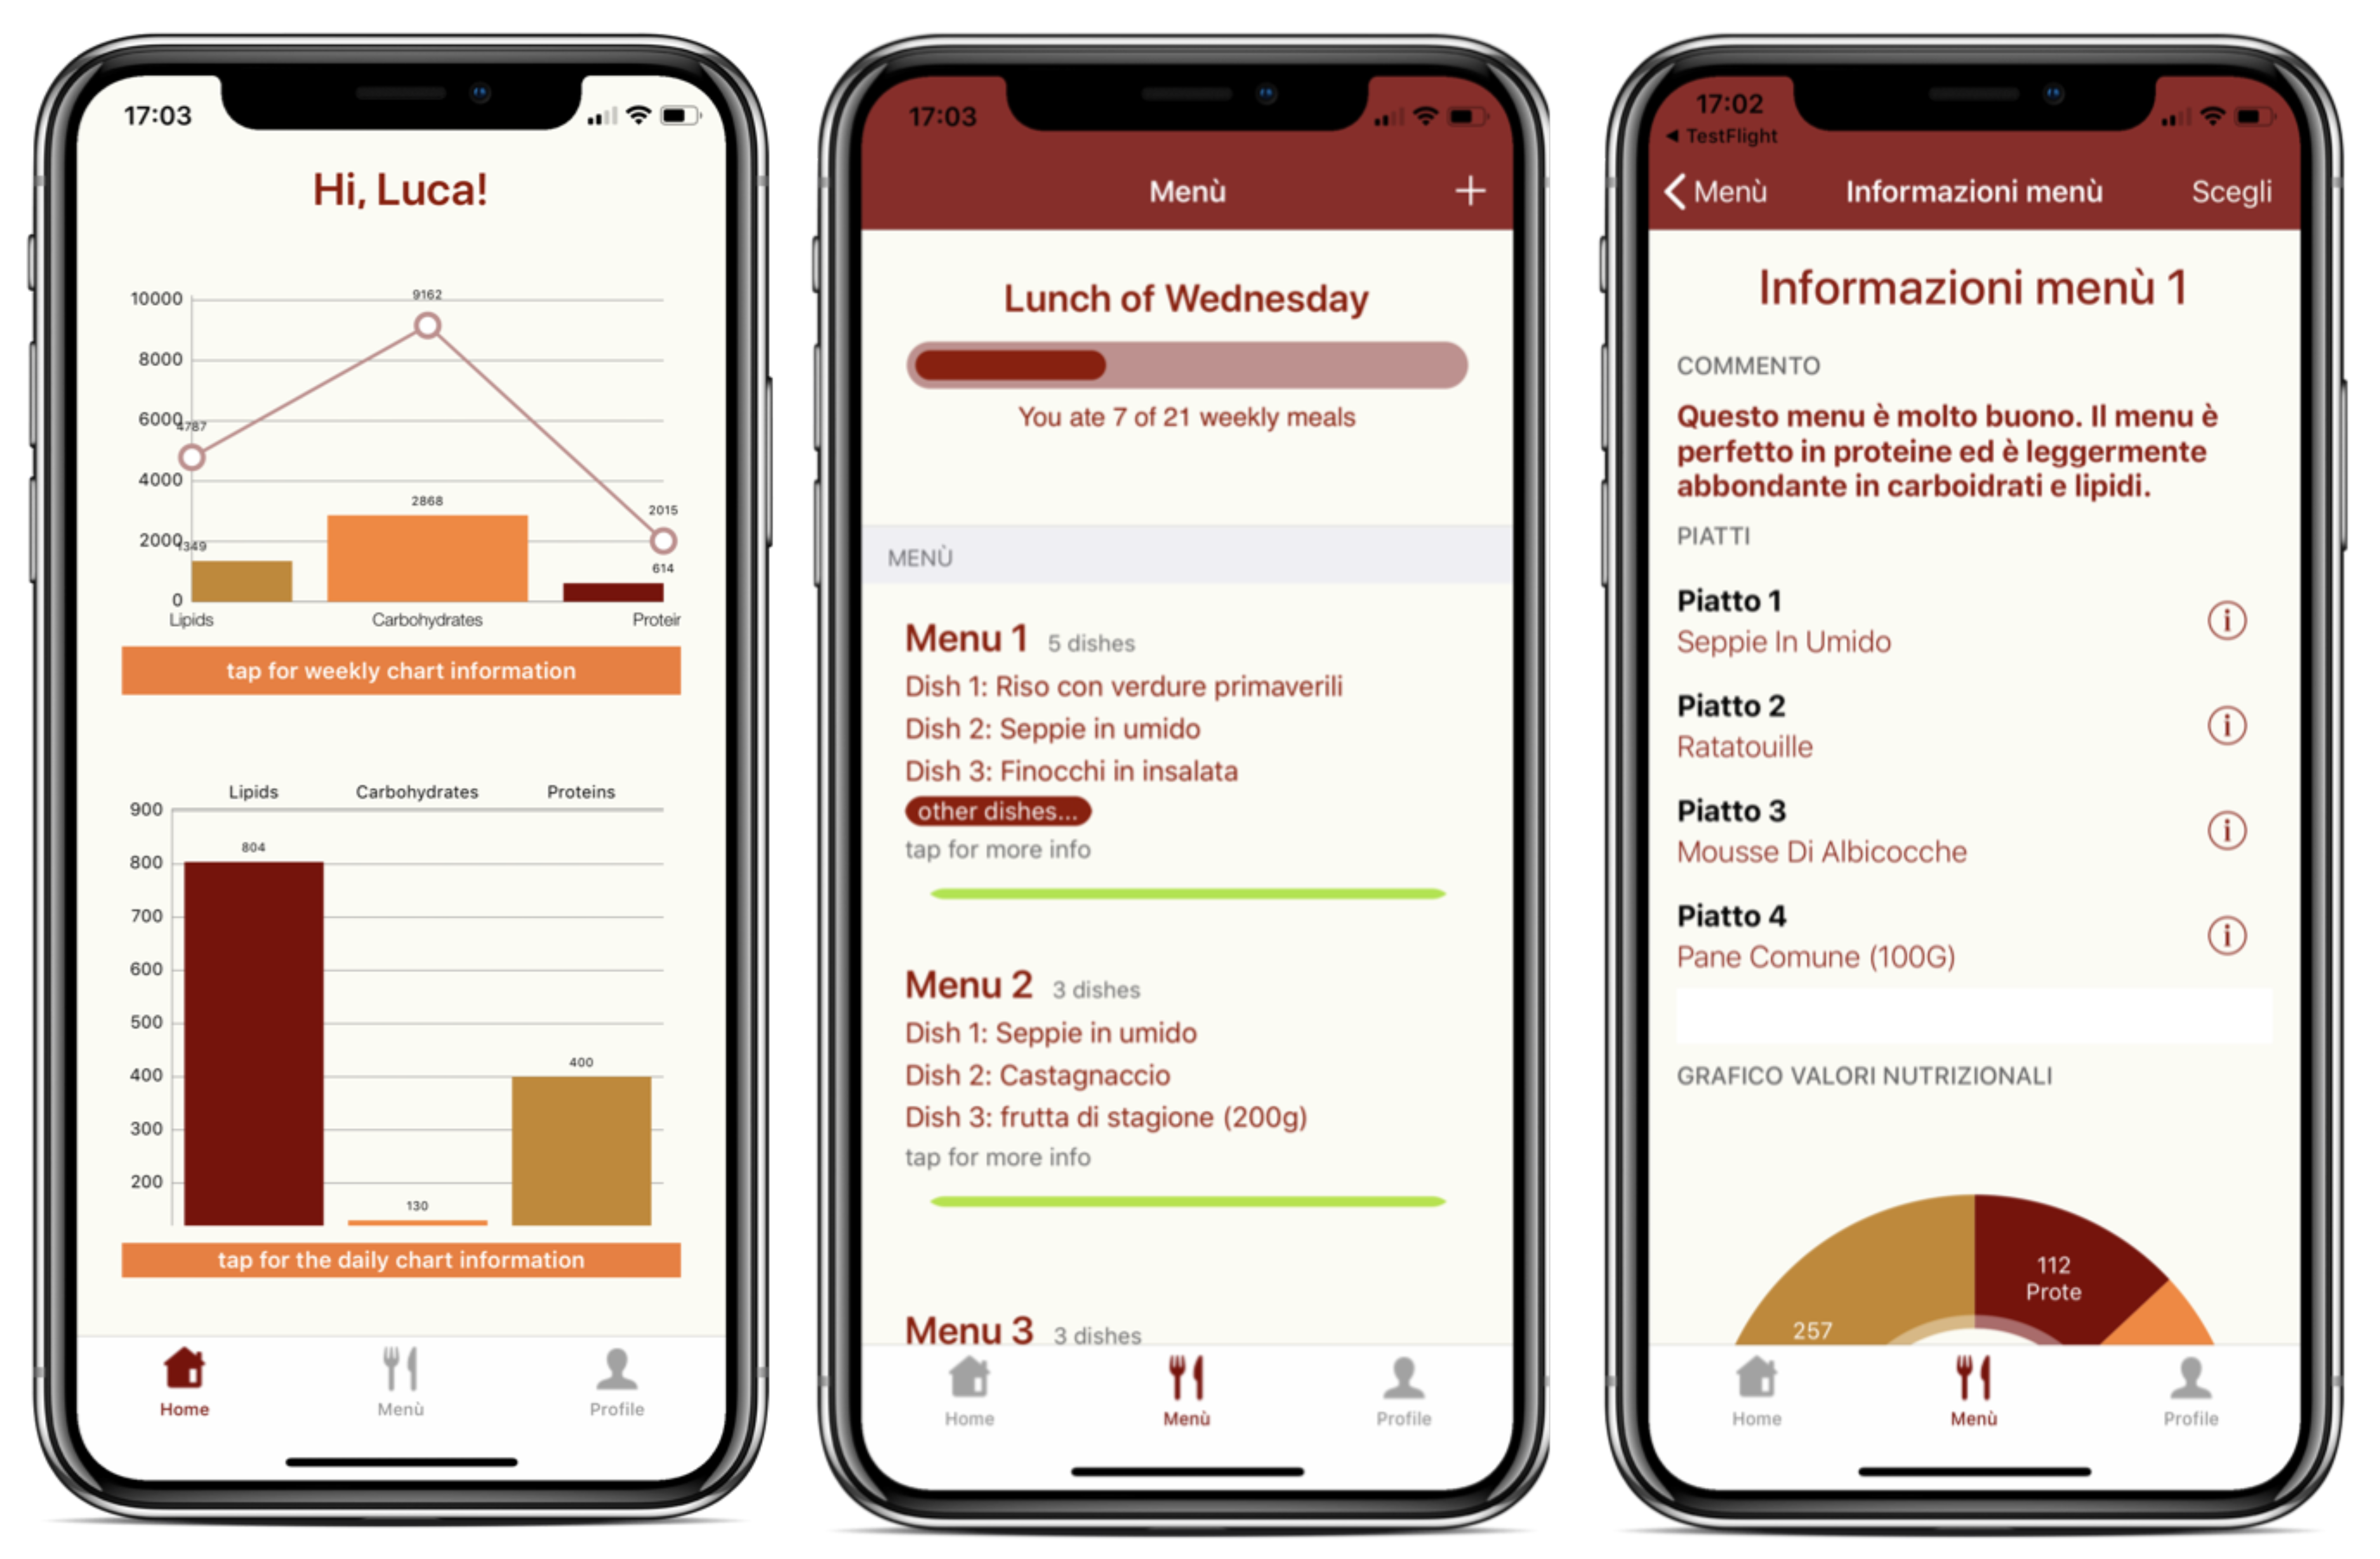
3.1. The MADiMan Architecture

The MADiMan system is a virtual dietitian designed to fulfil three basic tasks: (1) retrieve the nutritional information of a dish directly from its recipe, (2) exploiting such nutrition information and data regarding diets by allowing some forms of diet disobedience while pursuing the goals of the diets and (3) encourage the user to reduce these disobedience acts. MADiMan offers facilities for verifying the compatibility and predicting the effect of disobedience acts on a specific diet [10,11].
Figure 1 shows the architecture of the MADiMan system. The information flow is: (1) A user, by using an app, recovers the specific recipe of a dish (or menu) that she/he would like to eat. (2) The app, interacting with the DietManager service, retrieves the user diet together with the list of the foods the user had previously eaten. (3) The NLU/IEmodule recovers the pertinent nutrition information of the specific dish. (4) Using the user diet and the list of the foods eaten in the previous days, the Reasoner generates the final recommendation for the user concerning the proposed dish. (5) Starting from the recommendation elaborated by the Reasoner, the NLG service generates a simple explanation for the user in plain natural language. (6) The result provided by the NLG service is sent to the app by the DietManager: the user will see this final result on her/his smartphone. If the user wants to eat the dish, this information will be sent to the DietManager by the app, and the list of eaten food will be updated.

3.2. STP Reasoning for Diets

The reasoning module exploits the framework of simple temporal problems (STPs) [34]. Factors such as energy requirements and the amount of macronutrients need to be considered in a diet. Dietary reference values (DRVs) of the macronutrients are proposed in the medical literature (e.g., [35]). Such values are computed by taking into account weight, gender, age and lifestyle. For example, let us consider a 48-year-old male who is 1.81 m tall, weighs 75 kg and has a lightly active lifestyle; such a person has a total energy requirement of 2450 kcal/day. The DRVs in LARN [35] recommend to distribute such energy among 260 kcal/day of proteins, 735 kcal/day of lipids and 1455 kcal/day of carbohydrates.
In MADiMan, we represent the DRVs as an STP [12]. An STP consists of a conjunction of bounds on differences. A bound on difference c x y d , intuitively, represents the constraint that the distance between the time points x and y has a lower bound of c and an upper bound of d. While in the original setting, STP represents time, we instead use STP for representing both the DRVs imposed by a diet and the amount of macronutrients of a dish.
Thus, e.g., the bound on the difference 600 kcal l u n c h E l u n c h S 700 kcal constrains the lunch to be between 600 and 700 kcal by bounding the “distance” between the start (i.e., l u n c h S ) and the end (i.e., l u n c h E ) of lunch. In other words, lunch must provide 550 kcal with a tolerance of ± 50 kcal (see, for an example of an STP representation of a diet, Figure 2). Notice that STP constraints, when the lower bound is different from the upper bound, allow encoding both imprecision in the measurement of the portion and non-strict dietary constraints.
By means of constraint propagation, the minimal network [34] is computed, i.e., an STP equivalent to the original STP such that all the implied STP constraints are explicit since each propagated STP constraint represents the strictest constraint between each pair of points. A minimal network is decomposable, i.e., any partial consistent assignment of values to the points can be extended to a solution of the STP [34]. Thus, each value in an STP constraint within a minimal network is granted to be consistent with the STP. In Algorithm 1, we show the basic constraint propagation algorithm that computes the minimal network. It consists of three nested loops that compute the all-pairs shortest paths of the STP and it corresponds to the Floyd–Warshall algorithm. In [12], we described how such a basic algorithm can be exploited to determine the consistency of some meals with respect to a diet and to perform a what-if analysis to foresee the consequences of a diet violation.
Algorithm 1 Minimal network enforcing algorithm.
function FloydWarshall( D i e t S T P )
  let V be the vertices of D i e t S T P
  let E be the edges of D i e t S T P
  let λ be the labels of the edges E of D i e t S T P
  n ← | V |
  for k 1 n do
    for i , j 1 n do
     if λ ( i , j ) < λ ( i , k ) + λ ( k , j ) then
        λ ( i , j ) λ ( i , k ) + λ ( k , j )
  if D i e t S T P has a negative cycle then
    return I n c o n s i s t e n t
  else
    return D i e t S T P
Thus, MADiMan exploits the STP framework to assess the compatibility of a specific dish with the actual status of the diet and converts the numerical result into a symbolic form suitable for generating messages in natural language [30]. It is worth noting that, to provide user-friendly information that can also be useful for the sake of user persuasion, the natural language output is not limited to a “consistent/inconsistent” message.
In previous works [13,36], we used the simulation paradigm to show that the STP reasoner outperforms reasonable baselines. In the context of a collaboration with the hospital “Città della Salute, Molinette” in Turin, Italy, in [36], we considered the menu served in the hospital in June 2016. We designed a simulation where the simulated patients chose the dishes of each meal of a week considering the hospital menu. Our system suggested an “optimal” meal, and the users could accept or reject such a suggestion, thus deviating from an optimal choice. We showed that the STP reasoner outperformed a greedy baseline reasoner and provided a good solution for managing a healthy diet, significantly improving the achievement of the diet goals in the case of dietary transgressions. In [13,14], we evaluated our system in a different simulation based on the Gedeone recipe book, which contains a collection of traditional Mediterranean recipes that we also use in this paper (see Section 4). In this case as well, our system outperformed a greedy baseline reasoner.
The current version of the MADiMan system uses the Schofield formula that is meant for a general user base with no medical or specific dietary requirements. However, MADiMan can also use variations of this formula: for example, in [15], we presented a version of the system where the DRVs are adjusted in order to account for hospitalized patients that have very low energy requirements. It is worth noting that MADiMan also allows a human dietitian to “override” the Schofield formula and to directly provide the DRVs for specific users having dietary constraints deriving from specific conditions.
In the next sections, we describe in detail the data-to-text algorithm.

3.3. From Numeric Reasoning toward Textual Messages: An NLG Architecture

In this section, we describe the design and the implementation of an NLG system for the realization of the messages regarding the results of the reasoner.
We use a commonly adopted architecture for NLG in data-to-text systems, especially in application contexts (the well-known problem of hallucinations in neural networks deter their use in real-world NLG [37], especially in the domain of health and wellness), which is a pipeline composed of four distinct modules: data analyser, document planner, sentence planner and surface realizer [30,31]. Each module tackles a specific issue, i.e.: (1) data analyser determines what can be said, i.e., a domain-specific analysis of numeric input data and its abstraction and interpretation are performed; (2) the document planner determines what to say, i.e., which information shall be communicated; (3) the sentence planner determines how to communicate with specific attention on the design of features related to the contents of the information and to the specific language, such as the choice of the words; (4) the surface realizer finally produces the sentences on the basis of the results of the other modules and by considering language-specific constraints.
We describe the data interpretation in Section 3.3.1 and document planning, sentence planning and surface realization in Section 3.3.2.

3.3.1. Data Interpretation: Converting Numbers into Categories

To provide the user with meaningful feedback in natural language, the data resulting from the STP must first be interpreted. For the sake of clarity, in this section, we present the algorithm of content selection operating on a single macronutrient. The issue of integrating the feedback of the three macronutrients (i.e., carbohydrates, proteins and lipids) is considered in Section 3.3.2.
Let us consider the case where the user wants to eat a specific meal and consults the system. The system obtains the caloric value of the meal, translates it, along with the user’s diet and the past meals, into an STP and propagates the constraints to compute the minimal network.
Using the minimal network resulting from the constraint propagation on the STP, where, for each meal and for each macronutrient, a lower and upper bound is provided (see Section 3.2), we classify the proposed meal with regard to the diet into: permanently inconsistent ( I 1 ), provisionally inconsistent ( I 2 ), consistent, but not balanced ( C 1 ), consistent and well-balanced ( C 2 ) and consistent and perfectly balanced ( C 3 ).
The first two cases correspond to an inconsistent meal and the remaining three cases correspond to a consistent meal. It is possible to determine whether a meal is consistent by using the minimal network: in fact, if the value of the energy supplied is included between the lower and upper bounds of the relative STP constraint, the meal is certainly consistent with the STP, and thus, the meal is consistent with the diet. In particular, in case I 1 , the energy supply is inconsistent with the diet of the user taking into account the tolerance values. This case is identified by comparing the nutritional value of the meal and the corresponding constraint in the “original” STP, i.e., the STP that corresponds to the diet and does not include the dishes previously eaten. If the dish violates the constraint, the meal is inconsistent independently of any other food that the user may eat.
In case I 2 , the dish per se does not violate the diet constraints, but its association with the other user’s meals is inconsistent with the diet. Thus, in the future, e.g., next week, it could become possible to pick this meal if it will be associated with other foods. This case is identified by determining that the meal is consistent with the “original” STP (thus, it is not in case I 1 ), but it is inconsistent when considering the constraints related to the other foods actually eaten so far.
In the cases C 1 , C 2 and C 3 , the meal is consistent with the diet also considering the other eaten foods. The three cases differ in the degree of the adherence to the diet. To discriminate between the three cases, we compare the energy supplied by the meal with the allowed range represented in the related STP constraint. We assume that the mean value is the “ideal” value according to the diet goals, and we classify the meal according to the distance from the ideal value as not balanced ( C 1 ), well-balanced ( C 2 ) or perfectly balanced ( C 3 ) (see Figure 3). The thresholds are user-adjustable and relative to the mean. Moreover, we differentiate between excess and lack of energy supply. If a meal is in excess with regard to the ideal value, we add a + symbol to the category (e.g., C 2 + ) to denote the deviation, while, if a meal is lacking, we add a symbol to the category (e.g., C 1 ). This information is useful in the generation of the messages.
Notice that, since the range of values admitted by an STP constraint varies dynamically over the week as an effect of the constraint propagation, also the actual values of the thresholds are not fixed beforehand, but they change over the week as a consequence of the past adherence to the diet.

3.3.2. Document/Sentence Planning and Realization

In the current stage of the project, MADiMan follows a fixed rhetorical structure to generate messages, and the document plan follows a very simple fixed schema. The final message will be composed by an overall evaluation of the dish and by the evaluations of the macronutrients. For the sake of clarity, we now describe the messages by assuming a single macronutrient, and in Section 3.3.3, we illustrate the aggregation of the messages generated for the different macronutrients.
The overall evaluation is generated as a single declarative sentence. To give a bit of variety to the syntactic shapes of the messages, we decided to use a negative copula for I 1 , a declarative form for I 2 , and a positive copula for C 1 or C 2 and C 3 . In particular, the overall evaluation is:
  • not good (in Italian, non buono) or not OK (non va bene) when there is at least one macronutrient classified as I 1 or I 2 , respectively.
  • good (buono) or very good (molto buono) when there is at least one macronutrient classified as C 1 or C 2 , respectively.
  • great choice (ottima scelta) when all macronutrients are classified as C 3 (see Table 1).
The sentence generated for expressing the appropriateness of the specific macronutrient follows a fixed schema as well. It is a positive copula sentence with a predicate expressing the deviation rich/poor/perfect (ricco/povero/perfetto) and a preposition specifying the macronutrient, e.g., in lipids (in lipidi). Moreover, an adverb, e.g., lightly (leggermente), distinguishes the C 1 and C 2 cases (see Table 1). We discussed these sentences with a professional dietitian who approved their appropriateness for the diet domain. Notice that neither the overall sentence, nor the specific macronutrient sentences use referring expressions since, at this stage of the project, we do not yet account for this specific feature.
In the design of the messages, a number of persuasive theories cited in Section 2 were considered, but similar to [18], Cialdini’s general theory of persuasion mainly inspired the design of the messages [25]. According to the six Cialdini persuasion patterns [25], all the messages in Table 1 belong to the patterns of authority and consistency. With respect to the low-level linguistic strategies, by following [27], we used a number of adverbs, e.g., really, very, lightly (davvero, molto, leggermente) to enhance or mitigate a message. Moreover, according to Guerini et al.’s persuasive strategies taxonomy [28], all the messages belong to the category action-inducement and goal-balance and positive-consequence. This strategy induces an action (i.e., choosing a meal), by using the user’s goal (i.e., a healthy diet) and the benefits deriving from such a goal.
The eventual realization of the sentences exploits the SimpleNLG-IT engine realizer, a porting of SimpleNLG for the Italian language [38,39]. Thus, we first encoded the messages previously described in the form of quasi-trees, and then, after aggregation (Section 3.3.3) and word-lexicalization (Section 3.3.4), they are realized by using SimpleNLG-IT.
In contrast to the standard linguistic notion of a tree, a SimpleNLG quasi-tree is an unordered tree enriched with different types of arcs and different types of features on nodes. Quasi-trees are based on notions from both the dependency and constituency theories of syntax. Indeed, a quasi-tree contains both typed arcs encoding the syntactic role of two words and non-terminal nodes encoding grouping relations. The typical dependency relations connect two words by specifying the role played (e.g., subject, object) by the dominated word in the linguistic construction (e.g., a declarative sentence) conveyed by the dominating word (e.g., the verb). The typical non-terminal nodes encoding grouping relations are NP for noun phrase, VP for verbal phrase, PP for prepositional phrase and ADJP for adjectival phrase (see Figure 4).
Table 1 reports the messages obtained by the realization of the prototypical quasi-trees corresponding to the categories resulting from the data interpretation of the reasoner output. In Figure 4, we explicitly depict two examples of quasi-trees expressed in the SimpleNLG input format (top of the figure) and the sentences generated after their realization (bottom, in italics). With respect to Table 1, these two quasi-trees correspond to the category I 1 + , resulting from the STP reasoning over the lipids macronutrient. The sentence corresponding to the quasi-tree in Figure 4a expresses the overall evaluation on the selected menu; the sentence corresponding to the quasi-tree in Figure 4b expresses the specific appropriateness of the macronutrient.
Note that the leaves of the quasi-trees (in red colour in Figure 4) are not words of the selected language. In contrast, a leaf of the quasi-trees encodes a synset, that is a set of words sharing (at least one) lexical meaning (cf. WordNet [40]). In contrast to WordNet, but similar to BabelNet [41], the quasi-tree leaves encode multilingual synsets. For instance, the synset # d i s h is encoding both (1) the set of Italian words { m e n u ,   p i a t t o ,   p o r t a t a } and (2) the set of English words { m e n u ,   m e a l } . We exploited the synset feature for both multilingual generation and lexical variation (see Section 3.3.4).
It is worth noting that one could generate the sentences of Table 1 by using canned texts or other template-based approaches. However, there are several advantages in using a linguistic realizer with respect to a string template-based realizer in this specific project. The three major advantages of using SimpleNLG are that: (i) the design and implementation of the aggregation strategies are easy to implement; (ii) we have a multilingual Italian/English version of the realizer, which, by exploiting the multilingual synset encoding of the leaves in the quasi-trees, allows changing the language by simply switching from Italian to English lexicon-grammar (notice also that the system is easily portable to the other languages supported by SimpleNLG); (iii) SimpleNLG is implemented in Java, and the diffusion of this language allows integrating the generator into larger Java-based software projects. In particular, the first point is the prominent added value of a linguistically-sound NLG system. From a software engineering point of view, the linguistic soundness of the data structures allows for a simple implementation of the linguistic manipulations of these structures [42].
In the next sections, we describe the procedures of aggregation and lexicalization implemented by using the facilities provided by SimpleNLG.

3.3.3. Aggregation Strategies

Aggregation plays an important role in generating fluent and efficient texts [43,44]. Moreover, in many domains, as healthcare or education, it has been shown that aggregation of the sentences improves the efficacy of the messages [45,46]. In the case of the MADiMan messages, aggregation can be performed in several different ways because the messages regarding the overall evaluation and the macronutrients often have very similar quasi-trees.
In order to give a detailed description of the generator, we give here a formal definition of some notions involved in the process. We write ( O C , O L , O P ) to indicate the symbolic output for carbohydrates, lipids and proteins, respectively, where O X { I 1 , I 1 + , I 2 , I 2 + , C 1 , C 1 + , C 2 , C 2 + , C 3 } . Indeed, a possible trivial aggregation strategy based on aggregation at the sentence level could consist of merging only the messages that belong to the same category, i.e., such that O X = O Y : this trivial strategy corresponds to the syntactic aggregation in the classification of [47]. However, we design an aggregation strategy that accounts for a more sophisticated form of conceptual aggregation. The aggregation algorithm can be split into two steps, a selection step and a merging step.

Selection

To focus on the most important information for the diet, the general aim of the selection is to emphasize the messages concerning incompatibility. Thus, during the selection step, if there is at least a message signalling an inconsistent value of a macronutrient, all the messages signalling a consistency are removed. Therefore, in the selection step, there are three alternative cases:
  • There is at least a permanent inconsistency on a macronutrient:
    X { C , L , P } ( O X = I 1 ) .
  • There is at least a provisional inconsistency on a macronutrient:
    X { C , L , P } ( O X I 1 ) X { C , L , P } ( O X = I 2 ) .
  • All the macronutrients are consistent:
    X { C , L , P } ( i { 1 , 2 , 3 } ( O X = C i ) ) .
In Cases A and B, we aggregate the messages by considering only the information about inconsistency and merging the messages about the inconsistent macronutrients of the proposed meal. The final document will have one single overall sentence describing the inconsistency and one merged sentence concerning the inconsistent macronutrients. In Case C, the final document will have one single overall sentence describing the minimal consistent value and one merged sentence concerning all three macronutrients.

Merging

In order to pursue the persuasive goals of the system, we implemented and tested two different strategies for merging the specific messages concerning the macronutrients. Among the possible mechanisms available to merge two sentences, i.e., simple conjunction, conjunction via shared participants, conjunction via shared structure and syntactic embedding [43], our system supports all of them but syntactic embedding. We experimentally compare (see Section 4) the conjunction via shared structure on the VP constituent (VP-aggregation) and on the NP contained in the prepositional phrase (set-aggregation). For example, taking into account the sentences (i) “The menu is poor in proteins” (Il menù è povero in proteine (see Figure 5a)) and (ii) “The menu is poor in carbohydrates” (Il menù è povero in carboidrati (see Figure 5b)), the VP-aggregation generates the sentence “The menu is poor in proteins and is poor in carbohydrates” (Il menù è povero in proteine ed è povero in carboidrati (see Figure 6)), while the set-aggregation generates “The menu is poor in proteins and in carbohydrates” (Il menù è povero in proteine e carboidrati (see Figure 7)).
We decided to use VP-aggregation and set-aggregation mechanisms since they have two specific features that could influence the persuasiveness of the final message. The VP-aggregation, by repeating the semantic predicate contained in the copula construction, could communicate in a more efficient way the (in)compatibility of a specific macronutrient. In contrast, the set-aggregation produces shorter messages that could be perceived as more natural and thus more trustworthy. Note that VP-aggregation can be always applied independently of the compatibility values and the deviations expressed by the specific macronutrient messages. In contrast, set-aggregation can only be applied when the sentences have exactly the same syntactic shape, i.e., when there are the same values for consistency and deviation.
In Section 4 we evaluate the appeal of messages built with two different aggregation strategies where the first one (all-VP) always uses VP-aggregation and the second one (set+VP) maximally uses set-aggregation in combination, in the same cases, with VP-aggregation. In particular, to manage all the possible combinations of compatibility and deviations, for the set+VP strategy, we follow this simple two-step algorithm:
  • Set-aggregate all the shape-equivalent sentences,
  • VP-aggregate the sentence resulting from the first step with the remaining sentences (if any).
For example, the sentences “The menu is lightly rich in carbohydrates”, “The menu is rich in lipids” and “The menu is lightly rich in proteins” will be aggregated in the all-VP strategy as “The menu is lightly rich in carbohydrates, is rich in lipids and is lightly rich in proteins”. In contrast, the same sentences will be aggregated in the set+VP strategy as “The menu is lightly rich in carbohydrates and proteins and is rich in lipids”.
Finally, notice that there is some degree of freedom in the ordering of the aggregated sentences in some cases. We followed the idea of starting with the most positive feedback, as suggested by some theories of persuasion [48,49]. Therefore, we decided to order the aggregated messages by considering their compatibility. For example, the sentences “The menu is poor in carbohydrates”, “The menu is lightly rich in lipids” and “The menu is lightly rich in proteins” will be aggregated as “The menu is lightly rich in lipids and proteins and is poor in carbohydrates”.

3.3.4. Choosing Words

Another feature that we implemented in the realization is a very simple treatment of lexical variations. Indeed, many studies showed the importance and the complexity of the lexicalization task, that is the choice of a specific word for a semantic unit representing a concept, e.g., [50,51]. In particular, an acceptable lexicalization procedure should take into account the contextual and stylistic constraints arising from all the possible word combinations [44,52].
We think that variability could play an important role in achieving persuasiveness. Because a monotonous lexical choice could be perceived by users as boring or artificial, for open-class categories (i.e., nouns, verbs, adjectives and adverbs), we implemented two different versions of the lexicalization procedure: the first lexicalization procedure always associates one single word with each concept, and an alternative second lexicalization procedure randomly associates one word chosen from a set of three possible synonyms with each concept.
In particular, for the Italian version of the realizer, the synonym set has been decided in two phases. In the first phase, we searched for words specific for the diet domain in the default Italian lexicon for SimpleNLG-IT, that is a simple lexicon, i.e., a lexicon studied to be perfectly understood by most Italian people [53]. In the second phase, a professional dietitian verified the appropriateness of these words.
We are aware that using randomized choices for word choosing is a trivial lexicalization procedure and could give a sort of cognitive dissonance in some cases since some potentially correct sequences of words are never used by native speakers, but we believe that it could also improve the trustworthiness of the system.
Even if the main focus of the experiments in the paper concerns the linguistic and the persuasive appeal of the messages, in Section 4 we provide also some analysis and considerations about lexicon variability.

4. Experimentation

In this section, we describe two experiments designed and performed involving human users to evaluate the MADiMan system paying specific attention to the NLG module. The main goal of these experiments was to evaluate the usefulness and the persuasive power of the generated natural language messages to communicate the output of the reasoning to users by considering the possible linguistic shapes of the messages. To this aim, we designed a diet simulation. It is worth noting that, while an evaluation of the real efficacy of the persuasion power of automatically generated messages should follow the scientific standards of medical research [17], as addressed by some researchers in the human-computer interaction field [54,55], also non-medical trials can give important feedback particularly when the design is in the early stages or when new technologies have to be evaluated.
To create a realistic experimentation, we designed and realized a mobile app called CheckYourMeal! (Figure 8). CheckYourMeal! is not available yet as a commercial app since it is still under development and used for research purposes only. CheckYourMeal! provides many standard functionalities of the quantified self domain app, such as registration of username/password, login and insertion of personal and anthropometric data. Note that the underlying user model is based on anthropometric data, which are gender, age, weight and physical activity level. Indeed, these data are necessary to compute the energetic requirement (by using the Schofield formula; cf. [12]) that is used to compute the DRVs (cf. Section 3.2). Other data, such as food allergies, intolerance and preferences, are collected, but not actually used in the current version of the app.
The main goal of the CheckYourMeal! app is to help users in managing their diets. The week is scheduled as 21 slots to fill, with three meals per day from Monday to Sunday. For each slot of the week, the user is presented with a range of possible menus, and she/he decides which menu to eat. Then, she/he is provided with feedback about the compatibility of a specific menu both in graphical and textual forms. In Figure 8, we show a screenshot of such feedback. The graphical feedback is provided by (i) a pie chart showing the energetic contents in the three macronutrients and (ii) three histograms showing their ideal values for that specific slot of the week. The textual feedback is provided by two sentences automatically generated containing the overall evaluation and the macronutrients’ evaluation, respectively. The CheckYourMeal! interface, as well as the NLG module, can use both Italian and English languages, but we used only Italian for all the experiments described in this paper.
We asked the users to interact with CheckYourMeal! by considering a simulation context. The users should imagine eating for a period of time in a restaurant, and for each meal, they have to choose what to eat among the menus proposed by the app. Moreover, we asked the users to engage with the CheckYourMeal! app for at least 15 minutes of their real time, choosing the menus of two weeks of simulated time. In other words, the users had to choose each day their breakfast, lunch and supper for a total of 42 choices.
In the simulation, the menus were randomly generated by considering the recipes of the Gedeone database, which is a collection of recipes annotated with their nutritional contents [13]. The Gedeone database is a relational database (realized with PostgreSQL) containing the recipes originally stored in the Gedeone website (http://www.gedeone-e-coop.it), and it consists of 500 traditional Mediterranean recipes. We decided to use this specific recipe book for a number of reasons: (1) it is in electronic form suitable to a structured representation; (2) it contains the ingredients and also the composition in terms of macro-/micro-nutrients; (3) recipes are described in terms of simple atomic preparation steps; (4) it contains a number of interesting metadata such as difficulty, required time and cooking methods.
For instance, Gedeone contains the following metadata for four servings of carbonara spaghetti:
  • ingredients: 320 grams of spaghetti, 100 grams of bacon, 1 egg, 4 tablespoons of Parmesan cheese, 1 tablespoon of extra virgin olive oil, 4 teaspoons of salt;
  • macronutrients: 17.9 grams of proteins, 26.6 grams of lipids, 66.6 grams of carbohydrates;
  • cooking methods: frying, cooking in boiling water.
Notice that the recipe analysis and database population were done offline with respect to the experimentation.
We built a complete menu by considering as a template the composition of a traditional Italian meal (lunch and supper). This is a simpler form of the concept of menu pattern used in [56], where the generation of random menus was modelled by using common sense about the contextual constraints concerning the various kind of foods and their use. The menu template we used in the experiments is composed by a first course (primo, e.g., soup, pasta, pizza), a second course (secondo, e.g., meat, eggs, fish, cheese), a side dish (contorno, e.g., vegetables), a dessert, fruit and bread. We also added a typical Italian breakfast (e.g., coffee, tea, bread, jam, butter, milk, biscuits) to the Gedeone database. Note that during experiments, users were not required to have all courses in a meal.
In a preliminary phase, we conducted a small pilot study with three participants to guarantee that the tasks of the experimentation were understandable and that they could be performed in a reasonable amount of time. The results of this pilot study are not further considered in the following.

4.1. Experiment 1

In this section, we report the hypotheses, materials and methods and results regarding the first experiment with CheckYourMeal!. In this experiment, involving people who were not experts in the diet domain, we wanted to have a first quantitative measure about the utility of the system and of the appeal of the produced messages.

4.1.1. Hypotheses

In Experiment 1, we tested two hypotheses. The first hypothesis is related to the usefulness of graphics and natural language messages to communicate the output of the reasoning to users. The second hypothesis is related to the possible linguistic shapes of the messages. In particular, the second hypothesis focuses on the appeal of the messages by varying the aggregation strategies (see Section 3.3.3).
Hypothesis 1. 
Graphics and text messages are both perceived as useful for making the right choice.
Hypothesis 2. 
The set+VP aggregation strategy (violet version) is perceived as better by users with respect the all+VP aggregation strategy (blue version).

4.1.2. Materials and Methods
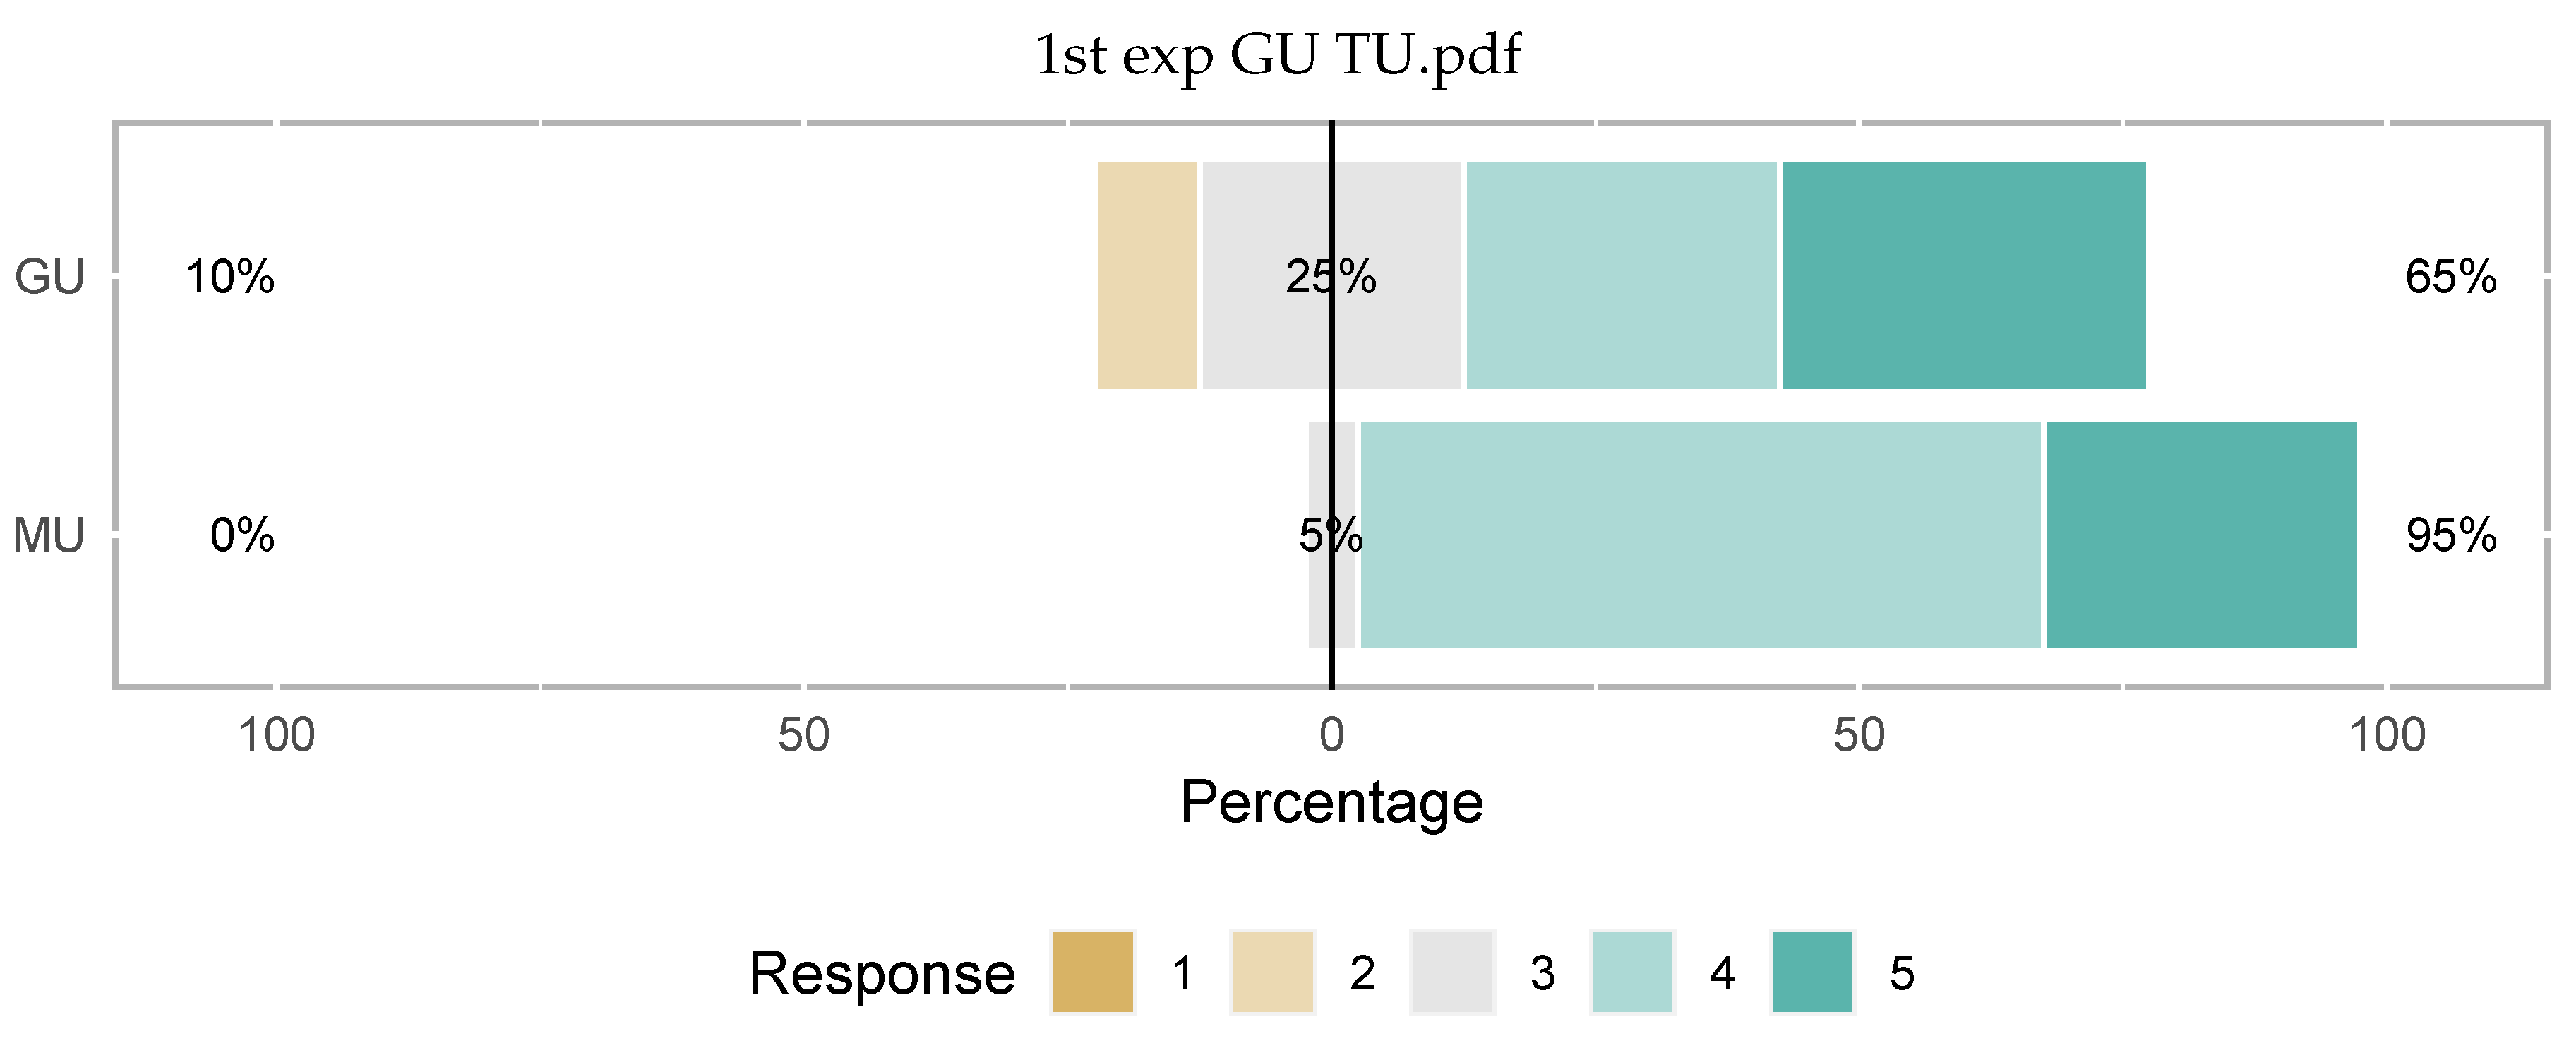
Twenty users participated to Experiment 1, eight females and twelve males. The users were students and researchers in computer science that accepted a personal invitation to participate in the experiment without rewards. Eight users were between 18 and 40 years old and twelve were over 40 years old. All the participants were Italian native speakers, and fifteen of them had no experience with apps regarding diets before this experimentation.
We prepared an instruction sheet with a description of the simulation context and of the main objectives of the experiment. We explained the basic mechanism underlying the reasoner (i.e., diet transgressions and compensation, persuasion). We also explicitly informed the users that we wanted to compare two different versions of the message generator, the blue version and the violet version, giving no other information about the specific qualities that we wanted to test. The blue version consisted of the all-VP aggregation strategy, and the violet version consisted of the set+VP aggregation strategy. We believe that with this briefing of the users could pay more attention to the linguistic aspects of the textual feedback. We also asked the users to try a feature called variable lexicon (see Section 3.3.4). We explicitly informed the users that this feature was not an experimental goal. Users played with the app for one simulated week using the blue version and for another simulated week using the violet version, randomizing the first version with which they started. Finally, users were asked to answer a questionnaire composed of 24 questions: 8 were multiple choices questions regarding personal data; 4 were Likert questions regarding the app in general and the lexicon; 9 were Likert questions regarding the blue and violet versions of the messages in the app; finally, 3 were open questions regarding suggestions for possible improvements of the app, the perceived feeling and the lexicon. For all Likert questions, we used a Likert scale from 1 (indicated as I totally disagree) to 5 (indicated as I totally agree).
We had two questions in the questionnaire regarding usefulness, which were (translated from the original Italian questions):
GU:
(Graphics’ usefulness) The graphics on macronutrients are useful to make the right choice.
TU:
(Messages’ usefulness) The text messages on macronutrients are useful to make the right choice.
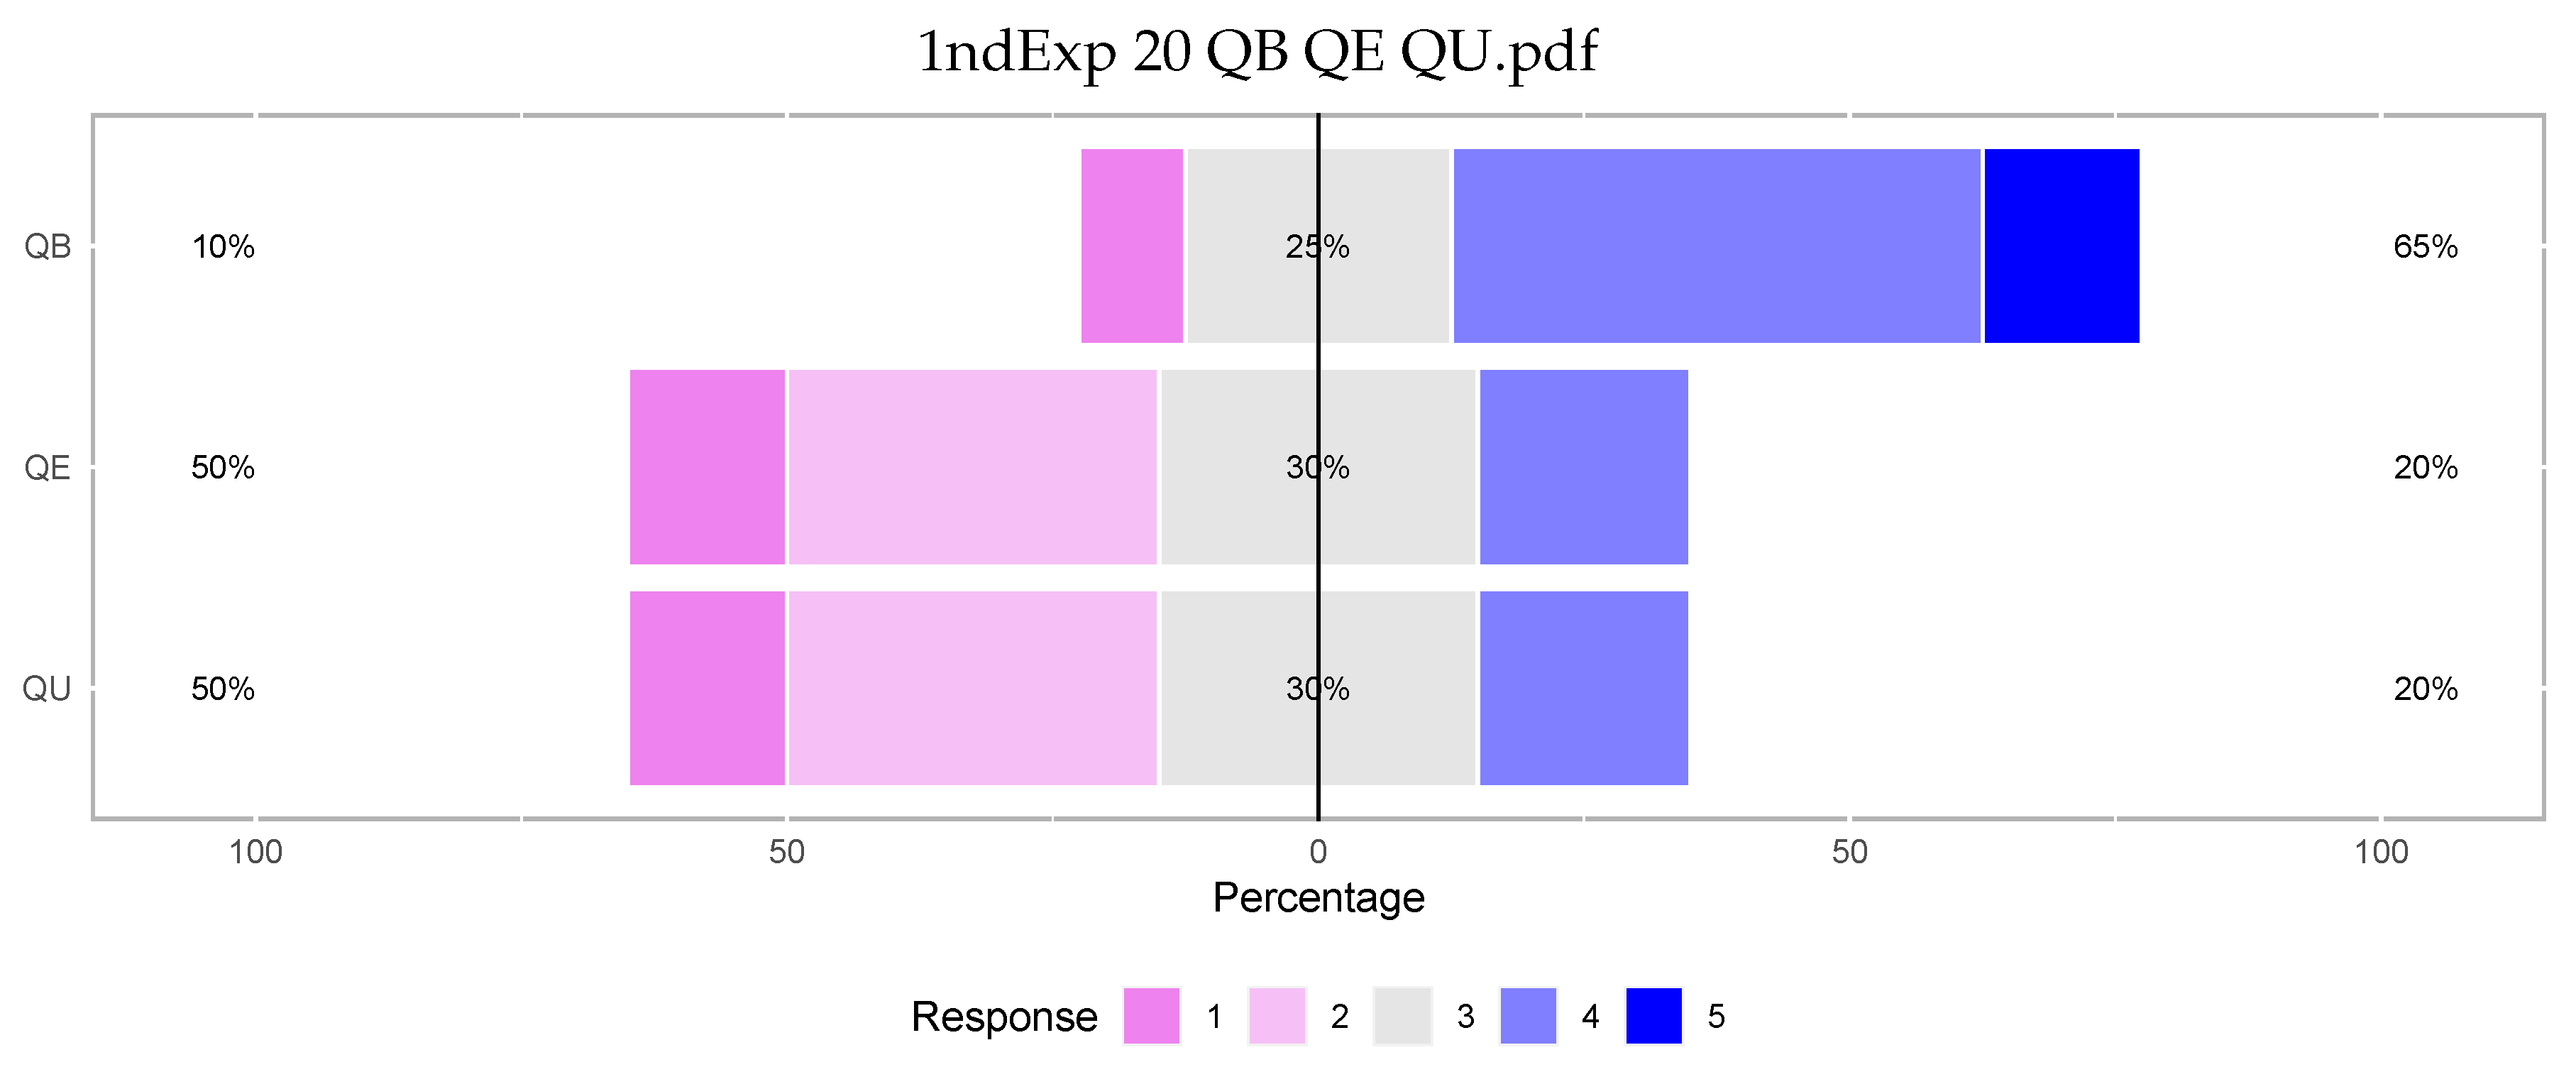
Note that we decided to separately evaluate the usefulness of graphics and text because we think that these factors are not necessarily dependent on each other.
For testing Hypothesis 2, we compared four specific properties of the messages, which were boringness, usefulness, easiness and perceived persuasiveness. The questions were (translated from the original Italian questions):
QB:
Perceived boringness: The text messages in the blue version are more boring than the text messages in the violet version.
QE:
Perceived easiness: The text messages in the blue version are easier to understand than the text messages in the violet version.
QU:
Perceived usefulness: The text messages in the blue version are more useful than the text messages in the violet version in order to make the best choice.
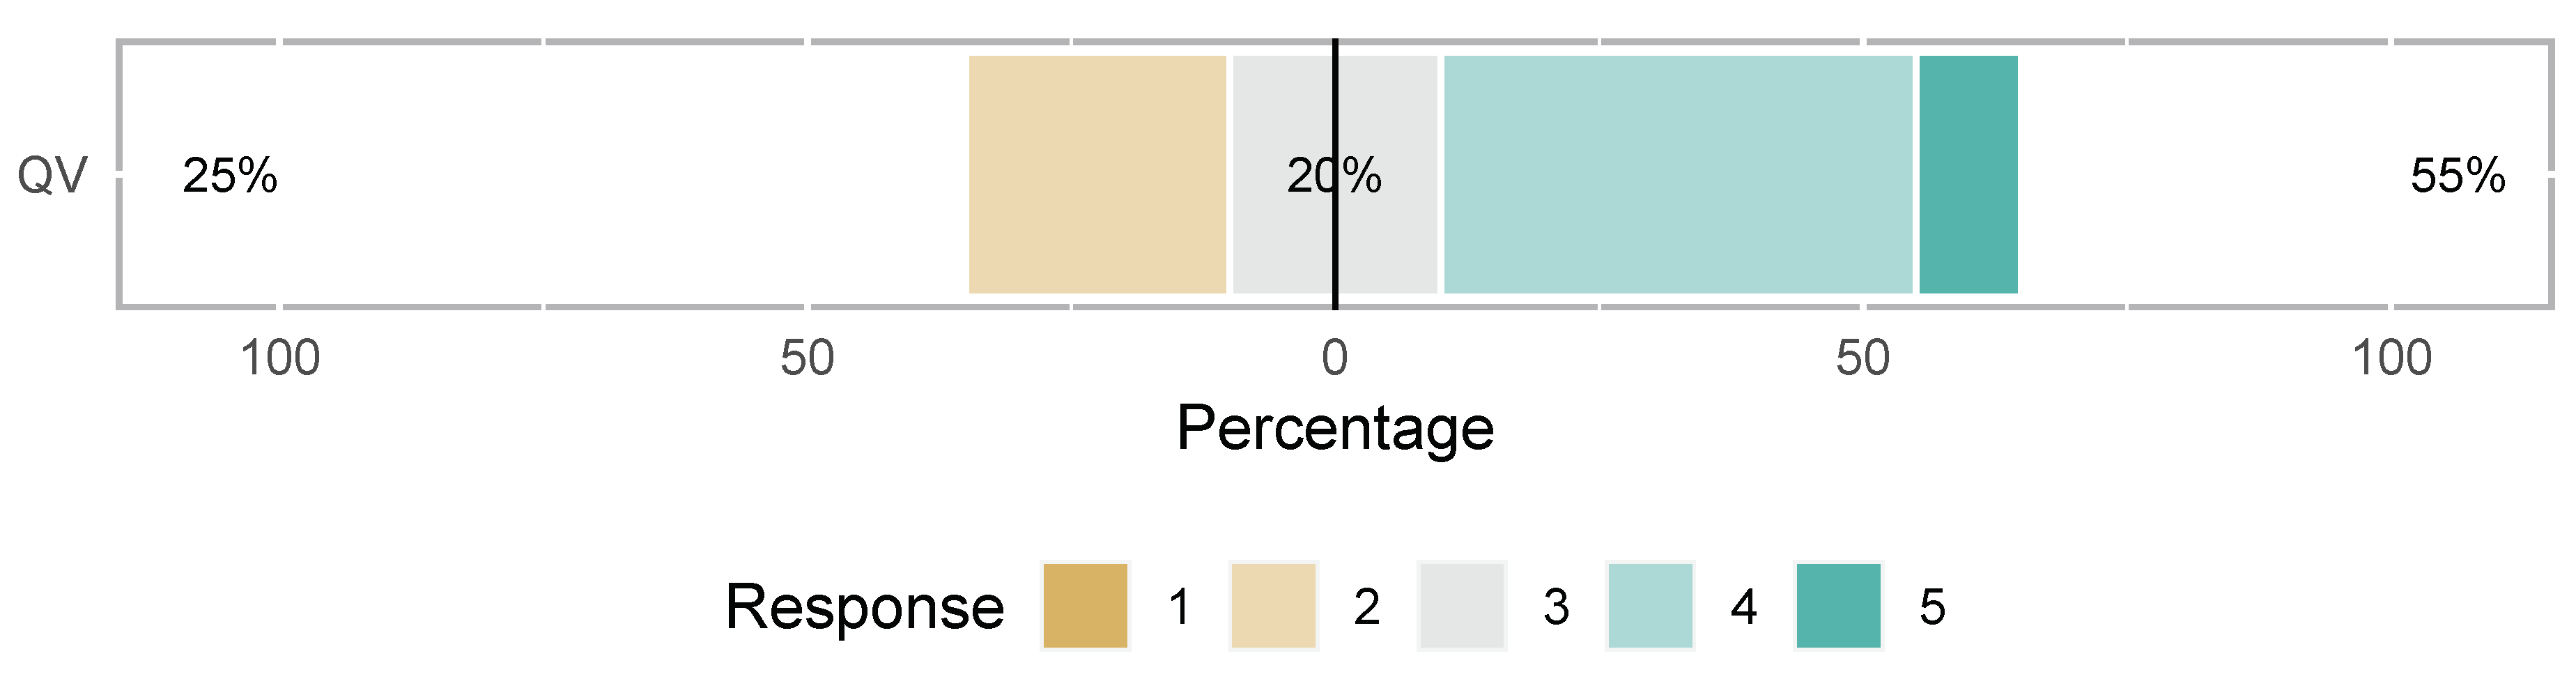
QP:
Perceived persuasiveness: The text messages in the blue version are more persuasive than the text messages in the violet version.

4.1.3. Results

The first hypothesis of Experiment 1 concerned the utility of graphics and text messages as perceived by the users. In Table 2, we report the distribution of the answers for all the Likert questions on the form. In Figure 9, we graphically represent the distribution for questions GU and TU. For GU, the mean (here and in the following, we consider the points in the Likert scale as equidistant) was 3 . 90 and the standard deviation 1 . 02 ; for TU, the mean was 4 . 25 and the standard deviation 0 . 55 . We tested significance by t-tests considering whether the mean answer had a numeric value > 3 for questions GU and TU (thus, indicating that users deemed useful the textual messages and the graphics), and we obtained the two-tailed p-values 4 × 10 4 and 2 × 10 9 for GU and TU, respectively. Thus, we can conclude that most users think that both graphics and messages are useful; moreover, the distribution of the answers suggests that they have a preference for textual messages.
The results concerning Hypothesis 2 are reported in Figure 10, and in Figure 11, we report the distribution of the answers to the four questions, QB, QE, QU and QP. The figures show a quite clear preference for the violet version, which pursues the set+VP aggregation strategy, with respect to the blue version, which pursues the all+VP aggregation strategy.
In other words, for all four properties, which are boringness (mean = 3 . 60 , SD = 1 . 10 ), easiness (mean = 2 . 55 , SD = 1 . 00 ), usefulness (mean = 2 . 55 , SD = 1 . 00 ) and persuasiveness (mean = 2 . 50 , SD = 0 . 89 ), the shorter messages generated by the set+VP aggregation strategy were preferred with respect to the longer messages generated by the all-VP aggregation strategy. Indeed, we tested the statistical significance of the preference for the violet version with respect to the blue one. We tested significance by t-tests considering whether the mean answer had a numeric value <3 (the users leaned toward the violet version) for question QE, QU and QP and >3 (the users leaned toward the blue version) for question QB. We obtained the two-tailed p-values 0 . 01 , 0 . 03 , 0 . 03 and 0 . 01 for QB, QE, QU and QP, respectively; thus, it is possible to state that the users prefer the violet version over the blue version in a statistically significant way as regards the QB, QE, QU and QP questions.

4.2. Experiment 2

In this Section, we report the hypotheses, materials and methods and results regarding the second experiment with CheckYourMeal!. In this experiments, involving people who were experts in the diet domain, we wanted to confirm some hypotheses in a less controlled experiment and to have a quantitative measure about the persuasiveness of the produced messages.

4.2.1. Hypotheses

In Experiment 2, we tested two hypotheses as well. The first hypothesis was again related to the linguistic appeal of the blue/violet versions of the messages. The second hypothesis was related to the measure of the persuasive power of both message versions.
Hypothesis 3. 
The violet version is preferred by users also in a less controlled environment.
Hypothesis 4. 
Both the blue and violet versions of the messages have a measurable persuasive effect on the users.

4.2.2. Materials and Methods

In order to have an evaluation more oriented toward the real usage of the system, we conducted Experiment 2 by changing some experimental parameters. First, in order to have an ecological validation [57] of the system, we conducted Experiment 2 in a noisy and less controlled environment, which is more similar to a real context of use of the app. Second, we increased the number of users by conducting the experiment on 39 users, 24 females and 15 males. Moreover, we chose users that were familiar with the diet domain, i.e., students and teachers of the degree course in dietetics of the University of Turin, Italy. Thirty-seven users were between 18 and 40 years old, and two were over 40 years old. All the participants but two were Italian native speakers (however, all users were fluent in Italian), and 14 of them had no experience with apps regarding diets before this experimentation. The users accepted a personal invitation to participate in the experiment without rewards.
In order to test Hypothesis 3, we modified the questionnaire of Experiment 1 by substituting the Likert scale questions on the blue/violet versions of the app, with three multiple-choice questions ( Q F 1 , Q F 2 and Q F 3 ; cf. Appendix A), presenting to the users three sample messages both in the blue and the violet version, and we asked them which version they preferred. In this way, we could be sure that the users correctly identified the blue and violet versions when answering the form questions despite the noisy non-controlled environment where we conducted the experiment.
Hypothesis 4 is related to the persuasion capability of the CheckYourMeal! app by measuring the rate of suggestions accepted by the users. Indeed, in Experiment 1, QP asked users to express their feelings about the persuasiveness of the violet version with respect to the blue version. In Experiment 2, we wanted to objectively measure the effect of the messages by assessing the effective behaviour of the users. With this aim, we logged the actual actions of the users in the app, i.e., whether they chose to eat a menu after visualizing a message.
We assumed that the persuasive power of the system could be formalized by considering the decisions of the users in choosing the menus. In fact, the users were presented with a list of the possible menus for a specific meal slot (see Figure 8), and then they could decide to visualize the details concerning a specific menu. At this point, the app will present them the messages described above concerning the compatibility of the specific menu with the diet. After reading the messages, the users can decide either to confirm the menu or to discard it and “backtrack” to the menu list to choose another menu.
Thus, to quantify the persuasive power of the system, we recorded two values:
(i)
C h + / M s g + , the fraction of times that the users, after a positive feedback message (e.g., “This menu is a great choice...”), did choose the menu and
(ii)
C h / M s g , the fraction of times that the users, after a negative feedback message (e.g., “This menu is not good ...”), did not choose the menu.
With these values, we measured both the positive persuasive power, by which the users followed the positive recommendation and decided to choose the menu, and the negative persuasive power, by which the users followed the negative recommendation, changed their mind and decided to not choose the menu.

4.2.3. Results

In Table 3, we report the distribution of the preferences of the 39 users with respect to the violet and blue version. We tested significance with Pearson’s chi-squared test (with Yate’s correction for continuity), and we obtained p-values < 0 . 0001 for all Q F s. These data from Experiment 2 confirmed the results of Experiment 1, that is a clear preference of the users for the violet version.
In Table 4, we report, for each version of the app, the value of C h + / M s g + ( 413 / 635 for the blue version and 298 / 497 for the violet version) and the value of C h / M s g ( 191 / 382 for the blue version and 102 / 221 for the violet version). Note that the number of positive messages is almost twice the number of negative messages. This fact means that users often visualize menus that are more compatible with their diets; this could be explained as a consequence of the app interface that sorts the menus in a scrollable list where, at the top, there are the menus most compatible with a user’s diet considering the previous meals and the user’s data and, at the bottom, the menus that are less compatible (cf. Figure 8). We also determined the overall persuasive power as the micro-average between positive and negative persuasive power ( 604 / 1017 for the blue version and 400 / 718 for the violet version).
By assuming that a naive baseline for the persuasive power could be a random guess, that is 50 % for the C h + / M s g + and C h / M s g values, we tested the statistical significance of the results in Table 4 by applying the standard Pearson chi-squared test. We obtained significance at p 0 . 001 for the positive persuasive power both for the blue and violet versions. In contrast, for the negative persuasive power, we did not obtain significance, neither for the blue nor the violet version. Moreover, by considering the average value of the persuasive powers, we obtained significance at p 0 . 001 for the blue version and at p 0 . 005 for the violet version. We can conclude that there is a statistically significant effect in encouraging a good choice with respect to discouraging a bad choice.

4.3. Discussion

The experimentation had three major themes, which were (i) the utility of the graphics and of the textual messages, (ii) the linguistic appeal of the text message as a function of the aggregation strategy and, finally, (iii) the persuasive power of the textual messages.
The results on Hypothesis 1 showed that users consider both graphics and texts useful for managing their diets. The users’ agreement values reported in Table 2 and Figure 9 for GU (graphics utility) and TU (textual utility) statistically confirm that the users appreciate both graphics and text. Moreover, they clearly show users’ preferences toward text messages. Both these results confirm that multimedia application has great power in human-machine communication, and once again, we mention the key role of natural language in human comprehension. Therefore, in real applications, graphics and texts can be used simultaneously or independently for communicating specific information on diet.
The results on Hypotheses 2 and 3 showed that the shorter (violet) version of the messages was preferred with respect to the longer (blue) version. The users’ numeric preferences for the shorter version, as reported in Table 2 and Figure 10 for boringness, usefulness and easiness, have practical and theoretical importance. Indeed, on the one hand, these results give hints for developing better natural language interfaces, and, on the other hand, they confirm the previous experiments in the domains of healthcare [45] and education [46]. The bias for the violet version was confirmed in Experiment 2 with a different group of users and with a different way of measuring the preference (Table 3).
With the aim to have a deeper view of the linguistic appeal of the messages in Experiment 1, we decided to analyse as a post-hoc hypothesis the results of the Likert scale question concerning lexicon variability. Indeed, we asked users to answer a supplementary question that was not the core argument of the experimentation regarding the words in the messages, that is: the “variable lexicon” option makes the use of the app more enjoyable. (QV, 1 = I totally disagree and 5 = I totally agree.). In Figure 12, we report the distribution of the answers for QV (mean = 3 . 40 , SD = 1 . 0 ). Despite the distribution of the answers seeming to indicate a preference for random lexical variations (the p-value for >3 is 0 . 04 ), a specific experimentation is necessary to validate this result.
With respect to the theme of the persuasive power, we conducted the two experiments with two distinct goals and with two distinct measures, respectively. In the first experiment, we were interested in the influence of the aggregation strategy on the persuasive power and asked users to give their subjective score on persuasive power. We note that the results in Table 4 and Figure 11 show that the aggregation strategy plays a role in the persuasive power. Indeed, we can state that both the violet and blue versions of the app have a measurable persuasive effect, but, in contrast to the human judgement expressed in the questionnaire, the blue version seems to have a greater objective persuasive power with respect to the violet version when computed with users’ behaviour ( 59 % vs. 56 % ). Moreover, a point emerging from the results of the second experiment is the difference between the positive and the negative persuasive power (Table 4). A possible explanation of this point can be found in the free comments section of the questionnaire: some comments pointed out that the repetition of the predicate, typical of the all-VP aggregation strategy used by the blue version, gives a judgemental or blaming attitude to the virtual dietitian. Therefore, an intriguing speculation is that the two aggregation strategies have an appeal depending on the polarity of the messages. This speculation is in agreement with the claim that “changing a previous attitude is harder than originating or reinforcing an attitude” [29], and should be investigated in future research.

5. Conclusions and Future Work

In this paper, we described the main features of a data-to-text generator in the diet management domain. We described the main components of MADiMan and detailed the design and the implementation of the NLG module. To the best of our knowledge, the MADiMan system presents many aspects of novelty with respect to commercial diet apps both in the reasoning module and in the NLG module. In the reasoning module, the numerical representation with STPs of diet and food allows for flexibility in the diet management. In the NLG module, the use of a linguistically-sound NLG architecture consisting of the document planner, sentence planner and realizer modules allows for a simple customization of the messages. Indeed, we exploited such a property by designing and implementing two distinct aggregation strategies that drive the compactness of the messages. Finally, we described the details of a human-based simulation for the evaluation of the NLG module by using the CheckYourMeal! app. We conducted two experiments with two distinct groups of people.
Experiment 1 involved 20 users (students and researchers in computer science). After a simulated use of the system, the users answered a questionnaire containing questions on the usefulness of the graphics and text messages and on the boringness, usefulness, easiness and persuasiveness of the app comparing the two aggregation strategies. By analysing the results, the users showed their preferences for both textual and graphical presentation of information regarding the diet. Moreover, by considering the perceived properties, the experimental results showed that users prefer more compact messages obtained with a complex aggregation strategy with respect to longer messages.
In Experiment 2, which involved 39 users (professional dietitians and students of dietetics), the experimental results obtained with questionnaires confirmed the appeal of more compact messages. Moreover, in order to quantify the persuasive power of the system, we collected logged data of users’ behaviour for measuring the users’ acceptance rate of the generated textual messages. The results suggested that in diet management: (1) the longer messages had a little more persuasive power than the shorter messages, and (2) both versions of the messages were more persuasive in encouraging a positive behaviour with respect to discouraging a negative behaviour.
In future work, we intend to replicate the experimentation on a larger number of users. In particular, we intend to evaluate the system with respect to the feature of the variability of the lexicon, which in this work has been only superficially investigated. Another point that we intend to test in future versions of the system regards the possibility to have some form of syntactic variation, as the use active/passive form in verbs. Indeed, in contrast to lexical variation, this kind of sentence variation is related to the topic/focus and the rhetorical structures of the message and so should primarily be considered in the document planning phase.
A possible idea for future work for improving the persuasion power is to exploit NLG by enriching messages with sentences describing the consequences of a bad choice. Indeed, the reasoning system of MADiMan can quantify the restrictions in future meals that allow users to still achieve their dietary goals despite a violation [12]. Therefore, the NLG module could generate simple messages describing these restrictions, e.g., “... but tomorrow you cannot eat the cake”.
Another research question that we intend to address regards the explainability of the answers. Indeed, we can exploit the major comprehensibility of natural language with respect to infographics (cf. [2]) for explaining the evolution of the diet constraints during the week. For tackling such an issue, we intend to exploit different sources of information. First, we intend to use the information regarding the past meals that the users have eaten during the week. Second, we want to use external information from domain ontologies on food. Indeed, the information on the food domain (e.g., [58]) could be used to discover and communicate connections among meals. Third, we want to augment the reasoning and generation system with the concept of the Mediterranean diet [14,59], which relies on more qualitative constraints that must be combined with the quantitative constraints on the macronutrients. Finally, we want to enrich the explanation with a suggestion on the best dishes to eat in the future meals.
In the actual version of MADiMan, we assume a prior formalization of recipes in terms of quantitative measures of ingredients. We believe that this assumption is consistent with the recent trend of many big restaurant chains that allow customers to download the precise nutritional values of their dishes with the aim of improving their customer retention. Moreover, as a future work, MADiMan could be coupled with a specific computer vision module determining ingredients and nutritional information starting from a picture of a dish taken with a smartphone (see, e.g., [60]).
Finally, in future versions of the system, we intend to investigate the possibility to account for constraints arising from allergies and similar medical situations. In a recent work [14], we proposed to exploit an ontological modelling of ingredients and recipes that can play an important role in the extension of MADiMan for allergies. For instance, if a user is allergic to legumes, the system can exclude “pasta with beans” by recovering the information that (1) “pasta with beans” contains beans and (2) beans are legumes.

Author Contributions

Conceptualization, L.A. and A.M.; methodology, L.A. and A.M.; software, L.A. and A.M.; validation, L.A. and A.M.; formal analysis, L.A. and A.M.; investigation, L.A. and A.M.; resources, L.A. and A.M.; data curation, L.A. and A.M.; writing–original draft preparation, L.A. and A.M.; writing–review and editing, L.A. and A.M.; visualization, L.A. and A.M.; supervision, L.A. and A.M.; project administration, L.A. and A.M.; funding acquisition, L.A. and A.M. All authors have read and agreed to the published version of the manuscript.

Funding

This research was partially funded by Regione Piemonte, Innovation Hub for ICT, 2011-2014, POR-FESR 07-13.

Acknowledgments

The authors would like to thank Franco De Michieli, Andrea Pirone, Simone Donetti and the students and faculty of the degree in Dietetics of the University of Torino for their valuable help.

Conflicts of Interest

The authors declare no conflict of interest.

Appendix A

In this section, in Table A1, we report the questions Q F 1 , Q F 2 and Q F 3 . Users were asked what version they preferred between the blue and violet version for each message.
Table A1. The messages used in Experiment 2.
QuestionCategoryVersionMessage (in Italian)English Translation
Q F 1 C 3 BlueQuesto menù è un’ottima
scelta. Il menù è perfetto in
carboidrati, è perfetto in lipidi
ed è perfetto in proteine.
This menu is a great choice.
The menu is perfect in
carbohydrates, perfect in
lipids and perfect in proteins.
Q F 1 C 3 VioletQuesto menù è un’ottima scelta.
Il menù è perfetto in carboidrati,
lipidi e proteine.
This menu is a great choice.
The menu is perfect in
carbohydrates, lipids and proteins.
Q F 2 C 2 BlueQuesto menù è buono. Il menù
è perfetto in proteine ed è povero
in carboidrati e lipidi.
This menu is good. The menu is
perfect in proteins and is low in
carbohydrates and lipids.
Q F 2 C 2 VioletQuesto menù è buono. Il menù
è perfetto in proteine, è povero
in carboidrati ed è povero in lipidi.
This menu is good. The menu is
perfect in proteins, low in
carbohydrates and low in lipids.
Q F 3 I 2 BlueQuesto menù non va bene. Il menù
è povero in carboidrati, è povero in
lipidi ed è povero in proteine.
This menu is not good. The menu
is low in carbohydrates, low in
lipids and low in protein.
Q F 3 I 2 VioletQuesto menù non va bene. Il menù
è povero in carboidrati, lipidi e proteine.
This menu is not good. The menu
is poor in carbohydrates, lipids
and proteins.

References

  1. Heer, J.; Bostock, M.; Ogievetsky, V. A tour through the visualization zoo. Commun. ACM 2010, 53, 59–67. [Google Scholar] [CrossRef]
  2. DeSanctis, G. Computer Graphics as Decision Aids: Directions for Research. Decis. Sci. 1984, 15, 463–487. [Google Scholar] [CrossRef]
  3. van der Meulen, M.; Logie, R.H.; Freer, Y.; Sykes, C.; McIntosh, N.; Hunter, J. When a graph is poorer than 100 words: A comparison of computerised natural language generation, human generated descriptions and graphical displays in neonatal intensive care. Appl. Cogn. Psychol. 2010, 24, 77–89. [Google Scholar] [CrossRef]
  4. Hunter, J.; Freer, Y.; Gatt, A.; Reiter, E.; Sripada, S.; Sykes, C. Automatic generation of natural language nursing shift summaries in neonatal intensive care: BT-Nurse. Artif. Intell. Med. 2012, 56, 157–172. [Google Scholar] [CrossRef] [Green Version]
  5. Goldstein, A.; Shahar, Y.; Orenbuch, E.; Cohen, M.J. Evaluation of an automated knowledge-based textual summarization system for longitudinal clinical data, in the intensive care domain. Artif. Intell. Med. 2017, 82, 20–33. [Google Scholar] [CrossRef]
  6. Gkatzia, D.; Lemon, O.; Rieser, V. Data-to-Text Generation Improves Decision-Making Under Uncertainty. IEEE Comput. Int. Mag. 2017, 12, 10–17. [Google Scholar] [CrossRef]
  7. Fogg, B. Persuasive Technology. Using Computers to Change What We Think and Do; Morgan Kaufmann Publishers, Elsevier: Burlington, MA, USA, 2002. [Google Scholar]
  8. Abdel-Hamid, T.; Ankel, F.; Battle-Fisher, M.; Gibson, B.; Gonzalez-Parra, G.; Jalali, M.; Kaipainen, K.; Kalupahana, N.; Karanfil, O.; Marathe, A.; et al. Public and health professionals’ misconceptions about the dynamics of body weight gain/loss. Syst. Dyn. Rev. 2014, 30, 58–74. [Google Scholar] [CrossRef] [PubMed] [Green Version]
  9. Orji, R.; Moffatt, K. Persuasive technology for health and wellness: State-of-the-art and emerging trends. Health Inform. J. 2018, 24, 66–91. [Google Scholar] [CrossRef]
  10. Anselma, L.; Mazzei, A. Towards Diet Management with Automatic Reasoning and Persuasive Natural Language Generation. In Progress in Artificial Intelligence, Proceedings of the 17th Portuguese Conference on Artificial Intelligence (EPIA 2015), Coimbra, Portugal, 8–11 September 2015; Springer: Berlin, Germany, 2015; pp. 79–90. [Google Scholar]
  11. Mazzei, A.; Anselma, L.; De Michieli, F.; Bolioli, A.; Casu, M.; Gerbrandy, J.; Lunardi, I. Mobile computing and artificial intelligence for diet management. Lect. Notes Comput. Sci. 2015, 9281, 342–349. [Google Scholar]
  12. Anselma, L.; Mazzei, A.; De Michieli, F. An artificial intelligence framework for compensating transgressions and its application to diet management. J. Biomed. Inform. 2017, 68, 58–70. [Google Scholar] [CrossRef]
  13. Anselma, L.; Mazzei, A.; Pirone, A. Automatic Reasoning Evaluation in Diet Management Based on an Italian Cookbook. In Proceedings of the Joint Workshop on Multimedia for Cooking and Eating Activities and Multimedia Assisted Dietary Management (CEA/MADiMa’18), Stockholm, Sweden, July 2018; ACM: New York, NY, USA, 2018; pp. 59–62. [Google Scholar] [CrossRef]
  14. Anselma, L.; Lascio, M.D.; Lieto, A.; Mazzei, A. Adopting the Mediterranean Diet Score in a Diet Management System. In Proceedings of the 13th International Joint Conference on Biomedical Engineering Systems and Technologies (BIOSTEC 2020)—Volume 5: HEALTHINF, Valletta, Malta, 24–26 February 2020; Cabitza, F., Fred, A.L.N., Gamboa, H., Eds.; SCITEPRESS: Setúbal, Portugal, 2020; pp. 670–676. [Google Scholar]
  15. Anselma, L.; Mazzei, A. An Approach for Explaining Reasoning on the Diet Domain. In Proceedings of the 1st Workshop on Natural Language for Artificial Intelligence Co-Located with AI*IA 2017, Bari, Italy, 16–17 November 2017; Basile, P., Croce, D., Guerini, M., Eds.; CEUR-WS.org: Aachen, Germany, 2017; Volume 1983, pp. 4–17. [Google Scholar]
  16. Anselma, L.; Mazzei, A. Designing and testing the messages produced by a virtual dietitian. In Proceedings of the 11th International Conference on Natural Language Generation, Tilburg, The Netherlands, 5–8 November 2018; Krahmer, E., Gatt, A., Goudbeek, M., Eds.; Association for Computational Linguistics: Stroudsburg, PA, USA, 2018; pp. 244–253. [Google Scholar]
  17. Reiter, E.; Robertson, R.; Osman, L. Lessons from a Failure: Generating Tailored Smoking Cessation Letters. Artif. Intell. 2003, 144, 41–58. [Google Scholar] [CrossRef] [Green Version]
  18. Kaptein, M.; de Ruyter, B.E.R.; Markopoulos, P.; Aarts, E.H.L. Adaptive Persuasive Systems: A Study of Tailored Persuasive Text Messages to Reduce Snacking. TiiS 2012, 2, 10. [Google Scholar] [CrossRef]
  19. Braun, D.; Reiter, E.; Siddharthan, A. Creating Textual Driver Feedback from Telemetric Data. In Proceedings of the 15th European Workshop on Natural Language Generation (ENLG 2015), Brighton, UK, 10–11 September 2015; pp. 156–165. [Google Scholar]
  20. Braun, D.; Reiter, E.; Siddharthan, A. SaferDrive: An NLG-based behaviour change support system for drivers. Nat. Lang. Eng. 2018, 24, 551–588. [Google Scholar] [CrossRef] [Green Version]
  21. Conde-Clemente, P.; Alonso, J.M.; Trivino, G. Toward automatic generation of linguistic advice for saving energy at home. Soft Comput. 2018, 22, 345–359. [Google Scholar] [CrossRef]
  22. Weiner, J.L. BLAH, A System Which Explains its Reasoning. Artif. Intell. 1980, 15, 19–48. [Google Scholar] [CrossRef]
  23. Barzilay, R.; Mccullough, D.; Rambow, O.; Decristofaro, J.; Korelsky, T.; Lavoie, B.; Inc, C. A New Approach to Expert System Explanations. In Proceedings of the 9th International Workshop on Natural Language Generation, Niagara-on-the-Lake, ON, Canada, 5–7 August 1998; pp. 78–87. [Google Scholar]
  24. Lacave, C.; Diez, F.J. A review of explanation methods for heuristic expert systems. Knowl. Eng. Rev. 2004, 19, 133–146. [Google Scholar] [CrossRef]
  25. Cialdini, R.B. Influence: Science and Practice; Pearson Education: London, UK, 2009. [Google Scholar]
  26. Hovy, E.H. Generating Natural Language Under Pragmatic Constraints; Lawrence Erlbaum: Hillsdale, NJ, USA, 1988. [Google Scholar]
  27. de Rosis, F.; Grasso, F. Affective Interactions. In Affective Interactions; Paiva, A., Ed.; Springer: New York, NY, USA, 2000; pp. 204–218. [Google Scholar]
  28. Guerini, M.; Stock, O.; Zancanaro, M. A Taxonomy of Strategies for Multimodal Persuasive Message Generation. Appl. Artif. Intell. 2007, 21, 99–136. [Google Scholar] [CrossRef]
  29. Oinas-Kukkonen, H.; Harjumaa, M. Persuasive systems design: Key issues, process model, and system features. Commun. Assoc. Inf. Syst. 2009, 24, 28. [Google Scholar] [CrossRef]
  30. Reiter, E. An Architecture for Data-to-text Systems. In Proceedings of the 11th European Workshop on Natural Language Generation (ENLG’07), Saarbrücken, Germany, June 2007; Association for Computational Linguistics: Stroudsburg, PA, USA, 2007; pp. 97–104. [Google Scholar]
  31. Pauws, S.; Gatt, A.; Krahmer, E.; Reiter, E. Making effective use of healthcare data using data-to-text technology. In Data Science for Healthcare; Springer: Berlin, Germany, 2019; pp. 119–145. [Google Scholar]
  32. Maimone, R.; Guerini, M.; Dragoni, M.; Bailoni, T.; Eccher, C. PerKApp: A general purpose persuasion architecture for healthy lifestyles. J. Biomed. Inform. 2018, 82, 70–87. [Google Scholar] [CrossRef]
  33. Tintarev, N.; Reiter, E.; Black, R.; Waller, A.; Reddington, J. Personal storytelling: Using Natural Language Generation for children with complex communication needs, in the wild…. Int. J. Hum.-Comput. Stud. 2016, 92–93, 1–16. [Google Scholar] [CrossRef] [Green Version]
  34. Dechter, R.; Meiri, I.; Pearl, J. Temporal Constraint Networks. Artif. Intell. 1991, 49, 61–95. [Google Scholar] [CrossRef]
  35. LARN. LARN—Livelli di Assunzione di Riferimento di Nutrienti ed Energia per la Popolazione Italiana—IV Revisione; SICS Editore: Rome, Italy, 2014. [Google Scholar]
  36. Anselma, L.; Mazzei, A.; Piovesan, L.; De Michieli, F. Adopting STP for diet management. Proceedings of 2014 IEEE International Conference on Healthcare Informatics (ICHI 2014), Verona, Italy, 15–17 September 2014; p. 371. [Google Scholar]
  37. Rohrbach, A.; Hendricks, L.A.; Burns, K.; Darrell, T.; Saenko, K. Object Hallucination in Image Captioning. In Proceedings of the 2018 Conference on Empirical Methods in Natural Language Processing, Brussels, Belgium, October–November 2018; Association for Computational Linguistics: Brussels, Belgium, 2018; pp. 4035–4045. [Google Scholar]
  38. Gatt, A.; Reiter, E. SimpleNLG: A Realisation Engine for Practical Applications. In Proceedings of the 12th European Workshop on Natural Language Generation (ENLG’09), Athens, Greece, March 2009; Association for Computational Linguistics: Stroudsburg, PA, USA, 2009; pp. 90–93. [Google Scholar]
  39. Mazzei, A.; Battaglino, C.; Bosco, C. SimpleNLG-IT: Adapting SimpleNLG to Italian. In Proceedings of the 9th International Natural Language Generation Conference, Edinburgh, UK, 5–8 September 2016; Association for Computational Linguistics: Edinburgh, UK, 2016; pp. 184–192. [Google Scholar]
  40. Miller, G.A. WordNet: A lexical database for English. Commun. ACM 1995, 38, 39–41. [Google Scholar] [CrossRef]
  41. Navigli, R.; Ponzetto, S.P. BabelNet: The Automatic Construction, Evaluation and Application of a Wide-Coverage Multilingual Semantic Network. Artif. Intell. 2012, 193, 217–250. [Google Scholar] [CrossRef]
  42. van Deemter, K.; Krahmer, E.; Theune, M. Real versus template-based Natural Language Generation: A false opposition? Comput. Linguist. 2005, 31, 15–23. [Google Scholar] [CrossRef]
  43. Reiter, E.; Dale, R. Building Natural Language Generation Systems; Cambridge University Press: New York, NY, USA, 2000. [Google Scholar]
  44. Gatt, A.; Krahmer, E. Survey of the State of the Art in Natural Language Generation: Core tasks, applications and evaluation. J. Artif. Intell. Res. 2018, 61, 65–170. [Google Scholar] [CrossRef]
  45. McKeown, K.R.; Pan, S.; Shaw, J.; Jordan, D.A.; Allen, B.A. Language Generation for Multimedia Healthcare Briefings. In Proceedings of the Fifth Conference on Applied Natural Language Processing (ANLC’97), Stroudsburg, PA, USA, March 1997; Association for Computational Linguistics: Stroudsburg, PA, USA, 1997; pp. 277–282. [Google Scholar] [CrossRef] [Green Version]
  46. Eugenio, B.D.; Fossati, D.; Yu, D.; Haller, S.M.; Glass, M. Aggregation Improves Learning: Experiments in Natural Language Generation for Intelligent Tutoring Systems. In Proceedings of the 43rd Annual Meeting of the Association for Computational Linguistics (ACL 2005), Ann Arbor, MI, USA, 25–30 June 2005; pp. 50–57. [Google Scholar]
  47. Reape, M.; Mellish, C. Just what is aggregation anyway? In Proceedings of the European Workshop on Natural Language Generation (ENLG 1998), Brighton, UK, September 2015; Omnipress, Inc.: Madison, WI, USA, 1998; pp. 20–29. [Google Scholar]
  48. Steelman, L.A.; Rutkowski, K.A. Moderators of employee reactions to negative feedback. J. Manag. Psychol. 2004, 19, 6–18. [Google Scholar] [CrossRef]
  49. Dohrenwend, A. Serving up the feedback sandwich. Fam. Pract. Manag. 2002, 9, 43–50. [Google Scholar]
  50. Stede, M. Lexicalization in natural language generation: A survey. Artif. Intell. Rev. 1994, 8, 309–336. [Google Scholar] [CrossRef]
  51. Reiter, E.; Sripada, S.; Hunter, J.; Davy, I. Choosing words in computer-generated weather forecasts. Artif. Intell. 2005, 167, 137–169. [Google Scholar] [CrossRef] [Green Version]
  52. Elhadad, M.; Robin, J.; McKeown, K. Floating constraints in lexical choice. Comput. Linguist. 1997, 23, 195–239. [Google Scholar]
  53. Mazzei, A. Building a Computational Lexicon by using SQL. Proceedings of Third Italian Conference on Computational Linguistics (CLiC-it 2016) & Fifth Evaluation Campaign of Natural Language Processing and Speech Tools for Italian. Final Workshop (EVALITA 2016), Napoli, Italy, 5–7 December 2016; Basile, P., Corazza, A., Cutugno, F., Montemagni, S., Nissim, M., Patti, V., Semeraro, G., Sprugnoli, R., Eds.; CEUR-WS.org: Aachen, Germany, 2016; Volume 1749, pp. 1–5. [Google Scholar]
  54. Klasnja, P.; Consolvo, S.; Pratt, W. How to Evaluate Technologies for Health Behavior Change in HCI Research. In Proceedings of the SIGCHI Conference on Human Factors in Computing Systems (CHI’11), Vancouver, BC, Canada, May 2011; ACM: New York, NY, USA, 2011; pp. 3063–3072. [Google Scholar] [CrossRef]
  55. Hekler, E.B.; Klasnja, P.; Froehlich, J.E.; Buman, M.P. Mind the Theoretical Gap: Interpreting, Using, and Developing Behavioral Theory in HCI Research. In Proceedings of the SIGCHI Conference on Human Factors in Computing Systems (CHI’13), Paris, France, April 2013; ACM: New York, NY, USA, 2013; pp. 3307–3316. [Google Scholar] [CrossRef]
  56. Sterling, L.; Petot, G.; Marling, C.; Kovacic, K.; Ernst, G. The role of common sense knowledge in menu planning. Expert Syst. Appl. 1996, 11, 301–308. [Google Scholar] [CrossRef]
  57. Reiter, E. Task-based evaluation of nlg systems: Control vs. real-world context. In Proceedings of the UCNLG+ Eval: Language Generation and Evaluation Workshop, Edinburgh, Scotland, 31 July 2011; pp. 28–32. [Google Scholar]
  58. Caracciolo, C.; Stellato, A.; Morshed, A.; Johannsen, G.; Rajbhandari, S.; Jaques, Y.; Keizer, J. The AGROVOC Linked Dataset. Semant. Web 2013, 4, 341–348. [Google Scholar] [CrossRef] [Green Version]
  59. Moro, E. The Mediterranean Diet from Ancel Keys to the UNESCO Cultural Heritage. A Pattern of Sustainable Development between Myth and Reality. Procedia Soc. Behav. Sci. 2016, 223, 655–661. [Google Scholar] [CrossRef] [Green Version]
  60. Lu, Y.; Stathopoulou, T.; Vasiloglou, M.F.; Christodoulidis, S.; Stanga, Z.; Mougiakakou, S.G. An Artificial Intelligence-Based System to Assess Nutrient Intake for Hospitalised Patients. IEEE Trans. Multimed. 2020. [Google Scholar] [CrossRef]
Figure 1. The schema of the Multimedia Application for Diet Management (MADiMan) architecture. NLG, natural language generation.
Informatics 07 00027 g001
Figure 2. Graphical representation of the simple temporal problem (STP) constraints modelling a diet. For the sake of simplicity, in the figure, we do not represent the macronutrients, nor the single meals, but only the total energy in a day. In the top part, we represent the STP corresponding to the dietary constraints at the beginning of a week. In the middle part, we have the STP after the first three days, where John ate 2690 kcal on each day; notice that also imprecision in the measurement is supported [12]. In the bottom part, we represent the STP resulting from the constraint propagation where—as a result of food eaten in the first three days—John has to eat between 2205 kcal and 2465 kcal each day for the rest of the week and a total in the remaining four days of 2270 · 4 kcal.
Informatics 07 00027 g002
Figure 3. Classification of an inconsistent/consistent value of a meal’s energy supply given the minimum and maximum value of an STP constraint. The figure represents the range [ m i n , m a x ] admitted by an STP constraint (represented as an edge as in Figure 2).
Informatics 07 00027 g003
Figure 4. The sentence generated by the quasi-tree (a) expresses the overall evaluation on the selected menu, and the sentence generated by the quasi-tree (b) expresses the specific appropriateness of the macronutrient. NP, noun phrase; VP, verbal phrase; ADJP, adjectival phrase; PP, prepositional phrase.
Informatics 07 00027 g004
Figure 5. Two quasi-trees corresponding to specific messages on (a) proteins and (b) carbohydrates and the corresponding realized sentences.
Informatics 07 00027 g005
Figure 6. The quasi-tree obtained by using VP-aggregation on the quasi-trees in Figure 5.
Informatics 07 00027 g006
Figure 7. The quasi-tree obtained by using set-aggregation on the quasi-trees in Figure 5.
Informatics 07 00027 g007
Figure 8. Three screenshots of the CheckYourMeal! app. The user interface is structured into three sections: the Home Section (left), where the users are provided with general information on the weekly diet; the Menu Section (centre), where the users can see the suggestions for the next meal and where they can input the chosen meals; and the Recommendation Section (right), where the users visualize both a textual message and a pie chart containing information about the macronutrient values of a specific menu.
Informatics 07 00027 g008
Figure 9. A graphical representation of the distribution of the answers to the questions GU and TU in Experiment 1.
Informatics 07 00027 g009
Figure 10. A graphical representation of the distribution of the answers to QB, QE and QU in Experiment 1.
Informatics 07 00027 g010
Figure 11. A graphical representation of the distribution of the answers to QP in Experiment 1.
Informatics 07 00027 g011
Figure 12. A plot showing the distribution of the answers for the question QVin Experiment 1.
Informatics 07 00027 g012
Table 1. The prototypical messages describing the STP reasoner classification for the energy value for the proteins. The italicized text varies according to the + / deviation; the uppercase text corresponds to the considered macronutrient.
CategoryPrototypical Message (in Italian)English Translation
I 1 + / I 1 Questo menù non è buono. Il menù
è troppo ricco/povero in PROTEINE.
This menu is not good. The menu
is really rich/poor in PROTEINS.
I 2 + / I 2 Questo menù non va bene. Il menù
è rich/poor in PROTEINE.
This menu is not OK. The menu
is rich/poor in PROTEINS.
C 1 + / C 1 Questo menù è buono. Il menù
è rich/poor in PROTEINE.
This menu is good. The menu
is rich/poor in PROTEINS.
C 2 + / C 2 Questo menù è molto buono. Il menù
è leggermente rich/poor in PROTEINE.
This menu is very good. The menu
is lightly rich/poor in PROTEINS.
C 3 Questo menù è un’ottima scelta. Il menù
è perfetto in PROTEINE.
This menu is a great choice.
The menu is perfect in PROTEINS.
Table 2. Distribution of the users’ responses to the Likert-scale questions of Experiment 1. We report also the mean value, the standard deviation and the two-tailed p-values for t-tests. GU, graphics usefulness; QB, question on boringness; QE, question on easiness; QU, question on usefulness; QP, question on persuasiveness.
QL = 1L = 2L = 3L = 4L = 5Mean ± STDp-Value
GU02567 3 . 90 ± 1 . 02 4 × 10 4
TU001136 4 . 25 ± 0 . 55 2 × 10 9
QB205103 3 . 60 ± 1 . 10 0 . 01
QE37640 2 . 55 ± 1 . 00 0 . 03
QU37640 2 . 55 ± 1 . 00 0 . 03
QP112340 2 . 50 ± 0 . 89 0 . 01
Table 3. The distribution of the preferences of the users participating in Experiment 2 for the blue and violet versions with the p-value for the chi-squared test.
Blue VersionViolet Versionp-Value
Q F 1 10 % ( 4 ) 90 % ( 35 ) <0.0001
Q F 2 13 % ( 5 ) 87 % ( 34 ) <0.0001
Q F 3 15 % ( 6 ) 85 % ( 33 ) <0.0001
Table 4. The measure of the persuasive power of the violet and blue versions of the messages. C h + / M s g + is the fraction of times that the users chose a menu after a positive message. C h / M s g is the fraction of times that the users did not choose a menu after a negative message. ( C h + + C h ) / ( M s g + + M s g ) is the micro-average between positive and negative persuasive power. * denotes significance at p 0 . 001 in the chi-squared tests; ** denotes significance at p 0 . 005 .
Blue VersionViolet Version
Positive persuasive power ( C h + / M s g + ) 65 % ( 413 / 635 ) * 60 % ( 298 / 497 ) *
Negative persuasive power ( C h / M s g ) 50 % ( 191 / 382 ) 46 % ( 102 / 221 )
Persuasive power ( ( C h + + C h ) / ( M s g + + M s g ) ) 59 % ( 604 / 1017 ) * 56 % ( 400 / 718 ) **

