Void Properties in Dense Bed of Cold-Flow Fluid Catalytic Cracking Regenerator


1
School of Chemical and Material Engineering, Korea National University of Transportation, Chungju-si, Chungbuk 27469, Korea
2
Department of Chemical and Biomolecular Engineering, Korea Advanced Institute of Science and Technology, DaeJeon 34141, Korea
*
Author to whom correspondence should be addressed.
Processes 2018, 6(7), 80; https://doi.org/10.3390/pr6070080
Submission received: 30 May 2018
/
Revised: 15 June 2018
/
Accepted: 26 June 2018
/
Published: 27 June 2018
Abstract
:Fluid catalytic cracking (FCC) processes have been used widely in petroleum refineries. FCC regenerators play important roles for maintaining catalyst activity and supply the reaction heat. The regenerator efficiency is mainly connected to the hydrodynamics of the fluidized bed, because the gas and solid behaviors are very important factors in mass and heat transfer. The void properties, such as chord length, rising velocity, frequency, and fraction, have been determined in a large cold flow model (0.48 m-ID × 6.4 m-high) of the FCC regenerator, which was geometrically scaled down from a commercial FCC unit. The local void chord length, rising velocity, frequency, and fraction exhibit their maximum value along the radial direction of the bed. The cross-sectional mean void chord length, rising velocity, and fraction increase and the cross-sectional mean void frequency decreases with height in the bed. The variation of void properties in the FCC regenerator with turbulent fluidized bed exhibit similar trends to those in a bubbling fluidized bed. The void properties in the FCC regenerator have been correlated with the experimental parameter on the basis of bubbling bed concept. The predicted void velocities based on the correlations agreed well with the experimental data from present and previous studies. A modified bubbling fluidized bed model could describe the void properties in the regenerator operated in turbulent fluidized bed regime.
1. Introduction
Fluid catalytic cracking (FCC) processes have been used widely in petroleum refineries to convert the high-molecular weight hydrocarbons into more valuable propylene, gasoline, and gas oil, etc. [1]. In the process, an FCC regenerator is utilized to burn off the coke deposit on catalysts surface with air for maintaining catalyst activity at a useful level and supply heat for the FCC reaction in the riser. Much efforts have been devoted to make the FCC process more efficient and profitable with reliable processing of much heavier feedstock such as atmospheric residue [2]. The heavy feedstock has a tendency to produce high coke yields that may give rise to incomplete catalysts regeneration problems, which lead to the development of two-stage regeneration in the units. Conventional FCC regenerators are typically operated at the gas velocities of 0.6–1.2 m/s which corresponds to the turbulent fluidization regime [3]. There has been a continuing demand on mathematical models for better description and analysis of the regenerator operation to increase regeneration efficiency. The efficiency is mainly connected to the hydrodynamics of the fluidized bed, because the gas and solid behaviors are very important factors in mass and heat transfer. However, the theoretical prediction of gas and particle behaviors is still difficult, especially on bubble formation and movement in the fluidized bed. The hydrodynamic modeling requires experimental data, particularly relating the bubble or void motions as input parameters in many proposed two-phase reactor models for the turbulent fluidized bed [4,5]. Numerous research works on the hydrodynamics in the fluidized beds have been conducted. However, experimental studies on the void properties in the turbulent bed are sparse compared to studies on bubbling fluidized bed, because of complicated and chaotic flow characteristics in the bed [5]. Further research is still required on the hydrodynamic behaviors in the dense bed including the void properties in the turbulent flow regime [6].
Previous studies on void behaviors in turbulent fluidized beds have been carried out mostly with Geldart B particles such as ash and sand for the combustor applications [7,8]. A few studies [5,9,10] reported limited data in the turbulent fluidized bed with FCC catalysts for the FCC regenerator application. And, the correlations for predicting the void properties in turbulent fluidized bed of the FCC catalysts are comparatively sparse.
The accurate and appropriate instrumentation techniques for measurement of the void properties is needed to describe the hydrodynamic flow behavior of the turbulent fluidized bed. Intrusive and non-intrusive methods have been applied for acquiring the void or bubble properties in the gas-solid fluidized beds. The non-intrusive methods such as laser sheet, tomography, and nuclear magnetic resonance techniques measure the whole image of the particles flow in a wide range [11]. However, they are mostly used for small diameter column due to the limitation of signal penetration [5]. The hydrodynamic flow behavior of a fluidized bed can be measured by intrusive techniques, such as the optical fiber and capacitance probes, with the advantage of easily acquiring the instantaneous void velocity and describing local flow structure, even in large diameter column [12]. The optical fiber technique could directly provide local void properties with signal processing by cross-correlation such as peak-to-peak analysis [13].
In the present study, the void properties in the turbulent fluidized bed have been determined by the optical fiber probe technique in a large cold flow model, which was geometrically scaled down from the two-staged regenerator in a commercial 58,000 B/D FCC unit. The obtained void properties have been correlated with the experimental parameters from present and previous studies.
2. Materials and Methods
2.1. Materials and Experimental Apparatus
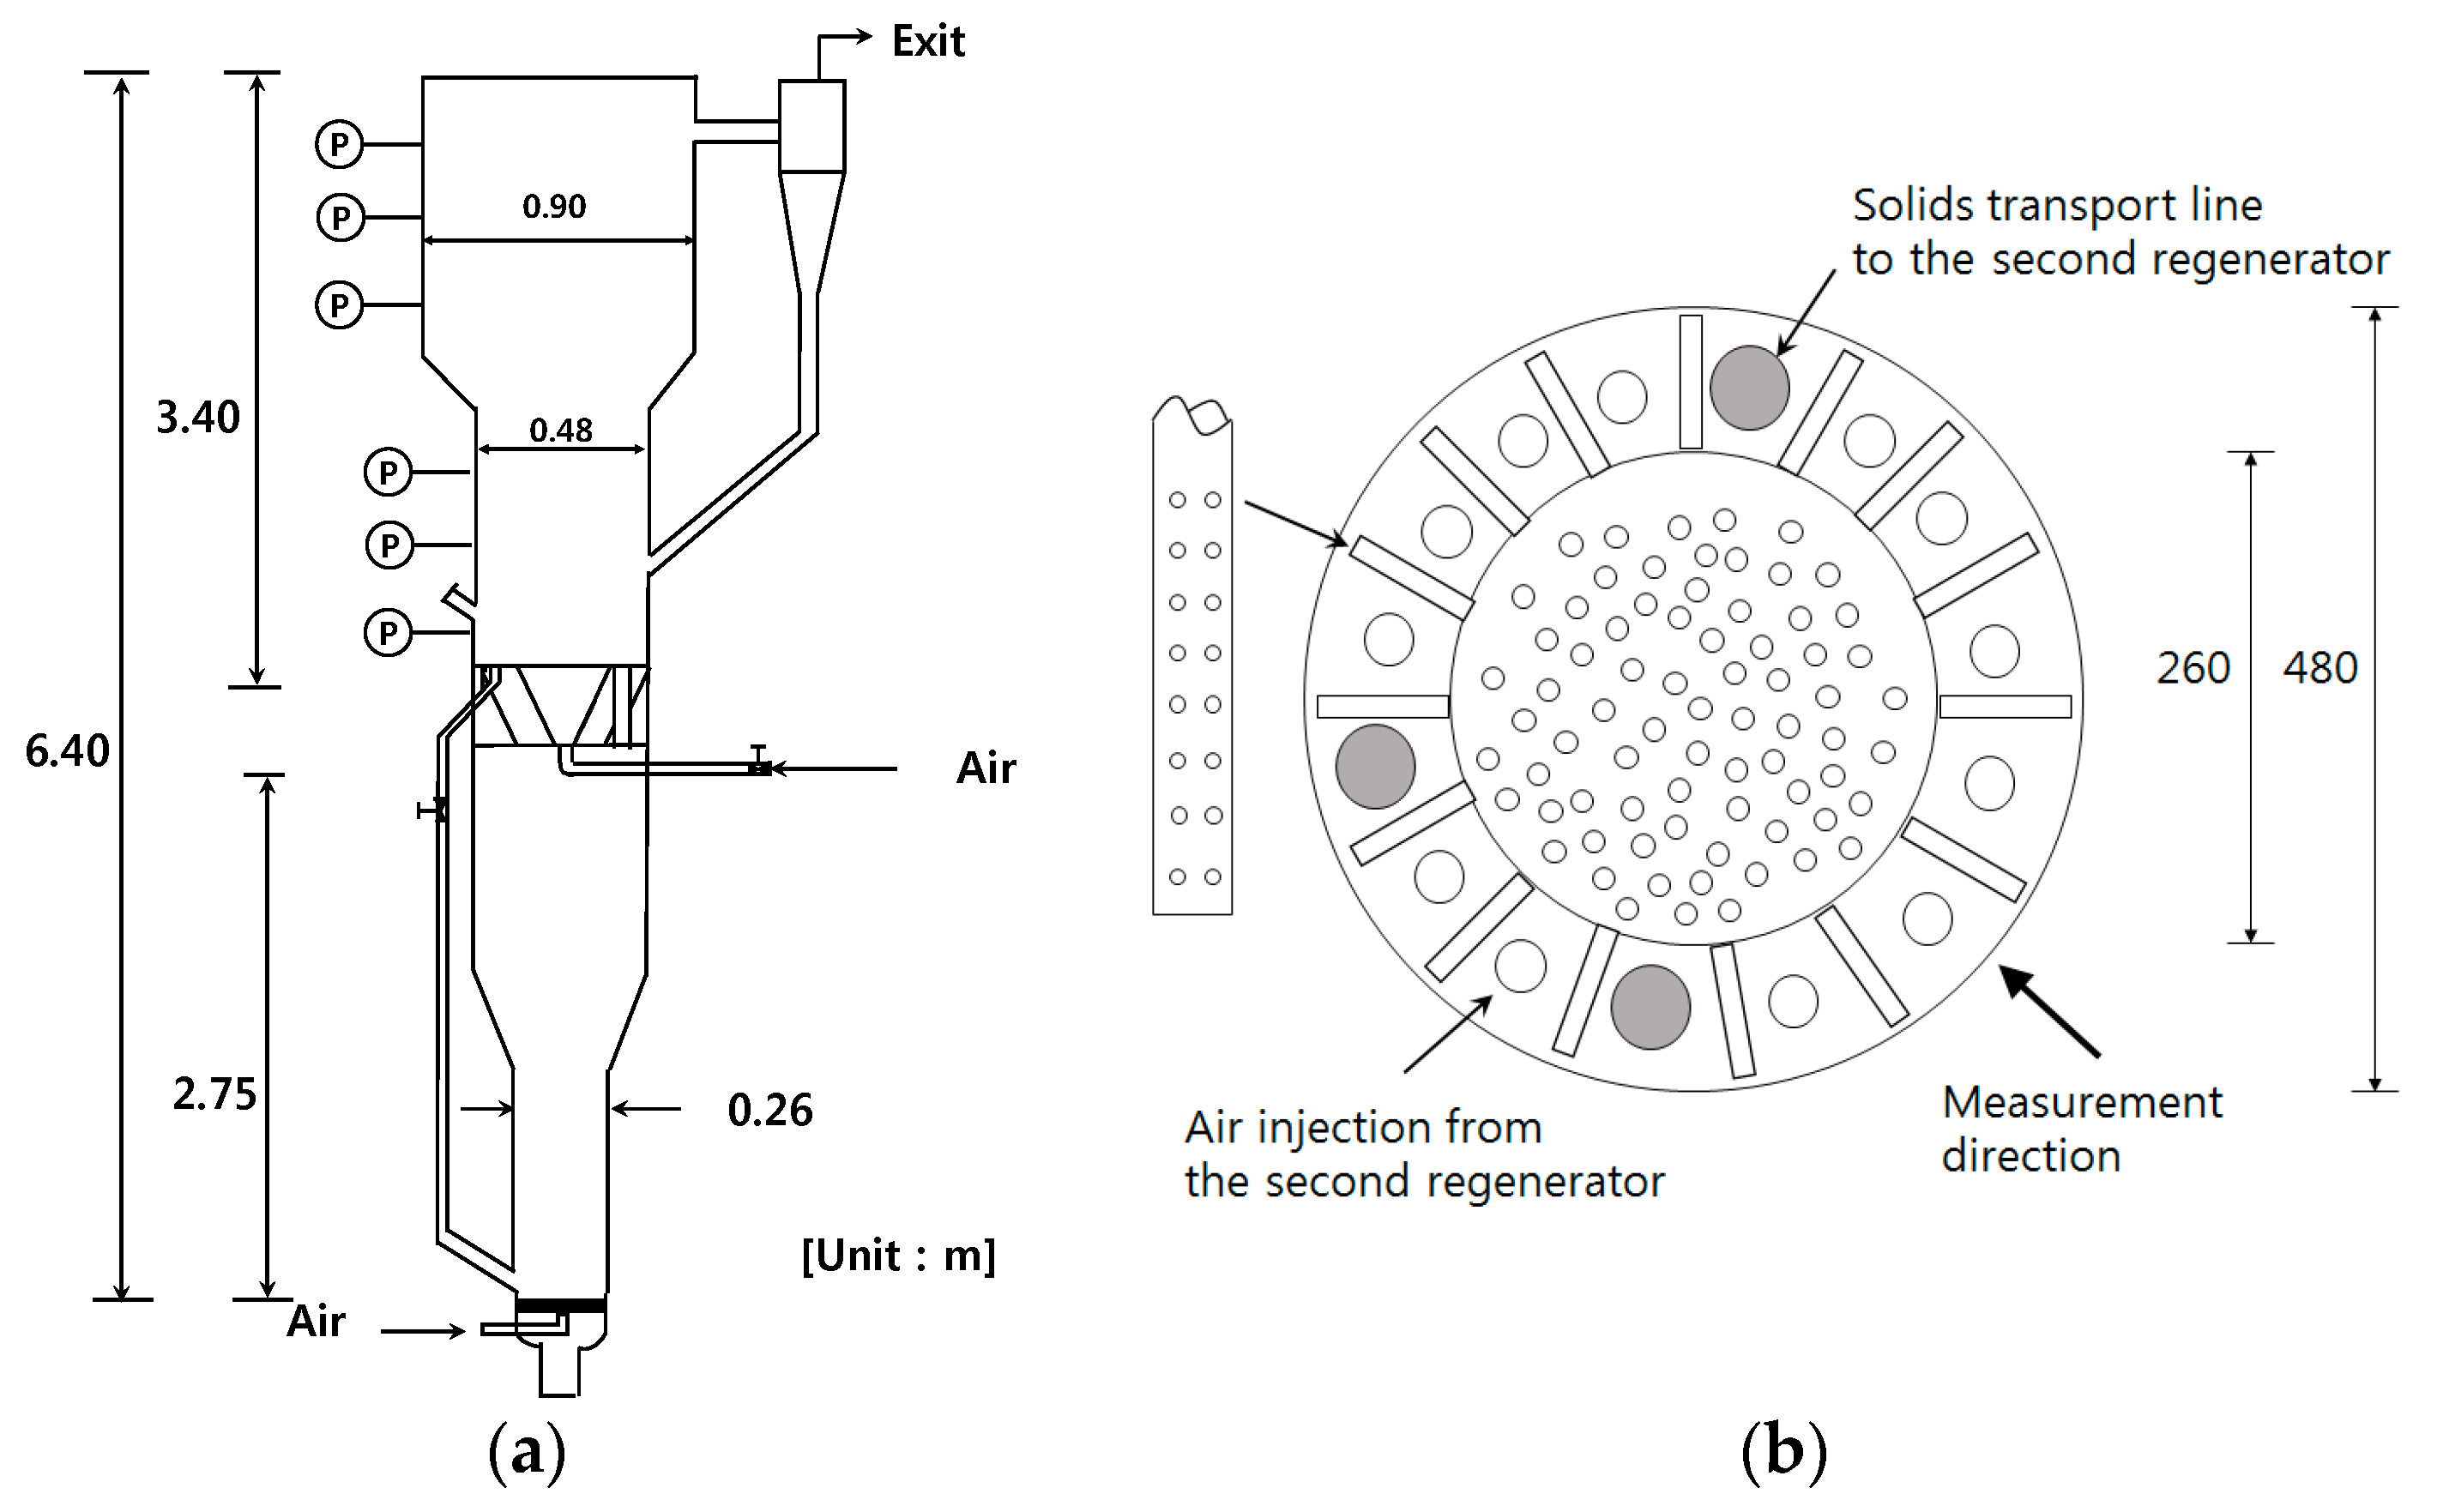
Experiments were carried out using a Plexiglas FCC regenerator as in Figure 1. It consisted of the first (0.48 m-ID) and the second (0.26 m-ID) regenerators. Each regenerator had the enlarged top section of column (the first: 0.90 m; the second: 0.48 m). The distributor of the first regenerator is shown in Figure 1b. Air was supplied respectively into two regenerators and the gas exiting the second regenerator was re-injected into the first regenerator through the pipes around the distributor to simulate the operation of the commercial regenerator. Manometers and pressure transmitters were installed on the column wall to measure pressure drops between pressure taps from which the solid holdups were deduced. The bed materials were spent FCC catalysts (Geldart group A) with the physical properties as shown in Table 1. The measurements of void properties were carried out in the first regenerator, which is an important part because 70 percent of the total coke produced is burned there [3]. The air velocity in the first regenerator was varied 1.00–1.13 m/s (Re = 31,054–35,091) and the second regenerator was kept at gas velocity of 1.00 m/s (Re = 16,821), which corresponded to operating range of commercial reactor [3,14].
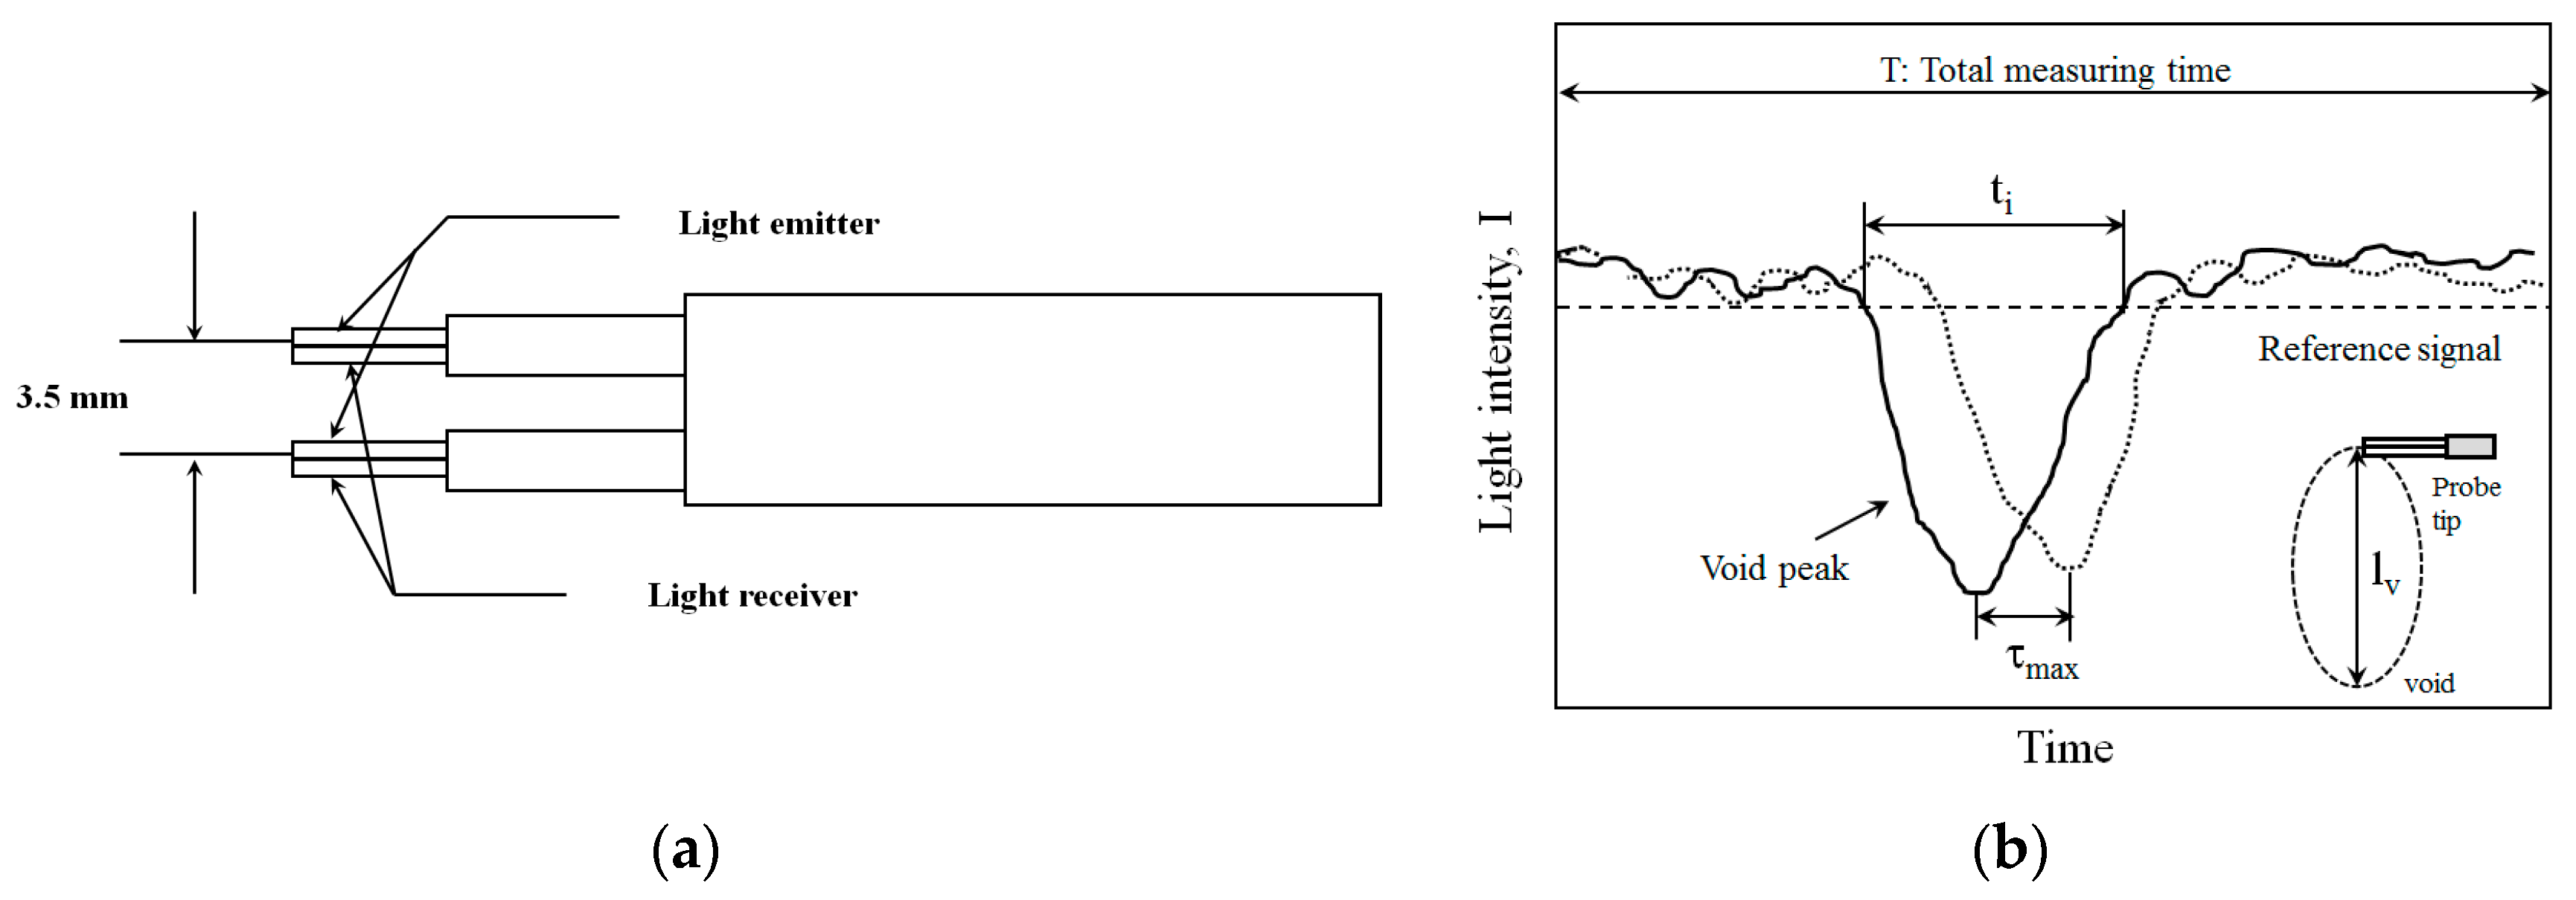
An optical fiber probe system of reflective type was used to determine the void properties. The optical fiber probe technique has widely been used for measuring voidage, bubble and void behaviors in fluidized beds as an intrusive measurement due to its simplicity and high signal to noise ratio [5,15]. The probe system is schematically shown in Figure 2a. The probe was comprised of two separate pairs of optical fibers (500 μm-ID). One pair was light emitter which is connected to a Helium-Neon laser (Uniphase 1144, US) with 17 mW as the light source, and the others were receivers of the reflective light as the particles passed the tips of the probe. The receivers were connected to two phototransistors and data acquisition system to record the instantaneous light signals. The sampling frequency (the number of samples per second) of signals was selected at 2000 Hz based on a previous study [14], and sampling time was 30 s for each experimental case. The measurements were conducted at four elevations (h = 0.24, 0.34, 0.44, 0.60 m), considering the minimization of the local inlet impacts by the solid transport line and jet length from distributor nozzle.
2.2. Data Analysis
A time series analysis [15,16,17] was performed on the probe signals prior to calculation of the void properties. The time lag (τmax) between void contacting at two tips was obtained by the cross-correlation analysis on void peak signals after filtering signal of solid emulsion phase above reference signal as in Figure 2b [5,10,13,15]. Then, the time averaged void rising velocity, Uv, was calculated by dividing the distance between two tips (d) by the τmax as:
Locally measuring probes usually measure chord lengths that can be used to characterize bubble sizes as shown in Figure 2b. The void chord length was calculated from the void contact time (ti) at the tip as:
The void frequency was calculated from the number of void peaks (ni) detected at the probe tips per total measuring time (T) as follows.
The fraction of void was assessed as the cumulative time of the void contact at the tip for all peaks in a spectrum, divided by the total measuring time (T) as [5,10]:
The obtained local bubble properties were averaged over the area at each height to see the effect of height on the average properties. The area-mean properties were calculated by dividing the local time-averaged properties by the area percentage of the region corresponding to the measurement position, assuming to be uniform over the region.
3. Results
3.1. Void Properties
The axial distributions of solid holdup in the first regenerator at different gas velocity are shown in Figure 3. The initial static height in the first regenerator was 0.6 m. The dense bed was formed at a height of 0.7 m from the distributor at given gas velocities. A transition region from dense to dilute phase was shown due to the increase in entrainment of the catalyst particles from the dense bed. An increment of gas velocity decreased the solid holdup in the dense bed. Particularly, gas eddies, solid down-flow, and temporarily stagnant solid-gas flow were observed at the column wall around dense region. The flow behavior near wall may be caused by shear force from turbulent gas eddies and solids down-flow as in bubbling fluidization in larger beds more than 0.3 m, where solids emulsion has gulf streaming [18]. Therefore, the first regenerator forms a gulf-stream structure of gas-solid flow, where with up-flow in the center region and emulsion down-flow near the wall region at the operating gas velocities of this study.
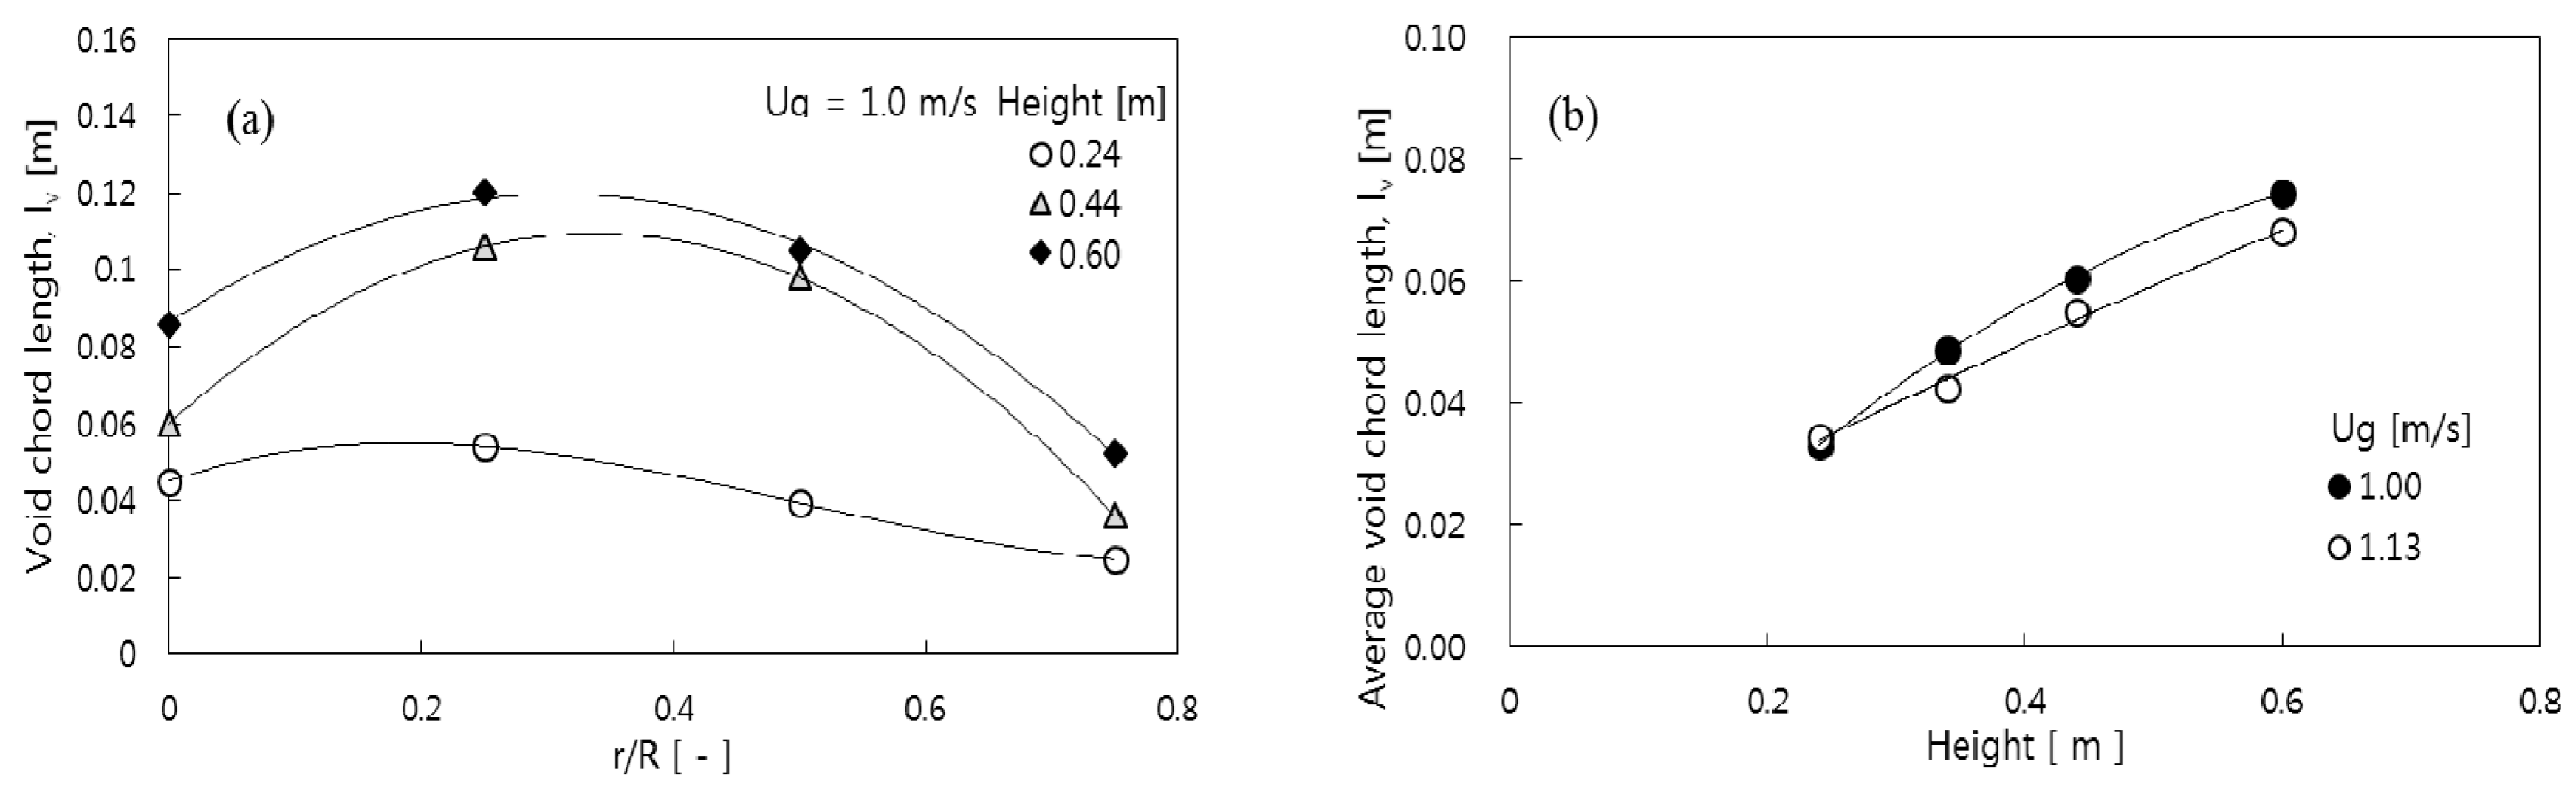
The variation of local void chord length (lv) along the radial direction of the bed and the effect of height in the bed on the area-mean void chord length are shown in Figure 4. The radial lv exhibited spatially non-uniform distribution, and it had a maximum lv in the annular region at different bed height as in Figure 4a. The radial distribution of local lv along the bed height was somewhat different from that reported by Farag et al. [10], where the distribution of lv near the distributor was flat and the maximum value was found r/R between 0.8 and 1.0 along the bed height. The difference of results was due to the distributor type and resulting non-uniform gas introduction into the FCC regenerator [19]. The gas was injected into two regions in the first regenerator as in Figure 1b. In the center region (r/R = 0–0.54), fresh air was supplied through a perforated type distributor having large air fraction by large opening ratio compared to the annular region. In the annular region (r/R = 0.54–1.0), air through a pipe sparger and from the second regenerator were supplied. The lv in the center region just above the distributor was relatively longer because of the strong void coalescence by the large fraction of gas introduction to the distributor. Also, the area-mean lv increased with increasing the height due to the void coalescence which was followed by elongation of the void as exploded bubbles. It indicated the void coalescence was dominant over its splitting in the bed of FCC regenerator, which is similar to exploding bubble regime observed in the dense bed of circulating fluidized bed combustor where bubbles often stretching up from the distributor [20].
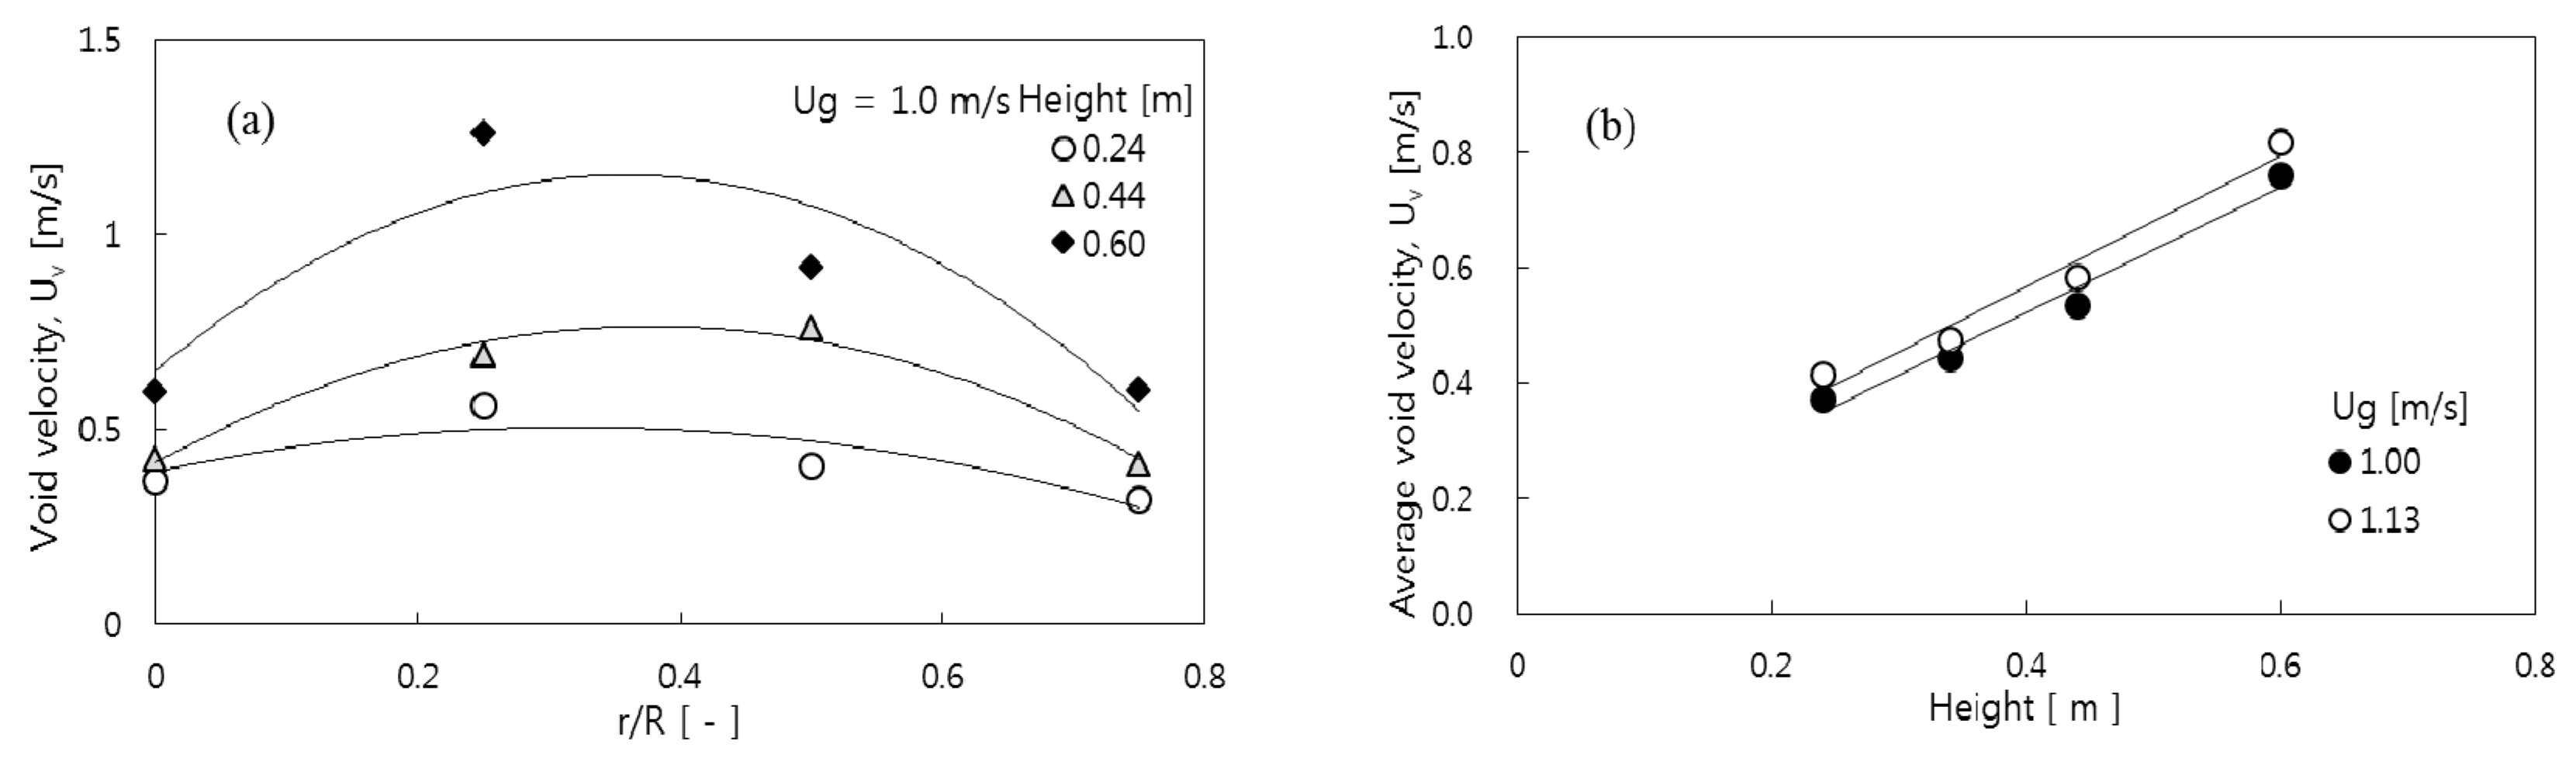
The variations of local void rising velocity along the radial position of the bed and the area-mean void rising velocity with height are shown in Figure 5. The local void rising velocity (Uv) showed a maximum value in the vicinity of the center in the radial direction at different height in the bed, and increased along the bed height in accord with the variation of the void chord length as seen in Figure 4. The distribution of Uv was similar to that reported in a conventional bubbling fluidized bed except near the distributor. The bubble flow rate was higher than that in the central core of the bed. A maximum value in the annular region amplified and moved inwards as the height increased. It eventually reached the center of the bed in case of deep bed [18]. However, the Uv distribution near the distributor exhibited a maximum value in the core region due to the different air introduction design in the distributor compared to the general perforated type distributor as described above [5]. Also, the local Uv at r/R = 0 had relatively lower values due to the flow circulation in the bed, where emulsion phase flowed downward at the center line and upwards in the outer annular region [10]. The area-mean Uv increases along the bed height due to increase of lv as in Figure 5b.
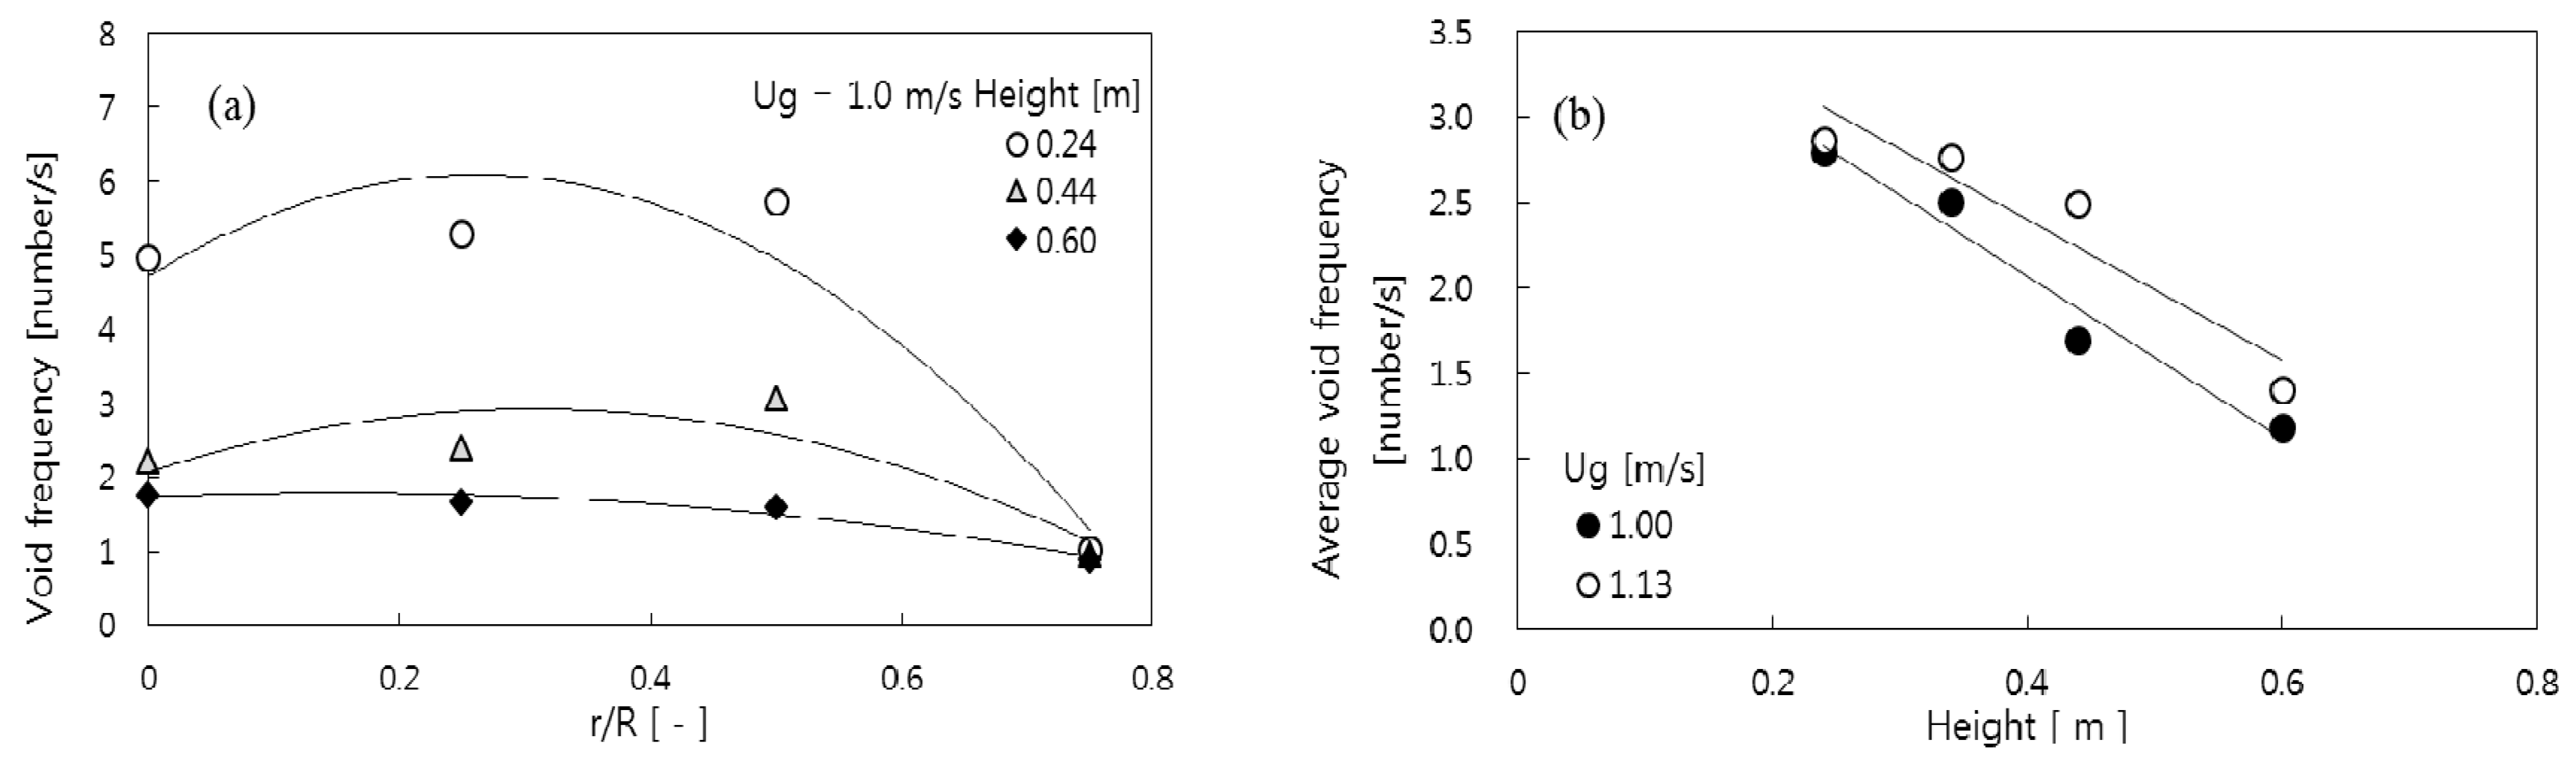
The variations of local void frequency (f) along the radial position and the area-mean void frequency with height are shown in Figure 6a,b. The local frequency had relatively higher values in the core region and decreased toward the wall region due to the bubble flow pattern in the bed (Figure 5). The area-mean void frequency decreased along the column height due to the void coalescence as in the bubbling fluidized bed [18].
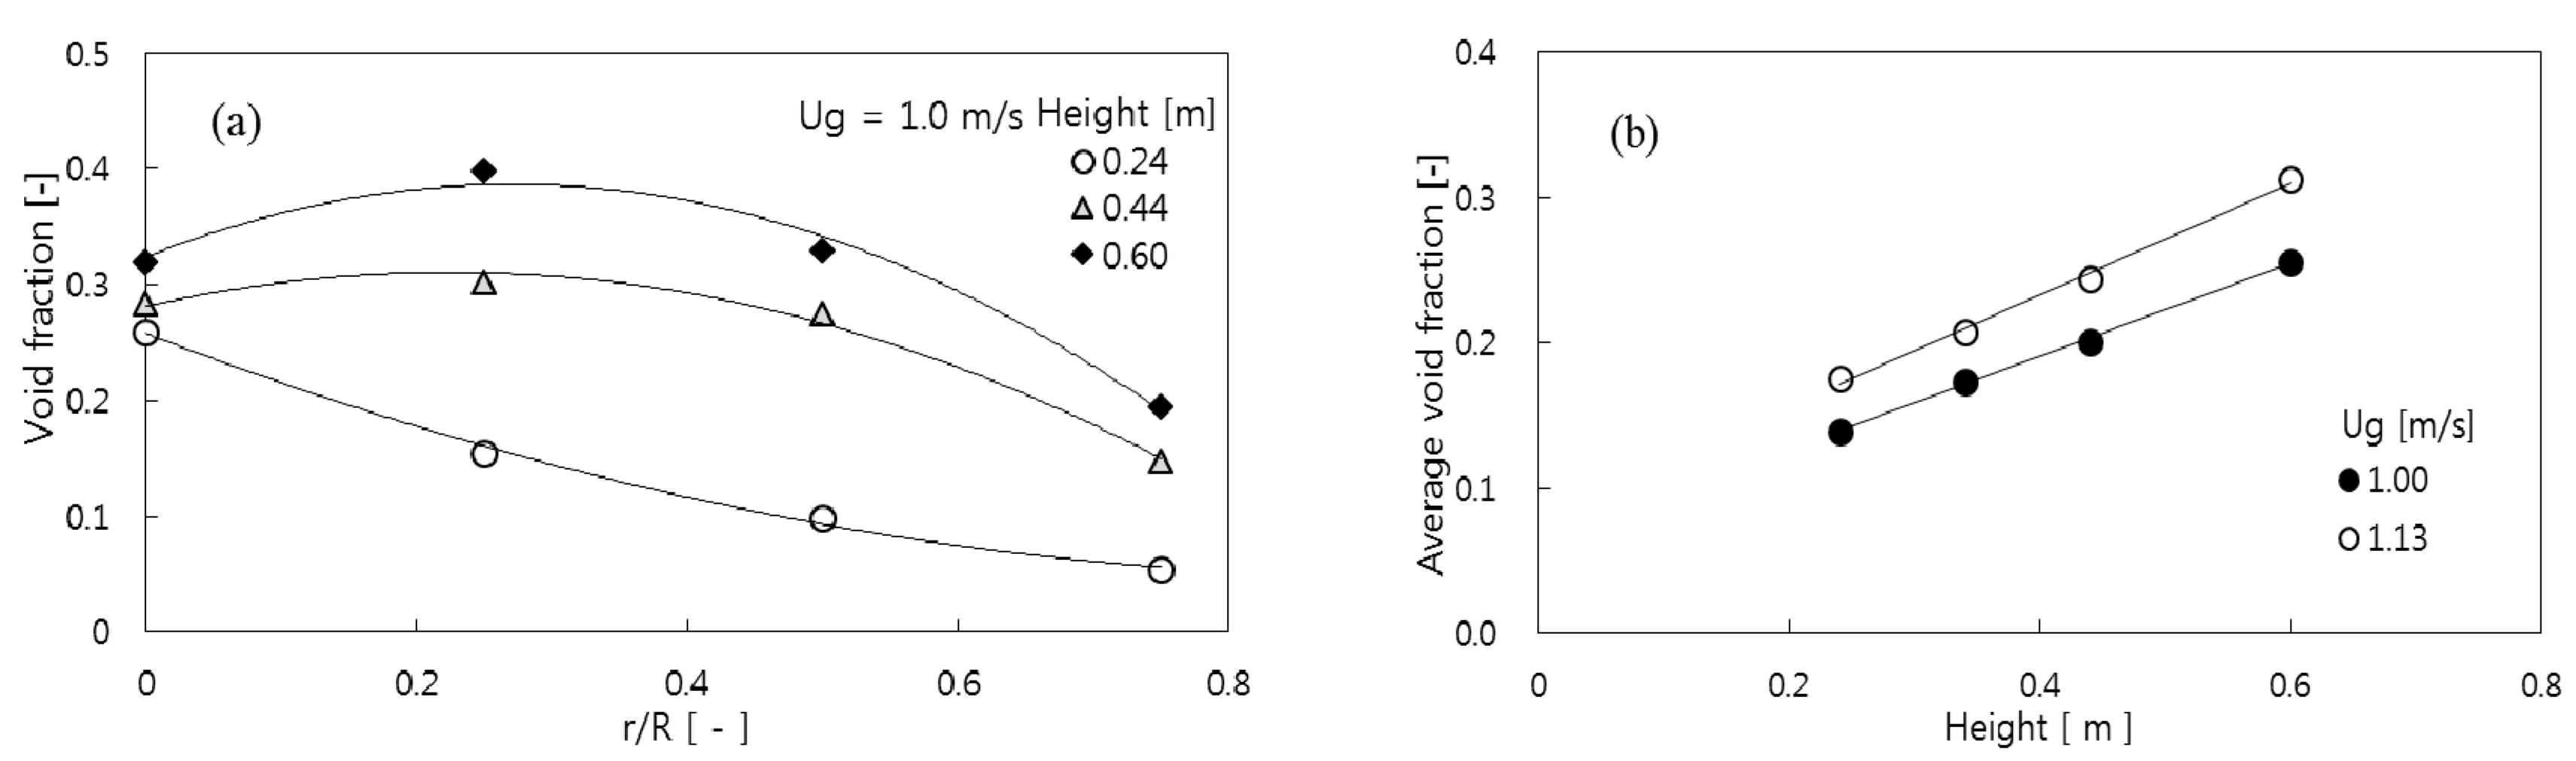
The variations of local void fraction (δ) along the radial position of the bed and the area-mean δ along the column height are shown respectively in Figure 7a,b. The local δ showed spatial non-uniformity with higher values in the core region over r/R=0.5, as observed in other void properties as in Figure 7a. The δ decreased towards the wall region of the bed due to emulsion circulation pattern in the gulf-stream structure of the bed [18], which corresponds to the distributions of the lv and the void frequency. The down-flow emulsion phase near annular region suppresses the void activity [10]. The area-mean δ increases along the bed height due to the void coalescence as in Figure 7b.
The void properties in the FCC regenerator with the turbulent fluidized bed exhibit the similar trends of bubble behaviors in the bubbling fluidized bed, although the voids had explosive, chaotic, and relatively irregular characteristics compared to the bubbles in the bubbling fluidized beds at lower gas velocity. The trends were also reported in studies on turbulent fluidized bed with Geldart B particles in column with large diameter over 0.3 m, where slugging was not observed [7,21]. These similar trends may come from the void size are not limited by the column walls [22]. Therefore, the void properties in the turbulent fluidized bed of FCC catalysts (Geldart A) such as the FCC regenerator can be described by the conventional bubbling bed concept.
3.2. Prediction of Void Properties
A lot of commercial fluid bed reactors are operated at the turbulent fluidization which is difficult to explain the bed behaviors with discrete bubbles. To date, there are still not enough mechanistic models which deal with the turbulent regime. Bubbling models are often used here although with some anxiety [5]. Werther and Wein [7] proposed that the structure of a turbulent fluidized bed can be well described using conventional bubbling bed concept. However, their results are limited to Geldart B particles such as sand particles. The void nature in turbulent fluidized bed of Geldart A particles is somewhat different from that of Geldart B particles [23]. In the study, the observed voids are assumed to have characteristics of exploding bubble like the jet from the distributor nozzle. The jet length has generally good correlation with solid and gas density ratio and dimensionless numbers such as Froude number and Archimedes number [8,24]. The obtained area-mean void chord lengths from this study and literature in Table 2 on the turbulent fluidized bed with FCC particles have been correlated with experimental parameters as following.
lv = 0.0054 h0.31 (ρg/ρp)−1.68 FrD1.08 Ar−3.14
The correlation coefficient of Equation (5) is 0.92 and standard error is 0.254. A good agreement between the measured and calculated values from Equation (5) was shown as in Figure 8.
The void velocity can be expressed on the basis of bubbling fluidized bed concept as following [7,18].
where Vv is the visible void flow rate based on unit bed area and it is related to void fraction (δ) and void rising velocity (Uv) as following [7].
Uv = Vv + 0.71θ(gdv)0.5
The Vv obtained from Equation (7) can be related to the excess gas velocity (Ug − Umf) as:
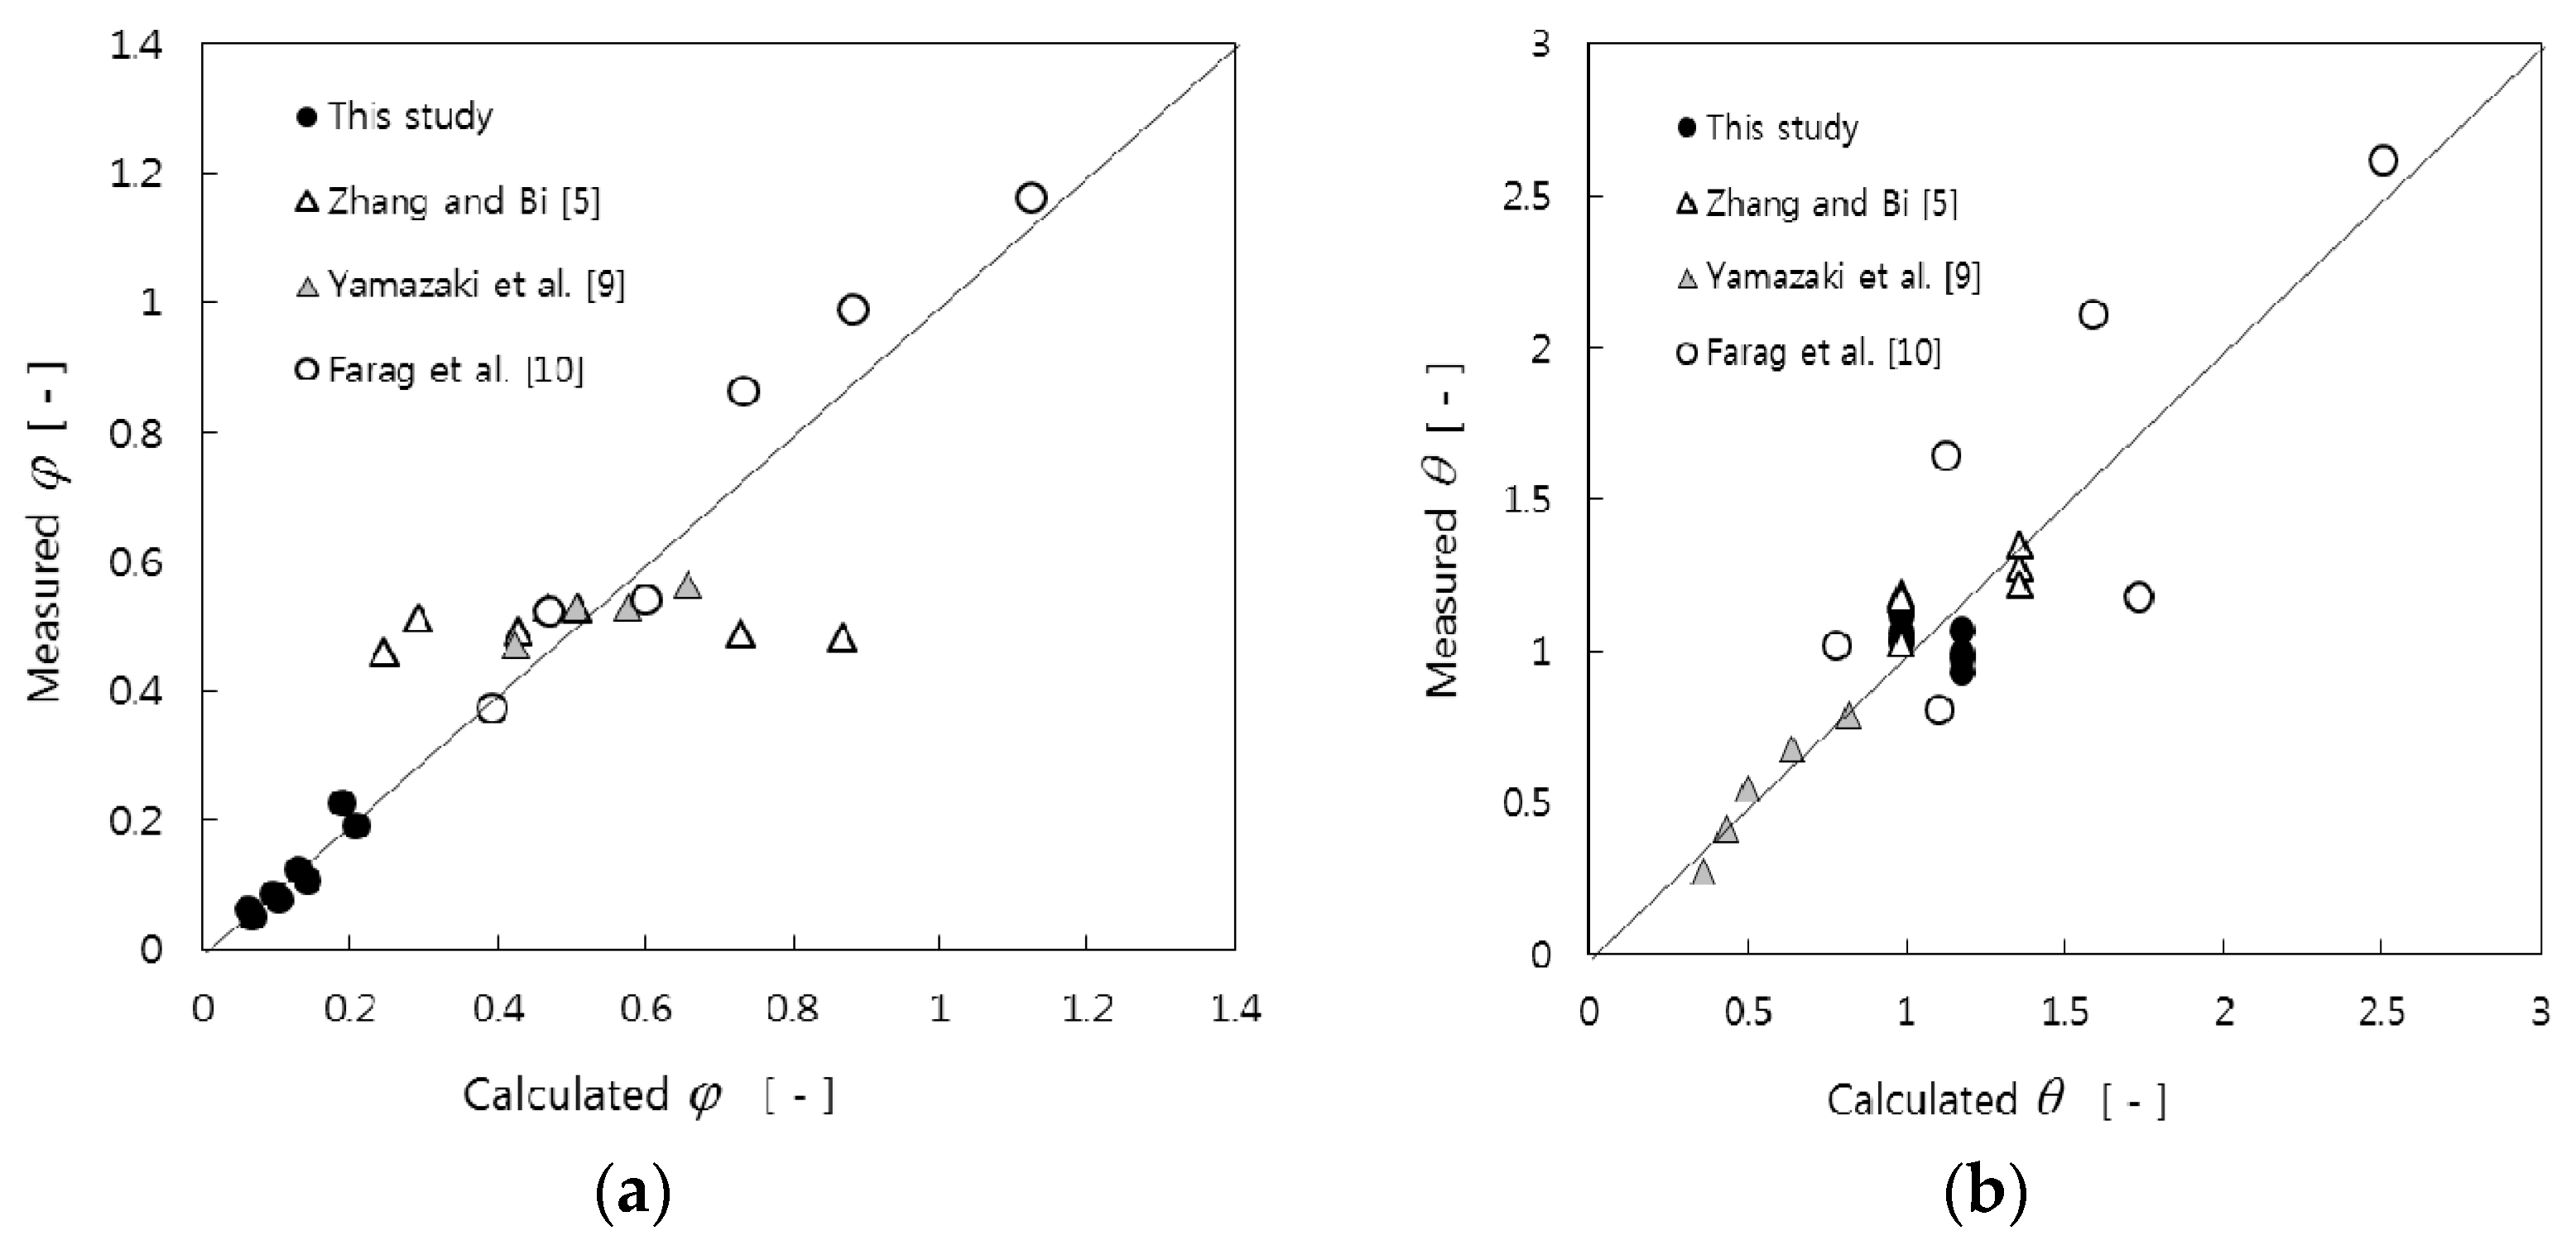
Werther and Wein [7] reported that ϕ from Equation (8) can be correlated with Archimedes number and showed an empirical correlation as following.
ϕ = 1.45 Ar−0.18 (102 < Ar < 104)
However, the values obtained from present and previous studies [5,9,10] on FCC particles do not follow Equation (9). Therefore, ϕ in Equation (8) has been correlated with experimental parameters from studies in Table 2 as following.
ϕ = 7.54 Ar−0.91 (h/Dt)1.23 Rep−0.76 (14.3 < Ar < 25.4)
The area-mean void rising velocities have been correlated with the experimental parameter of present and previous studies [5,9,10], assuming the void has the shape of the exploding bubble as Equation (11) [5].
dv = 0.64 lv
The θ in Equation (6) follows an empirical correlation as Equation (12) derived from experimental parameters from studies in Table 2.
θ = 0.0020 Ar1.78 FrD−1.43
The ϕ and θ values calculated by Equations (10) and (12) are compared with values obtained from results in present and previous studies [5,9,10] as in Figure 9.
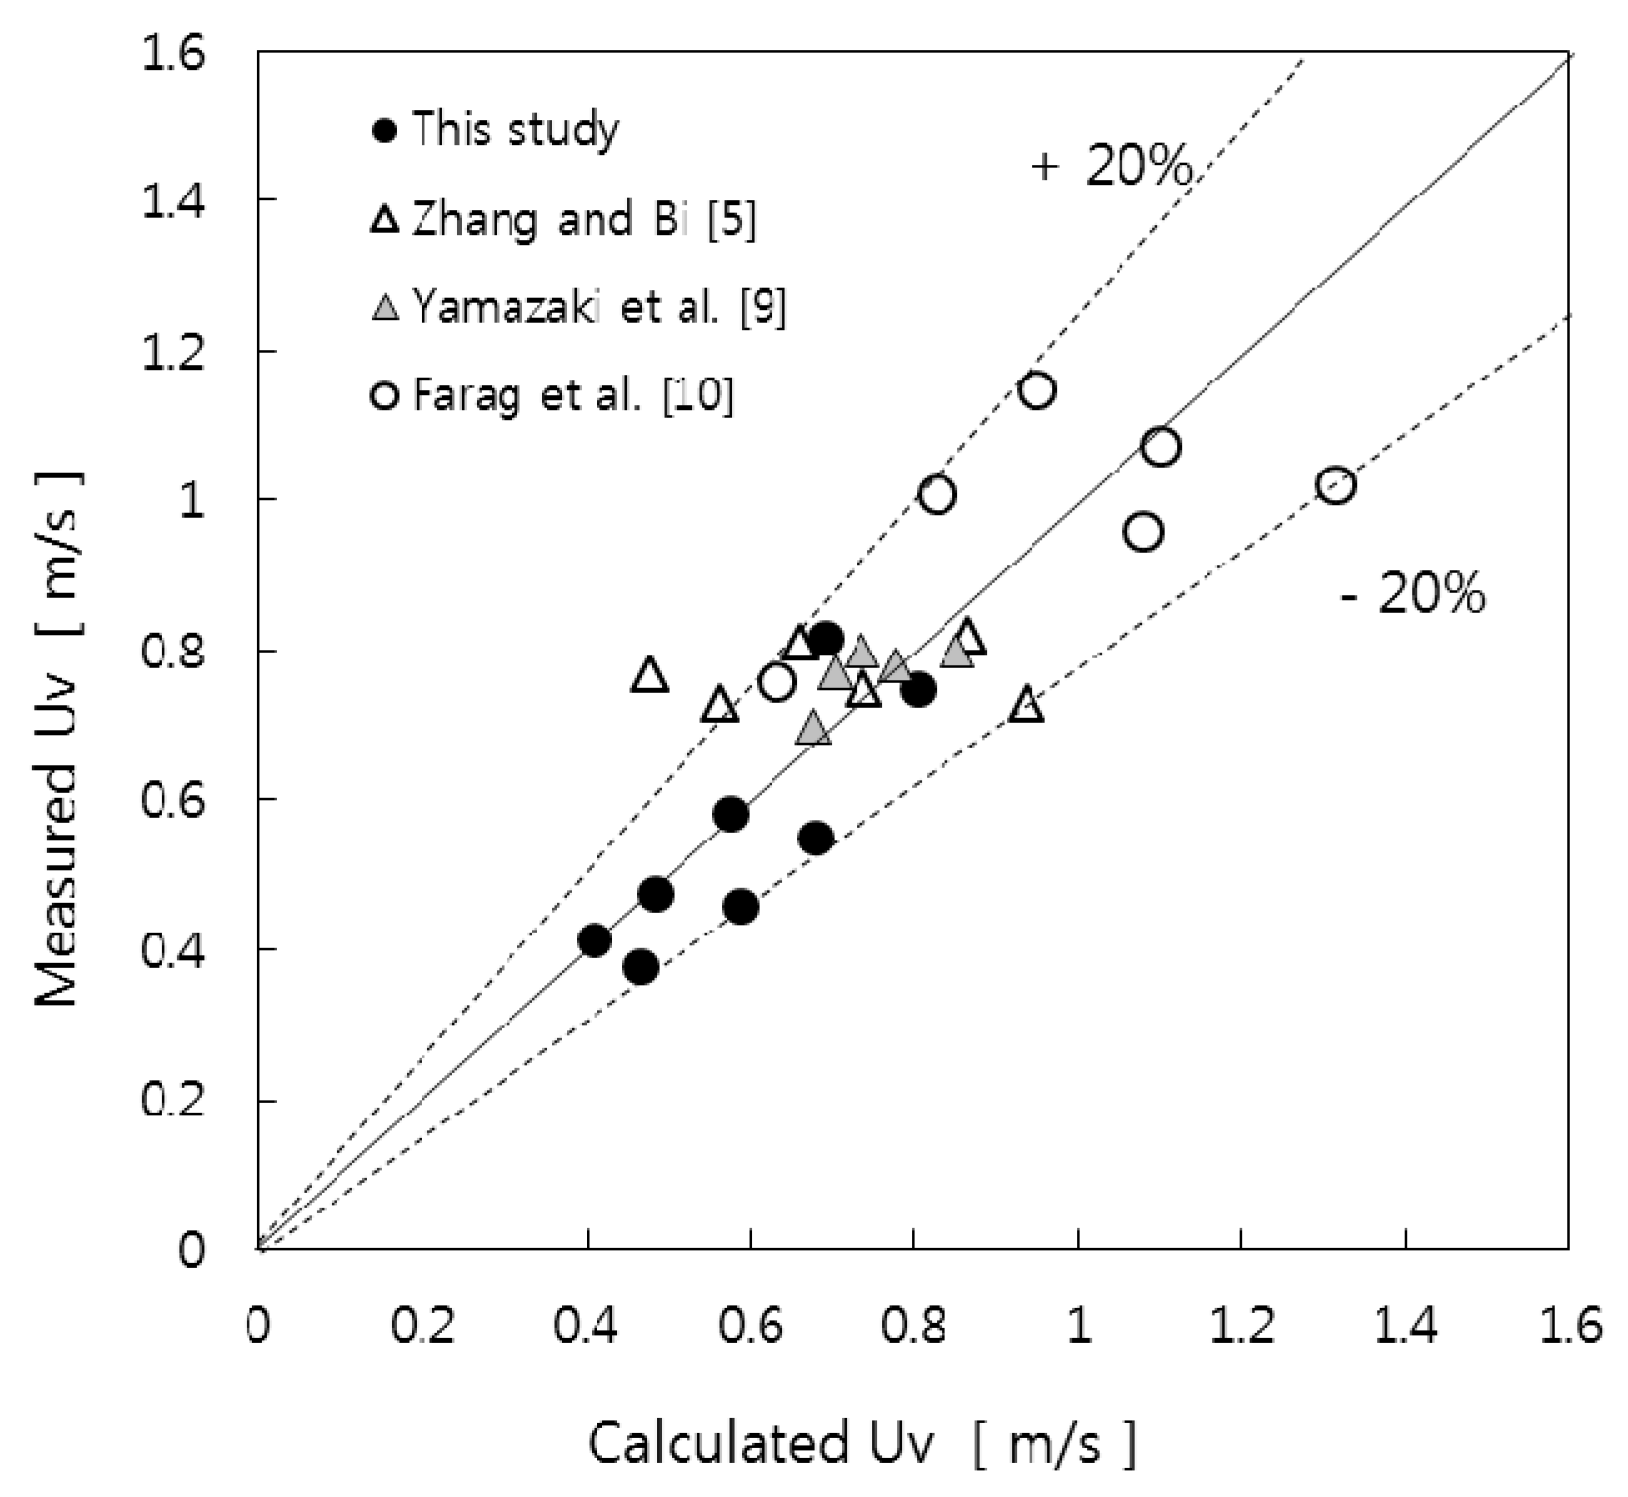
The comparison between the measured and calculated void rising velocities from Equation (6) using Equations (8) and (10)–(12) is shown in Figure 10. It shows a good agreement with average error of 13.5%.
Finally, an existing bubbling bed model was found to be sufficient to describe the void properties in the dense bed of the regenerator operated at turbulent fluidization regime. A few results from previous studies show some deviation from the predicted void chord length and rising velocity as in Figure 8 and Figure 10, because the different distributor type, column diameter, and bed aspect ratio may affect the void behavior in the turbulent fluidized bed. The results and prediction in the study suggests the FCC regenerator has a gulf streaming of emulsion induced by the uneven void or exploding bubble rise in the dense bed, indicating there is additional research area such as an improvement of the distributor design for further increasing the performance related to the mixing of catalysts and air in the regeneration of spent catalysts.
4. Conclusions
The local void chord length, rising velocity, frequency, and fraction exhibited their maximum values along the radial direction of the dense bed in an FCC regenerator. The area-mean void chord length, rising velocity and fraction increased and the area-mean void frequency decreased along the bed height. The void properties in the FCC regenerator with turbulent fluidized bed had tendencies similar to those in bubbling fluidized beds. The void properties in the FCC regenerator have been correlated with the experimental parameter based on the bubbling fluidized bed model. The bubbling fluidized bed model was found to be sufficient to describe the void properties in the dense bed of the regenerator at turbulent fluidized bed regime.
Author Contributions
S.W.K. and S.D.K. conceived and designed the experiments; S.W.K. performed the experiments, analyzed the data and wrote the paper; S.W.K. and S.D.K. reviewed the paper before submission.
Funding
This research received no external funding.
Conflicts of Interest
The authors declare no conflicts of interest.
Abbreviations
| Ar | Archimedes number (dp3ρg(ρp − ρg)g/μ2) [-] |
| d | distance between two probe tips [m] |
| dp | mean particle diameter [m] |
| dv | void diameter [m] |
| Dt | diameter of reactor column [m] |
| FrD | Froude number (Ug/(gDt)0.5) [-] |
| f | void frequency [1/s] |
| g | gravitational constant [m/s2] |
| h | height [m] |
| lv | void chord length [m] |
| Re | Reynolds number ((ρg DtUg/μ) [-] |
| Rep | particle Reynolds number (ρg dpUg/μ) [-] |
| r/R | radial dimensionless coordinate [-] |
| T | total measuring time [s] |
| ti | void contact time with tip of probe [s] |
| Uc | transition velocity from bubbling to turbulent fluidized bed [m/s] |
| Ug | gas velocity [m/s] |
| Umf | minimum fluidization velocity [m/s] |
| Uv | void rising velocity [m/s] |
| Vv | visible void flow rate [m/s] |
| Greek | |
| εs | solid holdup [-] |
| μ | gas viscosity [kg/m s] |
| ρg | gas density [kg/m3] |
| ρp | apparent particle density [kg/m3] |
| ϕ | parameter defined by Equation (8) [-] |
| θ | parameter defined by Equation (6) [-] |
| δ | void fraction [-] |
| τmax | time lag determined by cross-correlation [s] |
References
- Kim, S.W.; Lee, J.W.; Koh, J.S.; Kim, G.R.; Choi, S.; Yoo, I.K. Formation and characterization of deposits in cyclone dipleg of a commercial RFCC reactor. Ind. Eng. Chem. Res. 2012, 51, 14279–14288. [Google Scholar] [CrossRef]
- Zhang, Y.; Lu, C. Experimental study and modeling on effects of a new multilayer baffle in a turbulent fluid catalytic cracking regenerator. Ind. Eng. Chem. Res. 2014, 53, 2062–2066. [Google Scholar] [CrossRef]
- Sadeghbeigi, R. Fluid Catalytic Cracking Handbook, 3rd ed.; Butterworth-Heinemann: Oxford, UK, 2012; pp. 1–42. ISBN 978-0-12-386965-4. [Google Scholar]
- Philippsen, C.G.; Vilela, A.C.F.; Zen, L.D. Fluidized bed modeling applied to the analysis of processes: Review and state of the art. J. Mater. Res. Technol. 2015, 4, 208–216. [Google Scholar] [CrossRef]
- Zhang, X.; Bi, H.T. Study on void behavior in a turbulent fluidized bed with catalyst powders. Ind. Eng. Chem. Res. 2010, 49, 6862–6869. [Google Scholar] [CrossRef]
- Du, B.; Warsito, W.; Fan, L. ECT studies of gas-solid fluidized beds of different diameters. Ind. Eng. Chem. Res. 2005, 44, 5020–5030. [Google Scholar] [CrossRef]
- Werther, J.; Wein, J. Expansion behavior of gas fluidized beds in the turbulent regime. AIChE Symp. Ser. 1994, 301, 31–44. [Google Scholar]
- Karimipour, S.; Pugsley, T. A critical evaluation of literature correlations for predicting bubble size and velocity in gas-solid fluidized beds. Powder Technol. 2011, 205, 1–14. [Google Scholar] [CrossRef]
- Yamazaki, R.; Asai, M.; Nakajima, M.; Jimbo, G. Characterization of transition regime to a turbulent fluidized bed. In Circulating Fluidized Bed Technol IV; Avidan, A.A., Ed.; AIChE: New York, NY, USA, 1994; pp. 609–614. [Google Scholar]
- Farag, H.I.; Ege, P.E.; Grislingas, A.; De Lasa, H.E. Flow patterns in a pilot plant-scale turbulent fluidized bed reactor: Concurrent application of tracers and fiber optic sensors. Can. J. Chem. Eng. 1997, 75, 851–860. [Google Scholar] [CrossRef]
- Kim, S.W. Measurement of carbon nanotube agglomerates size and shape in dilute phase of a fluidized bed. Korean Chem. Eng. Res. 2017, 55, 646–651. [Google Scholar]
- Bae, K.; Lim, J.H.; Kim, J.; Lee, D.; Han, J.; Park, S.; Lee, D.H. Bubble characteristics by pressure fluctuation analysis in gas-solid bubbling fluidized beds with or without internal. Korean J. Chem. Eng. 2017, 34, 566–573. [Google Scholar] [CrossRef]
- Chaumat, H.; Billet-Duquenne, A.M.; Augier, F.; Mathieu, C.; Delmas, H. On the reliability of an optical fibre probe in bubble column under industrial relevant operating condition. Exp. Therm. Fluid Sci. 2005, 29, 803–812. [Google Scholar] [CrossRef] [Green Version]
- Kim, S.W.; Namkung, W.; Kim, S.D. Solids Behavior in Freeboard of FCC Regenerator. J. Chem. Eng. Jpn. 2000, 33, 78–85. [Google Scholar] [CrossRef]
- Yang, W. Handbook of Fluidization and Fluid-Particle Systems; Marcel Deckker Inc.: New York, NY, USA, 2003; pp. 496–497. ISBN 978-0824702595. [Google Scholar]
- Guet, S.; Fortunati, R.V.; Mudde, R.F.; Ooms, G. Bubble velocity and size measurement with a four-point optical fiber probe. Part. Part. Syst. Charact. 2003, 20, 219–230. [Google Scholar] [CrossRef]
- Bendat, J.S.; Piersol, A.G. Random Data, Analysis and Measurement Procedures, 4th ed.; Wiley: New York, NY, USA, 2010; pp. 359–416. ISBN 978-0470248775. [Google Scholar]
- Andreux, R.; Chaouki, J. Behaviors of the bubble, cloud, and emulsion phases in a fluidized bed. AIChE J. 2008, 54, 406–414. [Google Scholar] [CrossRef]
- Sathiyamoorthy, D.; Horio, M. On the influence of aspect ratio and distributor in gas fluidized beds. Chem. Eng. J. 2003, 93, 151–161. [Google Scholar] [CrossRef]
- Sasic, S.; Leckner, B.; Johnsson, F. Time-frequency investigation of different modes of bubble flow in a gas–solid fluidized bed. Chem. Eng. J. 2006, 121, 27–35. [Google Scholar] [CrossRef]
- Johnsson, F.; Svensson, A.; Leckner, B. Fluidization Regimes in Circulating Fluidized Bed Boilers; Potter, O.E., Nicklin, O.J., Eds.; Fluidization VII; Engineering Foundation: New York, NY, USA, 1992; pp. 471–478. [Google Scholar]
- Bi, H.T.; Ellis, N.; Abba, I.A.; Grace, J.R. A state-of-the-art review of gas-solid turbulent fluidization. Chem. Eng. Sci. 2000, 55, 4789–4825. [Google Scholar] [CrossRef]
- Shaul, S.; Rabinovich, E.; Kalman, H. Typical fluidization characteristics for Geldart’s classification groups. Part. Sci. Technol. 2014, 32, 197–205. [Google Scholar] [CrossRef]
- Sauriol, P.; Cui, H.; Chaouki, J. Gas jet penetration lengths from upward and downward nozzles in dense gas–solid fluidized beds. Powder Technol. 2013, 235, 42–54. [Google Scholar] [CrossRef]
Figure 1.
Schematic diagram of FCC regenerator: (a) Experimental apparatus; (b) Distributors of upper regenerators.
Figure 1.
Schematic diagram of FCC regenerator: (a) Experimental apparatus; (b) Distributors of upper regenerators.

Figure 2.
Reflective type optical fiber probe and illustration of determination method of local void properties: (a) Reflection type optical fiber probe; (b) Typical output signal.
Figure 2.
Reflective type optical fiber probe and illustration of determination method of local void properties: (a) Reflection type optical fiber probe; (b) Typical output signal.

Figure 3.
Axial solid holdup distributions of the upper part regenerator at different gas velocity.

Figure 4.
(a) Radial profile of local void chord length at Ug = 1.00 m/s and (b) Effect of height in the bed on area-mean void chord length.
Figure 4.
(a) Radial profile of local void chord length at Ug = 1.00 m/s and (b) Effect of height in the bed on area-mean void chord length.

Figure 5.
(a) Radial profile of local void velocity at Ug = 1.00 m/s and (b) variation of area-mean void velocity with height.
Figure 5.
(a) Radial profile of local void velocity at Ug = 1.00 m/s and (b) variation of area-mean void velocity with height.

Figure 6.
(a) Radial profile of local void frequency at Ug = 1.00 m/s and (b) variation of area-mean void frequency with height.
Figure 6.
(a) Radial profile of local void frequency at Ug = 1.00 m/s and (b) variation of area-mean void frequency with height.

Figure 7.
(a) Radial profile of local void fraction at Ug = 1.00 m/s and (b) variation of area-mean void fraction with height.
Figure 7.
(a) Radial profile of local void fraction at Ug = 1.00 m/s and (b) variation of area-mean void fraction with height.

Figure 8.
Comparison of the calculated void chord length from the correlation and the experimental data.
Figure 8.
Comparison of the calculated void chord length from the correlation and the experimental data.

Figure 9.
Comparison of the calculated void parameters ϕ (a) and θ (b) defined by Equations (8) and (9) from the correlations and the experimental data.
Figure 9.
Comparison of the calculated void parameters ϕ (a) and θ (b) defined by Equations (8) and (9) from the correlations and the experimental data.

Figure 10.
Comparison of the calculated void velocity and the experimental data.


Table 1.
Physical properties of spent FCC particles.
| Properties | |
|---|---|
| Mean particle diameter [μm] | 70 |
| Apparent particle density [kg/m3] | 2130 |
| Umf [m/s] | 0.011 |
| Uc [m/s] | 0.65 |
Table 2.
A summary of experimental conditions of the present and previous studies.
| Particles | dp [mm] | ρs [kg/m3] | Ar [-] | Rep [-] | FrD [-] | Dt [m] | h [m] | |
|---|---|---|---|---|---|---|---|---|
| This study | Spent FCC | 70 | 2130 | 25 | 1.51, 1.63 | 0.46, 0.52 | 0.48 | 0.24–0.60 |
| Yamazaki et al. [9] | FCC | 64 | 1850 | 16.6 | 1.04–1.62 | 0.48–0.86 | 0.2 | 0.43 |
| Farag et al. [10] | FCC | 65 | 1500 | 14.1 | 0.50–1.06 | 0.18–0.48 | 0.3, 0.5 | 0.63 |
| Zhang and Bi [5] | FCC | 77.6 | 1565 | 25.4 | 1.37, 1.59 | 0.57, 0.72 | 0.19 | 0.35–0.85 |
© 2018 by the authors. Licensee MDPI, Basel, Switzerland. This article is an open access article distributed under the terms and conditions of the Creative Commons Attribution (CC BY) license (http://creativecommons.org/licenses/by/4.0/).
Share and Cite
MDPI and ACS Style
Kim, S.W.; Kim, S.D. Void Properties in Dense Bed of Cold-Flow Fluid Catalytic Cracking Regenerator. Processes 2018, 6, 80. https://doi.org/10.3390/pr6070080
AMA Style
Kim SW, Kim SD. Void Properties in Dense Bed of Cold-Flow Fluid Catalytic Cracking Regenerator. Processes. 2018; 6(7):80. https://doi.org/10.3390/pr6070080
Chicago/Turabian StyleKim, Sung Won, and Sang Done Kim. 2018. "Void Properties in Dense Bed of Cold-Flow Fluid Catalytic Cracking Regenerator" Processes 6, no. 7: 80. https://doi.org/10.3390/pr6070080
Note that from the first issue of 2016, this journal uses article numbers instead of page numbers. See further details here.