Development and Validation of an HPLC-DAD Method for the Simultaneous Extraction and Quantification of Bisphenol-A, 4-Hydroxybenzoic Acid, 4-Hydroxyacetophenone and Hydroquinone in Bacterial Cultures of Lactococcus lactis


Abstract
:
1. Introduction
2. Materials and Methods
2.1. Chemicals and Reagents
2.2. Standard Preparation
2.2.1. Stock Solution Preparation
2.2.2. Working Standard Solution Preparation
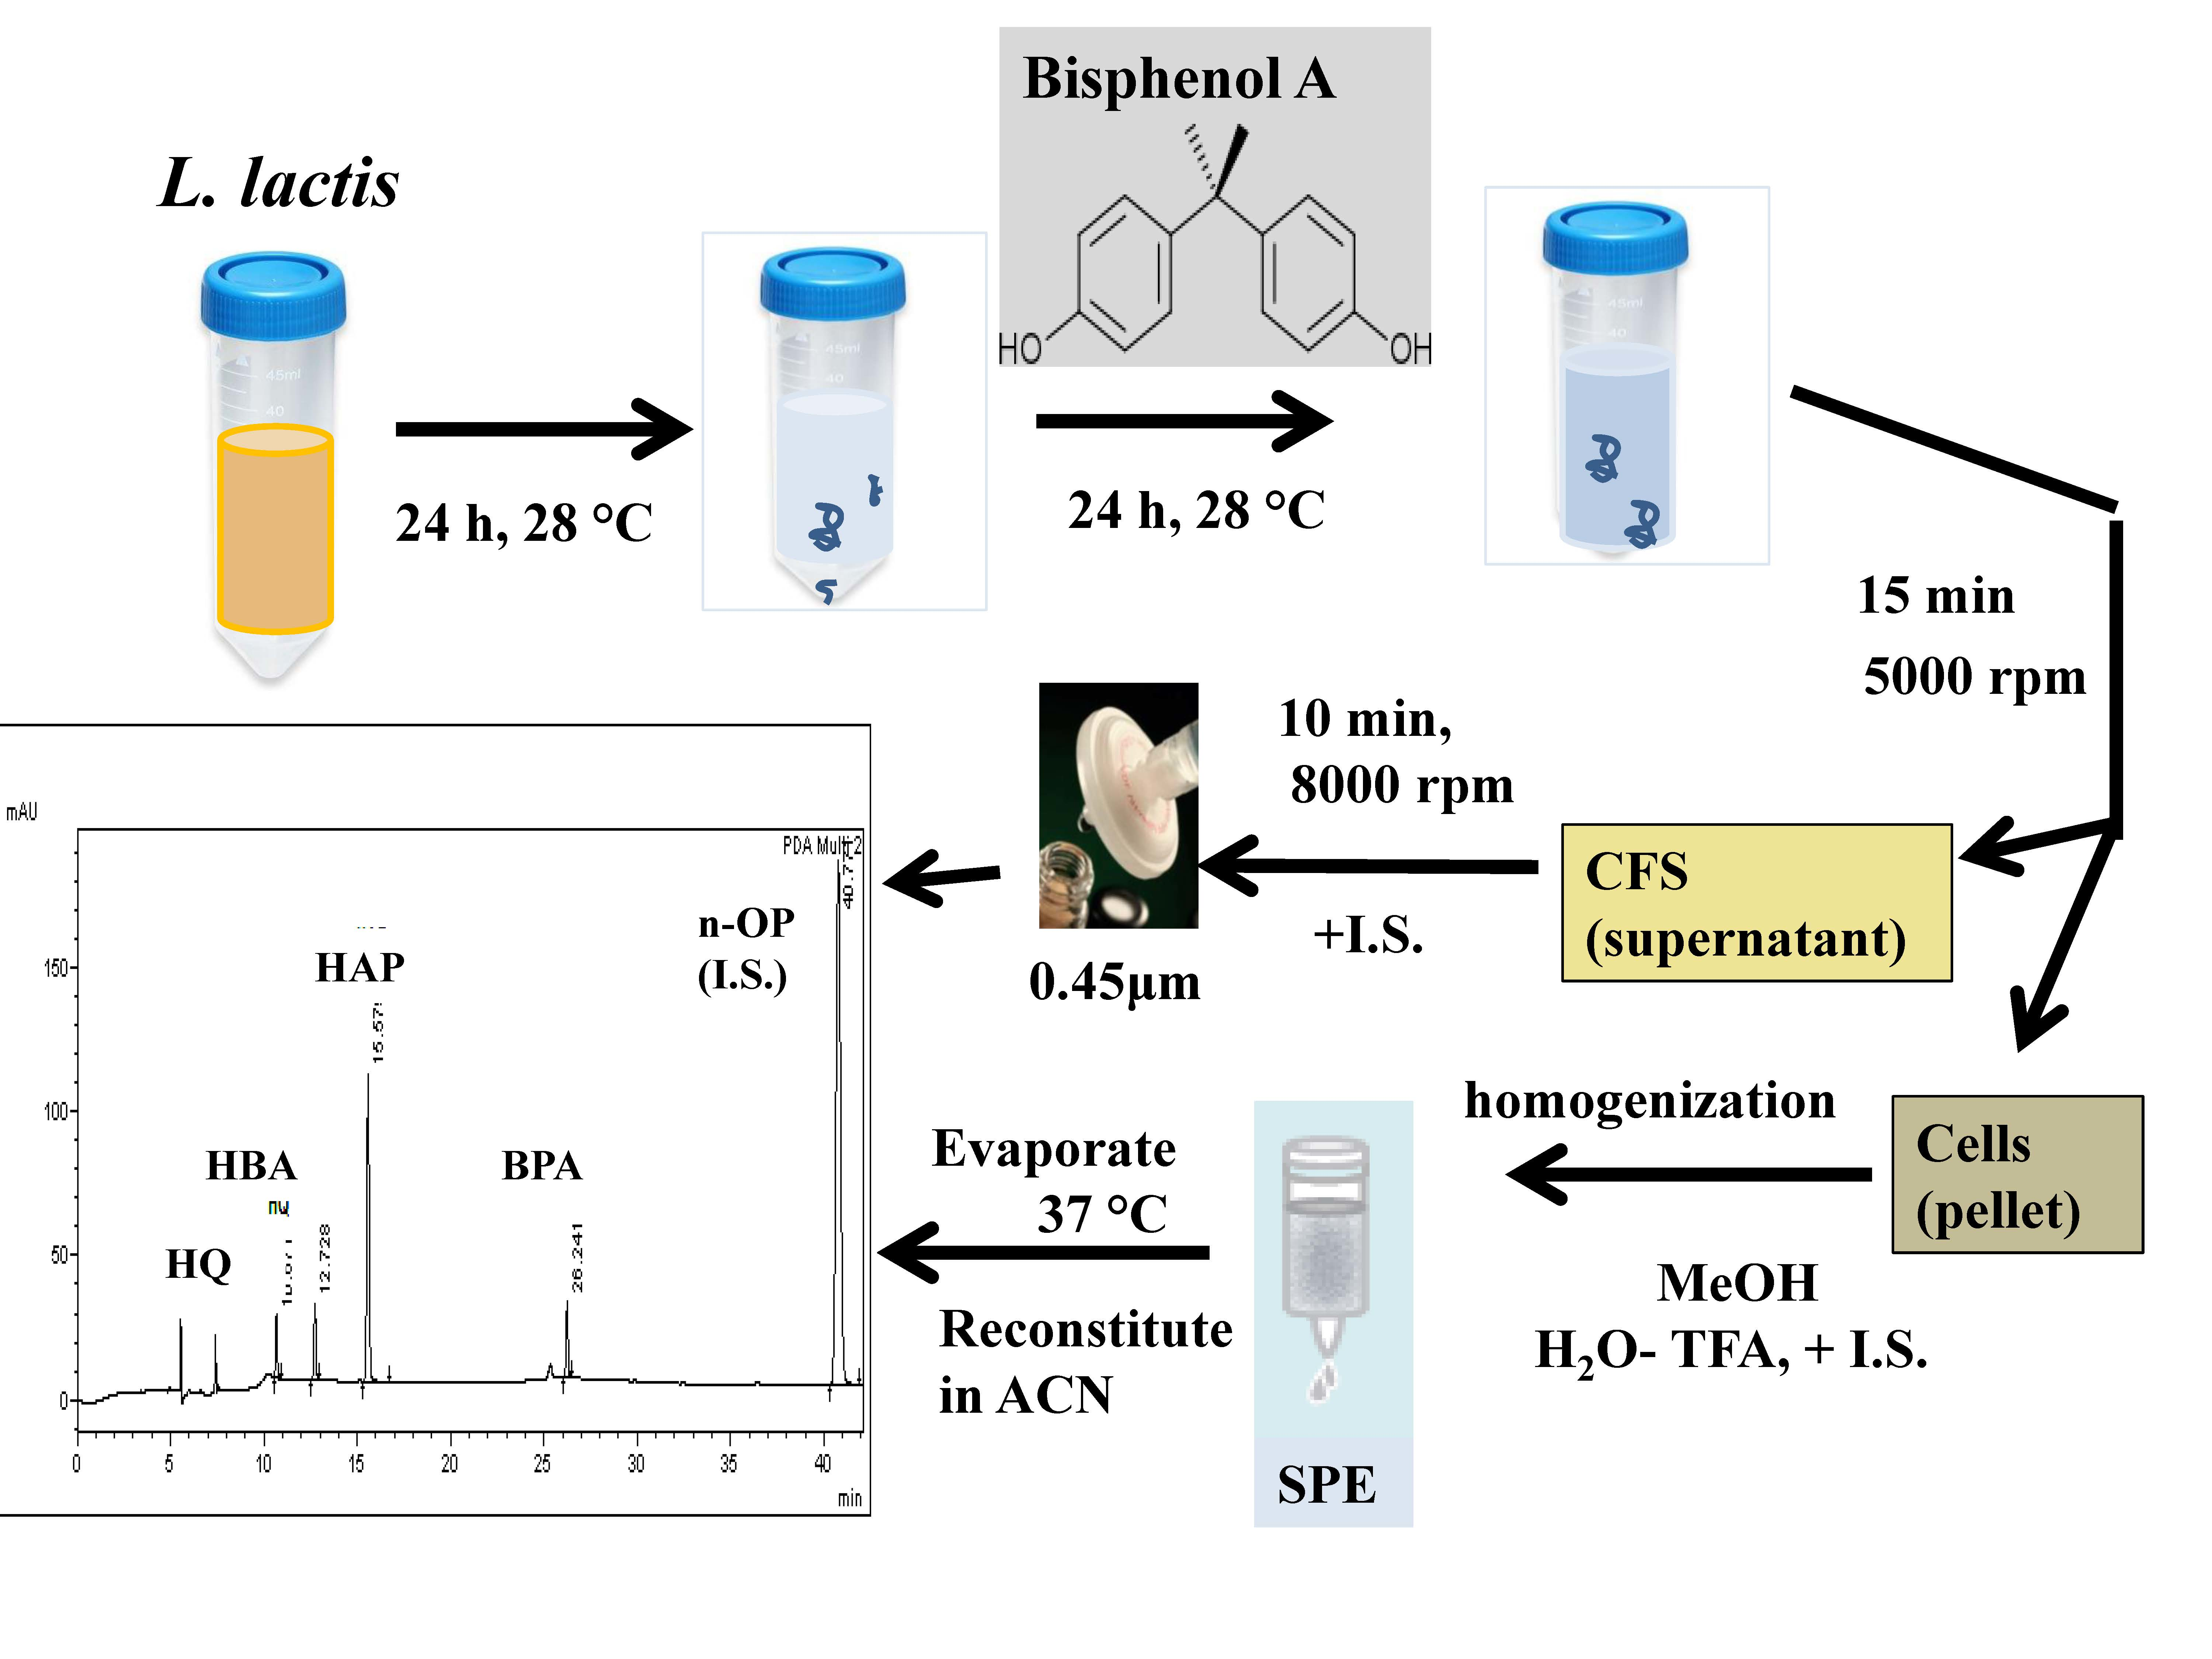
2.3. Sample Preparation
2.4. BPA Administration (Feeding) Assay
2.5. Photodegradation Assay
2.6. HPLC-DAD Conditions and Methods
3. Results and Discussion
3.1. Optimization of Sample Preparation
3.2. Method Validation
3.3. Feeding Results
4. Conclusions
Supplementary Materials
Acknowledgments
Author Contributions
Conflicts of Interest
References
- López-Cervantes, J.; Sánchez-Machado, D.; Paseiro-Losada, P.; Simal-Lozano, J. Effects Of Compression, Stacking, Vacuum Packing and Temperature on the Migration of Bisphenol A from Polyvinyl Chloride Packaging Sheeting into Food Simulants. Chromatographia 2003, 58, 327–330. [Google Scholar]
- Kang, J.-H.; Kondo, F.; Katayama, Y. Human exposure to bisphenol A. Toxicology 2006, 226, 79–89. [Google Scholar] [CrossRef] [PubMed]
- Ballesteros-Gómez, A.; Rubio, S.; Pérez-Bendito, D. Analytical methods for the determination of bisphenol A in food. J. Chromatogr. A 2009, 16, 449–469. [Google Scholar] [CrossRef] [PubMed]
- Liu, J.; Martin, J.W. Prolonged exposure to bisphenol A from single dermal contact events. Environ. Sci. Technol. 2017, 51, 9940–9949. [Google Scholar] [CrossRef] [PubMed]
- Völkel, W.; Colnot, T.; Csanady, G.; Filser, J.G.; Dekant, W. Metabolism and kinetics of bisphenol A in humans at low doses following oral administration. Chem. Res. Toxicol. 2002, 15, 1281–1287. [Google Scholar] [CrossRef] [PubMed]
- Chouhan, S.; Yadav, S.; Prakash, K.; Swati, J.; Singh, S.P. Singh Effect of bisphenol A on human health and its degradation by microorganisms: A review. Ann. Microbiol. 2014, 64, 13–21. [Google Scholar] [CrossRef]
- Kang, J.H.; Kondo, F. Bisphenol A Degradation by Bacteria Isolated from River Water. Arch. Environ. Contam. Toxicol. 2002, 43, 265–269. [Google Scholar] [CrossRef] [PubMed]
- Tsai, W.T. Human Health Risk on Environmental Exposure to Bisphenol-A: A Review. J. Environ. Sci. Health 2006, 24, 225–255. [Google Scholar] [CrossRef] [PubMed]
- Oehlmann, J.; Oetken, M.; Schulte-Oehlmann, U. A critical evaluation of the environmental risk assessment for plasticizers in the freshwater environment in Europe, with special emphasis on bisphenol A and endocrine disruption. Environ. Res. 2008, 108, 140–149. [Google Scholar] [CrossRef] [PubMed]
- Staples, C.A.; Dorn, P.B.; Klecka, G.M.; O’Block, S.T.; Harris, L.R. A review of the environmental fate, effects, and exposures of bisphenol-A. Chemosphere 1998, 36, 2149–2173. [Google Scholar] [CrossRef]
- Da Silva, J.C.C.; Reis Teodoro, J.A.; Afonso, R.J.; Aquino, S.F.; Augusti, R. Photodegradation of bisphenol A in aqueous medium: Monitoring and identification of by-products by liquid chromatography coupled to high-resolution mass spectrometry. Rapid Commun. Mass Spectrom. 2014, 28, 987–994. [Google Scholar] [CrossRef] [PubMed]
- Diepens, M.; Gijsman, P. Photodegradation of bisphenol A polycarbonate. Polym. Degrad. Stab. 2007, 92, 397–406. [Google Scholar] [CrossRef]
- Suzuki, T.; Nakagawa, Y.; Takano, I.; Yaguchi, K.; Yasuda, K. Environmental Fate of Bisphenol A and Its Biological Metabolites in River Water and Their Xeno-estrogenic Activity. Environ. Sci. Technol. 2004, 38, 2389–2396. [Google Scholar] [CrossRef] [PubMed]
- Zhang, W.; Yin, K.; Chen, L. Bacteria-mediated bisphenol A degradation. Appl. Microbiol. Biotechnol. 2013, 97, 5681–5689. [Google Scholar] [CrossRef] [PubMed]
- Kang, J.H.; Katayama, Y.; Kondo, F. Biodegradation or metabolism of bisphenol A: From microorganisms to mammals. Toxicology 2006, 217, 81–90. [Google Scholar] [CrossRef] [PubMed]
- Kolvenbach, B.A.; Helbling, D.E.; Kohler, H.P.E.; Corvini, P.F.X. Emerging chemicals and the evolution of biodegradation capacities and pathways in bacteria. Curr. Opin. Biotechnol. 2014, 27, 8–14. [Google Scholar] [CrossRef] [PubMed]
- Giarma, E.; Amanetidou, E.; Toufexi, A.; Touraki, M. Defense systems in developing Artemia franciscana nauplii and their modulation by probiotic bacteria offer protection against a Vibrio anguillarum challenge. Fish Shellfish Immunol. 2017, 66, 163–172. [Google Scholar] [CrossRef] [PubMed]
- Oishi, K.; Sato, T.; Yokoi, W.; Yoshida, Y.; Ito, M.; Sawada, H. Effect of probiotics, Bifidobacterium breve and Lactobacillus casei, on bisphenol A exposure in rats. Biosci. Biotechnol. Biochem. 2008, 72, 1409–1415. [Google Scholar] [CrossRef] [PubMed]
- Monachese, M.; Burton, J.P.; Reid, G. Bioremediation and tolerance of humans to heavy metals through microbial processes: A potential role for probiotics? Appl. Environ. Microbiol. 2012, 78, 6397–6404. [Google Scholar] [CrossRef] [PubMed]
- Yamanaka, H.; Moriyoshi, K.; Ohmoto, T.; Ohe, T.; Sakai, K. Degradation of bisphenol A by Bacillus pumilus isolated from kimchi, a traditionally fermented food. Appl. Biochem. Biotechnol. 2007, 136, 39–51. [Google Scholar] [CrossRef] [PubMed]
- Vijayalakshmi, G.; Ramadas, V.; Nellaiah, H. Isolation, indentification and degradation of Biphenol A by Bacillus sp. from effluents of thermal paper industry. Int. J. Sci. Eng. Res. 2013, 4, 366–374. [Google Scholar]
- Zühlke, M.K.; Schlüter, R.; Henning, A.K.; Lipka, M.; Mikolasch, A.; Schumann, P.; Giersberg, M.; Kunze, G.; Schauer, F. A novel mechanism of conjugate formation of bisphenol A and its analogues by Bacillus amyloliquefaciens: Detoxification and reduction of estrogenicity of bisphenols. Int. Biodeterior. Biodegrad. 2016, 109, 165–173. [Google Scholar] [CrossRef]
- Endo, Y.; Kimura, N.; Ikeda, I.; Fujimoto, K.; Kimoto, H. Adsorption of bisphenol A by lactic acid bacteria, Lactococcus, strains. Appl. Microbiol. Biotechnol. 2007, 74, 202–207. [Google Scholar] [CrossRef] [PubMed]
- Fujiwara, H.; Soda, S.; Fujita, M.; Ike, M. Kinetics of bisphenol A degradation by Sphingomonas paucimobilis FJ-4. J. Biosci. Bioeng. 2016, 122, 341–344. [Google Scholar] [CrossRef] [PubMed]
- Im, J.; Yip, D.; Lee, J.; Löffler, F.E. Simplified extraction of bisphenols from bacterial culture suspensions and solid matrices. J. Microbiol. Methods 2016, 126, 35–37. [Google Scholar] [CrossRef] [PubMed]
- Spivack, J.; Leib, T.K.; Lobos, J.H. Novel Pathway for Bacterial Metabolism of Bisphenol A. J. Biol. Chem. 1994, 269, 7323–7329. [Google Scholar] [PubMed]
- Lobos, J.H.; Leib, T.K.; Su, T.M. Biodegradation of bisphenol A and other bisphenols by a gram-negative aerobic bacterium. Appl. Environ. Microbiol. 1992, 58, 1823–1831. [Google Scholar] [PubMed]
- Rykowska, I.; Wasiak, W. Properties, threats, and methods of analysis of bisphenol A and its derivatives. Acta Chromatogr. 2006, 16, 7–27. [Google Scholar]
- Xiao, Q.; Li, Y.; Ouyang, H.; Xu, P.; Wu, D. High-performance liquid chromatographic analysis of bisphenol A and 4-nonylphenol in serum, liver and testis tissues after oral administration to rats and its application to toxicokinetic study. J. Chromatogr. B 2006, 830, 322–329. [Google Scholar] [CrossRef] [PubMed]
- Samanidou, V.F.; Frysali, M.A.; Papadoyannis, I.N. Matrix solid phase dispersion for the extraction of bisphenol A from human breast milk prior to HPLC analysis. J. Liquid Chromatogr. Relat. Technol. 2014, 37, 247–258. [Google Scholar] [CrossRef]
- Samanidou, V.F.; Kerezoudi, C.; Tolika, E.; Palaghias, G. A Simple Isocratic HPLC Method for the Simultaneous Determination of the Five Most Common Residual Monomers Released from Resin-Based Dental Restorative Materials. J. Liquid Chromatogr. Relat. Technol. 2015, 38, 740–749. [Google Scholar] [CrossRef]
- Samanidou, V.; Hadjicharalampous, M.; Palaghias, G.; Papadoyannis, I. Development and validation of an isocratic HPLC method for the simultaneous determination of residual monomers released from dental polymeric materials in artificial saliva. J. Liquid Chromatogr. Relat. Technol. 2012, 35, 511–523. [Google Scholar] [CrossRef]
- Asimakopoulos, A.G.; Thomaidis, N.S.; Koupparis, M.A. Recent trends in biomonitoring of bisphenol A, 4-t-octylphenol, and 4-nonylphenol. Toxicol. Lett. 2012, 210, 141–154. [Google Scholar] [CrossRef] [PubMed]
- Chen, G.W.; Ding, W.H.; Ku, H.Y.; Chao, H.R.; Chen, H.Y.; Huang, M.C.; Wang, S.L. Alkylphenols in human milk and their relations to dietary habits in central Taiwan. Food Chem. Toxicol. 2010, 48, 1939–1944. [Google Scholar] [CrossRef] [PubMed]
- Luo, L.; Yang, Y.; Wang, Q.; Li, H.P.; Luo, Z.F.; Qu, Z.P.; Yang, Z.G. Determination of 4-n-octylphenol, 4-n-nonylphenol and bisphenol A in fish samples from lake and rivers within Hunan Province China. Microchem. J. 2017, 132, 100–106. [Google Scholar] [CrossRef]
- Neamtu, M.; Frimmel, F.H. Degradation of endocrine disrupting bisphenol A by 254 nm irradiation in different water matrices and effect on yeast cells. Water Res. 2006, 40, 3745–3750. [Google Scholar] [CrossRef] [PubMed]
- Matsumura, Y.; Hosokawa, C.; Sasaki-Mori, M.; Akahira, A.; Fukunaga, K.; Ikeuchi, T.; Oshiman, K.; Tsuchido, T. Isolation and characterization of novel bisphenol-A-degrading bacteria from soils. Biocontrol Sci. 2009, 14, 161–169. [Google Scholar] [CrossRef] [PubMed]
- Beltran-Heredia, J.; Torregrosa, J.; Dominguez, J.R.; Peres, J.A. Comparison of the degradation of p-hydroxybenzoic acid in aqueous solution by several oxidation processes. Chemosphere 2001, 42, 351–359. [Google Scholar] [CrossRef]
- Abbas, S.S.; Elghobashy, M.R.; Bebawy, L.I.; Shokry, R.F. Stability-indicating chromatographic determination of hydroquinone in combination with tretinoin and fluocinolone acetonide in pharmaceutical formulations with a photodegradation kinetic study. RSC Adv. 2015, 5, 43178–43194. [Google Scholar] [CrossRef]
- Eio, E.J.; Kawai, M.; Tsuchiya, K.; Yamamoto, S.; Toda, T. Biodegradation of bisphenol A by bacterial consortia. Int. Biodeterior. Biodegrad. 2014, 96, 166–173. [Google Scholar] [CrossRef]


| Analyte in Media/Std. Curve Equation/R2 | Nominal Conc. (μg/mL) | Mean Calculated Concentration (μg/mL) (Mean ± SD) | Relative Bias (%) | Precision | Recovery Rate (Mean ± SD) | |
|---|---|---|---|---|---|---|
| Intra-Day (RSD %) | Inter-Day (RSD %) | |||||
| BPA in BSM Supernatant y = 0.0295x + 0.0077 1 | 0.5 | 0.48 ± 0.05 | −3.6 | 8.7 | 10.4 | 96 ± 13 |
| 10 | 9.94 ± 0.08 | −0.6 | 0.1 | 0.8 | 99.4 ± 0.7 | |
| 50 | 50.2 ± 0.7 | 0.4 | 0.8 | 1.4 | 100 ± 1 | |
| 100 | 100 ± 2 | 0.05 | 0.8 | 1.7 | 100 ± 1 | |
| 200 | 200 ± 2 | −0.2 | 0.7 | 1.2 | 100 ± 1 | |
| 400 | 401 ± 3 | 0.2 | 0.2 | 0.8 | 100.2 ± 0.6 | |
| 600 | 600 ± 3 | −0.01 | 0.3 | 0.6 | 100.0 ± 0.5 | |
| BPA in L. lactis precipitate y = 0.0232x + 0.0092 0.9999 | 0.5 | 0.41 ± 0.03 | −18.5 | 3.2 | 7.4 | 82 ± 5 |
| 10 | 9.1 ± 0.4 | −9.2 | 2.3 | 4.7 | 91 ± 4 | |
| 50 | 48± 1 | −3.7 | 2.7 | 2.7 | 96 ± 2 | |
| 100 | 98 ± 3 | −2.0 | 2.0 | 2.9 | 98 ± 2 | |
| 200 | 205 ± 3 | 2.5 | 0.4 | 1.4 | 103 ± 1 | |
| 400 | 400.6 ± 0.9 | 0.2 | 0.2 | 0.2 | 100 ± 0.2 | |
| 600 | 597 ± 5 | −0.6 | 0.1 | 0.8 | 99.4 ± 0.7 | |
| HAP in BSM y = 0.202x + 0.0134 0.9994 | 0.5 | 0.52 ± 0.02 | 3.4 | 2.8 | 3.8 | 103 ± 3 |
| 2 | 2.06 ± 0.05 | 2.9 | 0.2 | 2.4 | 103 ± 2 | |
| 4 | 3.84 ± 0.04 | −4.1 | 0.7 | 1.0 | 95.9 ± 0.8 | |
| 6 | 6.1 ± 0.1 | 1.1 | 1.0 | 2.3 | 101 ± 2 | |
| 8 | 8.0 ± 0.2 | 0.6 | 2.1 | 2.2 | 101 ± 2 | |
| 10 | 10.0 ± 0.1 | −0.3 | 0.3 | 1.0 | 99.7 ± 0.8 | |
| HBA in BSM y = 0.0407x + 0.0073 0.994 | 1 | 0.91 ± 0.03 | −9.5 | 2.7 | 3.3 | 90 ± 2 |
| 2 | 1.86 ± 0.04 | −6.9 | 0.3 | 2.2 | 93 ± 3 | |
| 4 | 4.1 ± 0.2 | 2.3 | 3.2 | 4.2 | 102 ± 2 | |
| 6 | 6.2 ± 0.1 | 3.0 | 2.1 | 2.3 | 103 ± 2 | |
| 8 | 8.3 ± 0.3 | 4..2 | 3.0 | 3.1 | 104 ± 3 | |
| 10 | 9.62 ± 0.04 | −3.8 | 0.3 | 0.4 | 96.2 ± 0.3 | |
| HQ in BSM y = 0.0351x − 0.0082 0.999 | 0.5 | 0.48 ± 0.01 | −3.8 | 1.4 | 2.1 | 96 ± 2 |
| 2 | 2.2 ± 0.1 | 7.5 | 3.4 | 6.5 | 108 ± 5 | |
| 4 | 3.91 ± 0.03 | −2.2 | 0.03 | 0.8 | 97.8 ± 0.6 | |
| 6 | 5.91 ± 0.09 | −1.5 | 1.6 | 1.5 | 98 ± 1 | |
| 8 | 7.9 ± 0.2 | −1.4 | 0.5 | 2.0 | 99 ± 2 | |
| 10 | 10.1 ± 0.2 | 1.3 | 1.4 | 2.2 | 101 ± 2 | |
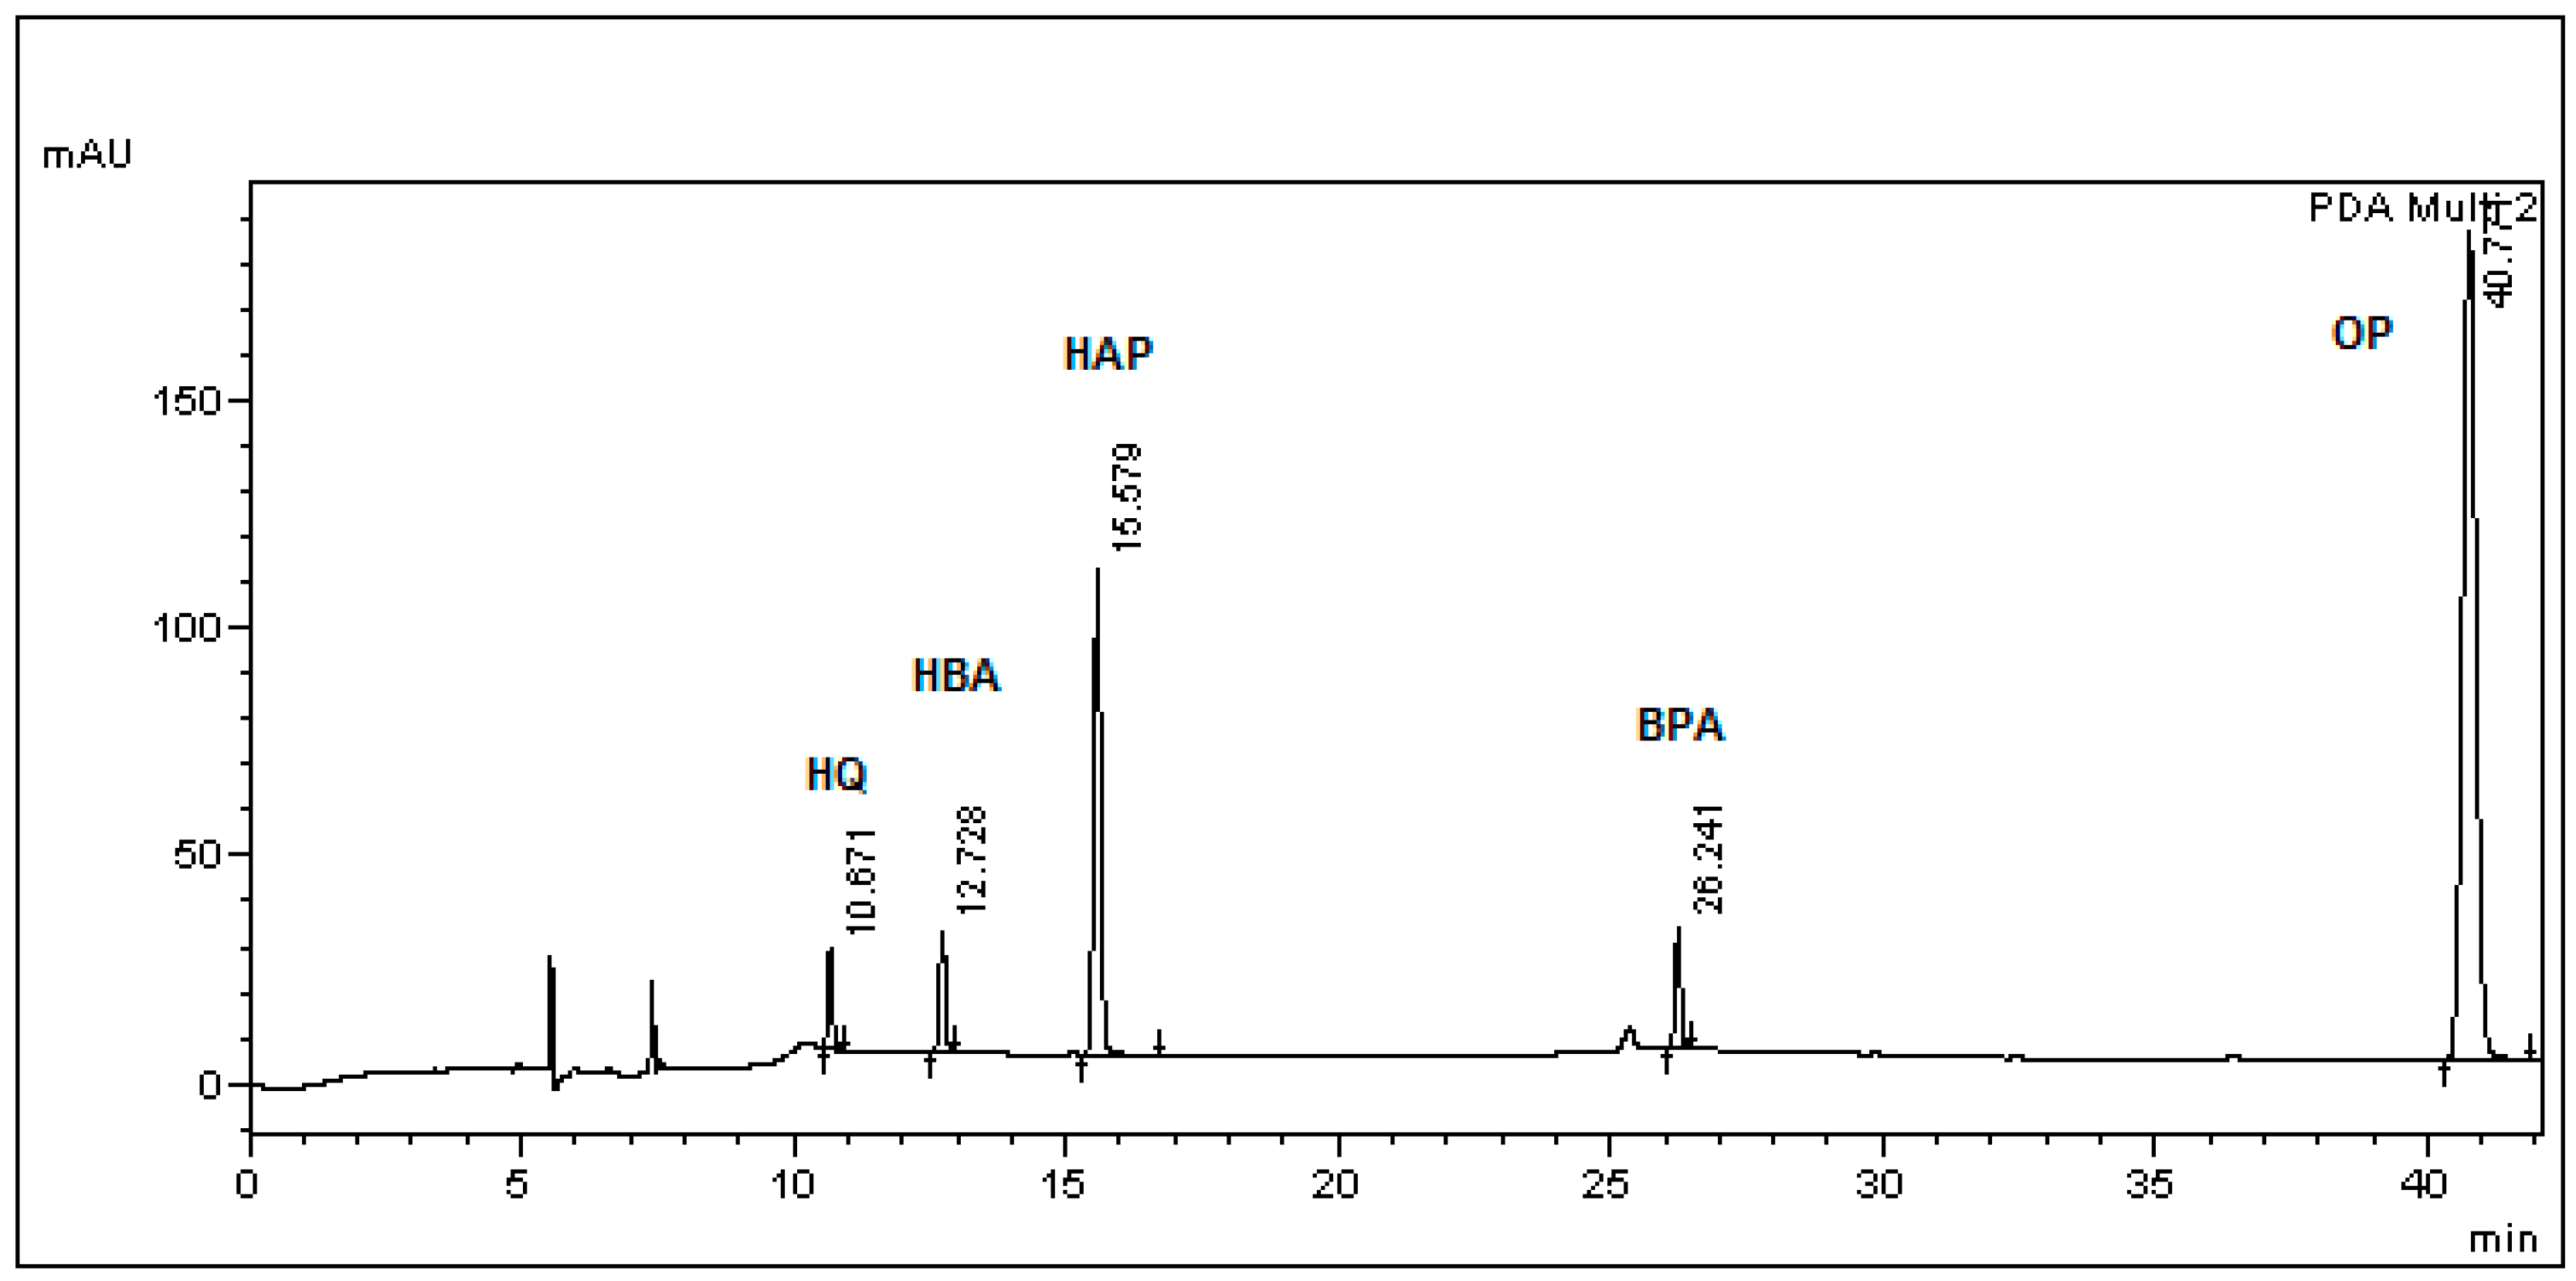
| Std. Curve | Retention Time (Min) Mean ± SD (RSD %) | LOD (μg/mL) | LOQ (μg/mL) |
|---|---|---|---|
| BPA in L. lactis | 26.68 ± 0.13 (0.41) | 4.99 | 15.01 |
| BPA in BSM | 26.71 ± 0.09 (0.38) | 0.64 | 1.93 |
| HAP in BSM | 15.66 ± 0.05 (0.29) | 0.24 | 0.73 |
| HBA in BSM | 12.77 ± 0.12 (0.23) | 0.73 | 2.21 |
| HQ in BSM | 10.80 ± 0.08 (0.90) | 0.32 | 0.98 |
| BPA Administered in 50 mL Culture (μg) | BPA Found in Precipitate | BPA Found in 50 mL Supernatant | Total BPA Found | Concentration Decline in Cultures (%) |
|---|---|---|---|---|
| (μg) | ||||
| 2500 (50 μg/mL) | 46.77 | 196.46 | 243.23 | 90.27 |
| 5000 (100 μg/mL) | 110.48 | 1681.74 | 1792.22 | 64.16 |
| 7500 (150 μg/mL) | 255.75 | 2849.48 | 3105.23 | 58.60 |
| 10,000 (200 μg/mL) | 262.20 | 2964.01 | 3226.22 | 67.74 |
| 20,000 (400 μg/mL) | 437.24 | 3595.83 | 4033.07 | 79.83 |
| 25,000 (500 μg/mL) | 421.16 | 3316.41 | 3737.57 | 85.05 |
© 2018 by the authors. Licensee MDPI, Basel, Switzerland. This article is an open access article distributed under the terms and conditions of the Creative Commons Attribution (CC BY) license (http://creativecommons.org/licenses/by/4.0/).
Share and Cite
Rigopoulos, A.T.; Samanidou, V.F.; Touraki, M. Development and Validation of an HPLC-DAD Method for the Simultaneous Extraction and Quantification of Bisphenol-A, 4-Hydroxybenzoic Acid, 4-Hydroxyacetophenone and Hydroquinone in Bacterial Cultures of Lactococcus lactis. Separations 2018, 5, 12. https://doi.org/10.3390/separations5010012
Rigopoulos AT, Samanidou VF, Touraki M. Development and Validation of an HPLC-DAD Method for the Simultaneous Extraction and Quantification of Bisphenol-A, 4-Hydroxybenzoic Acid, 4-Hydroxyacetophenone and Hydroquinone in Bacterial Cultures of Lactococcus lactis. Separations. 2018; 5(1):12. https://doi.org/10.3390/separations5010012
Chicago/Turabian StyleRigopoulos, Angelos T., Victoria F. Samanidou, and Maria Touraki. 2018. "Development and Validation of an HPLC-DAD Method for the Simultaneous Extraction and Quantification of Bisphenol-A, 4-Hydroxybenzoic Acid, 4-Hydroxyacetophenone and Hydroquinone in Bacterial Cultures of Lactococcus lactis" Separations 5, no. 1: 12. https://doi.org/10.3390/separations5010012