Investigation of Hg Content by a Rapid Analytical Technique in Mediterranean Pelagic Fishes


Abstract
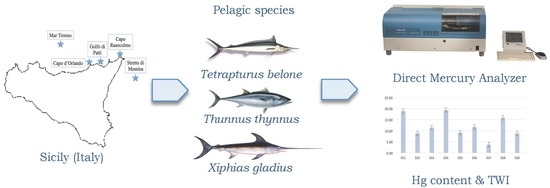
1. Introduction
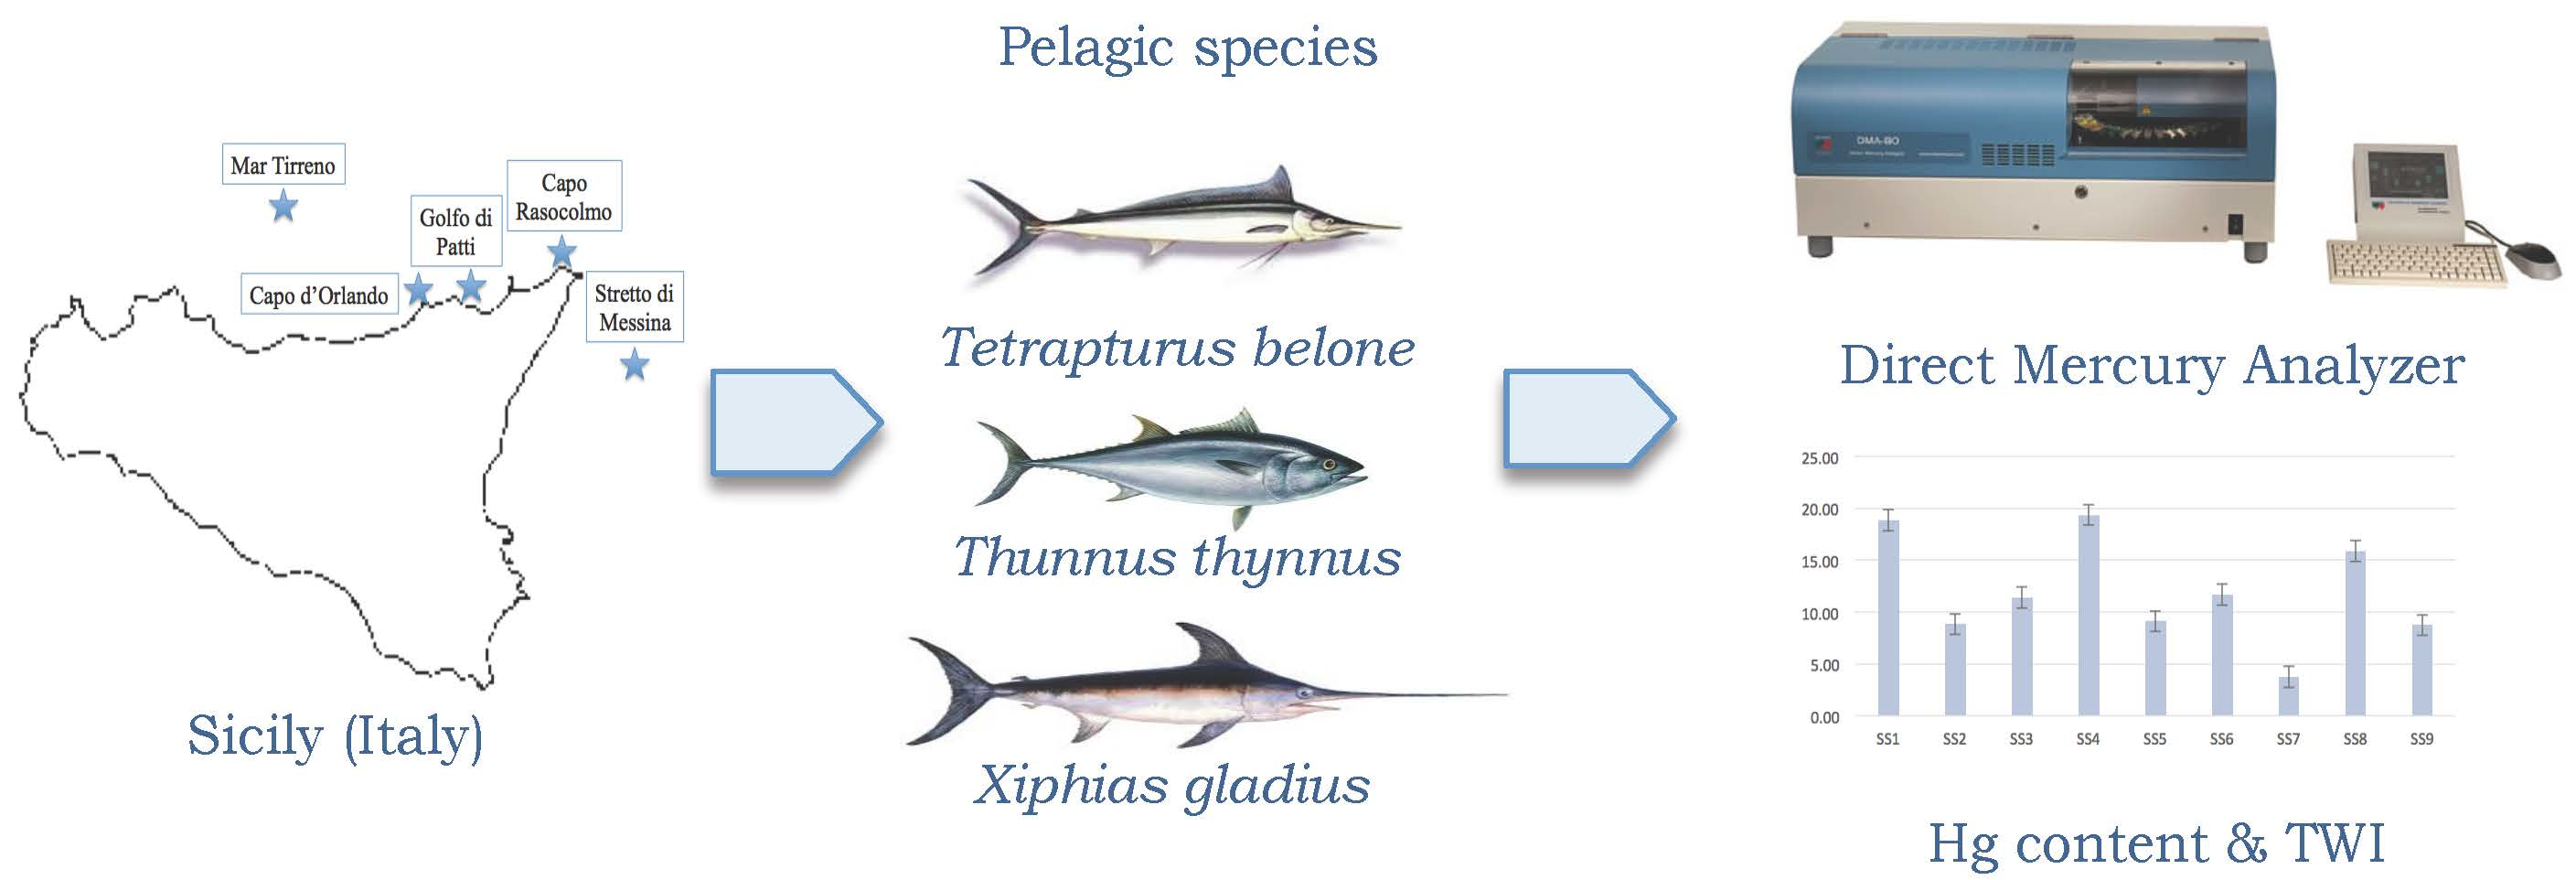
2. Materials and Methods
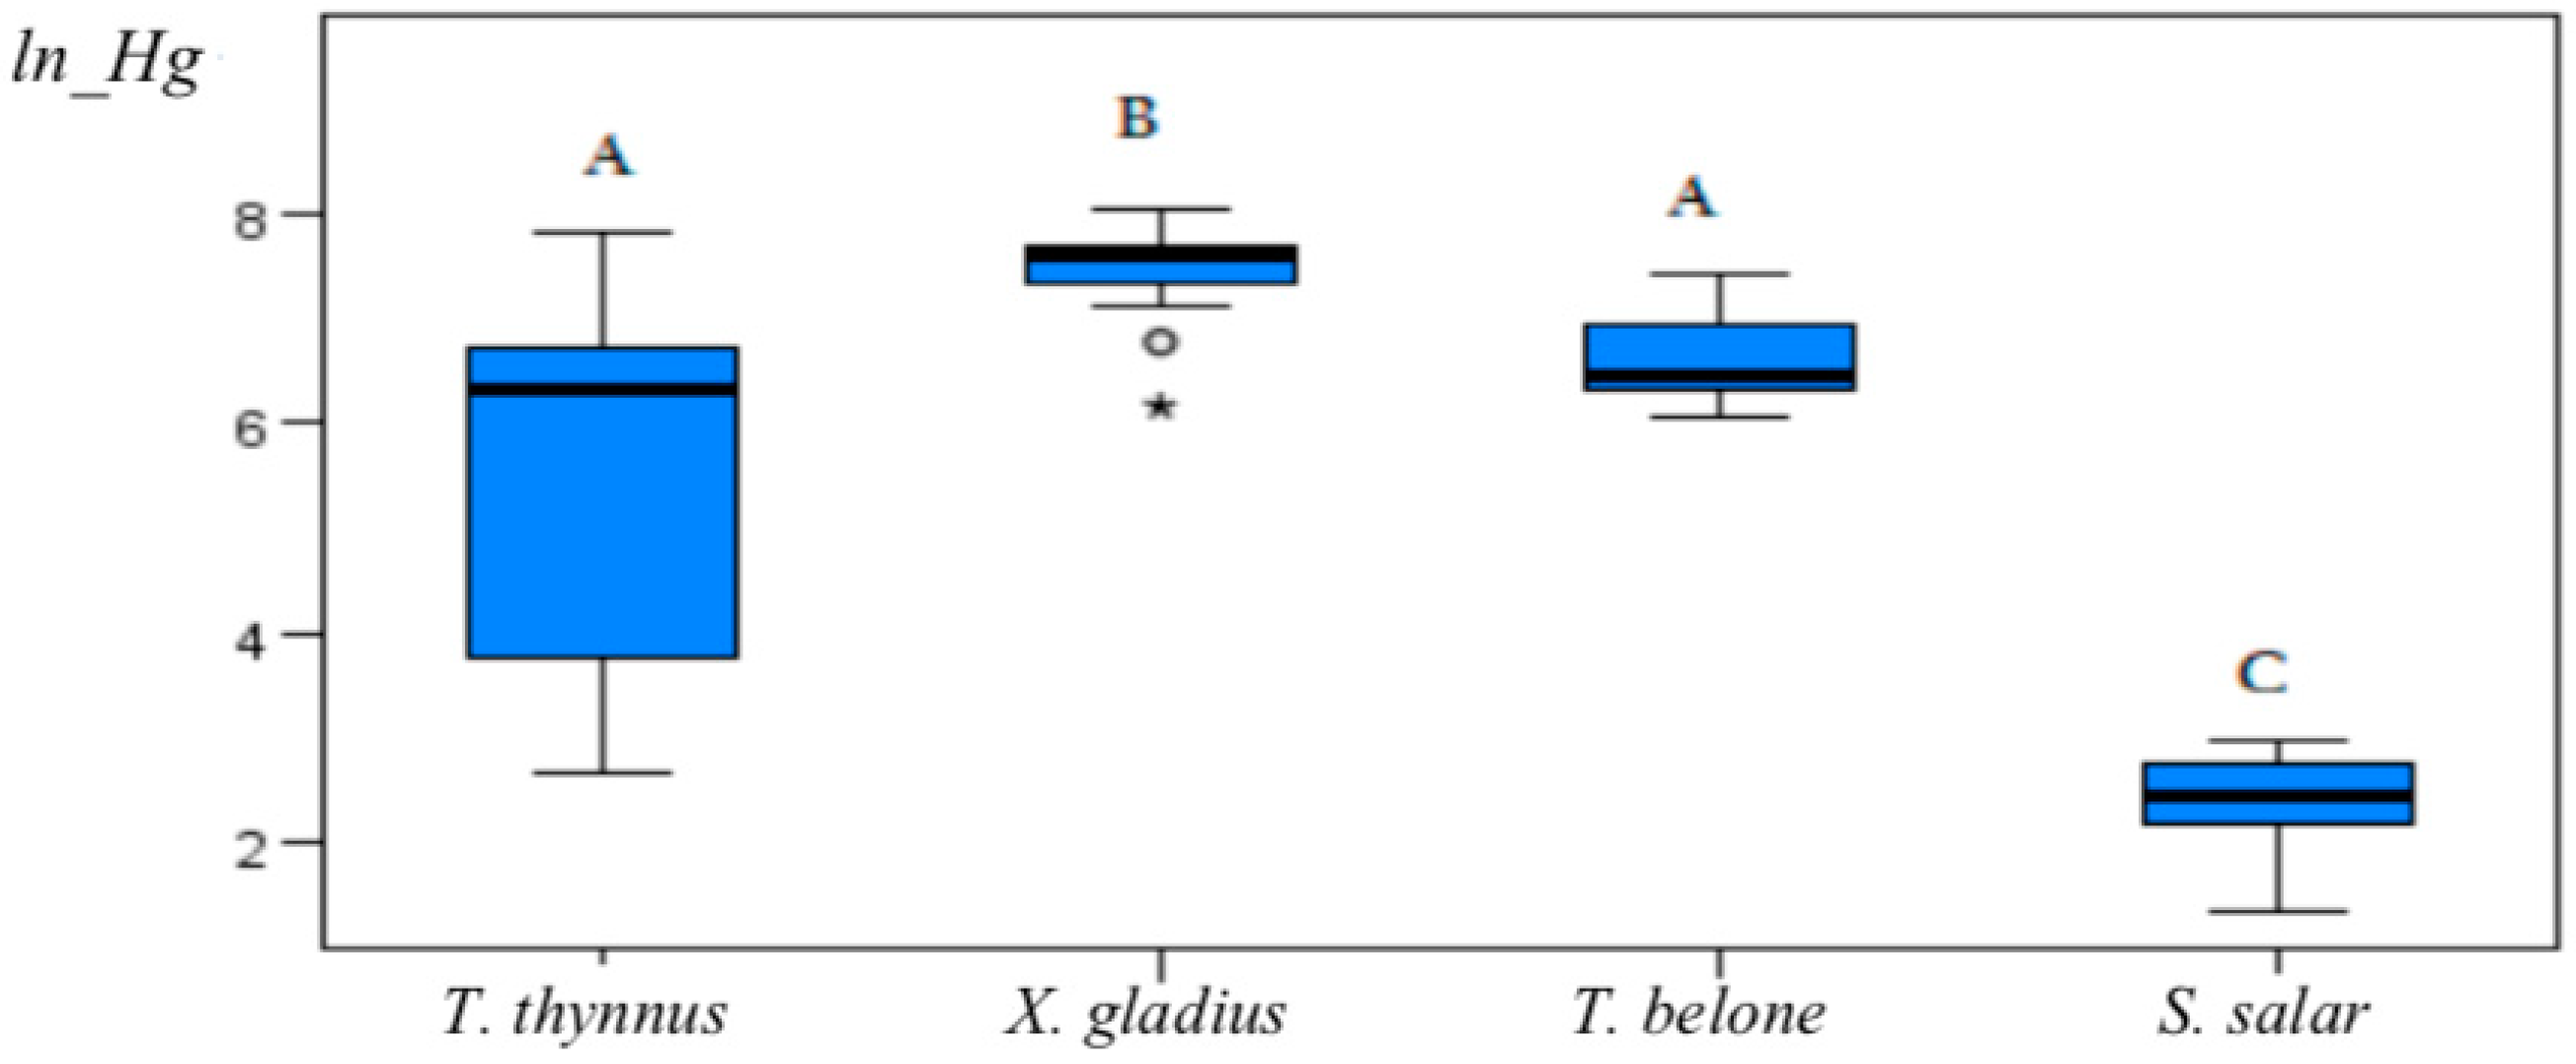
3. Results
4. Discussion
5. Conclusions
Author Contributions
Funding
Conflicts of Interest
References
- Metro, D.; Tardugno, R.; Papa, M.; Bisignano, C.; Manasseri, L.; Calabrese, G.; Gervasi, T.; Dugo, G.; Cicero, N. Adherence to the Mediterranean diet in a Sicilian student population. Nat. Prod. Res. 2017, 32, 1775–1781. [Google Scholar] [CrossRef] [PubMed]
- Metro, D.; Papa, M.; Manasseri, L.; Gervasi, T.; Campone, L.; Pellizzeri, V.; Tardugno, R.; Dugo, G. Mediterranean diet in a Sicilian student population. Second part: Breakfast and its nutritional profile. Nat. Prod. Res. 2018. [Google Scholar] [CrossRef] [PubMed]
- European Food Safety Authority. Scientific Opinion on the risk for public health related to the presence of mercury and methylmercury in food. EFSA J. 2012, 10, 2985. [Google Scholar]
- Cammilleri, G.; Vazzana, M.; Arizzal, V.; Giunta, F.; Vella, A.; Lo Dico, G.; Giaccone, V.; Giofrè, S.V.; Giangrosso, G.; Cicero, N.; et al. Mercury in fish products: What’s the best for consumers between blue tuna and yellow tuna? Nat. Prod. Res. 2017, 32, 457–462. [Google Scholar] [CrossRef] [PubMed]
- Di Bella, G.; Potortì, A.G.; Lo Turco, V.; Bua, D.; Licata, P.; Cicero, N.; Dugo, G. Trace elements in Thunnus thynnus from Mediterranean Sea and benefit–risk assessment for consumers. Food Addit. Contam. B 2015, 8, 175–181. [Google Scholar] [CrossRef] [PubMed]
- Di Bella, G.; Pizzullo, G.; Bua, G.D.; Potortì, A.G.; Santini, A.; Giacobbe, S. Mapping toxic mineral contamination: The southern oyster drill, S. haemastoma (L., 1767), as evaluable sentinel species. Environ. Monit. Assess. 2018, 190, 7. [Google Scholar] [CrossRef] [PubMed]
- Di Bella, G.; Russo, E.; Dugo, G. Heavy metals and Persistent Organic Pollutants in marine organisms from two Sicilian protected areas: Strait of Messina and Cape Peloro lakes. Curr. Org. Chem. 2017, 21, 387–394. [Google Scholar] [CrossRef]
- Graci, S.; Collura, R.; Cammilleri, G.; Buscemi, M.D.; Giangrosso, G.; Principato, D.; Gervasi, T.; Cicero, N.; Ferrantelli, V. Mercury accumulation in mediterranean fish and cephalopods species of sicilian coasts: Correlation between pollution and the presence of anisakis parasites. Nat. Prod. Res. 2017, 31, 1156–1162. [Google Scholar] [CrossRef] [PubMed]
- Salvo, A.; Potortì, A.G.; Cicero, N.; Bruno, M.; Lo Turco, V.; Di Bella, G.; Dugo, G. Statistical characterisation of heavy metal contents in Paracentrotus lividus from Mediterranean Sea. Nat. Prod. Res. 2014, 28, 718–726. [Google Scholar] [CrossRef] [PubMed]
- Lo Turco, V.; Di Bella, G.; Furci, P.; Cicero, N.; Pollicino, G.; Dugo, G. Heavy metals content by ICP-OES in Sarda sarda, Sardinella aurita and Lepidopus caudatus from the Strait of Messina (Sicily, Italy). Nat. Prod. Res. 2013, 27, 518–523. [Google Scholar] [CrossRef] [PubMed]
- Eisler, R. Fishes. In Compendium of Trace Metals and Marine Biota; Elsevier: Amsterdam, The Netherlands, 2010; Chapter 3; pp. 39–220. ISBN 9780444534392. [Google Scholar]
- Di Bella, G.; Licata, P.; Bruzzese, A.; Naccari, C.; Trombetta, D.; Lo Turco, V.; Dugo, G.; Richetti, A.; Naccari, F. Levels and congener pattern of polychlorinated biphenyl and organochlorine pesticide residues in bluefin tuna (Thunnus thynnus) from the Straits of Messina (Sicily-Italy). Environ. Int. 2006, 32, 705–710. [Google Scholar] [CrossRef] [PubMed]
- Bodin, N.; Lesperance, D.; Albert, R.; Holland, S.; Michaud, P. Trace elements in oceanic pelagic communities in the western Indian Ocean. Chemosphere 2017, 174, 354–362. [Google Scholar] [CrossRef] [PubMed]
- Covaci, E.; Senila, M.; Ponta, M.; Darvasi, E.; Frentiu, M.; Frentiu, T. Mercury speciation in seafood using non-chromatographic chemical vapor generation capacitively coupled plasma microtorch optical emission spectrometry method e Evaluation of methylmercury exposure. Food Control 2017, 82, 266–273. [Google Scholar] [CrossRef]
- Nøstbakken, O.J.; Hove, H.T.; Duinker, A.; Lundebye, A.K.; Berntssen, M.H.G.; Hannisdal, R.; Lunestad, B.T.; Maage, A.; Madsen, L.; Torstensen, B.E.; et al. Contaminant levels in Norwegian farmed Atlantic salmon (Salmo salar) in the 13-year period from 1999 to 2011. Environ. Int. 2015, 74, 274–280. [Google Scholar] [CrossRef] [PubMed]
- EC (European Commission). Commission Regulation No 1881/2006 of 19 December 2006 Setting Maximum Levels for Certain Contaminants in Foodstuffs (Text with EEA Relevance). 2006. Available online: http://faolex.fao.org/docs/pdf/eur68134.pdf (accessed on 16 October 2018).


| Sample | Site | Length (cm) | Weight (kg) | Hg (mg kg−1) a |
|---|---|---|---|---|
| TT0032 | Rasocolmo Cape | 26.80 | 0.32 | 0.0562 ± 0.0032 |
| TT0033 | Rasocolmo Cape | 27.00 | 0.36 | 0.0833 ± 0.0035 |
| TT005 | d’Orlando Cape | 20.00 | 0.22 | 0.0192 ± 0.0007 |
| TT094 | Patti Gulf | 195.00 | 150.00 | 0.5570 ± 0.0413 |
| TT0951 | Patti Gulf | 115.00 | 28.00 | 0.7057 ± 0.0275 |
| TT0952 | Patti Gulf | 240.00 | 180.00 | 0.9057 ± 0.0514 |
| TT0953 | Patti Gulf | 90.00 | 16.00 | 0.7697 ± 0.0265 |
| TT096 | Southern Tyrrhenian sea | 15.40 | 0.15 | 0.0146 ± 0.0028 |
| TT097 | Southern Tyrrhenian sea | 24.80 | 0.30 | 0.0348 ± 0.0140 |
| TT158 | Strait of Messina | 128.00 | 36.00 | 1.3689 ± 0.0631 |
| TT159 | Strait of Messina | 165.00 | 66.00 | 2.5618 ± 0.4609 |
| XG321 | Strait of Messina | 173.00 | 74.00 | 2.0623 ± 0.2434 |
| XG330 | Strait of Messina | 52.00 | 5.00 | 0.4775 ± 0.0287 |
| XG343 | Strait of Messina | 171.00 | 58.00 | 0.8837 ± 0.0279 |
| XG344 | Strait of Messina | 170.00 | 61.00 | 2.1336 ± 0.0908 |
| XG352 | Strait of Messina | 161.00 | 55.00 | 2.2072 ± 0.0310 |
| XG365 | Strait of Messina | 181.00 | 48.00 | 2.5557 ± 0.2700 |
| XG367 | Strait of Messina | 133.50 | 35.00 | 2.0135 ± 0.1949 |
| XG372 | Strait of Messina | 180.00 | 70.00 | 1.7924 ± 0.0598 |
| XG376 | Strait of Messina | 180.00 | 65.00 | 1.6910 ± 0.0302 |
| XG377 | Strait of Messina | 140.00 | 30.00 | 2.1496 ± 0.1989 |
| XG379 | Strait of Messina | 164.00 | 54.00 | 2.9100 ± 0.0171 |
| XG380 | Strait of Messina | 196.00 | 83.00 | 1.5631 ± 0.1708 |
| XG381 | Strait of Messina | 180.00 | 75.00 | 1.2367 ± 0.2219 |
| XG384 | Strait of Messina | 183.00 | 49.00 | 3.1819 ± 0.1949 |
| TB 103 | Strait of Messina | 155.00 | 13.00 | 0.4344 ± 0.0335 |
| TB 106 | Strait of Messina | 151.00 | 11.00 | 0.7986 ± 0.0889 |
| TB 108 | Strait of Messina | 156.00 | 16.00 | 1.6499 ± 0.2199 |
| TB 113 | Strait of Messina | 150.00 | 11.00 | 0.6695 ± 0.0563 |
| TB 117 | Strait of Messina | 170.00 | 16.00 | 0.8687 ± 0.0230 |
| TB 120 | Strait of Messina | 179.00 | 22.00 | 1.7303 ± 0.0268 |
| TB 121 | Strait of Messina | 151.00 | 6.00 | 0.6021 ± 0.0642 |
| TB 122 | Strait of Messina | 178.00 | 21.00 | 1.6086 ± 0.1290 |
| TB 126 | Strait of Messina | 157.00 | 16.00 | 0.5199 ± 0.0209 |
| TB 131 | Strait of Messina | 155.00 | 16.00 | 0.6017 ± 0.0433 |
| TB 132 | Strait of Messina | 142.00 | 13.00 | 0.5306 ± 0.0525 |
| TB 144 | Strait of Messina | 151.00 | 11.00 | 0.5693 ± 0.0534 |
| TB 145 | Strait of Messina | 155.00 | 14.00 | 1.0583 ± 0.2837 |
| TB 149 | Strait of Messina | 148.00 | 12.00 | 0.5559 ± 0.0228 |
| SS1 | Scotland | n.d. | n.d. | 0.0188 ± 0.0007 |
| SS2 | Norway | n.d. | n.d. | 0.0089 ± 0.0013 |
| SS3 | Norway | n.d. | n.d. | 0.0114 ± 0.0004 |
| SS4 | Norway | n.d. | n.d. | 0.0193 ± 0.0014 |
| SS5 | Norway | n.d. | n.d. | 0.0091 ± 0.0003 |
| SS6 | Norway | n.d. | n.d. | 0.0117 ± 0.0004 |
| SS7 | Norway | n.d. | n.d. | 0.0037 ± 0.0006 |
| SS8 | Norway | n.d. | n.d. | 0.0159 ± 0.0004 |
| SS9 | Norway | n.d. | n.d. | 0.0087 ± 0.0005 |
| Species | N Samples | Hg | ||||
|---|---|---|---|---|---|---|
| mg/kg | mg/kg | TWI | TWI% | TWI% | ||
| Range Min–Max | Mean Value | Mean Value ± Dev.st | Range Min–Max | Mean Value | ||
| S. salar | 9 | 0.004–0.002 | 0.012 | 0.0003 ± 0.001 | 5.10–11.28 | 6.97 |
| T. belone | 14 | 0.434–1.730 | 1.082 | 0.0200 ± 0.011 | 253.41–1009.35 | 508.23 |
| T. thynnus | 11 | 0.015–2.562 | 1.288 | 0.0150 ± 0.018 | 8.52–1494.38 | 375.29 |
| X. gladius | 14 | 0.477–3.182 | 1.829 | 0.0400 ± 0.017 | 278.53–1856.08 | 1119.08 |
© 2018 by the authors. Licensee MDPI, Basel, Switzerland. This article is an open access article distributed under the terms and conditions of the Creative Commons Attribution (CC BY) license (http://creativecommons.org/licenses/by/4.0/).
Share and Cite
Di Bella, G.; Tardugno, R.; Cicero, N. Investigation of Hg Content by a Rapid Analytical Technique in Mediterranean Pelagic Fishes. Separations 2018, 5, 51. https://doi.org/10.3390/separations5040051
Di Bella G, Tardugno R, Cicero N. Investigation of Hg Content by a Rapid Analytical Technique in Mediterranean Pelagic Fishes. Separations. 2018; 5(4):51. https://doi.org/10.3390/separations5040051
Chicago/Turabian StyleDi Bella, Giuseppa, Roberta Tardugno, and Nicola Cicero. 2018. "Investigation of Hg Content by a Rapid Analytical Technique in Mediterranean Pelagic Fishes" Separations 5, no. 4: 51. https://doi.org/10.3390/separations5040051
APA StyleDi Bella, G., Tardugno, R., & Cicero, N. (2018). Investigation of Hg Content by a Rapid Analytical Technique in Mediterranean Pelagic Fishes. Separations, 5(4), 51. https://doi.org/10.3390/separations5040051