Article

Release of Selected Metals (Al, Cd, Cu, Mn, Ni, Fe, Zn) from River Bottom Sediments: An Experimental Study

by
Magdalena Senze
1,*,
Monika Kowalska-Góralska
1,
Katarzyna Czyż
2 and
Anna Wondołowska-Grabowska
3
1
Institute of Animal Breeding, Department of Limnology and Fishery, Wrocław University of Environmental and Life Sciences, ul. Chełmońskiego 38c, 51-630 Wrocław, Poland
2
Institute of Animal Breeding, Department of Sheep and Fur Animals Breeding, Wrocław University of Environmental and Life Sciences, ul. Kożuchowska 5A, 51-631 Wrocław, Poland
3
Institute of Agroecology and Plant Production, Wrocław University of Environmental and Life Sciences, Grunwaldzki Sq. 24A, 50-363 Wrocław, Poland
*
Author to whom correspondence should be addressed.
Limnol. Rev. 2023, 23(2), 50-69; https://doi.org/10.3390/limnolrev23020004
Submission received: 30 May 2023 / Revised: 14 July 2023 / Accepted: 18 July 2023 / Published: 20 July 2023

Abstract

:
Sediments from three rivers in south-western Poland and their tributaries were used in a laboratory experiment on metal (Al, Cu, Ni, Cd, Zn, Fe, Mn) release. Metal migration was studied under different pH (pH 3.93, pH 7.29, pH 9.59) during 96 h. Al concentration was the highest in Bystrzyca and lowest in Strzegomka; other metal concentrations were highest in Nysa Szalona and lowest in Strzegomka. The values of pH and electrolytic conductivity increase throughout the experiment in acidic and neutral environments. Water pH decrease was observed under alkaline conditions, but conductivity reached higher values with time. The aluminum release showed an increase in values followed by a decrease. The highest aluminum amounts were released from the sediment from Nysa Szalona and the lowest from Strzegomka. The greatest aluminum migration was observed in the acidic medium. Similar observations were made for Mn and Zn: Strzegomka < Nysa Szalona < Bystrzyca. For Cu, Cd, Fe and Ni, the highest values were recorded in sediments in alkaline conditions. The amount of metals migrating from sediments to water remains at a similar level as presented by other researchers. More metals are released under acidic conditions. The most intensive migration of metals is noted at the beginning of the experiment. This experiment shows the existing trend of metals migration from the sediments to the over-bottom water, which is important from the point of view of the use of water for drinking purposes. Satisfactorily, the sediments in varied environments behave predictably enough that the quality of raw water under these conditions is not compromised, which is confirmed by environmental and health standards. The research performed concerns a specific area of southwestern Poland, for which this type of research has not been conducted.

1. Introduction

Sources of metals in the natural environment include both natural and anthropogenic activities. The average concentration of metals in the environment is different (Table 1) [1,2]. It can be altered by natural processes that result from rapid mechanical actions, e.g., floods, earthquakes, but can also result from a change in environmental chemistry. Geochemical background values indicate normal c of elements in a given environment (rock, soil, alluvium, water, plant, etc.). Relative to this level, positive and negative anomalies are considered. The former indicates the presence of metal ore deposits or anthropogenic pollutants in the environment, and the second group consists of metals whose concentrations in the natural environment are too low needed for plant, animal and human life [3]. Particularly important here is the biogeochemical cycle of elements, which includes all components of the environment, air, soil and water. Extremely important is the movement of metals within plant and animal living organisms [4]. This biogeochemical cycle, therefore, includes both animate and inanimate matter. The effect of metals on living organisms, including bacteria, is reflected in the mechanism of metal release. This is detrimental if only for the possibility of releasing metals into water that is intended as drinking water. The latter occurs in two ways: by enrichment with additional chemicals or changes in the levels of already existing compounds [5]. Many processes that are important in the migration of metals in the environment include the weathering of rock material, its displacement and sedimentation. These processes can be the result of anthropogenic activities taking place in the catchment and manifested by the reconstruction of the river channel and the associated mechanical disturbance of the banks and bottom of the reservoir [6]. On the other hand, it may be the inflow of pollutants in the form of runoff from agricultural fields, domestic and agricultural sewage. In addition, industrial activities have a big impact. Every type of this activity has an effect on the environment, but this is particularly strong in the vicinity of mines, chemical plants, processing plants and all those whose wastewater has a considerable impact on the environment [5,7]. All these interferences taking place in the environment are reflected in the changes detectable in water [4,5,6,7].
In the case of aquatic environments, deposition of organic and inorganic compounds of natural and artificial origin takes place in the bottom sediments of water reservoirs. They can be of allochthonous and autochthonous origin. Sometimes both forms occur together or separately and are a reflection of what is available in the catchment and what has not been absorbed by plants and animals [8]. Some of the compounds may also come directly as a result of release from the soils and not necessarily be introduced from an intermediate catchment. Then it will refer to internal processes taking place in the reservoir. Anthropogenic and natural activities are the cause of acidification or alkalization of the environment. Acidification of water is mainly to be attributed to the strong hydrological and hydrochemical influence of precipitation, which often has an acidic reaction and very low total hardness [9,10]. This entails very poor buffering of the water, as the water often does not contain enough alkalis that can neutralize the ions that cause acidification of the reservoir water [11]. Flowing waters feeding the reservoir are of similar importance. The leaching of acidic soils is also one of the causes of water acidification. Alkalization of waters is the opposite situation, and its causes can be traced to human activities related to over-fertilization of soils in the basin and intensive fish farming [11]. Such chemical and bio-chemical transformations are also the result of very intensive photosynthesis in water [12]. In nature, the process of rock weathering takes place on a physical, chemical and biological basis. It occurs in every type of climate, from cold to warm, in both dry and humid conditions. Temperature differences associated with the warming and cooling of rocks are the cause of their disintegration, and water penetrating into the fractures is the pushing factor [8]. Actions on a chemical basis are mainly associated with water activity and involve oxidation, reduction, and carbonation, among others. Another cause of rock disintegration is the influence of microorganisms, whose secretions lead to the gradual disintegration of rock material [11]. This biological part is also enriched by the activity of plants and animals. All these activities result in the dissolution of some minerals and the formation (precipitation) of new ones, but the rock material is most intensively subjected to weathering in tropical conditions, where clay minerals and hydroxides, mainly iron and aluminum, are formed. The anthropogenic side of acidification is the effect of industrial and agricultural activity. It results from the release of sulfur and nitrogen compounds into the environment [8,9,10,11,12]. Among others, as a result of changes in water and sediment pH, increased metal leaching and then movement in the reservoir take place [13]. This includes both the outer (surface) and inner (deeper) layers. If the pH is low, the process of metals released by desorption from the sediment into the water is more intense. Another relationship concerns the level of organic matter, in which higher amounts are related to a greater capacity to accumulate (chelate) metals and inactivate them in the sediment, as organic matter can both dissolve and precipitate the metals [11,13].
Chemically, the release of metals from sediments into water is therefore mainly dependent on the pH but also on other factors [14]. Dissolved oxygen content and redox potential also affect the rate of metal release. The migration of metals is also related to changing weather conditions but also depends on the decreasing amount of organic matter deposited in the sediment. In reservoirs with low levels of organic compounds in the sediment, microorganisms begin to decompose organic matter using the oxygen bound in minerals. Hence, they affect the release of metals from the sediment. The migration of metals from soils depends on the soil structure, in addition to the presence of microorganisms, pH, and redox potential, among others. In lighter soils with a predominance of sand, the process of metal accumulation takes place to a lesser extent than in compact clay soils [14,15,16].
Changes in atmospheric conditions affect, among others, the oxygenation of sediments, which are usually poor in oxygen under stable conditions [15]. The oxygen content of the over-sediment zone and sediment is influenced by the flow of water in the river or the inflow of water if it is a body of standing water. Strong water turbulence and steep gradients (natural or anthropogenic water thresholds) promote additional oxygen enrichment of sediments. It is also worth mentioning the possibility of sediment oxygenation in situations where the reservoir is deprived of water due to natural (drought) or artificial (conservation, reclamation, economic activities) reasons. In reservoirs where aerobic conditions prevail, the metals present are mainly in the form of poorly water-soluble compounds and very slowly enter the water. Under reducing conditions, on the other hand, most metals lose valence electrons. This results in the formation of more soluble compounds, which migrate more quickly from the sediment into the water [14,15,16].
In rivers flowing in a flat-bottomed valley, metals or their solid forms in the sediment accumulate near the shore, and in rivers with gravel beds, they may also be present in larger quantities on channel bars. In addition to dissolution and leaching, the migration of metals from sediment to water can also occur through erosion. It concerns layers contaminated by anthropogenic activities. It is also possible that sediments from old deposits may be activated and cause secondary pollution of the river with compounds that have not posed a threat so far under stable conditions. It happens when the sediments are disturbed, and their structure is loosened [14,15,16].
The migration of compounds from bottom sediments to water is related to sorption and desorption processes on the surface of sediment particles and to the binding of individual ions to the sediment sorption complex. The sorption complex is the colloidal part of the solid phase of the sediment together with interchangeably adsorbed ions [6,7,17]. Thus, it includes mineral colloids, aluminosilicates, crystalline hydroxides and oxides of iron and aluminum, amorphous minerals (non-crystalline), organic colloids and organic-mineral colloids (complex combinations of humus and clay minerals). Chemical sorption reduces the concentration of ions in the water, and exchange sorption results in the establishment of an equilibrium between ions in the benthic water and sediment. However, this is a very dynamic process that involves exchange by mineral, organic and mixed pathways and is related, as described above, to changes in pH, temperature, oxygen levels and redox potential. Some cations are bound by the sorption complex permanently and are not exchanged. However, the composition of the water, its pH and the structure and composition of the sediment affect the equilibrium state. Thus, exchangeable cations (Ca2+, Mg2+, K+, Na+) are defined as the sum of exchangeable bases and other cations, which include H+, Al3+, Zn2+, Co2+, Ni+, NH4+, Rb+, Li+, may be distinguished [6,7,17].
Seasonal changes in the ratio of exchangeable ions (calcium and magnesium) bound in the sorption complex to those adsorbed on the sediment surface have been observed [6,17]. In spring, the number of ions in the complex increases, and in autumn, the number of ions on the surface increases. This is when elevated amounts of metals are found in the benthic water. For sodium and potassium, higher amounts are noted at the sediment surface. This is undoubtedly related to changes in air temperature, which is reflected in water temperature values. In stratified reservoirs, where the water is subject to mixing, changes in temperature, oxygen content and other chemical parameters make their impact visible. Exchange sorption of cations predominates in bottom sediments. Sorption of anions occurs less frequently because these ions are mostly precipitated as chemically insoluble compounds. Exchange sorption of cations occurs in alkaline media, and exchange sorption of anions in acidic conditions. This is dependent on the isoelectric point of the colloidal micelle, which for different soil (sediment) colloids, falls at a different pH value. For Al(OH)3, this point falls at pH 8.10, and for Fe(OH)3 at pH 7.10 [6,15]. Hence, the exchange sorption between cations and anions will be determined by the type of colloid in the sediment but also by the bottom sediment pH. Thus, at pH 8.10 for Al, the exchange sorption of anions will involve both acidic and basic environments, but for Fe at pH 7.10, only weakly acidic and acidic environments. The lower the pH of the environment, the more strongly the anions are retained in the colloidal complex [6,17].
The aim of this study was to determine the effect of changes (variation in environmental conditions) in water pH on the release of metals bound in bottom sediments into water, as this research problem has not been addressed in the area examined by us so far and has not been presented in the literature [18,19,20,21,22,23]. Although the study area does not record particularly high levels of heavy metals in environmental components, the catchment area of these three rivers is the source of drinking water for a sizable portion of the population of southwestern Poland. It is, therefore, worth focusing attention on the potential toxicity of metals contained in bottom sediments. Sediments from three catchments—upland (Bystrzyca River), upland–lowland (Strzegomka River) and lowland (Nysa Szalona River)—whose chemistry is described in detail in the works of the present authors, were considered [24,25].

2. Materials and Methods
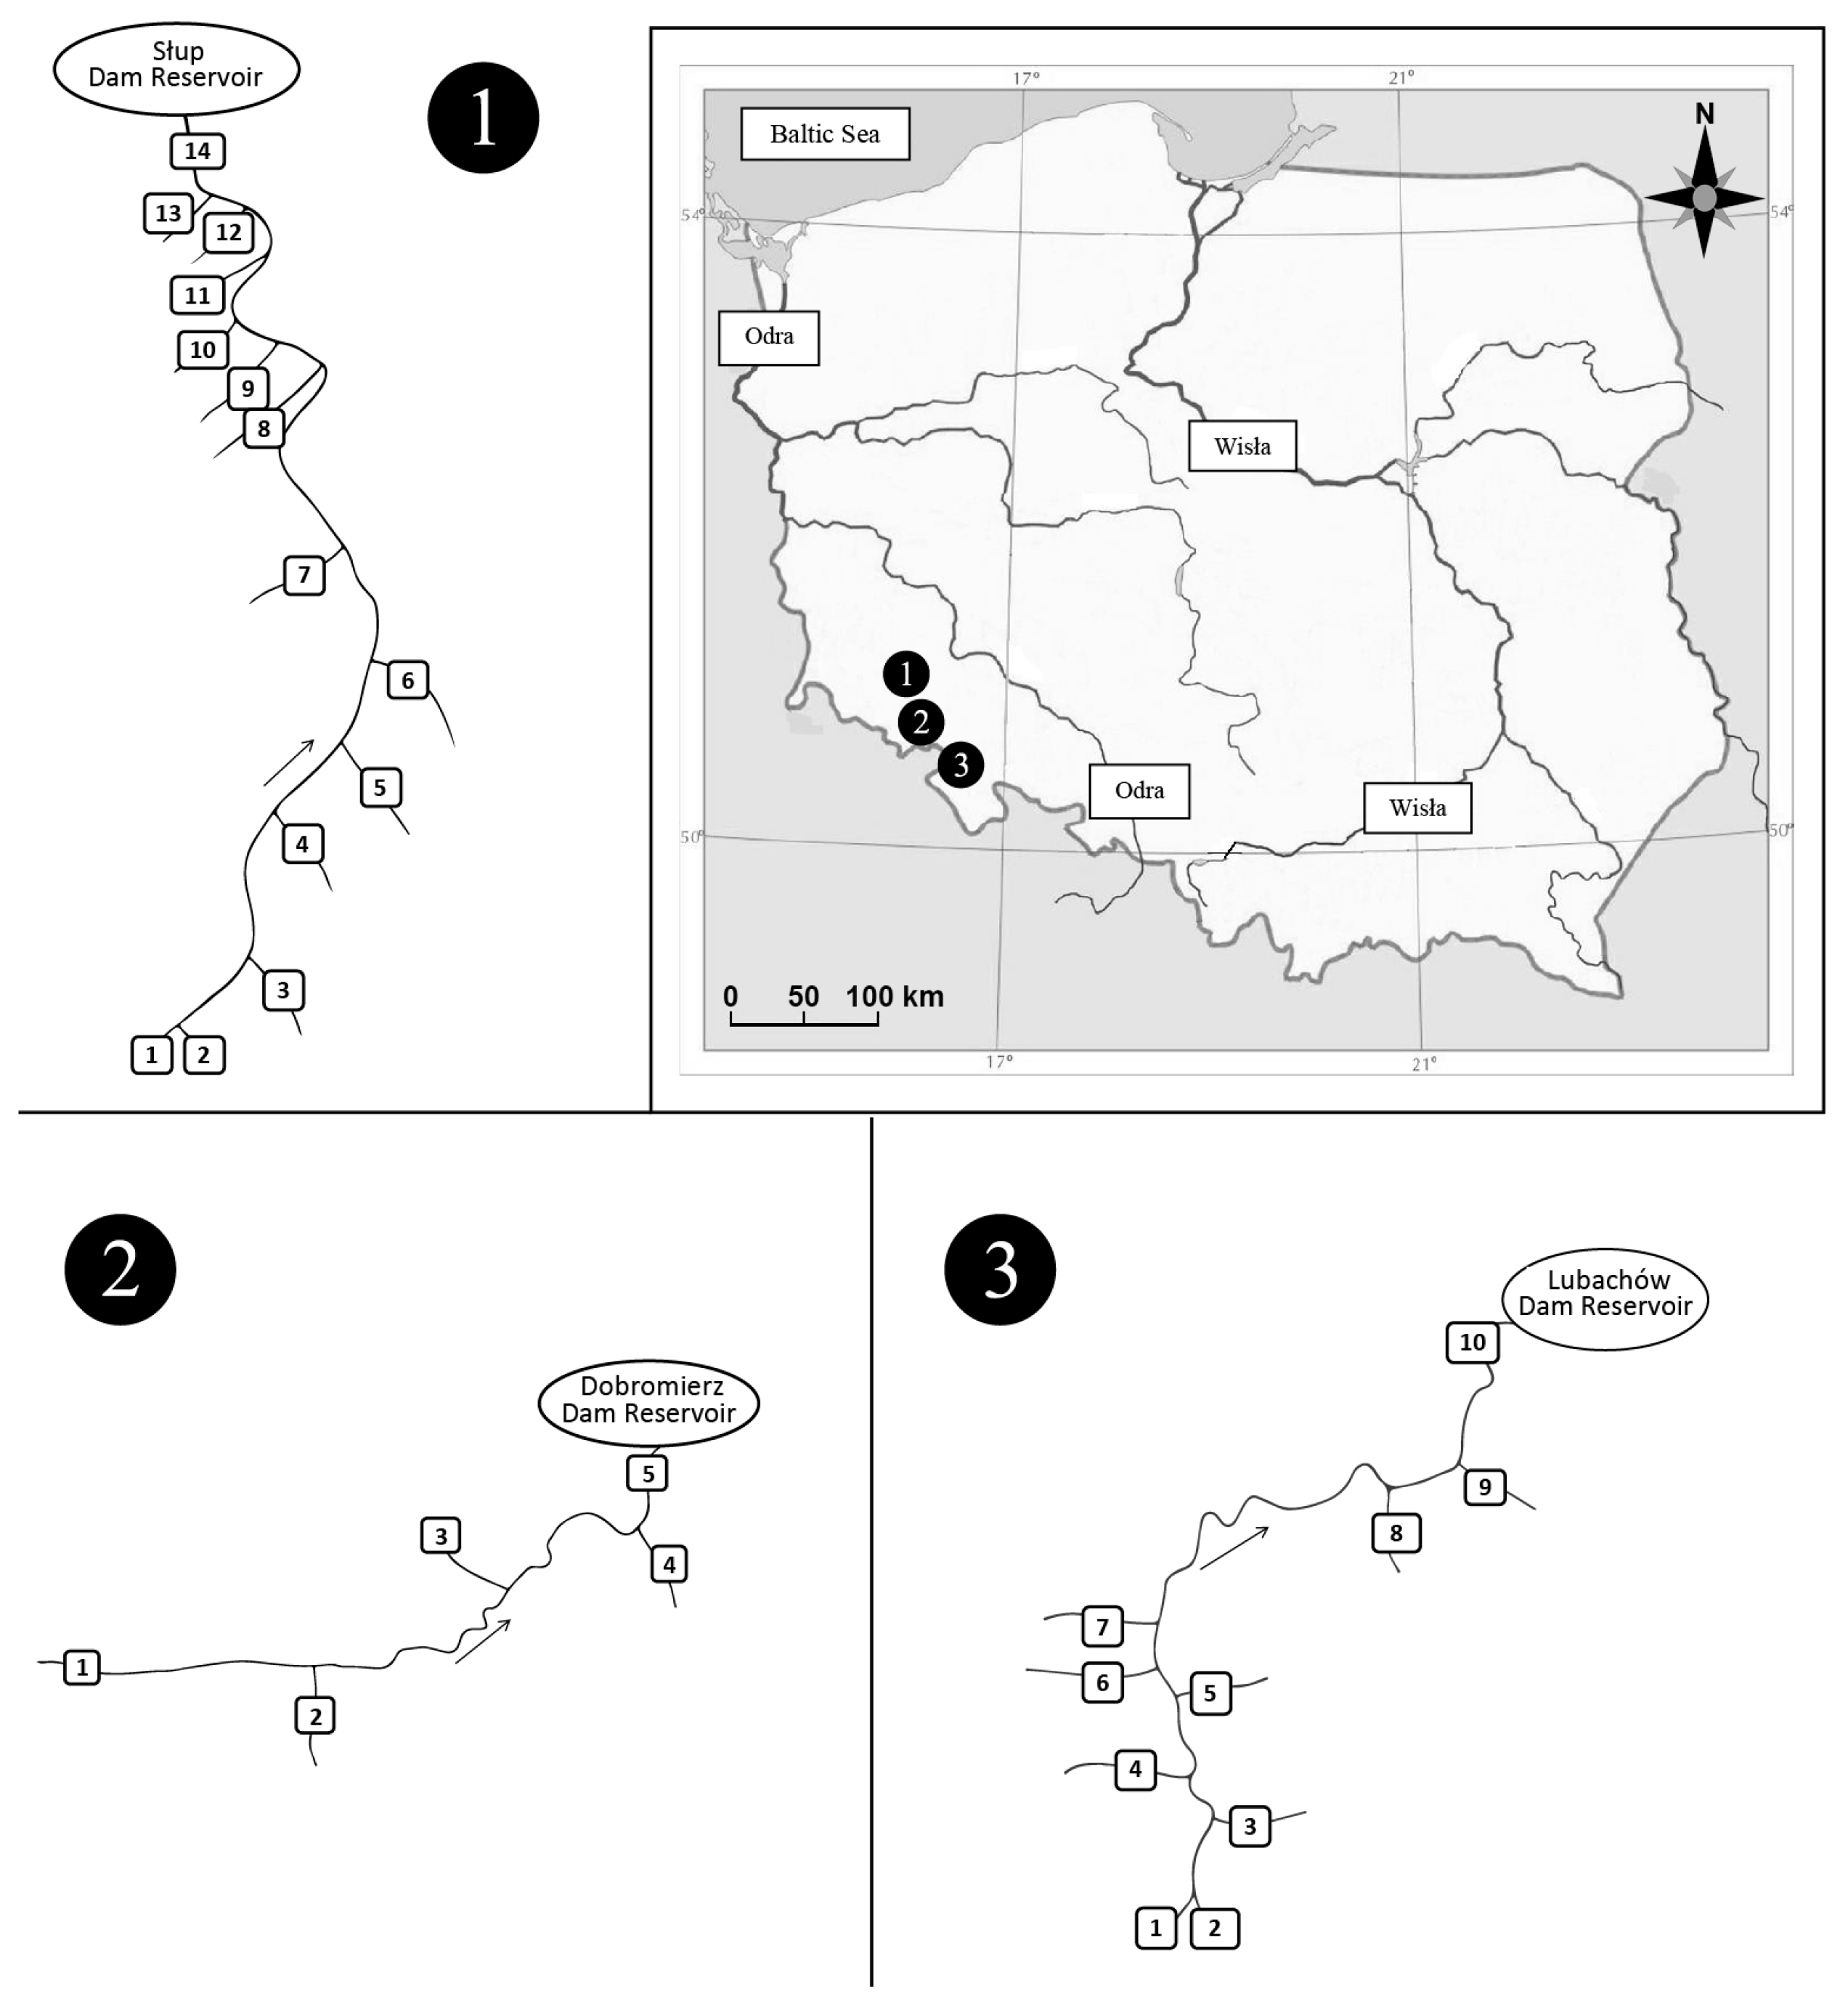
2.1. Study Area

The territory of Lower Silesia is located within the broad belt of the Central European Variscan Basement. It is made up of mountain chains, formed during folding lasting from the Carboniferous to the Permian, and which today form the bedrock of the Paleozoic platform over a large area [26].
The study covered the following areas: N50°38′10.1652′′–N51°4′31.7745′′ and E16°3′54.4715′′–E16°25′1.4097′′ in south-west Poland (Figure 1). The study included bottom sediments collected from the Nysa Szalona, Strzegomka and Bystrzyca rivers and their tributaries from their sources to their mouths in the dam reservoirs Słup, Dobromierz and Lubachów, respectively (Tables S1–S3).
The Nysa Szalona is a 3rd order watercourse, a right-bank tributary of the Kaczawa River. The total length of the Nysa Szalona River is 51 km, and the catchment area is 443.1 km2. The river collects urban and rural wastewater from unregulated water and sewage management and runoff from agricultural fields. The source of the Nysa Szalona is located at the height of 628 m above sea level, while at the height of 184 m above sea level, the river flows into the reservoir in Słup. The Słup reservoir plays an anti-flood role (reduction of flood waves), as well as a water supply and municipal role. The left-bank tributaries of the Nysa Szalona, flowing above the Slup reservoir, include the Męcinka, Rowiec, Starucha, Jawornik, Puszówka, Nysa Mała and Kamiennik, and the right-bank ones are Ochodnik, Sadówka, Czyściel, Parowa and Kocik. The river basin is dominated by podzols, brown soils, and alluvial soils (Table S4) [27].
The Strzegomka River is the left, largest tributary of the Bystrzyca River, 74.7 km long and covering a catchment area of 555 km2. The catchment area is typically agricultural, with loose buildings located directly by the river. Water supply to these buildings and collection of sewage is unorganized [27]. Water from a reservoir constructed on the Strzegomka River in Dobromierz which is supplied to the Świebodzice region. From its sources to the mouth of the reservoir, the Strzegomka River is a mountain river [27]. The right-bank tributaries of the Strzegomka River flowing above the dam reservoir in Dobromierz include Polska Woda and Czyżynka, while the left-bank tributaries include Sikorka. The catchment area is dominated by podzolic, brown podzolic, alluvial soils, and acidic soils (Table S4) [27].
The Bystrzyca iIs a left-bank tributary of the Oder River, 111 km long and with a basin area of 1786 km2. The river flows into the Oder River in Wrocław. The upper section of the river is typically mountainous. A dam reservoir was built on the river between the villages Zagórze Śląskie and Lubachów [27]. The right-bank tributaries of the Bystrzyca River flowing into it above the Lubachów reservoir include the Złoty Potok, Klobia, Potok Marcowy Duży, Jaworzynik and Walimianka, and the left-bank Otłuczyna, Złota Woda and Rybna. The predominant soils in the area are podzolic and brown soils and deluvial deposits (Table S4) [27].

2.2. Material

The research material consisted of water and bottom sediments. The water for the experiment was taken from the mains water supply. From its collection from the network until the start of the experiment, it was kept in open tanks in the laboratory for 48 h for stabilization. It was oxygenated and kept at a constant room temperature (20–22 °C). A total of 216 water samples were collected (8-time points × 3 pH values × 3 rivers × 3 replications). Bottom sediments were collected from the Nysa Szalona, Strzegomka and Bystrzyca rivers and their tributaries according to the recommendations of the Polish Standard using an Eckman scoop (size 15 cm × 15 cm) directly into cloth bags in spring (May) and autumn (November) in 2017 [28,29]. The sediments were collected from the main current of the river so as to be sure that they were underwater and not even periodically exposed to atmospheric conditions. A pooled sediment sample was made for each river and tributary. The experiment was performed in triplicates. A total of 174 sediment samples were collected, consisting of 2 seasons, 14 sites on the Nysa Szalona River, 10 sites on the Bystrzyca River and 5 sites on the Strzegomka River, all in 3 replications. After collection, the sediments were dried at room temperature to an air-dry state. The next step was grinding in a mortar and sieving through a sieve with a mesh diameter of 2 mm. Sediments were subjected to homogenization, and 100 g of sediment was taken from such a sample, treating this as a bulk sample. The experiment was preceded by determining the chemical composition of the bottom sediments (Table 2).

2.3. Analytical Methods

The basic chemical properties, including the following parameters, were determined:
The pH of water and sediment (for sediment in potassium chloride) by a potentiometric method using pH-meter PH—207 Slandi [30,31]. For bottom sediment samples, the weighting was 20 g.
Mineral and organic compounds in sediment by weight [32]. The combustion of 5 g of sediment at 600 °C for one hour was carried out in a muffle furnace FCF 7SHM (CZYLOK, Jastrzębie-Zdrój, Poland).
Sulfate in sediment by nephelometry [33]. A 20 g sample of the sediment with 0.2 g of activated carbon and 100 cm3 of Ca(H2PO4)⋅H2O extraction solution was shaken in a 357 thermostatic bench shaker (EL-PIN, Poland). Sulfate concentration was measured at 490 nm on a Cary 100 Conc UV Visible spectrophotometer (Varian, Australia).
Total aluminum in sediment and water by electrothermal atomic absorption spectrometry (ETAAS) (Spectra AA-110/220, Varian, Australia) [34].
Copper, nickel, zinc, cadmium, iron, and manganese in sediment and water by flame atomic absorption spectrometry (FAAS) (Spectra AA-110/220, Varian, Australia) [35].
To determine the metal levels in the collected bottom sediment samples, 2 g of air-dry and homogenized sample was weighed in a Teflon HP-500 dish. After adding 10 cm3 of HNO3:hClO4 (3:1) (Sigma-Aldrich, St. Louis, MO, USA), the samples were left at room temperature for 24 h. They were then placed in a Mars 5 microwave oven (CEM Corporation, Matthews, NC, USA) and subjected to 3-stage mineralization. After cooling to room temperature, the mineralizes were filtered on 0.45 µM Whatman 1 filters and next transferred to test tubes and diluted with distilled water to 25 cm3 and subsequently analyzed using ETAAS (Spectra AA-110/220, Varian, Australia) [36].
Water for analyses was filtered on 0.45 µM Whatman 1 filters. Mineralization was conducted in a Mars 5 microwave oven (CEM Corporation, Matthews, NC, USA). Determination of metal levels was performed using atomic absorption spectrophotometry with a Spectra AA-110/220 (Varian, Australia) [36].

2.4. Laboratory Experiment

Pooled sediment samples were weighed and placed in solutions with varying water pH, and thus varying electrolytic conductivity due to the nature of the solution (Figure 2 and Figure 3) [37]:
pH 3.93, electrolytic conductivity 3710.33 µS∙cm−1
pH 7.29, electrolytic conductivity 538.67 µS∙cm−1
pH 9.59, electrolytic conductivity 827.67 µS∙cm−1.
The above values are based on our previous research [37]. The different values of water pH were supposed to characterize acidic, neutral and basic environments, and the set values were the result of the average values of water pH during the preparation of solutions used for the experiment. NaOH (impurity < 1.0%) and HCl (≤1 ppm free chlorine) were used to set the exact pH value [37]. Weighed sediment samples (30.00 g) were placed in 2 L glass beakers and covered with 1.5 L of distilled water (pH 7.1 electrolytic conductivity 10 µS∙cm−1). The ratio of water to sediment was 1.00:0.05. The water and sediment were mixed so that the water filled the entire volume of the sediment. The sediment was then left undisturbed until the end of the experiment by taking water for analysis only from above the sediment. The initial concentrations of the individual metals in the water used for the experiment were as follows: Cu—0.0002 mg/L, Zn—0.0322 mg/L, Cd—0.0001 mg/L, Al—0.012 mg/L, Ni—0.0001 mg/L, Fe—0.0133 mg/L, Mn—0.0008 mg/L (Tables S5–S11).
The prepared samples were left at 22 °C for the specified times: 1/4, 1/2, 3, 12, 24, 48, and 96 h, and then water samples were taken to determine the concentration of Al, Cu, Ni, Cd, Zn, Fe, Mn. Additionally, pH and electrolytic conductivity of the solution were measured.
The results were verified using certified reference materials:
Water-Trace Metals QCI-049-1-R.T. Corporation-Laramie, USA
Bottom sediments-LKSD-2 (bottom sediment)-Canadian Certified Reference Materials Project (CANMET). Precision and accuracy of the methods and results—0.001 mg/kg.

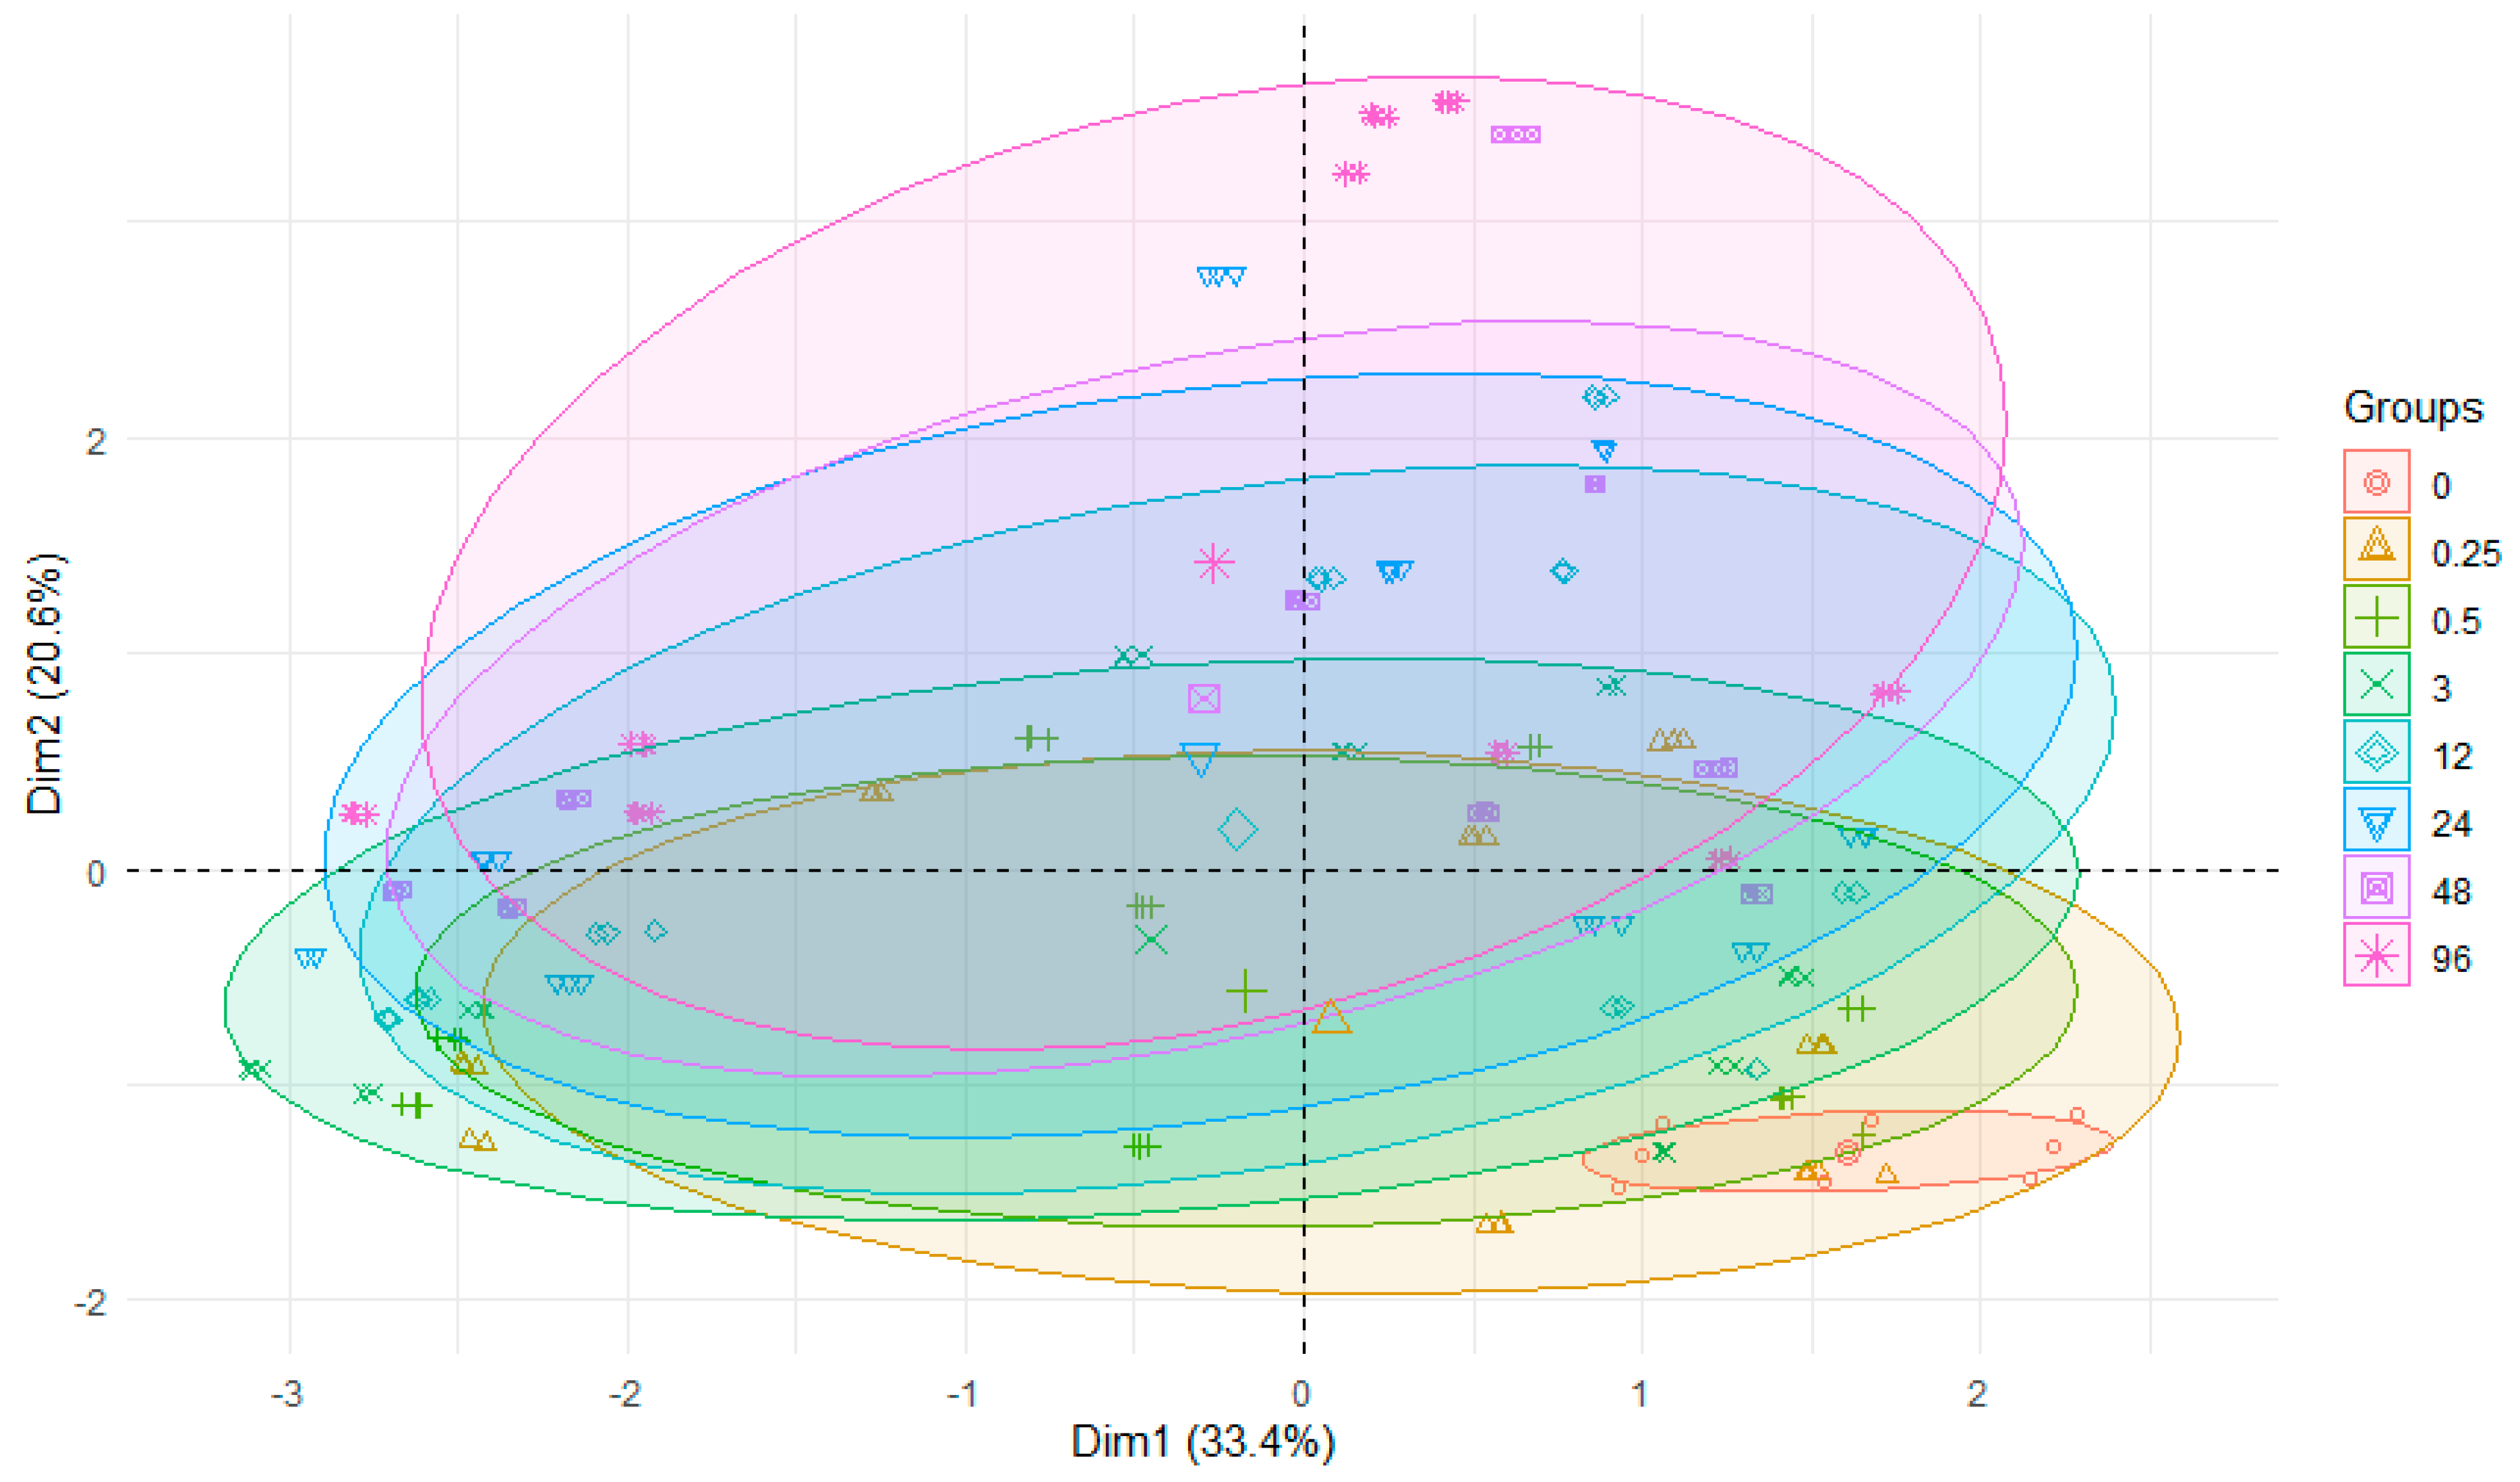
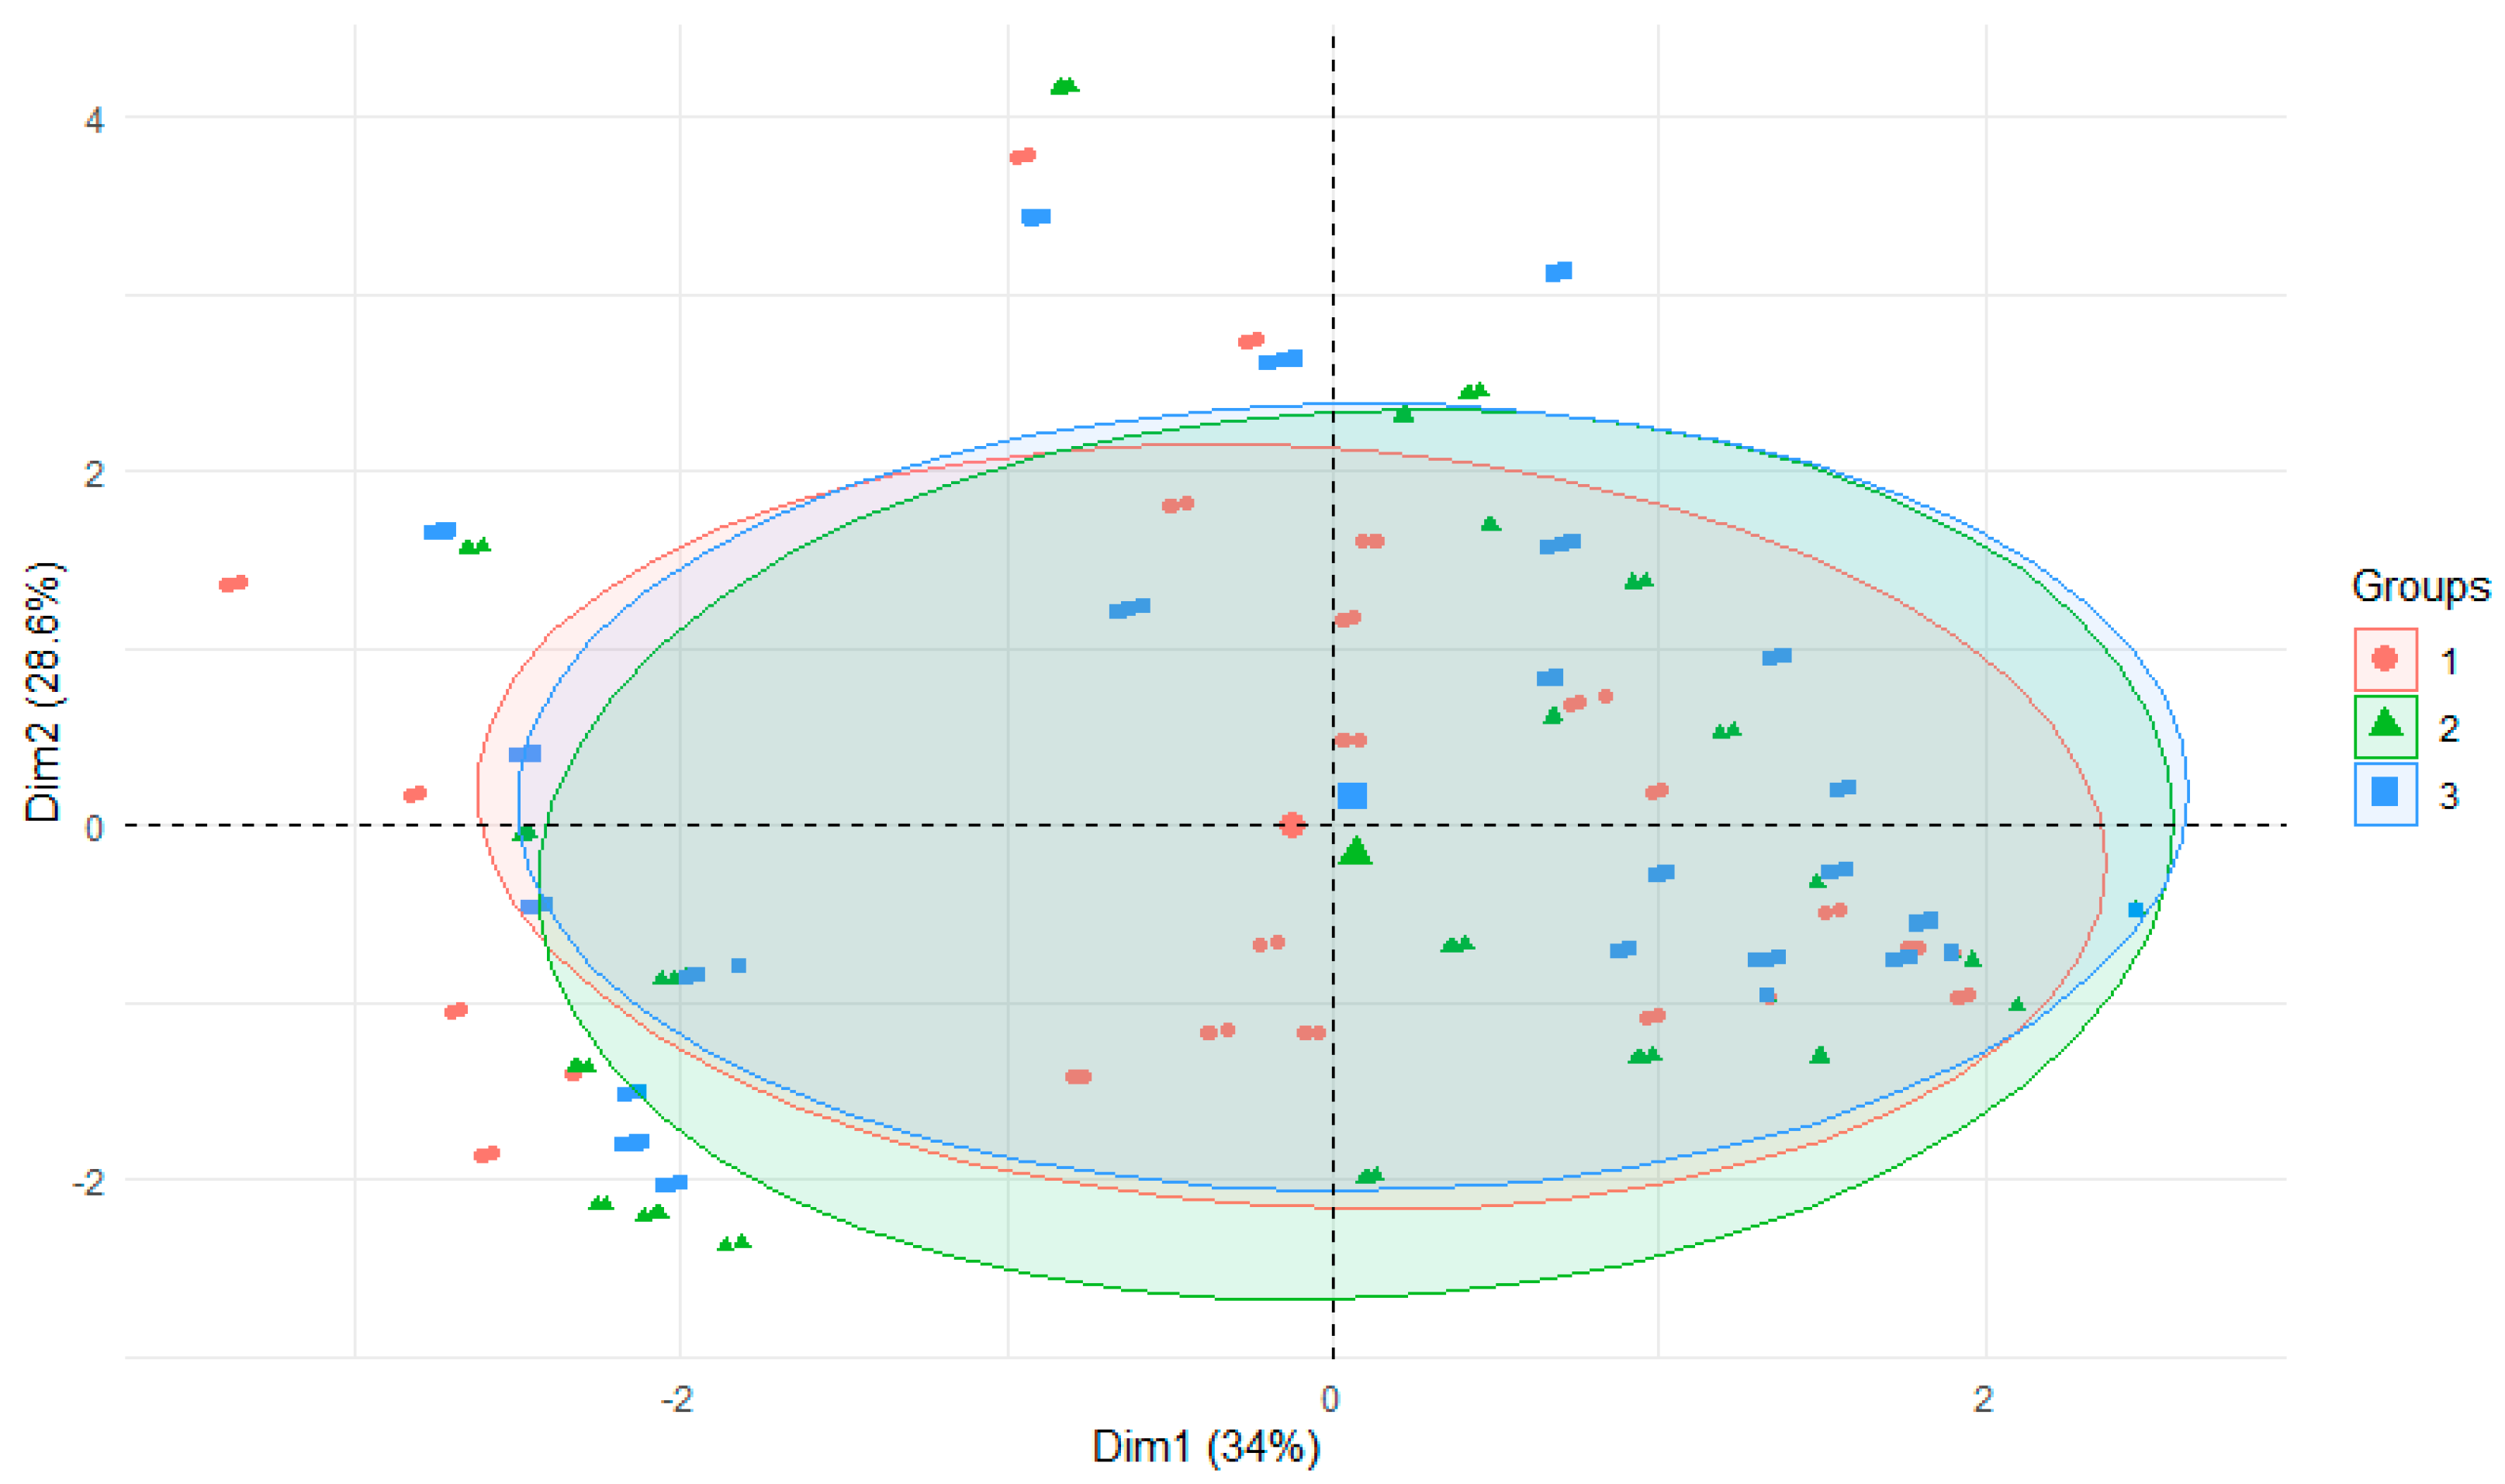
2.5. Statistical Analysis

Analysis of the results was performed using Microsoft Office Excel 2019 and Statistica 13.0. Calculations were performed using R version 3.6.0. The Shapiro–Wilk test was performed to verify the normality of the distribution.
Spearman correlations were used due to the distribution of samples. Spearman correlation was calculated in the Statistica program, and box and whiskers plots were also created in this program. All statistically significant differences were calculated at p < 0.05. Due to the data being defined as having a non-normal distribution, the Kruskal–Wallis test with post-hoc analysis was used. An attempt was made to determine the value allowing the data to be divided into two groups differing in a statistically significant manner. The results are presented when such a value can be determined.
The PCA test using r-statistics was applied in order to visualize the differences between the groups (rStudio Version 1.1.442—© 2009–2018, rStudio, Inc., Singapore). It was performed on the basis of all data and presented: differences in the parameters of the examined rivers depending on the pH of the solution, time, or river.
Pearson′s correlations at p = 0.05 and multiple regression analysis with a backward selection of variables for the examined parameters were calculated using TIBCO Statistica 13.3.0 (TIBCO Software Inc., Palo Alto, CA, USA). The regression equation was formed as follows: y = a0 + a1 × 1, i + a2 × 2, i + … + ap × p,i.

3. Results and Discussion

3.1. Characteristics of Bottom Sediments Used for the Experiment

The bottom sediments studied were characterized by a pH ranging in value from slightly acidic to slightly alkaline, and the overall picture of all rivers was close to neutral (Table 2). The nature of the sediments was typically mineral, with mineral compound levels above 90% in all samples (Table S4). The highest amount of organic matter among the three studied rivers was found in the Bystrzyca River (7.84%) and the lowest (2.34%) in the Strzegomka River. The sulfate level was typical for flowing water sediments. The highest concentration of sulfates was recorded in the Nysa Szalona River (21.74 mgSO4·kg−1) and the lowest in the Bystrzyca River (12.79 mgSO4·kg−1). The aluminum level was arranged in the series Strzegomka < Nysa Szalona < Bystrzyca. A similar relationship was found in studies a few years earlier in the sediments of dam reservoirs that were built on the Bystrzyca and Nysa Szalona rivers [37]. The concentration of heavy metals was the highest in the Nysa Szalona and the lowest in the Strzegomka.

3.2. Experiment on the Release of Metals from Bottom Sediments into Water

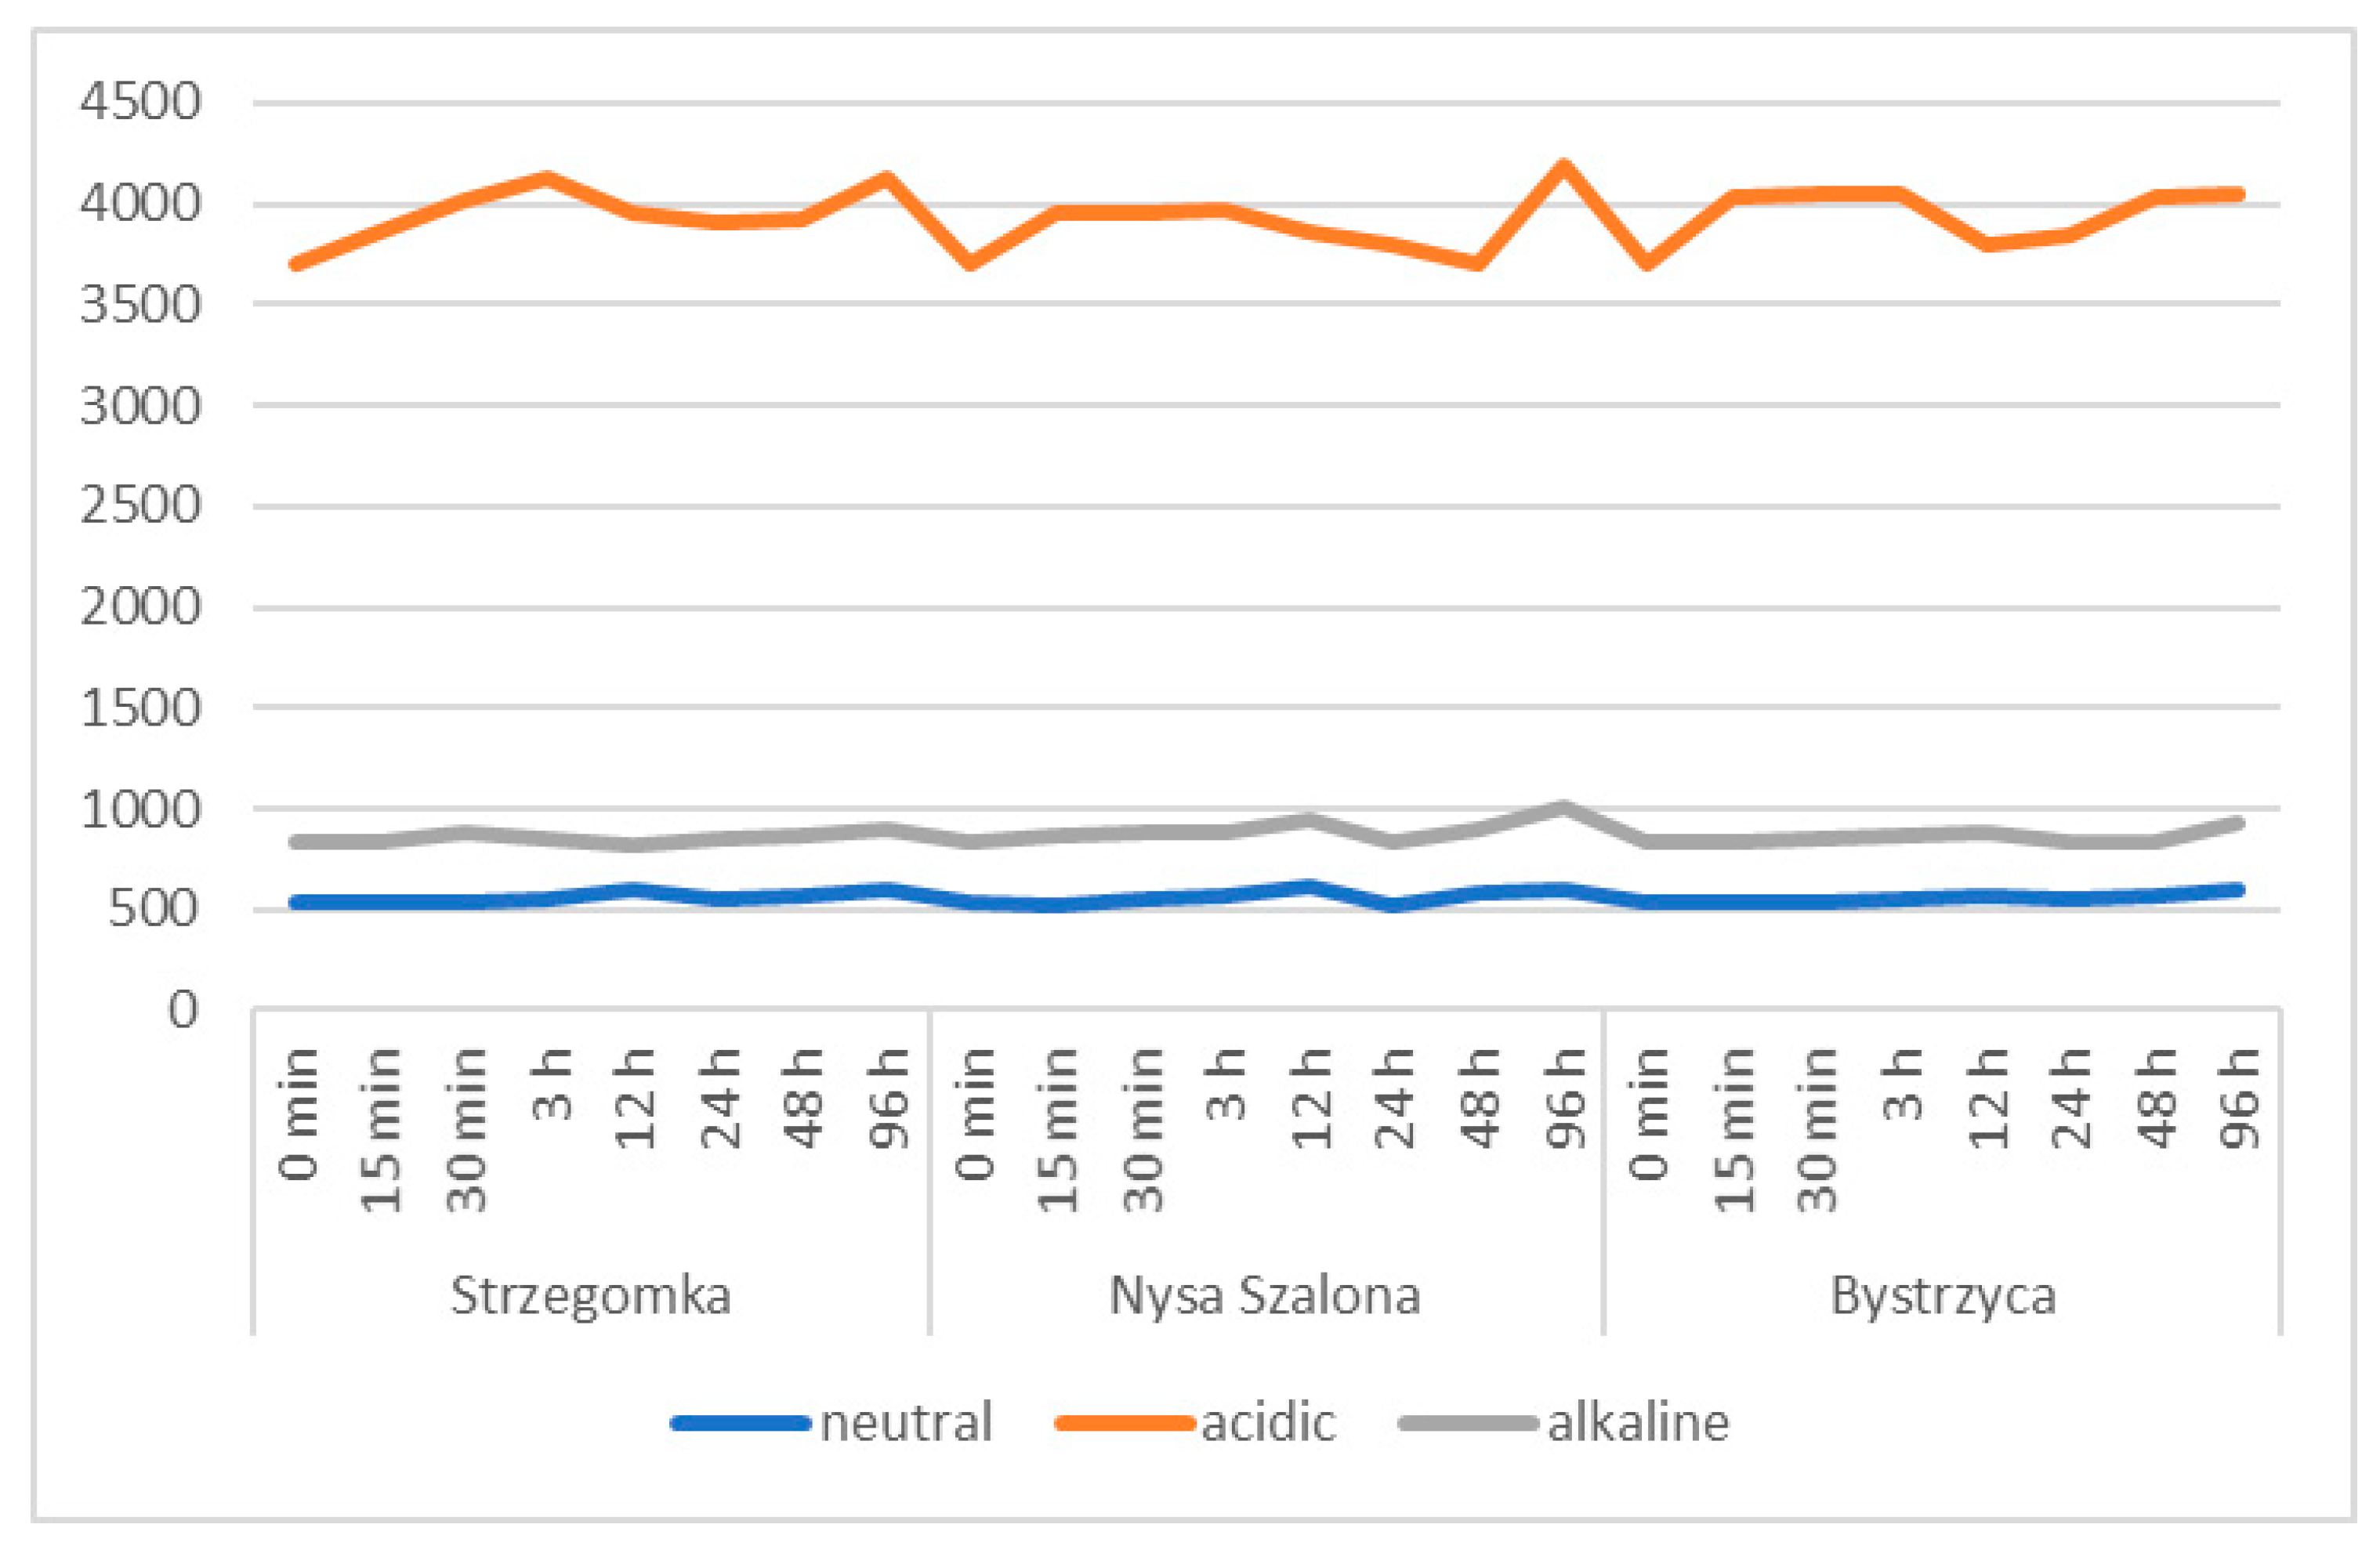
3.2.1. The pH and Electrolytic Conductivity

Water pH values increased, starting from pH 7.29 in sediment samples that were left in neutral conditions, in all three river sediments throughout the study cycle until their completion at 96 h (Figure 2). In the Strzegomka and Nysa Szalona, it reached a pH of 7.95, and in the Bystrzyca, a pH of 7.87. At the same time, electrolytic conductivity, which as a baseline was measured at the level of 538.67 µS∙cm−1 (Figure 3), also increased, reaching its maximum in the 96th hour 597 µS∙cm−1 for the Bystrzyca, 599.33 µS∙cm−1 for the Strzegomka and 604.33 µS∙cm−1 for the Nysa Szalona.
In the acidic environment, the pH increased in all samples up to 48 h of the experiment from the initial value of pH 3.93 up to pH 6.83 in the Strzegomka, pH 6.82 in the Nysa Szalona and pH 6.61 in the Bystrzyca. Electrolytic conductivity also increased and reached the highest level of 4130.67 µS∙cm−1 in the Strzegomka, in the Nysa Szalona 4189.33 µS∙cm−1 and in the Bystrzyca 4050 µS∙cm−1.
In all sediments placed in alkaline conditions during the experiment, water pH decreased systematically from the initial value of pH 9.59 to pH 7.78 in the Bystrzyca, pH 7.92 in the Nysa Szalona and pH 7.87 in the Strzegomka. Electrolytic conductivity showed an increasing trend from the initial value of 827.67 µS∙cm−1 to 897 µS∙cm−1 in the Strzegomka, 924 µS∙cm−1 in the Bystrzyca and 1010 µS∙cm−1 in the Nysa Szalona.
For all sediments placed in the tested pH under laboratory conditions throughout the experiment, a significant relationship was observed, which was related to the obtained pH of the water, time of measurement, presence of Al, Mn, Ni and pH, according to the equation:
pHlaboratory = 0.40 − 0.00012 conductivity − 3.54 Al − 1.67 Mn + 0.362 Ni + 0.26 pHsediment ± 0.25, (p < 0.000), R2 = 0.91).
The measured pH significantly depended on the environment in which the sediment was placed (alkaline, neutral, acidic), conductivity and the presence of Al, Mn and Ni. The increase of metal concentration by 1 mg/L was accompanied by a decrease of pH in the case of Al by 3.54 pH, Mn by 1.67 pH and its increase by 0.362 pH in the case of Ni presence. The pH of water significantly depended on the place of origin of sediment, i.e., river, the content of organic and mineral compounds, the concentration of aluminum, cadmium, and zinc in sediment, as well as Mn and Ni in water:
pHsediment = 5.28 + 0.05 river − 0.018 organic compounds − 0.021 mineral compounds, +0.0006 Al − 0.08 Cd − 0.0002 Zn + 0.0006 Mn − 0.09 Ni ± 0.03, (p < 0.000), R2 = 0.94).
The conductivity was significantly affected by the pH and Al, Mn, and Ni concentration, as well as the pH in which the sediment was placed:
conductivity = 5197.2 − 386.6 pH − 0.11 Al + 4634 Mn + 7,416,423 Ni − 484.3, (p < 0.000), R2 = 0.84).
An increase in Al concentration by 1 mg caused a decrease in conductivity by 0.11 µS∙cm−1, while the presence of Mn and Ni caused its increase.

3.2.2. Metals

When conducting considerations related to point sources of pollution present in the catchments of the three studied rivers, it turns out that they are generally quite similar in terms of land use. Agricultural land and wasteland are present in each of them. Local wastewater discharges are limited to organized municipal management on the Nysa Szalona and Bystrzyca rivers and are mainly unorganized within the Strzegomka. It is safe to say that the differences that exist are mainly related to the length of the rivers, the size of their catchment areas and the slope of the land. Each of the rivers and their tributaries is used for irrigation of natural green areas, and those that have a water-legal permit can draw water for irrigation. This does not happen on a large scale, given that all of these rivers are small. However, all rivers have a common main function—feeding dam reservoirs—from which water is drawn as a raw material subject to treatment in water production plants.
The migration of metals from bottom sediments to water took place differently under acidic, neutral and alkaline conditions. There were significant differences, with the range of values being greatest under alkaline conditions and values being much more similar in acidic environments (Figure 4).

3.2.3. Aluminum

In the Strzegomka River, under all conditions of varying pH, the trend of aluminum release was similar (Table S5). A strong increase in the first 15 min, followed by stabilization and a two-step decrease. The most uniform values were recorded in neutral pH, indicating that such environmental conditions do not stimulate the movement of aluminum compounds from the sediment to the water. The highest values were recorded in the acidic environment, and it was there that the initial increase in values was the greatest (up to 0.0794 mg/L). At the same time, in samples under alkaline conditions, the concentration of aluminum reached a maximum of 0.0302 mg/L and in neutral conditions, it was 0.0437 mg/L.
In the Nysa Szalona River, the trend of changes was the same as in the Strzegomka River, but in the alkaline medium, the amount of aluminum released was lower (max. 0.0305 mg/L). Against this background, the values recorded in neutral and acidic conditions were higher and reached a maximum of 0.0836 mg/L and 0.0892 mg/L, respectively.
In the Bystrzyca River, the general trend was very similar to the previously discussed rivers, but the values for the acidic and neutral environments were lower, while for the alkaline environment, they were higher. The maximum value for acidic medium was 0.0694 mg/L, for alkaline 0.0432 mg/L, and for neutral 0.0657 mg/L.
Summarizing the migration of aluminum under acidic, neutral, and alkaline conditions, it was found that this process is statistically weakest in alkaline environments (Figure S1). Similar observations were made by the authors while conducting similar studies of the bottom sediments of the Lubachów and Słup dam reservoirs built on the Bystrzyca and Nysa Szalona rivers [37].
The determined Al concentration in the sample was affected by the pH (acidic, neutral, alkaline) in which the sediment was placed, on the change of its acidity during the measurement and on the presence of Cu, Fe and Cd and Zn in the water:
Al = 0.012 − 0.0078 pH + 2.57 Cu − 5.598 Cd + 0.593 Fe + 0.159 Zn (p < 0.000, R2 = 0.67).
Based on the results, we conclude that the model built allows us to explain about 67% of the variation in the modeled dependent variable. The concentration of Cd, Cu and Fe had the greatest impact on Al concentration. A 1 unit increase in Cd concentration was accompanied by a 5.60% decrease in Al (with the values of the other independent variables unchanged, ceteris paribus rule), and a 1 unit increase in Cu concentration causes a 2.57% increase in Al. About 0.593% increase in Al will occur with a 1 unit increase in Fe.

3.2.4. Copper

The concentration of copper released from the Strzegomka River sediments was lowest for samples placed in a neutral solution (0.0067 mg/L) and highest in an alkaline solution (0.0091 mg/L) (Figure S1). In all three environments, the overall trend was upward, with the largest spike occurring in the first 15 min after the start of the experiment. The deviations were found to be the smallest in the neutral solution and the largest in the alkaline solution. Thus, under neutral conditions, the increase occurred up to a concentration of 0.0097 mg/L (initial value of 0.0002 mg/L), in the acidic environment up to 0.0103 mg/L, and in the basic environment up to 0.0126 mg/L (Table S6).
In sediments from the Nysa Szalona River, the most stable conditions occurred in sediments placed in neutral water. The release of copper systematically increased in the range of 0.0054 mg/L after the first 15 min from the beginning of the experiment to 0.0091 mg/L at 96 h (Table S6). In the alkaline environment, a large increasing trend was also evident at the beginning of the experiment (0.0085 mg/L). In conditions of acidic pH, already after the first 15 min, the level of copper was equal to 0.0108 mg/L, but already from the 3rd hour, it was systematically decreasing to the value of 0.0048 mg/L.
The bottom sediments collected from the Bystrzyca River and subjected to acidification released considerable amounts of copper (up to 0.0112 mg/L) during the first 15 min (Table S6). After this time, there was a decrease in release to 0.0058 mg/L at the end of the experiment. Under alkaline and neutral conditions, copper values increased from the starting level. Two stages of this increase were evident: between 15 min and 3 h and between 12 and 96 h.
A good correlation was observed between Cu and Cd, Ni, and Al:
Cu = 0.002 − 0.0067 Mn + 0.048 Fe + 0.14 Ni + 0.646 Cd + 0.048 Al ± 0.002, (p < 0.000), R2 = 0.79).
An increase of 1 mg/L in Cd concentration in water was accompanied by an increase in Cu of 0.649 mg/L, while the interaction of Al and Fe was at the same level and resulted in an increase in Cu in the aquatic environment of about 0.048 mg/L.

3.2.5. Manganese

The bottom sediments from the Strzegomka River in alkaline environments were characterized by the lowest level of manganese release (maximum 0.0114 mg/L), and the highest values were recorded for acidic conditions (maximum 0.4845 mg/L) (Table S7). The overall visible picture of manganese migration from sediment to water indicates a systematic increase in manganese release until the end of the experiment.
In sediments collected from the Bystrzyca River, similarly to those from the Strzegomka River, an upward trend was visible in all samples. Similarly, the highest values were recorded in acidic conditions (maximum 0.4417 mg/L) (Table S7). Lower concentrations were found in neutral conditions (maximum 0.1106 mg/L) and the lowest in alkaline medium (maximum 0.0195 mg/L).
Also, in the sediments collected from the Nysa Szalona River, regardless of the variation in the environmental pH, manganese levels increased throughout the duration of the experiment. Manganese migration was the highest in acidic conditions—up to 0.5417 mg/L in the 96th hour of the experiment (Table S7). Significantly lower values were recorded for neutral pH and the lowest for alkaline one (maximum 0.0121 mg/L).
Mn concentration in water was positively correlated with Zn and negatively correlated with Cu. An increase in Cu and Zn concentration in water by 1 mg/L was accompanied by an increase in Mn by 0.70 mg/L or its decrease by 7.44 mg/L:
Mn = −0.222 − 0.058 pHlaboratory + 0.035 pHsediment + 0.00004 conductivity + 0.70 Zn − 7.44 Cu ± 0.0649 (p < 0.000), R2 = 0.74).

3.2.6. Iron

Within the sediments of the Strzegomka River, placed in conditions of varying water pH, iron release remained at a similar level. In an acidic environment, the values increased up to the 30th minute and reached the highest value equal to 0.0465 mg/L, in neutral conditions up to 0.0417 mg/L at the 15th minute and in alkaline conditions 0.0503 mg/L at the 24th hour (Table S8). Further, the values were subject to a decrease.
In sediments collected from the Nysa Szalona area, a similar trend was observed as in the Strzegomka. Values reached a maximum of 0.0863 mg/L in acidified water, 0.0777 mg/L in neutral and 0.0661 mg/L in alkaline environments, after which the values decreased (Table S8).
Sediments originating from the Bystrzyca River were characterized by a similar trend as in the Strzegomka and the Nysa Szalona in all conditions with different water pH (Table S8). The first three hours were characterized by an increase in values, with a decreasing trend thereafter.
The Fe concentration in water was affected by the duration of the experiment, conductivity and the presence of other metals, including Mn, Al, Cu and Ni:
Fe = −0.0027 − 0.00022 time − 0.000002 conductivity + 0.000163 Mn + 0.225 Al + 1.246 Cu + 0.612 Ni ± 0.0093, (p < 0.000), R2 = 0.67).

3.2.7. Nickel

In sediments collected from the Strzegomka River, nickel release was the weakest in a neutral environment (0.0016 mg/L). An increasing tendency was regularly observed there. Similarly, but in the range of higher values, it was in the case of an alkaline reaction. In this case, the strongest increase of values occurred from the 3rd hour and reached the level of 0.0149 mg/L (Table S9). Under acidic conditions, after the first 15 min, the nickel level increased strongly to 0.0154 mg/L and then was subject to a decrease. At both alkaline and acidic conditions, a slight increase in the values was found in the last measurement (96 h).
In the Nysa Szalona, the level of nickel was stable in alkaline and acidic conditions after the initial increase (Table S9). During the last measurement, a slight increase in values was observed in neutral and acidic conditions and a decrease in values in alkaline ones.
Nickel release demonstrated a similar tendency in all three environments in the Bystrzyca sediments. A clear initial peak from a value of 0.0001 mg/L in neutral conditions reached up to 0.0014 mg/L (Table S9). In the acidic condition, it was equal to 0.0060 mg/L, and in the alkaline condition, it was 0.0137 mg/L. Further, during the experiment, alternating increases and decreases in the values were noted.
The backward ridge regression equation for nickel takes the following value:
Ni = −0.0047 + 0.00001 conductivity + 2.90 Cd + 0.000019 Mn + 0.246 Cu ± 0.026, (p < 0.000), R2 = 0.78); indicating relationship between Cd and Cu concentration in water.

3.2.8. Cadmium

For all sediments in the Strzegomka River, irrespective of the pH of the solutions, the release of cadmium into the water had an increasing trend. In the neutral solution, the increase was regular and reached its maximum from the 48th hour of the experiment (0.0019 mg/L). In the alkaline solution, a strong release of cadmium compounds up to a value of 0.0045 mg/L was visible only from the 30th minute (Table S10). The initial increase was particularly evident in the acidic solution with a maximum of 0.0032 mg/L in the first 15 min, after which it decreased by half to the level of 0.0015–0.0017 mg/L and so continued until the end of the experiment.
In the sediments collected from the Nysa Szalona River and placed in the alkaline medium, the largest jump in value from the initial level was observed. The increase found after the first 15 min was maintained at a similar level until the end of the experiment. In the acidic condition, a strong increase was noted from the 15th minute to the 3rd hour, after which a decrease in values was recorded, and at 96 h, a renewed increase was observed. Under neutral conditions, changes were noticeable only from 24 h onwards and remained at 0.0006–0.0008 mg/L (Table S10).
In the Bystrzyca, cadmium migration was stable at the same level from the beginning of the experiment, i.e., from the first 15 min after the start of the experiment, only with slight fluctuations observed until the end of the experiment at 96 h.
Cadmium concentration in water was related to the concentration of, among others, copper and nickel, according to the equation:
Cd = −0.00022 + 0.00043 pH − 0.00001 Fe − 0.0076 Al + 0.1029 Cu + 0.1469 Ni ± 0.00059, (p < 0.000), R2 = 0.83).

3.2.9. Zinc

The migration of zinc compounds from sediment to water was most intense in acidic and least intense in alkaline environments (Table S11). In sediments from the Strzegomka River maintained in acidic and neutral pH, the level of zinc released into water increased until the 3rd hour of the experiment, followed by a decrease. At the 96th hour, an increase in the value was recorded (0.0534 mg/L). Under alkaline conditions, zinc migration initially decreased slightly, but from the 12th hour, it increased again and remained stable until the end of the experiment. For the neutral and alkaline environments, the values were very similar from the 12th hour onwards.
In the Nysa Szalona River, under alkaline conditions, zinc release decreased throughout the study from an initial value of 0.0322 mg/L to 0.0112 mg/L. In neutral and acidic media, after an initial increase in value, particularly high under acidic conditions (0.1109 mg/L), zinc levels also decreased.
A similar trend as for the Nysa Szalona was observed in the Bystrzyca River sediments, with a maximum for the acidic environment of 0.1187 mg/L. The lowest level was recorded for the alkaline reaction and the highest for the acidic one.
The regression function for Zn takes the following form:
Zn = 0.0669 − 0.0128 pH + 0.0000008 conductivity − 0.00016 Mn + 0.344 Al + 1.70 Cu ± 0.016, (p < 0.000), R2 = 0.67).
The effect of Al and Cu concentration in the aquatic environment on Zn concentration is the greatest.
The overall picture of the three rivers and three environments also shows a different trend for the different metals (Figure S2). In each case, changes were observed after the first 15 min. Aluminum and iron were flushed out for up to 3 h, and then there was a decrease in their concentration in the water. For Cu, Ni and Cd, the concentration was stable throughout the experiment after the first 15 min. Zn concentration slowly decreased after 15 min, while a steady increase was observed for Mn.
After the above analysis of individual metals, collecting all the data on their migration from sediments to water and conducting the analysis against the background of the time from the beginning of the experiment until its completion, it turned out that in comparison with the original concentrations of metals in water, a significant influence of time on changes in their concentration, manifested by significant differences, can be observed (Figure 5).
On the other hand, differences between rivers did not significantly affect the release of metals during the experiment (Figure 6), although the geological structure of the area from which sediments were obtained in the present study is not without significance. Hence, the differences are not presented in the paper in the form of graphs. In most catchments of the Nysa Szalona River, minerals are poor, resulting in the weakest release of metals in these sediments. On the other hand, in the catchment of the Bystrzyca River and the Strzegomka River, conglomerates and shales dominate, which are characterized by easy disintegration into finer structures (Table S3).
A number of correlations between metals were observed during the course of the experiment, and a river dependence was detected only for Al (Table 3). Positive correlations between pH and metals were observed for Cu, Fe, Ni, Cd, and negative ones for Al, Mn, and Zn.
As a rule, an increase in the acidity of the environment is the cause of the release of more metals from the sediment into the water than occurs in neutral and alkaline environments. In the case of electrolytic conductivity, an increase in value also indicates increased migration of metals into solution. The same is observed when the amount of organic matter increases [18]. This is confirmed by literature data from different parts of the world. Such observations for metals (Zn, Cu, Ni, Cr, Pb, Cd) were also recorded for the bottom sediments of the Chańcza dam reservoir on the Czarna Staszowska River in Poland [38]. Increased acidification as a factor influencing the faster release of metals was also found in sediments of the Innerste River in the Harz Mountains, Germany [39]. A similar relationship was reported by Riba et al. [40] on the Huelva River in southern Spain, where at pH 6.50, greater amounts of Cd, Zn and Cu were released than at pH 7.50 and pH 8.50. The same conclusion was reached by Yang et al. [41] studying soil, which in a sense, has characteristics similar to bottom sediments.
The length of the experiment affects the process of metals released from sediments into water. This is shown by the results presented by Shi and Zhang [23] on the Ganjiang River. They found that the release was strongest on the first day of the experiment and then gradually weakened to remain stable from day 5 onwards. Moreover, the migration of higher amounts of copper than cadmium was also observed. The same conclusions result from the present study of the Bystrzyca, Strzegomka and Nysa Szalona rivers (Figure S2).
Water flow also has a large effect on the process of metals released from sediment into the water. This was the conclusion reached by researchers of sediments from the Le An River in China. Especially strong migration was observed there for copper compounds. Although the present study did not undertake this type of research and simulation under laboratory conditions, as presented in their study by Lu et al. [19], it proves that this type of process can take place in studies of the Nysa Szalona, Bystrzyca and Strzegomka rivers.
When analyzing copper release, in contrast to the present study, more copper was released from bottom sediments from the Le An River in China in acidic environments than in alkaline environments [20]. In contrast, copper ions accumulated in the bottom sediments of the Xiaofu River were strongly released into the water under both acidic and alkaline conditions. Against this background, in neutral environments, the passage of copper from sediment to water is maintained at a lower level [22]. In a study on sediments from Chinese rivers by Huang et al. [21], sediments were subjected to pH 7.00, pH 8.00, and pH 9.00 environments. The alkaline pH of 8.00 released the most copper compounds, similar to the study on the Strzegomka, Nysa Szalona, and Bystrzyca rivers (Figure S1).
The migration of iron was similar to that for the Nysa Szalona, Bystrzyca and Strzegomka for sediments collected from the Dnieper River in Russia studied by Linnik and Zubenko [42]. In the case of manganese, the same authors also found an initial release of manganese into the water, but by the end of the experiment, a decrease in their amount was found. Migration of manganese in sediments takes place starting from the lower layers towards the upper layers relatively slowly. Ionic or molecular diffusion in the pore solution is responsible for this process [43].
Nickel release from the bottom sediments of the Xiaofu River followed a similar pattern as in the present study. It was definitely strongest in an acidic environment, much weaker in an alkaline environment, and weakest in a neutral environment [22]. Similar observations were recorded in the study by Huang et al. [21], and there in neutral pH, the release was evident but proceeded the weakest, similar to the studied sediments of the Bystrzyca, Strzegomka and Nysa Szalona rivers (Figure S1). Copper migration was more intense under alkaline conditions but slightly stronger at pH 8.00 than at pH 9.00.
The process of cadmium release from sediment to water studied by Huang et al. [21] in China shows similarity to the present study of the Nysa Szalona, Bystrzyca and Strzegomka rivers (Figure S1). They found that the highest amounts of cadmium passed from the sediment to the water at neutral pH and at pH 8.00. Other observations were made by Zhang et al. [22], conducting an experiment on the release of cadmium from bottom sediments of the Xiaofu River. There, the cadmium migration process was stronger in an acidic environment against neutral and alkaline conditions. In general, however, the release of cadmium under varying water pH conditions did not vary much among concentrations. Looking at the results of the study, it appears that cadmium moves in small amounts. This is also confirmed by a study on bottom sediments from the Le An River in China; there was little release regardless of the environment [20].
In the case of zinc, we found that the relationship noted in this study of higher zinc release in alkaline environments was also observed in a study of sediments from Chinese rivers by Huang et al. [21]. The authors observed variability in that at neutral and strongly alkaline conditions, the concentration first increased and then decreased, and at pH 8.00, it first decreased, then increased, and finally decreased again. On the other hand, during the study of bottom sediments from the Le An River in China, zinc was released in higher amounts from the sediments in an acidic environment than in an alkaline environment [20].
The mobility of metals in bottom sediments was very comprehensively described on the basis of studies of the North Sea coastal bays and the Elba River [44]. The authors emphasize the significant influence of salinity, the presence of organic matter, low pH values in the acidic range, and changes in redox potential. The conclusions of this work confirm the results of that study, which confirms that the migration of metal ions from sediments to water is dictated by both environmental and natural changes that occur in nature.
A number of other research papers address the aspect of the migration of metals from sediments to overlying waters. This topic is relevant to both fresh and saline surface waters, although salinity should also be considered in the context of pollution. This is mainly valid for freshwater. Research work covering all types of waters, including those on the borderline between fresh and saline, indicates that the movement of metals in the sediment–water layer affects the entire aquatic environment and should be subject to observation and control [45,46,47].
From the point of view of environmental research, there is a special group of chemical compounds that are referred to in legislation as priority substances [48]. This group, among those studied in the present work, includes nickel, cadmium and lead. Their presence in water must be under special surveillance due to their extremely harmful effects on living organisms.
In addition, however, it is worth considering the use of water for drinking purposes, especially since the rivers discussed in the paper summarily constitute a store of such water for the urban agglomerations of southwestern Poland. The current standards for waters that can be a potential source of raw water obtained by water production plants are very detailed and divide waters into three categories of suitability depending on the degree of necessary treatment. All the assumed values for Cu, Ni, Cd, Zn, Fe, and Mn are significantly higher than the values obtained in this experiment. This fact is very satisfying, considering that the artificially created conditions contain very extreme values for water pH [49]. Aluminum is not included in the present standards, but its level can be referred to as the standards applicable to drinking water, which will always be more restrictive, but even here, the values found in the experiment do not exceed the assumed standard [50].

4. Conclusions

The solubility of metals from bottom sediments to water under varying laboratory conditions in acidic and neutral environments for parameters such as pH and electrolytic conductivity increased throughout the experiment. Under alkaline conditions, a decrease in water pH was observed, but conductivity reached higher values with time.
The release of aluminum compounds from sediments to water in all three studied rivers, irrespective of the environmental conditions created, showed an increase in value and then a decrease. This was probably a result of the stabilization of environmental conditions, when, as a result of exchange sorption, the equilibrium between ions in water and bottom sediment is established. In the case of copper, nickel, cadmium and zinc, the lowest amounts were recorded for the river Nysa Szalona, whose catchment was typically lowland. The lowest level for iron was found in the Bystrzyca River (upland catchment) and for aluminum and manganese in the Strzegomka River (upland-northern catchment). The highest migration of aluminum and iron was recorded for the sediments of the Nysa Szalona River, nickel and cadmium for the Strzegomka River, and copper, manganese and zinc for the Bystrzyca River.
The highest migration of aluminum, manganese and zinc was observed in the acidic pH of each river. On the other hand, for copper, cadmium, iron and nickel compounds, the highest values were recorded in sediments placed in alkaline conditions.
Despite the expected relationship between the migration of metals and the level of mineral compounds for each river, no such relationship was found. Most likely, the difference in the level of mineral compounds in the sediment between the rivers is low enough to make a significant effect on the concentration of the tested metals in the water.
In summary, the present study is so far unique for the area, as no studies of sediments from this region of Poland have been published in the literature to date. Artificially created environmental conditions show only a fraction of the situation that could exist in the environment.

Supplementary Materials

The following supporting information can be downloaded at: https://www.mdpi.com/article/10.3390/limnolrev23020004/s1. Table S1. Research sites—the Nysa Szalona River and its tributaries above the Słup dam reservoir; Table S2. Research sites—the Strzegomka River and its tributaries above the Dobromierz dam reservoir; Table S3. Research sites—the Bystrzyca River and its tributaries above the Lubachów dam reservoir; Table S4. Lithological separation for research rivers; Table S5. Aluminum release (mg/L) from bottom sediments of the Strzegomka, Nysa Szalona and Bystrzyca rivers under laboratory conditions; Table S6. Copper release (mg/L) from bottom sediments of the Strzegomka, Nysa Szalona and Bystrzyca rivers under laboratory conditions; Table S7. Manganese release (mg/L) from bottom sediments of the Strzegomka, Nysa Szalona and Bystrzyca rivers under laboratory conditions; Table S8. Iron release (mg/L) from bottom sediments of the Strzegomka, Nysa Szalona and Bystrzyca rivers under laboratory conditions; Table S9. Nickel release (mg/L) from bottom sediments of the Strzegomka, Nysa Szalona and Bystrzyca rivers under laboratory conditions; Table S10. Cadmium release (mg/L) from bottom sediments of the Strzegomka, Nysa Szalona and Bystrzyca rivers under laboratory conditions; Table S11. Zinc release (mg/L) from bottom sediments of the Strzegomka, Nysa Szalona and Bystrzyca rivers under laboratory conditions; Figure S1. Metal concentration depending on water pH 1—neutral, 2—acidic, 3—alkaline; Figure S2. Metal content depending on the time elapsed since the start of the experiment (mean for all environments).

Author Contributions

Conceptualization, M.S., M.K.-G. and A.W.-G.; methodology, M.S.; software, M.K.-G.; validation, M.S., M.K.-G. and K.C.; formal analysis, M.S. and M.K.-G.; investigation, M.S. and M.K.-G.; resources, M.S.; data curation, M.S. and A.W.-G.; writing—original draft preparation, M.S.; writing—review and editing, K.C.; visualization, M.S., M.K.-G. and K.C.; supervision, M.S. All authors have read and agreed to the published version of the manuscript.

Funding

This research received no external funding.

Data Availability Statement

Not applicable.

Conflicts of Interest

The authors declare no conflict of interest.

References

  1. Kabata-Pendias, A.; Pendias, H. Biogeochemistry of Trace Elements; PWN: Warsaw, Poland, 1999. [Google Scholar]
  2. Market, B. Presence and significance of naturally occurring chemical elements of the periodic system in the plant organism and consequences for future investigations on inorganic environmental chemistry in ecosystems. Vegetatio 1992, 103, 1–30. [Google Scholar] [CrossRef]
  3. Matschullat, R.; Ottenstein, R.; Reimann, C. Geochemical background—Can we calculate it? Environ. Geol. 2000, 39, 9. [Google Scholar] [CrossRef]
  4. Siregar, A.S.; Sulistyo, I.; Prayogo, N.A. Heavy metal contamination in water, sediments and Planiliza subviridis tissue in the Donan River, Indonesia. J. Water Land Dev. 2020, 45, 157–164. [Google Scholar]
  5. Mandeng, E.P.B.; Bidjeck, L.M.B.; Bessa, A.M.E.; Ntomb, Y.D.; Wadjou, J.W.; Doumo, E.P.E.; Dieudonne, L.B. Contamination and risk assessment of heavy metals, and uranium of sediments in two watershed in Abiete-Toko gold district, Southern Cameroon. Heliyon 2019, 5, e02591. [Google Scholar] [CrossRef] [Green Version]
  6. Luoma, S.N.; Rainbow, P.S.; DiLeo, J. Metal Contamination in Aquatic Environments. Science and Lateral Management; Cambridge University Press: Cambridge, UK, 2008. [Google Scholar]
  7. Gaillardet, J.; Viers, J.; Dupré, B. Trace Elements in River Waters. In Treatise Geochem, 2nd ed.; Elsevier: Amsterdam, The Netherlands, 2014; Volume 7, pp. 195–235. [Google Scholar]
  8. Kotowski, M.; Wieteska, E.; Pawłowski, L.; Kozak, Z. Characteristics of the Occurrence of Various Forms of Aluminum in Selected Elements of the Environment in Poland; PIOŚ, OW OIKOS: Warsaw, Poland, 1994. [Google Scholar]
  9. Sposito, G. The Environmental Chemistry of Aluminum; ImprintCRC Press: London, UK, 1996. [Google Scholar]
  10. Barabasz, W.; Albińska, D.; Jaśkowska, M.; Lipiec, J. Ecotoxicology of aluminium. Pol. J. Environ. Stud. 2002, 11, 199–203. [Google Scholar]
  11. Kotowski, M.; Saczuk, M. Aluminium in water and soil environment. Ekoinżynieria 1997, 2, 22–29. [Google Scholar]
  12. Miller, T.E.; Iqbal, N.; Reader, S.M.; Mahmood, A.; Cant, K.A.; King, I.P. A cytogenetic approach to the improvement of aluminium tolerance in wheat. New Phytol. 1997, 137, 93–98. [Google Scholar] [CrossRef]
  13. Borkowska, B. Aluminium toxicity (Al). Wiad. Bot. 1998, 32, 157–166. [Google Scholar]
  14. Ciszewski, D.; Malik, I.; Wardas, M. Geomorphological influences on heavy metal migration in fluvial deposits: The Mała Panew River valley (Southern Poland). Przegl. Geol. 2004, 52, 163–174. [Google Scholar]
  15. Appelo, C.; Postma, D. Modeling the Hydrogeochemical Processes and Source of Ions in the Groundwater of Aquifers within Kasra-Nukhaib Region (West Iraq). In Geochemistry, Groundwater and Pollution, 2nd ed.; Balkmema: Rotterdam, The Netherlands, 2005. [Google Scholar]
  16. Ponnamperuma, F.N. The Chemistry of Submerged Soils. Adv. Agron. 1972, 24, 29–98. [Google Scholar]
  17. Korzeniewski, K. Hydrochemistry; WSP: Słupsk, Poland, 1986. [Google Scholar]
  18. Miranda, L.S.; Wijesiri, B.; Ayoko, G.A.; Egpdawatta, P.; Goonetilleke, A. Water-sediment interactions and mobility of heavy metals in aquatic environments. Water Res. 2021, 202, 117386. [Google Scholar] [CrossRef]
  19. Lu, J.; Cai, H.; Zhang, X.; Fu, Y. Release flux of heavy metals from river sediments at different flow rates. Water Supply 2022, 22, 542–554. [Google Scholar] [CrossRef]
  20. Wen, X.; E Allen, H. Mobilization of heavy metals from Le An River sediment. Sci. Total Environ. 1999, 227, 101–108. [Google Scholar] [CrossRef]
  21. Huang, Y.; Zhang, D.; Xu, Z.; Yuan, S.; Li, Y.; Wang, L. Effect of overlying water pH, dissolved oxygen and temperature on heavy metal release from river sediments under laboratory conditions. Arch. Environ. Prot. 2017, 43, 28–36. [Google Scholar] [CrossRef] [Green Version]
  22. Zhang, Y.; Zhang, H.; Zhang, Z.; Liu, C.; Sun, C.; Zhang, W.; Marhaba, T. pH Effect on Heavy Metal Release from a Polluted Sediment. J. Chem. 2018, 2018, 7597640. [Google Scholar] [CrossRef]
  23. Shi, X.; Zhang, W. Experimental study on release of heavy metals in sediment under hydrodynamic conditions. IOP Conf. Ser. Earth Environ. Sci. 2018, 208, 012040. [Google Scholar] [CrossRef]
  24. Senze, M.; Kowalska-Góralska, M.; Wondołowska-Grabowska, A. Evaluation of bottom sediment contamination with trace metals on the example of a lowland dam reservoir in Slup, Lower Silesia. Ochrona Środ. 2017, 39, 51–56. [Google Scholar]
  25. Senze, M.; Kowalska-Góralska, M.; Czyż, K.; Wondołowska-Grabowska, A.; Łuczyńska, J. Aluminum in Bottom Sediments of the Lower Silesian Rivers Supplying Dam Reservoirs vs. Selected Chemical Parameters. Int. J. Environ. Res. Public Health 2021, 18, 13170. [Google Scholar] [CrossRef]
  26. PIG 2022. State Research Institute—National Research Institute in Warsaw. Characteristics of the Geological Structure of Lower Silesia. Available online: https://www.pgi.gov.pl/wroclaw/oddzial-dolnoslaski/opracowania/geologia-dolnego-slaska/charakterystyka-budowy-geologicznej-dolnego-slaska.html (accessed on 15 May 2023).
  27. GIOŚ. Chief Inspectorate of Environmental Protection. In Report on the State of the Environment; Chief Inspectorate of Environmental Protection: Warsaw, Poland, 2018. (In Polish) [Google Scholar]
  28. PN-EN ISO 5667-15:2009E; Water Quality—Sampling—Guidelines for the Fixation and Handling of Sewage Sludge and Bottom Sediment Samples. The Polish Committee for Standardization (Polski Komitet Normalizacyjny—PKN): Warsaw, Poland, 2009.
  29. PN-EN ISO 5667-19:2005E; Water Quality—Sampling—Part 19: Guidelines for Mari ne Sediment Sampling. The Polish Committee for Standardization (Polski Komitet Normalizacyjny—PKN): Warsaw, Poland, 2005.
  30. PN-90/C-04540.01; Water and Wastewater—pH, Acidity and Alkalinity Tests—Determination of pH of Water and Wastewater with Specific Electrolytic Conductivity of 10 Microsiemens/cm and above by Electrometric Method. The Polish Committee for Standardization (Polski Komitet Normalizacyjny—PKN): Warsaw, Poland, 1990.
  31. PN-EN ISO 10390:2022-0; Soil, Treated Bio-Waste and Sewage Sludge—Determination of pH. The Polish Committee for Standardization (Polski Komitet Normalizacyjny—PKN): Warsaw, Poland, 2022.
  32. PN-75/C-04616.01; Water and Wastewater. Special Tests of Sludge. Determination of Water, Dry Matter, Organic Matter and Mineral Content in Sewage Sludge. The Polish Committee for Standardization (Polski Komitet Normalizacyjny—PKN): Warsaw, Poland, 1975.
  33. PN-ISO 11048:2002; Soil Quality—Determination of Water-Soluble and Acid-Soluble Sulfate(VI). The Polish Committee for Standardization (Polski Komitet Normalizacyjny—PKN): Warsaw, Poland, 2002.
  34. PN-EN ISO 12020:2002; Total Aluminium by Electrothermal Atomic Absorption Spectrometry. The Polish Committee for Standardization (Polski Komitet Normalizacyjny—PKN): Warsaw, Poland, 2002.
  35. PN-ISO 8288:2002; Water Quality. Determination of Cobalt, Nickel, Copper, Zinc, Cadmium and Lead—Flame Atomic Absorption Spectrometry Methods. The Polish Committee for Standardization (Polski Komitet Normalizacyjny—PKN): Warsaw, Poland, 2002.
  36. PB-10/I-1998; Test Procedure. VARIAN’s Analytical Methods. The Polish Committee for Standardization (Polski Komitet Normalizacyjny—PKN): Warsaw, Poland, 1998.
  37. Senze, M.; Kowalska-Góralska, M.; Dobicki, W. Migration of aluminium from bottom sediments into water in laboratory conditions. Teka Kom. Ochr. Kształtowania Sr. Przyr.-OL PAN 2009, 6, 285–291. [Google Scholar]
  38. Baran, A.; Tarnawski, M.; Jasiewicz, C.Z. Assessment of the content and solubility of heavy metals in bottom sediments of the Chańcza reservoir. Ecol. Chem. Eng. A 2011, 18, 941–950. [Google Scholar]
  39. Gäbler, H.E. Mobility of heavy metals as a function of pH of samples from an overbank sediment profile contaminated by mining activities. J. Geochem. Explor. 1997, 58, 185–194. [Google Scholar] [CrossRef]
  40. Riba, I.; Del Valls, T.Á.; Forja, J.M.; Gòmez-Parra, A. The influence of pH and salinity on the toxicity of heavy metals in sediment to the estuarine clam Ruditapes philippinarum. Environ. Toxicol. Chem. 2004, 23, 1100–1107. [Google Scholar] [CrossRef] [PubMed] [Green Version]
  41. Yang, Z.F.; Chen, Y.; Qian, X.; Guo, L.; Zhu, H.Y. A study of the effect of soil pH on chemical species of cadmium by simulated experiments. Earth Sci. Front. 2005, 12, 252–260. [Google Scholar]
  42. Linnik, P.M.; Zubenko, I.B. Role of bottom sediments in the secondary pollution of aquatic environments by heavy-metal compounds. Lake Reserv. Manag. 2000, 5, 11–21. [Google Scholar] [CrossRef]
  43. Lynn, D.C.; Bonatti, E. Mobility of manganese in diagenesis of deep-sea sediments. Mar. Geol. 1965, 3, 457–474. [Google Scholar] [CrossRef]
  44. Förstner, U.; Ahlf, W.; Calmano, W.; Kersten, M.; Salomons, W. Mobility of Heavy Metals in Dredged Harbor Sediments. In Sly, P.G. Sediments and Water Interactions; Springer: New York, NY, USA, 1986; pp. 371–380. [Google Scholar]
  45. Osae, R.; Nukpezah, D.; Darko, D.A.; Mensah, A. Heavy metal mobility, bioavailability, and potential toxicity in sediments of the Korle lagoon in Ghana. Int. J. Environ. Stud. 2022. [Google Scholar] [CrossRef]
  46. Marques, L.; Reis, D.; Nascimento, L.; Oliveira, E.; Santiago, A.; Roeser, H. Mobility of metals in river sediments from a watershed in the Iron Quadrangle, Brazil. Geochim. Bras. 2019, 33, 273–285. [Google Scholar] [CrossRef]
  47. Ahdy, H.; Rifaat, A.; Draz, S. The Speciation and Potential Mobility of Pb, Cd, Cu and Zn in Lake Qarun Bottom Sediments, Fayioum, Egypt. J. King Abdulaziz Univ. Mar. Sci. 2011, 22, 111–133. [Google Scholar] [CrossRef]
  48. Regulation of the Minister of Maritime Affairs and Inland Navigation of March 1, 2019 on the List of Priority Substances Journal of Laws of March 20, 2019, Item 528); Government Legislation Center: Warsaw, Poland, 2019.
  49. Regulation of the Minister of Maritime Economy and Inland Navigation of August 29, 2019 on the Requirements to Be Met by Surface Waters Used for Supplying the Public with Water Intended for Human Consumption (Journal of Laws of September 13, 2019, Item 1747); Government Legislation Center: Warsaw, Poland, 2019.
  50. Regulation of the Minister of Health of December 7, 2017 on the Quality of Water Intended for Human Consumption (Journal of Laws of December 11, 2017, Item 2294); Government Legislation Center: Warsaw, Poland, 2017.
Figure 1. Location of the study area: (1) Słup reservoir—research sites on the Nysa Szalona River and its tributaries; (2) Dobromierz reservoir—research sites on the Strzegomka River and its tributaries; (3) Lubachów reservoir—research sites on the Bystrzyca River and its tributaries.
Limnolrev 23 00004 g001
Figure 2. Variability of the pH of water during a laboratory experiment on the release of metals from bottom sediments of the Strzegomka, Nysa Szalona and Bystrzyca rivers.
Limnolrev 23 00004 g002
Figure 3. Variability of the electrolytic conductivity (µS∙cm−1) of water during a laboratory experiment on the release of metals from bottom sediments of the Strzegomka, Nysa Szalona and Bystrzyca rivers.
Limnolrev 23 00004 g003
Figure 4. PCA plot 2D showing clustering of metals concentration in water from experiments across 3 rivers and 3 water reactions (1—neutral, 2—acidic, 3—alkaline).
Limnolrev 23 00004 g004
Figure 5. PCA plot 2D showing the clustering of metal concentrations in water from experiments across 3 rivers and 8 h after the start of the experiment.
Limnolrev 23 00004 g005
Figure 6. PCA plot 2D showing clustering of metals concentration in water from experiments across 3 rivers (1—Strzegomka, 2—Nysa Szalona, 3—Bystrzyca).
Limnolrev 23 00004 g006
Table 1. Ranges of metal concentrations in environmental components [1,2].
Metal/UnitAirWatersSoilsPlants
ng∙m−3mg/Lmg∙kg−1mg∙kg−1
Cu0.03–49000.001–0.023–255–30
Cd0.003–0.60.00001–0.000020.0002–0.60.05–0.2
Ni0.10–10.0001–0.00755–220.1–5
Pb0.50–100.0002–0.000325–400.10–5
Zn0.002–0.050.01–0.2210–22010.00–70.00
Fe0.5–60000.49–1.48000–18,00050–200
Mn0.02–9000.02–0.06100–130070–500
Table 2. Chemical properties of bottom sediments before the experiment.
ParameterUnitNysa Szalona
(14 Sites)
Bystrzyca
(10 Sites)
Strzegomka
(5 Sites)
Min–Max
x ¯ ± SD
ReactionpH7.19–7.23
7.21 ± 0.02
7.01–7.03
7.02 ± 0.01
7.50–7.54
7.52 ± 0.02
Mineral compounds%94.48–94.66
94.55 ± 0.08
92.14–92.26
92.19 ± 0.05
96.68–97.68
97.33 ± 0.46
Organic compounds5.62–5.64
5.63 ± 0.01
7.82–7.86
7.84 ± 0.02
2.31–2.36
2.34 ± 0.02
Sulphatesmg·kg−121.48–22.15
21.74 ± 0.29
12.74–12.85
12.79 ± 0.05
13.63–13.68
13.65 ± 0.02
Al12,241–12,243
12,242 ± 0.51
17,345–17,347
17,346 ± 0.54
167–168
168 ± 0.63
Cu86.15–86.25
86.21 ± 0.04
60.23–60.25
60.24 ± 0.01
9.22–9.28
9.25 ± 0.02
Ni142.2–142.9
142.5 ± 0.32
55.14–55.17
55.16 ± 0.01
22.13–22.18
22.16 ± 0.02
Cd1.25–1.28
1.26 ± 0.01
1.07–1.09
1.08 ± 0.01
0.62–0.69
0.65 ± 0.03
Zn405.2–406.6
405.9 ± 0.55
328.2–328.7
328.43 ± 0.22
65.01–65.09
65.06 ± 0.04
Fe19,447–19,448
19,448 ± 0.77
9290–9290
9290 ± 0.01
10,256–10,257
10,256 ± 0.49
Mn170.9–172.2
171.7 ± 0.53
101.3–101.5
101.3 ± 0.11
114.3–114.5
114.3 ± 0.09
Table 3. Spearman Rank Order Correlations.
VariablepHConductivityAlCuMnFeNiCdZnSedimentTimeRiver
pH1.0000−0.4420−0.48970.2323−0.56960.13620.13610.3766−0.76590.45490.0966−0.0187
conductivity−0.44201.00000.21900.19960.4559−0.03080.52390.26380.32380.47150.1755−0.0002
Al−0.48980.21901.00000.17390.71460.41540.0428−0.12930.5431−0.38040.20080.1642
Cu0.23230.19960.17391.00000.08260.48090.64690.7256−0.26980.37880.38860.0346
Mn−0.56960.45590.71460.08261.00000.01360.1789−0.00310.5499−0.33000.50810.0913
Fe0.1362−0.03080.41540.48090.01361.00000.39420.35710.04700.1119−0.1125−0.0443
Ni0.13610.52390.04280.64690.17890.39421.00000.8436−0.14830.64030.3075−0.0743
Cd0.37660.2638−0.12930.7256−0.00310.35710.84361.0000−0.37680.57860.3513−0.0966
Zn−0.76590.32380.5431−0.26980.54990.0470−0.1483−0.37681.0000−0.3927−0.29920.0209
sediment0.45490.4715−0.38040.3788−0.33000.11190.64030.5786−0.39271.00000.00000.0000
time0.09660.17550.20080.38860.5081−0.11250.30750.3513−0.29920.00001.00000.0000
river−0.0187−0.00020.16420.03460.0913−0.0443−0.0743−0.09660.02090.00000.00001.0000
Correlations marked red are significant p < 0.05.
Disclaimer/Publisher’s Note: The statements, opinions and data contained in all publications are solely those of the individual author(s) and contributor(s) and not of MDPI and/or the editor(s). MDPI and/or the editor(s) disclaim responsibility for any injury to people or property resulting from any ideas, methods, instructions or products referred to in the content.

