Fiber Bragg Grating Salinity Sensor Array Based on Fiber Tapering and HF Etching
by
 , ,
, ,
Gaochao Li
1,2, 
Yongjie Wang
1,2,*,
Mengchao Yan
1,3,
Tuanwei Xu
1,2,
Ancun Shi
1,
Yuanhui Liu
1,
Xuechun Li
1,4 and
Fang Li
1,2,* 1
State Key Laboratory of Transducer Technology, Institute of Semiconductors, Chinese Academy of Sciences, Beijing 100083, China
2
College of Materials Science and Opto-Electronic Technology, University of Chinese Academy of Sciences, Beijing 100049, China
3
School of Mechanical and Power Engineering, Henan Polytechnic University, Jiaozuo 454000, China
4
School of Optoelectronic Science and Engineering, University of Electronic Science and Technology of China, Chengdu 611731, China
*
Authors to whom correspondence should be addressed.
Photonics 2023, 10(12), 1315; https://doi.org/10.3390/photonics10121315
Submission received: 20 October 2023
/
Revised: 23 November 2023
/
Accepted: 24 November 2023
/
Published: 29 November 2023
(This article belongs to the Special Issue Progress and Prospects in Optical Fiber Sensing)
Abstract
:We propose a seawater salinity sensor array based on a micro/nanofiber Bragg grating structures, which allows for the simultaneous measurement of temperature and salinity. The proposed sensing structure is fabricated through a process involving optical fiber tapering, femtosecond laser inscription, and chemical etching. The equivalent refractive index (RI) of this sensor structure is influenced by the surrounding RI, resulting in a Bragg characteristic wavelength shift that can be used for salinity sensing. The experimental results show that the salinity sensitivity for two cascaded sensor arrays is 8.39 pm/‰ and 7.71 pm/‰, while the temperature sensitivity is 8.28 pm/°C and 8.03 pm/°C, respectively. This sensor structure is compact, exhibits excellent linearity, and offers good repeatability. It holds great potential for applications in seawater environmental monitoring and quantitative studies of seawater dispersion characteristics.
1. Introduction
Seawater salinity is a crucial parameter in the study of oceanic properties, with its distribution affecting and influencing various elements, such as hydrology [1], chemistry [2], and biology [3]. Traditional methods for measuring seawater salinity, such as the conductivity method, primarily focus on practical salinity and may overlook the non-ionic components present in seawater. The TEOS-10 (2010 Thermodynamic Equation of Seawater) [4] introduced the concept of absolute salinity. Considering that conductivity measurements of seawater salinity ignore non-conductive components, optical methods can overcome this systematic error. However, the relationship between seawater salinity and RI is affected by variables such as the temperature, pressure, and wavelength. Notably, within the visible light spectrum (400–700 nm), a 300 nm wavelength change can l leads to an RI difference of −0.013, which is 1.44 times the effect caused by a 43‰ salinity change [5]. To enhance the universality of RI and salinity calibrations and improve the accuracy of optical fiber salinity sensors, it is necessary to consider the impact of dispersion and study the seawater dispersion characteristics. Given the specific wavelength requirements for dispersion research, optical fiber salinity sensors used for calibration should possess wavelength-selective properties and multiplexing capabilities.
Current seawater optical fiber salinity sensors [6] are mainly developed based on techniques such as the optical fiber surface plasmon resonance (SPR) [7], interferometry [8], and fiber Bragg grating (FBG) [9]. Among these methods, the fiber Bragg grating is a widely used fundamental optical fiber component known for its unique wavelength-selective properties. However, conventional FBG [10] sensors are not inherently sensitive to external salinity changes because their core is not directly exposed to the surrounding medium. To enhance their salinity sensing capabilities indirectly, in 2002, Jun et al. [11] coated FBGs with hydrogels to measure the salinity through stress. This approach, which can be used to obtain salinity measurements, suffers from lower accuracy, reduced linearity, longer response times, and significant zero drift. In 2008, Men et al. [12] used a dual-FBG configuration with different coatings to achieve simultaneous measurements of seawater temperature and salinity. The salinity sensitivity was approximately 0.0165 nm/M (this can be converted to 0.299 pm/‰, where ‘M’ represents mol/L), while the temperature sensitivity was approximately 0.0102 pm/°C. However, this approach still faces accuracy-related issues.
As manufacturing processes advance, the thinned or etched fiber segment containing the inscribed FBG can be used for direct salinity measurements. In 2018, Aliya et al. [13] designed an etched FBG (EFBG), which is made by etching the FBG section with hydrofluoric (HF) acid. This salinity sensor achieved an impressive resolution of up to 10−4 refractive index units (RIU), and offers the advantage of a cost-effective manufacturing process. To further enhance the sensitivity of EFBG salinity measurements, in 2020, Yadvendra et al. [14] introduced reduced graphene oxide (rGO) particles attached to the surface of the EFBG. Compared to EFBG without rGO, this modification increased the salinity sensitivity by 135%. Additionally, the coated rGO effectively reduced the temperature sensitivity, minimizing the cross-sensitivity to temperature changes. Beyond basic salinity measurements, EFBGs can also be used to measure the concentration of certain metal ions. In 2022, Vajresh et al. [15] proposed a sensing structure for measuring Pb2+ ions in salt solutions. This structure was created by applying an MA-AuNP spin-coating to EFBG with a diameter of 11.68 μm (±1 μm). However, it is worth noting that EFBGs derived directly from etching single-mode optical fibers may have a relatively lower mechanical strength and reliability. Additionally, prolonged etching processes can introduce uncertainties that affect the repeatability and consistency of sensor fabrication, making it less conducive for mass production.
In contrast, long-period fiber gratings (LPFGs) [16], with grating periods typically ranging from tens to hundreds of micrometers, represent a type of transmission fiber grating. In contrast to FBGs that reflect specific wavelengths of light, LPFGs couple light into the cladding for dissipation. They are known for their low insertion loss, wide bandwidth, ease of fabrication, and integrative properties. LPFGs can be directly utilized for salinity sensing and exhibit high sensitivity to changes in ambient medium salinity over a wide range [17,18]. However, LPFGs have relatively broad transmission dips [19], leading to lower measurement accuracy. Additionally, their longer length restricts their application in small-sized precision sensor devices. In contrast to FBGs, LPFGs do not support multiplexing systems, rendering them unable to meet the array requirements of modern seawater salinity sensors.
Micro/nanofibers (MNFs) [20] possess strong evanescent fields, small dimensions, and tight optical confinement characteristics. MNFs, typically tapered from conventional single-mode fibers, exhibit excellent surface smoothness, highly uniform diameters, and integrity. These qualities impart low waveguide losses and exceptional mechanical performance, making them highly reliable for sensor applications. An influential tool for manufacturing fiber gratings is the femtosecond laser, which can inscribe gratings in almost any type of optical fiber [21]. Previous research [22] has demonstrated that FBGs can be inscribed on MNFs with a diameter of 2 μm, achieving a sensitivity of up to 231 nm/RIU. In another study [23], FBGs were inscribed on an MNF with a length of 518 μm and a diameter of 1.8 μm, achieving a sensitivity of 660 nm/RIU. These approaches to inscribing FBGs on MNFs offer both strong evanescent fields and good mechanical performance while retaining wavelength-selective characteristics. To the best of our knowledge, there is currently limited research on the fabrication of MNFBG arrays within MNFs.
In this paper, we propose an MNFBG sensor array structure composed of two cascaded MNFBG sensors. This array structure allows for the direct measurement of the RI in the surrounding environment using evanescent fields, enabling salinity measurements. Both sensors employ the waist of MNFs that are tapered after pulling from conventional single-mode fibers as the inscription region for the femtosecond laser. To enhance the sensitivity of each sensor, a low-concentration HF treatment is applied to the entire taper region to reduce uncertainties during the etching process. The optical sensing characteristics of the MNFBG array were studied theoretically through simulations and experimental investigations. The reflection spectra of the MNFBG array include two Bragg characteristic peaks, enabling multiplexed salinity measurements. This sensor array achieves salinity sensitivities of 8.39 pm/‰ and 7.71 pm/‰, with temperature sensitivities of 8.28 pm/°C and 8.03 pm/°C.
2. Structure and Principle of the Optical Fiber Sensor
The Bragg wavelength λBragg of the conventional FBG is determined by the phase matching condition [24], i.e.,
where Λ is the grating period and neff is the effective RI of the core mode. It can be derived that:
Here, Δneff denotes the change in the effective RI of the core’s guided mode. Furthermore, in accordance with the theory of optical fiber waveguides, the effective RI of the fundamental mode in single-mode micro-nano fibers can be represented as:
where represents the normalized coefficient of the optical fiber, and the transverse propagation constant is . U and V satisfy the eigen equation of the optical fiber LP mode:
Here, when setting m to 1, it corresponds to the fundamental mode state. Normalized transverse decay parameters , , , , and represent the core radius, core RI, cladding and outer environment’s equivalent RI, phase factor, and propagation constant, respectively. By employing the Gaussian field approximation to simplify the eigenvalue equation, the single-mode optical fiber LP01 fundamental mode can be derived as follows:
Comparing the U–V relationship curve corresponding to Equation (5) with the U–V curve obtained from numerical simulations of the exact solution to the eigenvalue equation, it was previously concluded [25] that the error does not exceed 3% within the range of V < 4. Therefore, this approximation method is theoretically valid. By substituting Equation (5) into Equation (3), and then into Equation (2), we can obtain the following:
It can be concluded that the effective refractive index neff is a function of the core radius r, and the refractive index n2 is a function of the surrounding environment and cladding. By taking the derivative of Equation (6) with respect to n2, we can obtain the sensitivity of the effective refractive index neff to changes in n2:
The aforementioned derivation process is elaborately detailed in reference [25]. It can be observed that the RI sensitivity S is a nonlinear function of the RI of the surrounding environment and cladding n2, as well as the core radius r. Based on the theoretical process described above, reducing the core radius also enhances the RI sensitivity of the MNFBG.
When FBGs are inscribed in standard single-mode optical fibers (SMFs), mode coupling occurs within the core-guided modes for both forward and backward propagation. If the phase-matching condition is met, resonance occurs at a specific wavelength. Nevertheless, because only a very small portion of the energy from the core-guided mode extends into the surrounding medium, FBG structures are almost incapable of measuring the environmental salinity. To address this issue, a possible approach is to taper or etch the optical fiber in the sensing region. When the optical fiber is tapered, the core and cladding proportionally shrink, causing light to diffuse more into the cladding. This change in the energy distribution of the core mode expands the mode field into the cladding and even the surrounding environment, allowing for the effective RI of the core mode to be influenced by the RI of the environment. Consequently, this leads to a shift in the Bragg wavelength. Additionally, after applying a shorter-duration etching process with lower-concentration HF, the entire region of the optical fiber undergoes some degree of thinning. In the non-tapered region, as the ratio of the cladding to the core diameter (Dcl/Dco) does not change significantly, the transmission mode within this area remains largely unaltered. In the tapered region, however, Dcl/Dco significantly changes when the same cladding is etched, resulting in an increased sensitivity of the effective RI to the RI of the environment.
In simulations, we investigated the variations in the effective RI in the optical fiber sensing region with respect to changes in the optical fiber diameter during two distinct processes (tapering and etching). Qualitatively, both methods were found to effectively reduce the optical fiber diameter, enhancing the susceptibility of the core and cladding modes to environmental disturbances outside the optical fiber [26]. In the simulations, the core and cladding diameters were set to 9 μm and 125 μm, respectively. The RIs of the core and cladding were 1.4504 and 1.4437, respectively. Figure 1a displays the simulation curves of neff as a function of the post-tapering optical fiber diameter change in the surrounding media with different RIs. After post-tapering is performed, the core diameter was proportionally reduced along with the cladding diameter, resulting in a nonlinear decrease in neff as the cladding diameter changed from 125 μm to 25 μm, while the core diameter was tapered down to 1.8 μm. Nevertheless, as the cladding diameter was still relatively large, it did not exhibit a noticeable response to changes in the surrounding medium’s RI, and neff remained almost unchanged when the ambient medium’s RI was varied. Further simulations were conducted to study the chemical etching of the post-tapered optical fiber. As depicted in Figure 1b, in different RI media, neff exhibited more pronounced differences, starting at a diameter of 15 μm, and continued to diverge as the etching progressed, i.e., as the diameter decreased. This conclusion indicates that the influence of the ambient RI on the optical fiber’s core mode becomes more significant as the optical fiber diameter decreases. Therefore, by tapering and etching the optical fiber to a smaller diameter, it is possible to manufacture MNFBGs to construct sensors with a higher salinity sensitivity.
A schematic diagram of the MNFBG array structure is shown in Figure 2. The micro/nanofiber obtained by tapering a single-mode optical fiber has a waist region and two taper regions, with the taper regions serving as transitions that connect an SMF to the narrower waist region. The entire taper region is chemically etched using an HF solution to reduce the cladding diameter. Incident light is transmitted through a regular single-mode optical fiber to the etched single-mode fiber region. Then, it is coupled into the waist region through the taper region. In the waist region, two MNFBGs are integrated in a cascading manner, each reflecting different characteristic spectra. The system demodulates the RI of the test solution by detecting the peak shifts of the two Bragg reflection peaks.
3. Fabrication and Experimental Results
The core and cladding diameters of the single-mode optical fiber (manufacturer: YOFC, Wuhan, China) used for the sensor fabrication are 9 μm and 125 μm, respectively. The MNFBG fabrication process consists of three steps, as illustrated in Figure 3a. In the first step, the bare fiber section is placed in fixtures at both ends of a specialized optical-fiber-processing platform (3SAE Large Diameter Splicer, 3SAE Technologies Inc., Franklin, TN, USA, LDS 2.5) configured for bidirectional tapering. The tapering parameters are set as follows: a waist diameter of 25 micrometers, corresponding to a core diameter of approximately 1.8 micrometers, a waist length of 10 mm, and a taper length of 15 mm. These parameters adhere to adiabatic conditions [27], ensuring that the taper angle does not exceed the diffraction divergence angle of the fundamental mode. As a result, significant changes in the light propagation do not occur within the taper.
In the second step, as depicted in Figure 3b, the optical fiber is transferred to the femtosecond laser processing platform from Light Conversion, known as the Carbide series. The laser beam is guided to the waist of the tapered optical fiber, with a wavelength of 1030 nm, a pulse width of less than 290 fs, a 20× objective lens (MITUTOYO, Kawasaki, Japan, numerical aperture 0.4), and an approximate laser power of 12 mW. There are two areas that need to be processed for the gratings, with both grating lengths measuring 3 mm, and a relative separation of 3 mm to ensure there is no interference between them. The grating writing method employs a line-by-line approach with a line length of 4 μm. Compared to the point-by-point writing method, the line-by-line approach offers more significant modulation effects on the optical field within the narrower optical fiber. The grating periods for MNFBG-1 and MNFBG-2 are 1.06 μm and 1.07 μm, respectively.
In the third step, as illustrated in Figure 3c, the optical fiber is transferred to a polytetrafluoroethylene (PTFE) mold and fixedly encapsulated using UV-curable adhesive. The sensing structure is then subjected to corrosion with a 15% HF solution. The diameter of the structure is 25 μm before the start of the corrosion process, and it decreases to 11.5 μm in the waist region by the end of the process. After the corrosion is completed, a 10% NaOH treatment is applied to neutralize any residual HF on the corroded optical fiber. Finally, the fiber is rinsed with deionized water. The entire manufacturing process achieves a yield rate of over 50%.
Figure 4 depicts the spectral changes during the corrosion process, which lasts for a total of 150 min, with spectral information recorded every 30 min. Throughout the entire corrosion process, both MNFBG-1 and MNFBG-2 exhibited good linearity in their Bragg wavelength shifts, with average blueshift rates of 0.0265 nm/min and 0.0257 nm/min, respectively. After the etching process concludes, the total blueshifts of the Bragg wavelengths for MNFBG-1 and MNFBG-2 are 3.97 nm and 3.85 nm, respectively. Typically, during the corrosion process of EFBGs, a redshift phenomenon is generated due to exothermic reactions [28], which can interfere with the corrosion process. However, in this experiment, no significant redshift was observed. This can be attributed to two main reasons. First, after tapering, the optical fiber is already thin enough, and its relatively smaller surface area results in less pronounced exothermic reactions. Second, the relatively lower concentration of the HF solution reduces the intensity of the reaction.
The experimental setup for the salinity and temperature sensing system is shown in Figure 5. A demodulator with a resolution of 0.1 pm (Micron Optics, Atlanta, GA, USA, SM 125) is used as the light source and spectrometer. The reflected spectra are monitored and recorded in real-time by a computer. The sensing structure is encapsulated on a PTFE platform, and both the sensing structure and fixtures are placed in a temperature-controlled water bath. The temperature fluctuation was 0.01 °C.
To investigate the salinity sensing characteristics of the sensor, prior to conducting the experiments, NaCl and deionized water were prepared in solutions with concentrations ranging from 0 to 50‰ at 10‰ intervals using a weight-dilution method while maintaining the environmental temperature at 24 °C. Since the salinity of the solution can be directly measured in this experiment due to its relationship with the RI, as described in the state equation [29], Figure 6a,b display the reflected spectra of the proposed MNFBG-1 and MNFBG-2 for different concentrations of the NaCl solutions, respectively. By monitoring the spectra, it can be observed that as the salinity of the solution increases, the neff of the sensing fiber increases, resulting in a redshift of the characteristic peak corresponding to the Bragg wavelength. The linear fitting results shown in Figure 6c,d demonstrate a strong linear relationship between the peak wavelength shift in the reflected spectra of the sensor array and the measured solution salinity, with R2 values of 0.9974 and 0.9969, respectively. According to the linear fitting results, the sensor provides a salinity sensitivity of 8.39 pm/‰ and 7.71 pm/‰ in the range of 0–50‰ NaCl solutions. According to the calculation methods in references [30,31], the sensor resolution is 25.02 pm, and the Detection Limits (DLs) for salinity measurements are 2.982‰ and 3.245‰.
Additionally, because FBGs are inherently sensitive to temperature, we also assessed the sensor’s temperature-sensing characteristics. MNFBGs, along with their fixed molds, were immersed in a beaker containing deionized water, which was placed in a temperature-controlled water bath. The heating temperature of the hotplate was maintained at a constant temperature for 15 min at each step to ensure an even temperature distribution in the water. The recorded reflected spectra, as shown in Figure 7a,b, reveal that the Bragg wavelengths of MNFBG-1 and MNFBG-2 undergo a redshift as the temperature increases from 0 to 20 °C. This shift can be attributed to the thermal-optic and elasto-optic effects of both the solution and the optical fiber. As depicted in Figure 7c,d, the linear fitting results demonstrate a strong linear relationship between the peak wavelength shift in the reflected spectra and temperature variations, with R2 values of 0.9983 and 0.9950. According to the linear fitting results, the sensor provides temperature sensitivities of 8.28 pm/°C and 8.03 pm/°C in deionized water within the temperature range of 0–20 °C.
Based on the above experimental results, by collecting the sensitivity of the Bragg wavelengths, we introduce a sensitivity matrix for temperature and salinity. Thus, the changes in the salinity and temperature of water can be determined by the readings of the wavelength shifts of the two gratings.
where and correspond to the wavelength shifts of MNFBG-1 and MNFBG-2, with = 8.28 pm/°C and = 8.03 pm/°C representing the temperature sensitivities of the two sensors, and =8.39 pm/‰ and = 7.71 pm/‰ representing the salinity sensitivities of the two sensors.
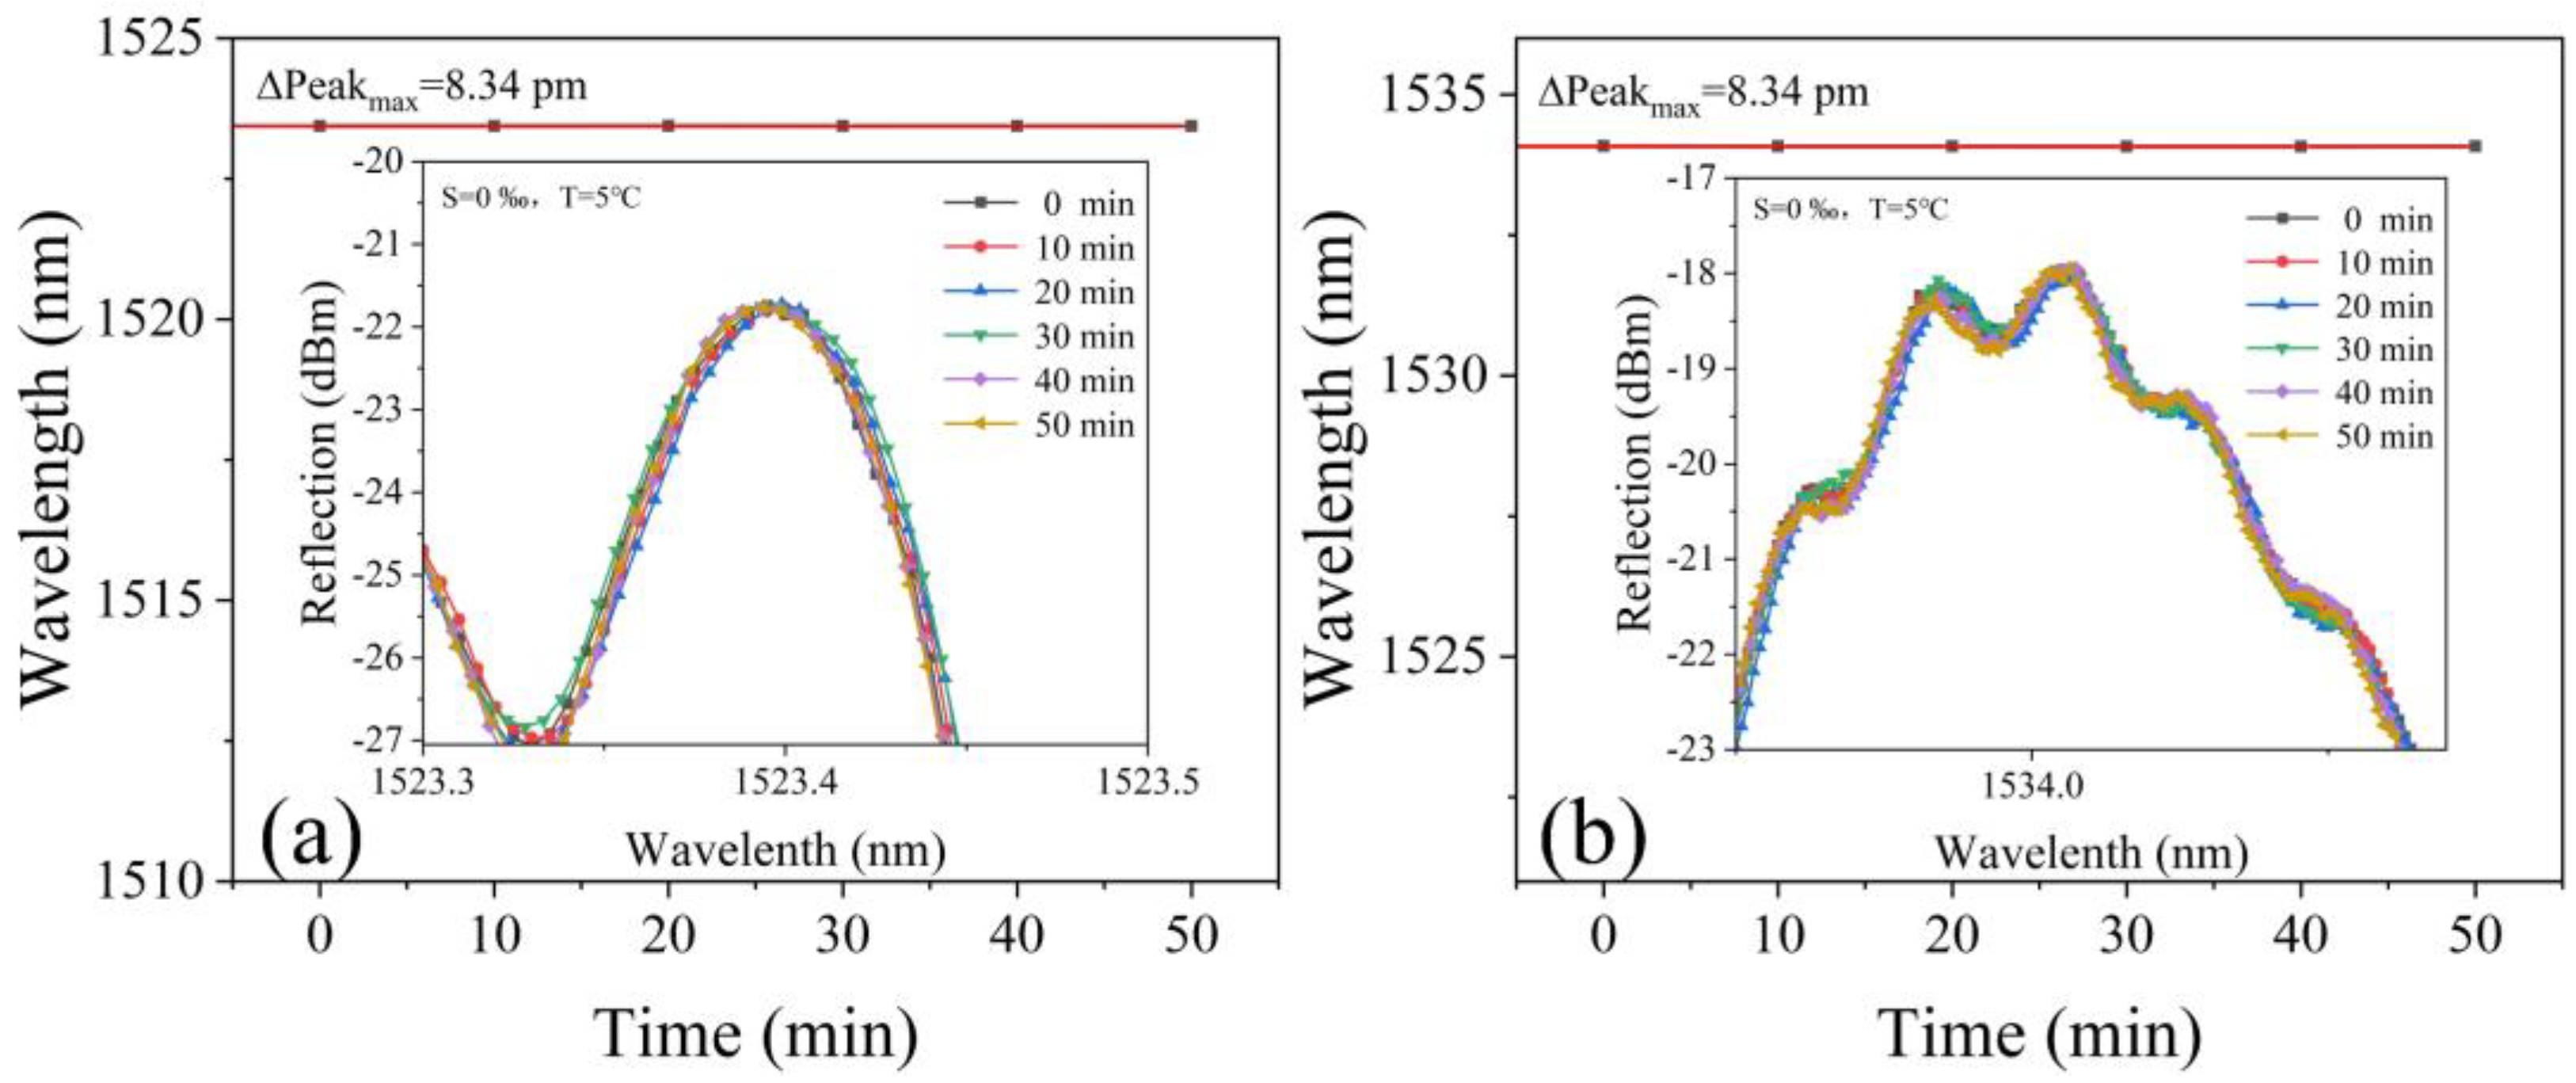
In practical applications in marine environments, the stability, repeatability, and performance of the sensor are of paramount importance. To assess the time stability, we investigate the impact of continuous operation under conditions of 0‰ salinity and 5 °C on the characteristic spectral curves. Reflectance spectra were recorded every 10 min, as shown in Figure 8a,b. The maximum wavelength shift of the FBG peak position is 8.34 pm, which provides ±1 °C of temperature fluctuations.
To validate the repeatability of the sensor, at a temperature of 20 °C, we initially tested it with deionized water and then with 30‰ saline water. After each test, the sensing structure was rinsed with deionized water. This process was repeated six times. The results of the salinity repeatability test are shown in Figure 9. From the curves, it is evident that, under the same salinity, the characteristic wavelength shift remains slightly altered with a maximum deviation error of less than 20.0 pm.
4. Discussion
The fabrication process of the proposed structure involves optical fiber tapering, femtosecond laser inscription, and chemical etching. Table 1 provides a concise comparison between the proposed structure and other representative optical fiber grating salinity sensors. In particular, the refractive index sensors designed in documents [13,22] are also salinity sensors in essence.
In terms of durability, in contrast to the F–P structures where seawater must pass through an F–P cavity, the proposed structure measures the RI of the surrounding seawater through evanescent waves, reducing interference from contaminants such as sediments in seawater. Additionally, this structure does not require additional coatings on the optical fiber, further enhancing the sensor’s durability. It is expected that the mass production of this type of sensor can be achieved through the improvement of manufacturing and packaging processes in the future.
Regarding sensor sensitivity, in comparison to the MNFBG structures that rely solely on chemical etching, the structure proposed in this study features a thinner core after tapering, increasing the sensitivity of salinity measurements. The proposed MNFBG structure exhibits a higher theoretical sensitivity, with RI sensitivities of 11.7 nm/RIU and 10.7 nm/RIU after conversion based on the salinity and RI relationships [29]. Comparative results from other studies confirm the superior salinity measurement sensitivity of this structure. The sensitivity of this sensor’s structure can be further improved through enhanced etching, albeit at the expense of the mechanical strength, impacting its durability. In the future, optimizing the encapsulation structure can address this issue, offering significant potential for enhancing salinity sensitivity.
In the context of quantifying seawater dispersion characteristics for seawater state equations, we utilize only two cascaded MNFBGs. However, the potential exists to write more serial MNFBGs based on this foundation to achieve quasi-distributed salinity measurements. Considering that the wavelength range in the conversion equation between seawater salinity and refractive index in Ref. [29] does not cover the commonly used band (C + L) for optical fiber sensing, this affects the accuracy of the conversion to salinity when measuring seawater refractive index using optical fiber sensing. We plan to use our device to make measurements that will allow for the extension of the validity range of Millard and Seaver relations [29] in a wavelength. In the future, we plan to use more MNFBGs to construct arrays for extending seawater state equations, which will be highly advantageous for the quantitative study of the seawater’s absolute salinity.
5. Conclusions
In summary, we propose a seawater salinity sensor comprising two cascaded MNFBG structures that allow for the simultaneous measurement of both temperature and salinity. This creates the necessary structure for the sensor. For each MNFBG structure, a section of a single-mode optical fiber is tapered, followed by femtosecond laser inscription and chemical etching. The surrounding RI influences the equivalent RI of the sensor structure, causing shifts in the Bragg characteristic wavelengths and rendering it appropriate for salinity sensing. Temperature sensing is dependent on the traditional thermal and dilatation effects of FBGs. The experimental results indicate that the two cascaded sensors are sensitive to salinity, with values of 11.7 nm/RIU and 10.7 nm/RIU, respectively, while their temperature sensitivity values are 8.28 pm/°C and 8.03 pm/°C. This sensor structure is small, demonstrates high sensitivity, and offers exceptional compactness. Constancy can be further improved by optimizing temperature control device fluctuations and improving the processing process. It shows great potential for use in the monitoring of marine environments and in the quantitative examination of seawater dispersion properties.
Author Contributions
G.L.: methodology and writing; F.L.: supervision; A.S. and Y.L.: project administration; Y.W.: conceptualization and validation; T.X.: funding acquisition; M.Y.: investigation; X.L.: software. All authors have read and agreed to the published version of the manuscript.
Funding
This research was funded by the National Key R&D Program of China, grant number 2022YFB3205300, the National Natural Science Foundation of China, grant number 42276194 and the National Key R&D Program of China, grant number 2023YFC3010700.
Institutional Review Board Statement
Not applicable.
Informed Consent Statement
Not applicable.
Data Availability Statement
Data are contained within the article.
Conflicts of Interest
The authors declare no conflict of interest.
References
- Agoubi, B. A Review: Saltwater Intrusion in North Africa’s Coastal Areas-Current State and Future Challenges. Environ. Sci. Pollut. Res. 2021, 28, 17029–17043. [Google Scholar] [CrossRef] [PubMed]
- Yip, N.Y.; Brogioli, D.; Hamelers, H.V.M.; Nijmeijer, K. Salinity Gradients for Sustainable Energy: Primer, Progress, and Prospects. Environ. Sci. Technol. 2016, 50, 12072–12094. [Google Scholar] [CrossRef] [PubMed]
- Nordeide, J.T. Accuracy of Body Mass Estimates of Formalin-Preserved Fish—A Review. J. Fish Biol. 2020, 96, 288–296. [Google Scholar] [CrossRef] [PubMed]
- Pawlowicz, R.; Feistel, R. Limnological Applications of the Thermodynamic Equation of Seawater 2010 (TEOS-10). Limnol. Oceanogr. Methods 2012, 10, 853–867. [Google Scholar] [CrossRef]
- Rusby, J.S.M. Measurements of the refractive index of sea water relative to copenhagen standard sea water. Deep Sea Res. 1967, 14, 427–439. [Google Scholar] [CrossRef]
- Li, G.; Wang, Y.; Shi, A.; Liu, Y.; Li, F. Review of Seawater Fiber Optic Salinity Sensors Based on the Refractive Index Detection Principle. Sensors 2023, 23, 2187. [Google Scholar] [CrossRef] [PubMed]
- Yang, X.; Wang, Z.; Liu, Y.; Yao, J. SPR Sensor Based on Exposed Core Micro-Structured Optical Fiber for Salinity Detection with Temperature Self-Compensation. Opt. Mater. Express 2021, 11, 2468–2477. [Google Scholar] [CrossRef]
- Zhao, J.; Zhao, Y.; Cai, L. Hybrid Fiber-Optic Sensor for Seawater Temperature and Salinity Simultaneous Measurements. J. Light. Technol. 2022, 40, 880–886. [Google Scholar] [CrossRef]
- Lu, L.; Xu, Y.; Dong, M.; Zhu, L. Birefringent Interferometer Cascaded With PM-FBG for Multi-Parameter Testing. IEEE Sens. J. 2022, 22, 338–343. [Google Scholar] [CrossRef]
- Tosi, D. Review of Chirped Fiber Bragg Grating (CFBG) Fiber-Optic Sensors and Their Applications. Sensors 2018, 18, 2147. [Google Scholar] [CrossRef]
- Cong, J.; Zhang, X.; Chen, K. Fiber optic Bragg grating sensor based on hydrogels for measuring salinity. Sens. Actuators B Chem. 2002, 87, 487–490. [Google Scholar] [CrossRef]
- Men, L.; Lu, P.; Chen, Q. A multiplexed fiber Bragg grating sensor for simultaneous salinity and temperature measurement. J. Appl. Phys. 2008, 103, 053107. [Google Scholar] [CrossRef]
- Aliya, B.; Madina, S.; Daniele, T. Fabrication and Interrogation of Refractive Index Biosensors Based on Etched Fiber Bragg Grating (EFBG). In Proceedings of the 2018 40th Annual International Conference of the IEEE Engineering in Medicine and Biology Society (EMBC), Honolulu, HI, USA, 18–21 July 2018. [Google Scholar]
- Singh, Y.; Sadhu, A.; Raghuwanshi, S.K. Fabrication and Experimental Analysis of Reduced Graphene Oxide Coated Etched Fiber Bragg Grating Refractometric Sensor. IEEE Sens. Lett. 2020, 4, 1–4. [Google Scholar] [CrossRef]
- Kumar, N.V.; Kavitha, B.S.; Asokan, S. Selective detection of lead in water using etched fiber Bragg grating sensor. Sens. Actuators B Chem. 2022, 354, 131208. [Google Scholar] [CrossRef]
- Wang, Y. Review of long period fiber gratings written by CO2 laser. J. Appl. Phys. 2010, 108, 081101. [Google Scholar] [CrossRef]
- Dong, J.; Sang, M.; Wang, S.; Xu, T.; Yang, L.; Han, Y.; Zhao, F.; Liu, T. Refractive Index Sensor Based on Graphene Oxide-Coated Long-Period Fiber Grating Inscribed in a Two-Mode Fiber. IEEE Access 2020, 8, 109028–109037. [Google Scholar] [CrossRef]
- Wang, J.; Wang, A.; Hao, J.; Zeng, X.; Yang, X.; Zhou, J.; Meng, H.; Geng, T.; Sun, W. Mode Dependence of Refractive Index Sensitivity of Long-Period Fiber Gratings Induced by Periodically Embedded Multimode Fiber. IEEE Sens. J. 2023, 23, 10452–10459. [Google Scholar] [CrossRef]
- Eftimov, T.; Janik, M.; Koba, M.; Śmietana, M.; Mikulic, P.; Bock, W. Long-Period Gratings and Microcavity In-Line Mach Zehnder Interferometers as Highly Sensitive Optical Fiber Platforms for Bacteria Sensing. Sensors 2020, 20, 3772. [Google Scholar] [CrossRef]
- Wu, X.; Tong, L. Optical microfibers and nanofibers. Nanophotonics 2013, 2, 407–428. [Google Scholar] [CrossRef]
- Zhao, Y.; Zhao, J.; Wang, X.-X.; Peng, Y.; Hu, X.-G. Femtosecond laser-inscribed fiber-optic sensor for seawater salinity and temperature measurements. Sens. Actuators B Chem. 2022, 353, 131134. [Google Scholar] [CrossRef]
- Fang, X.; Liao, C.; Wang, D. Femtosecond laser fabricated fiber Bragg grating in microfiber for refractive index sensing. Opt. Lett. 2010, 353, 1007–1009. [Google Scholar] [CrossRef] [PubMed]
- Liu, Y.; Meng, C.; Zhang, A.P.; Xiao, Y.; Yu, H.; Tong, L. Compact microfiber Bragg gratings with high-index contrast. Opt. Lett. 2011, 36, 3115–3117. [Google Scholar] [CrossRef] [PubMed]
- Wang, L.; Wang, Y.; Wang, J.; Li, F. A High Spatial Resolution FBG Sensor Array for Measuring Ocean Temperature and Depth. Photonic Sens. 2020, 10, 57–66. [Google Scholar] [CrossRef]
- Liang, R.; Sun, Q.; Wo, J.; Liu, D. Investigation on micro/nanofiber Bragg grating for refractive index sensing. Opt. Commun. 2011, 285, 1128–1133. [Google Scholar] [CrossRef]
- Luo, D.; Ma, J.; Ibrahim, Z.; Ismail, Z. Etched FBG coated with polyimide for simultaneous detection the salinity and temperature. Opt. Commun. 2016, 392, 218–222. [Google Scholar] [CrossRef]
- Birks, T.A.; Li, Y.W. The shape of fiber tapers. J. Light. Technol. 1992, 10, 432–438. [Google Scholar] [CrossRef]
- Yadvendra, S.; Ahana, S.; Raghuwanshi, S.K. Design of Highly Sensitive Etched Fiber Bragg Grating Salinity Sensor. In Optical Sensing and Detection VI; 113542S; SPIE Digital Library: Washington, DC, USA, 2021; Volume 11354. [Google Scholar] [CrossRef]
- Millard, R.; Seaver, G. An Index of Refraction Algorithm for Seawater over Temperature, Pressure, Salinity, Density, and Wavelength. Deep Sea Res. Part I Oceanogr. Res. Pap. 1990, 37, 1909–1926. [Google Scholar] [CrossRef]
- Cai, L.; Zhao, Y.; Li, X.G. A fiber ring cavity laser sensor for refractive index and temperature measurement with core-offset modal interferometer as tunable filter. Sens. Actuators B Chem. 2017, 242, 673–678. [Google Scholar] [CrossRef]
- White, I.M.; Fan, X. On the performance quantification of resonant refractive index sensors. Opt. Express 2008, 16, 1020–1028. [Google Scholar] [CrossRef]
Figure 1.
The curves of the effective RI variations in different RI-surrounding media as a function of the optical fiber diameter: (a) optical fiber tapering; (b) HF etching.
Figure 1.
The curves of the effective RI variations in different RI-surrounding media as a function of the optical fiber diameter: (a) optical fiber tapering; (b) HF etching.

Figure 2.
MNFBG structure schematic diagram.

Figure 3.
The proposed sensor structure fabrication process: (a) optical fiber tapering; (b) femtosecond laser inscription; (c) HF etching.
Figure 3.
The proposed sensor structure fabrication process: (a) optical fiber tapering; (b) femtosecond laser inscription; (c) HF etching.

Figure 4.
Reflection spectra during the corrosion process of the proposed sensor.

Figure 5.
Schematic of the sensor system setup.

Figure 6.
Salinity test results: (a,b) display the reflected spectra of the proposed MNFBG-1 and MNFBG-2 for different concentrations of NaCl, respectively; and (c,d) show the linear fitting results of the Bragg wavelengths for MNFBG-1 and MNFBG-2, respectively.
Figure 6.
Salinity test results: (a,b) display the reflected spectra of the proposed MNFBG-1 and MNFBG-2 for different concentrations of NaCl, respectively; and (c,d) show the linear fitting results of the Bragg wavelengths for MNFBG-1 and MNFBG-2, respectively.

Figure 7.
Temperature test results: (a,b) display the reflected spectra of the proposed MNFBG-1 and MNFBG-2 for different temperatures, respectively; and (c,d) show the linear fitting results of the Bragg wavelengths for MNFBG-1 and MNFBG-2, respectively.
Figure 7.
Temperature test results: (a,b) display the reflected spectra of the proposed MNFBG-1 and MNFBG-2 for different temperatures, respectively; and (c,d) show the linear fitting results of the Bragg wavelengths for MNFBG-1 and MNFBG-2, respectively.

Figure 8.
(a,b) represent the spectral stability test results of the proposed MNFBG-1 and MNFBG-2, respectively, for the sensing structure.
Figure 8.
(a,b) represent the spectral stability test results of the proposed MNFBG-1 and MNFBG-2, respectively, for the sensing structure.

Figure 9.
Repeatability test results of the sensing structure in salinity sensing.


Table 1.
Performance of some representative optical fiber grating salinity sensors.
| Technique | Sensitivity (nm/RIU) | Range (‰) | Sensitivity (nm/°C) | Range (°C) | Ref. |
|---|---|---|---|---|---|
| Polymer-coated and acrylate-coated FBG | 0.0165 nm/M | 0–249.9 0–5.7 M | 0.0102 | 10–80 | [12] |
| EFBG | 8.6 | 0–5 | / | / | [13] |
| rGO coated EFBG | 3.99 | 0–250 | 5.6 × 10⁻⁴ | / | [14] |
| MNFBG with femtosecond laser | 231.4 | 1.32–1.46 (RI) | / | / | [22] |
| This work | 11.7 and 10.7 (8.39 pm/‰ and 7.71 pm/‰) | 0–50 | 8.28 and 8.03 | 0–20 |
Disclaimer/Publisher’s Note: The statements, opinions and data contained in all publications are solely those of the individual author(s) and contributor(s) and not of MDPI and/or the editor(s). MDPI and/or the editor(s) disclaim responsibility for any injury to people or property resulting from any ideas, methods, instructions or products referred to in the content. |
© 2023 by the authors. Licensee MDPI, Basel, Switzerland. This article is an open access article distributed under the terms and conditions of the Creative Commons Attribution (CC BY) license (https://creativecommons.org/licenses/by/4.0/).
Share and Cite
MDPI and ACS Style
Li, G.; Wang, Y.; Yan, M.; Xu, T.; Shi, A.; Liu, Y.; Li, X.; Li, F. Fiber Bragg Grating Salinity Sensor Array Based on Fiber Tapering and HF Etching. Photonics 2023, 10, 1315. https://doi.org/10.3390/photonics10121315
AMA Style
Li G, Wang Y, Yan M, Xu T, Shi A, Liu Y, Li X, Li F. Fiber Bragg Grating Salinity Sensor Array Based on Fiber Tapering and HF Etching. Photonics. 2023; 10(12):1315. https://doi.org/10.3390/photonics10121315
Chicago/Turabian StyleLi, Gaochao, Yongjie Wang, Mengchao Yan, Tuanwei Xu, Ancun Shi, Yuanhui Liu, Xuechun Li, and Fang Li. 2023. "Fiber Bragg Grating Salinity Sensor Array Based on Fiber Tapering and HF Etching" Photonics 10, no. 12: 1315. https://doi.org/10.3390/photonics10121315
Note that from the first issue of 2016, this journal uses article numbers instead of page numbers. See further details here.