Influence of the Spectral Composition of Illuminating Light Sources on Biometric and Phytochemical Characteristics of Ocimum basilicum L.

 , , , , , and
Abstract
:1. Introduction
2. Materials and Methods
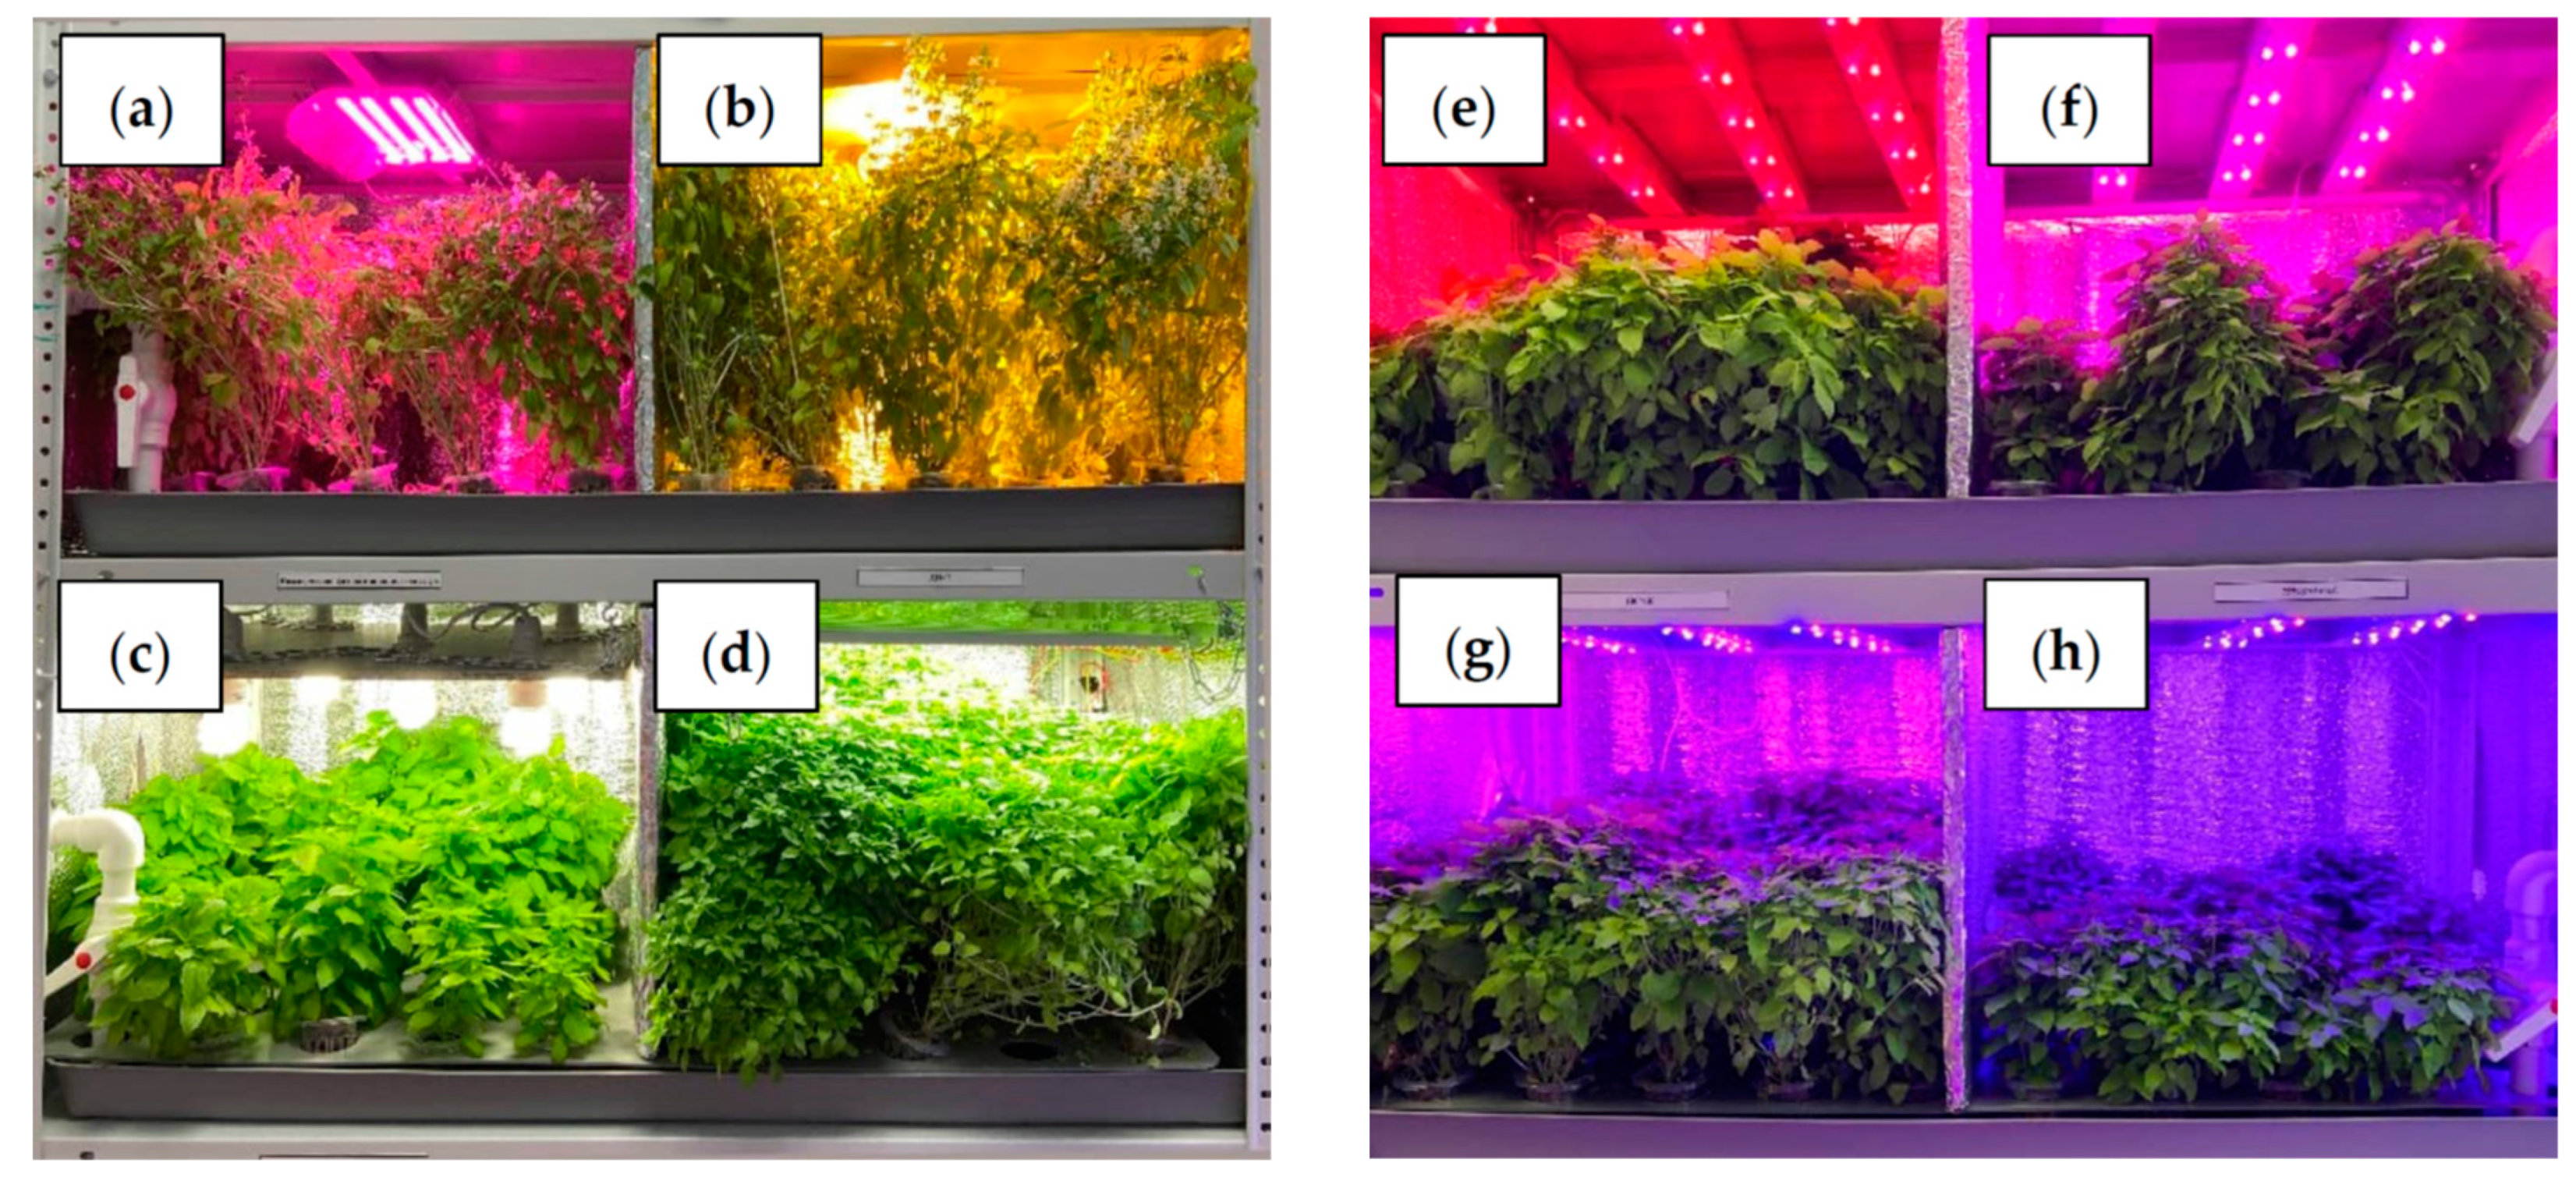
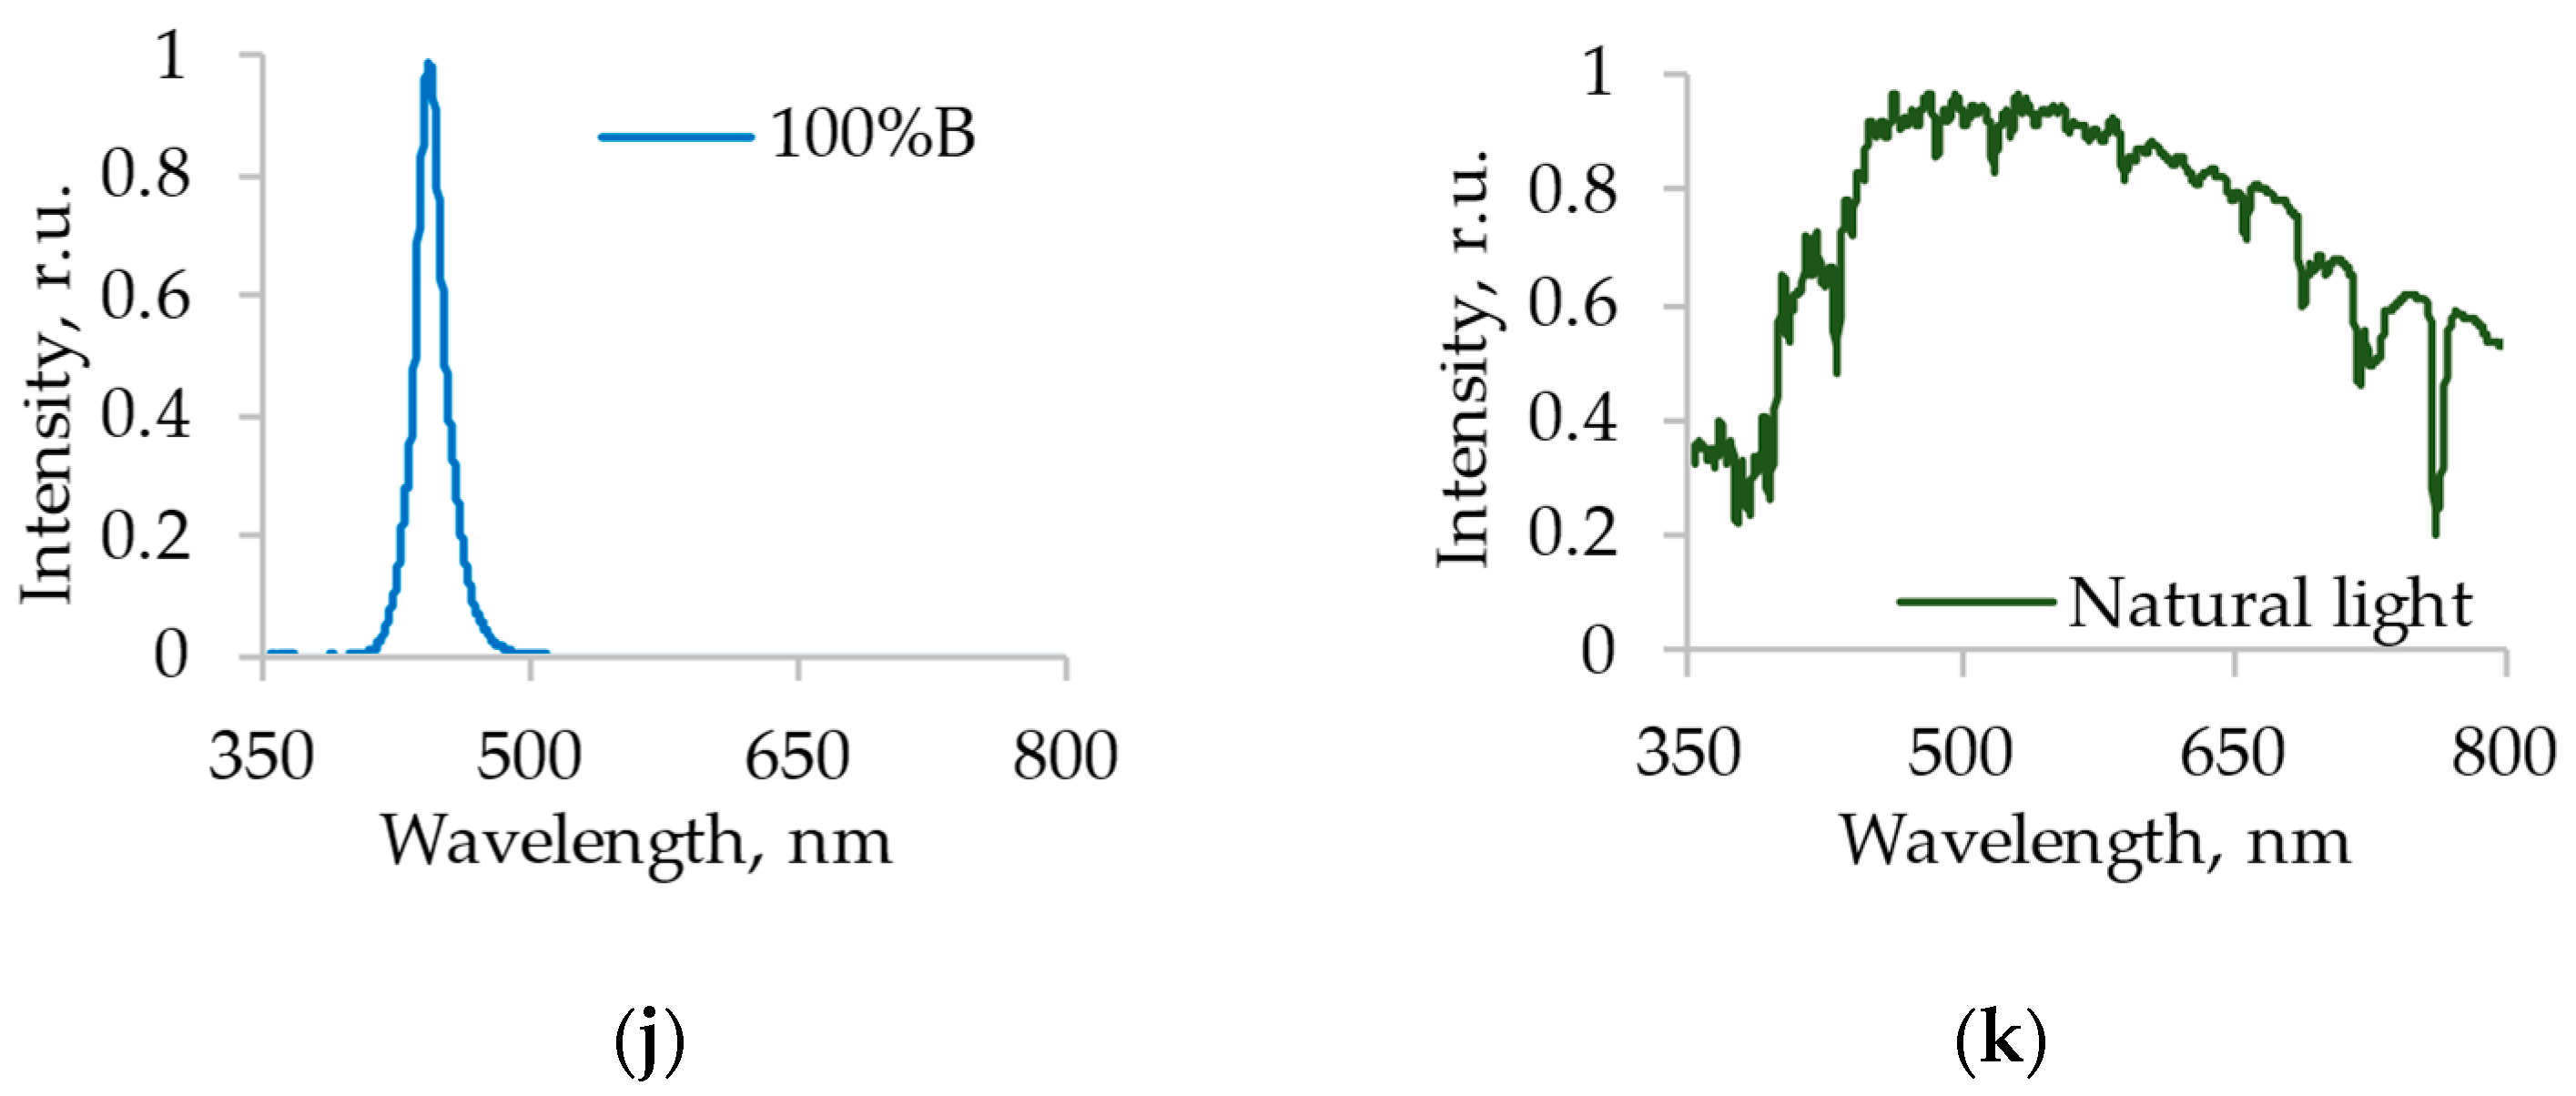
2.1. Light Sources and City Farm Characteristics
- (1)
- Average hypocotyl length (plant height) (mm);
- (2)
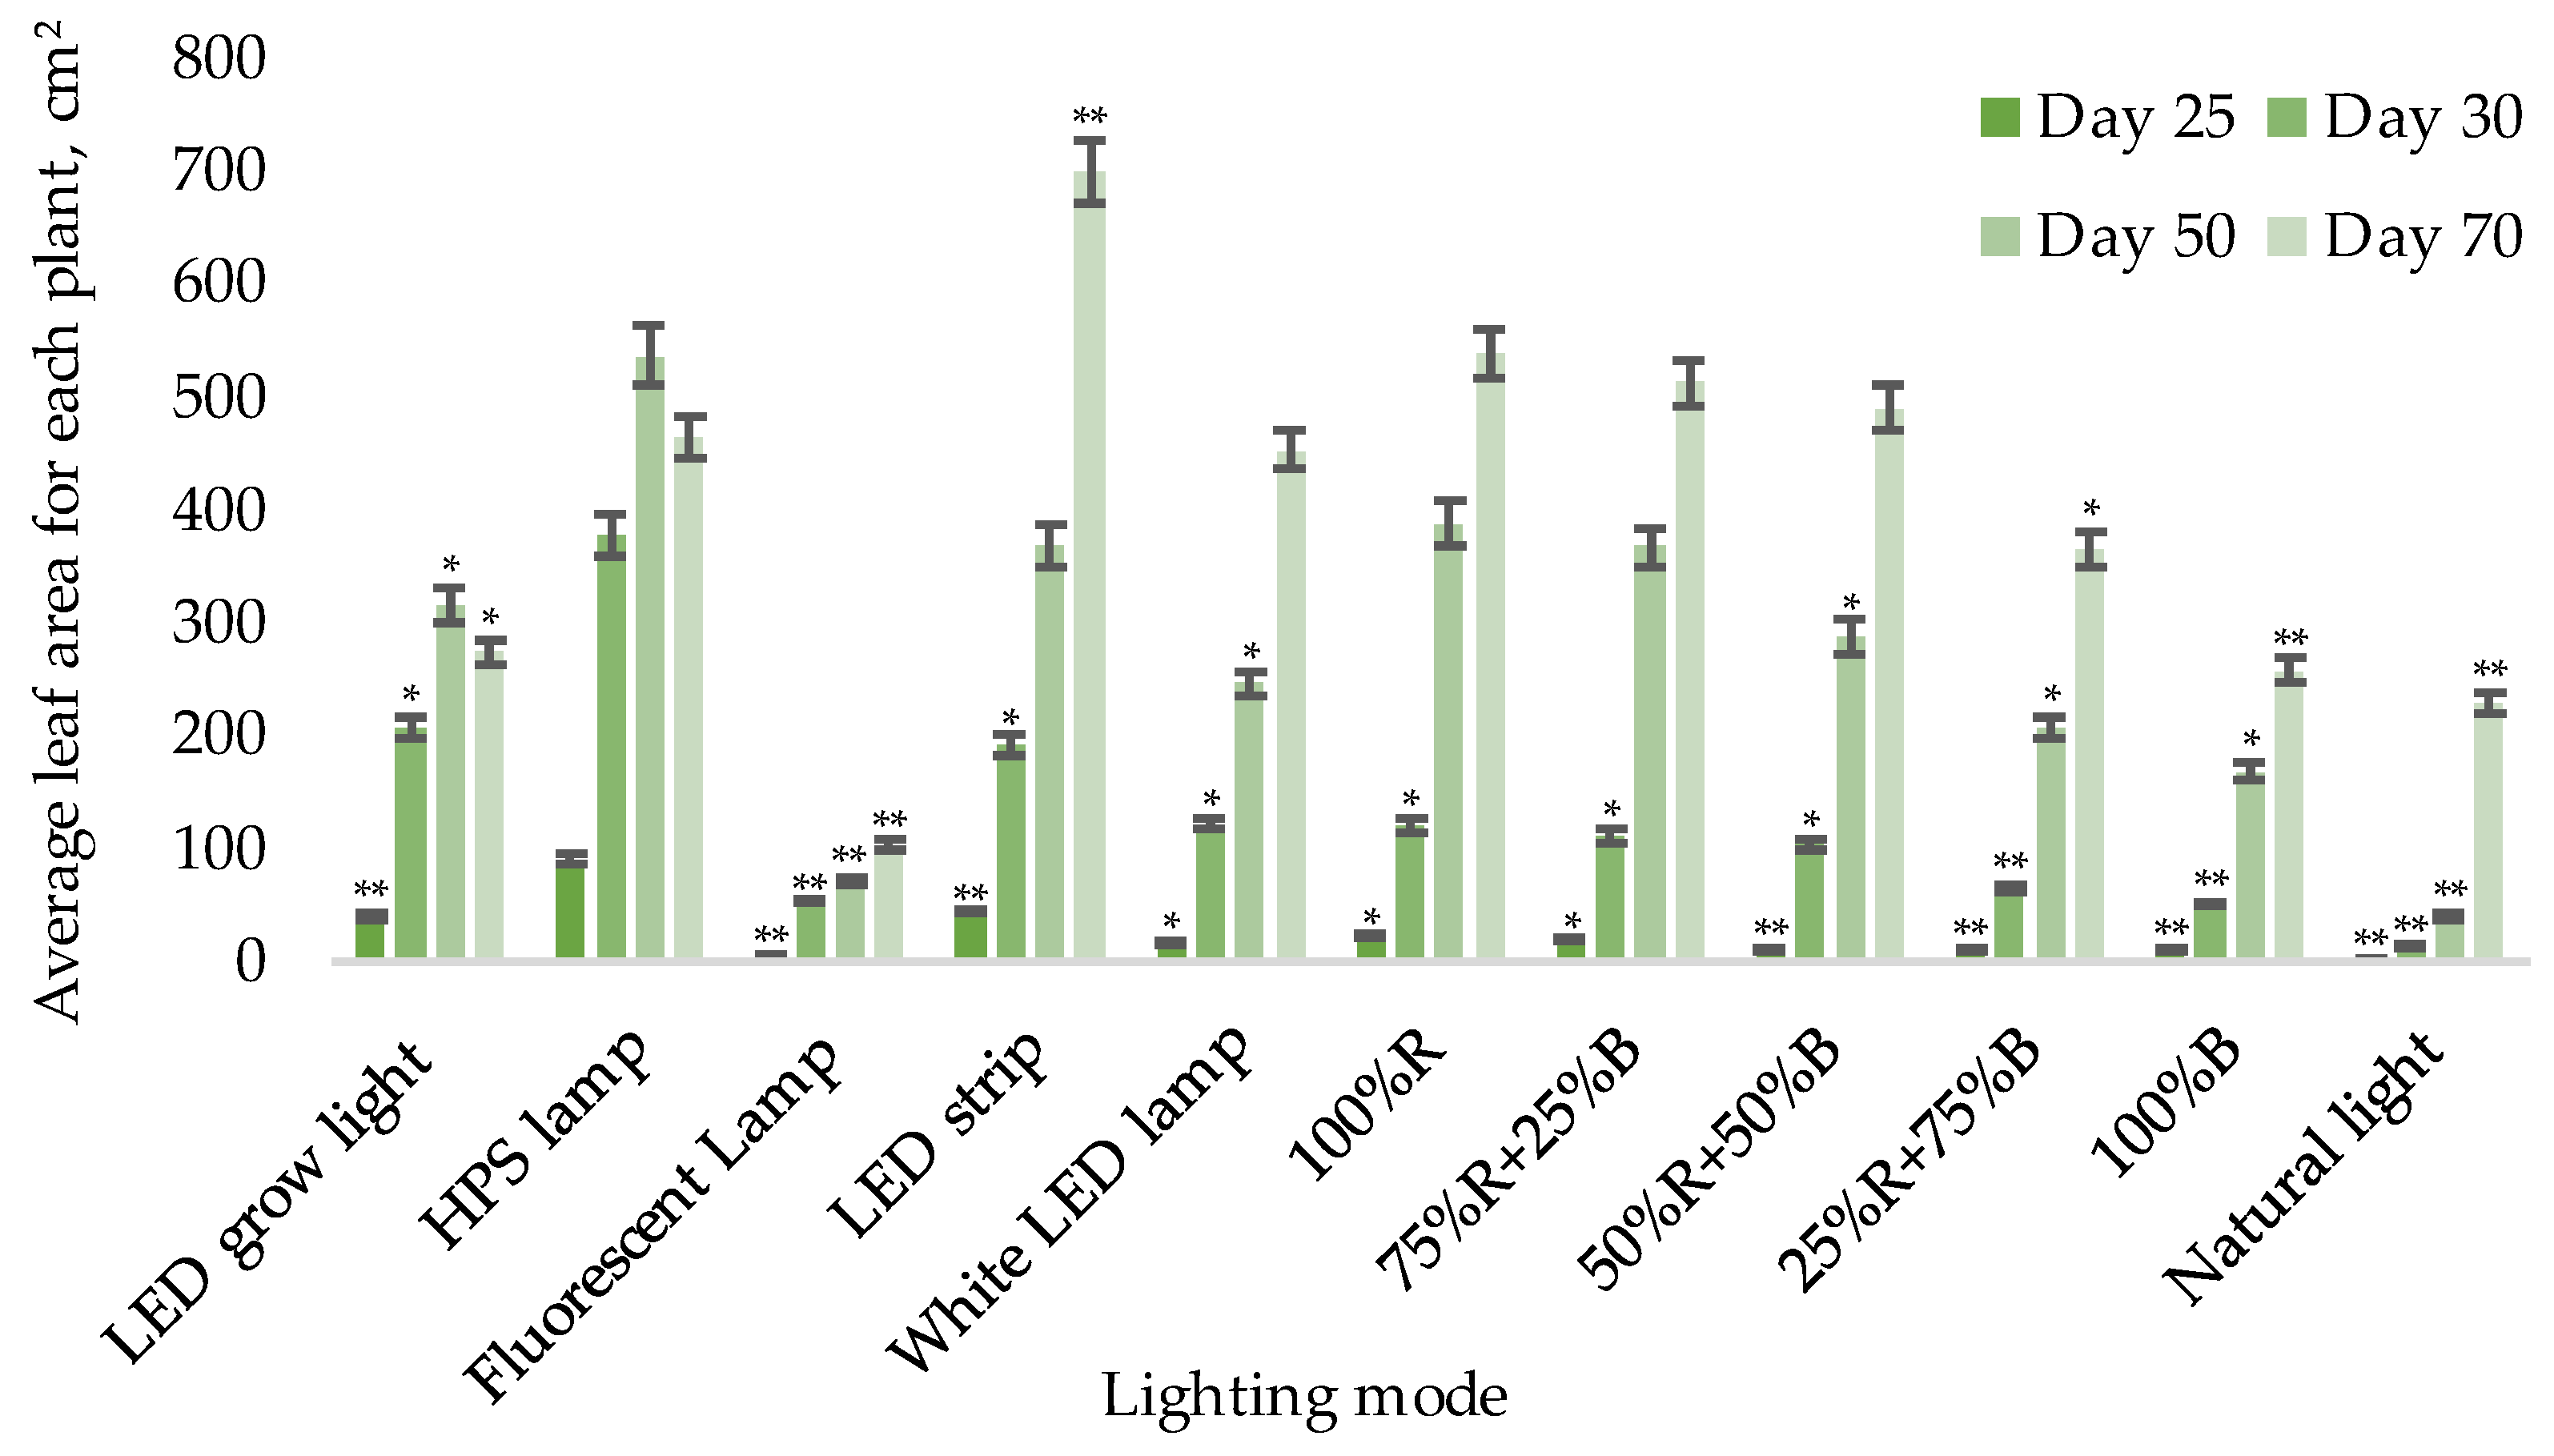
- Average area of all leaves for each plant (cm2);
- (3)
- Average number of leaves of a plant (from 30 to 70 days);
- (4)
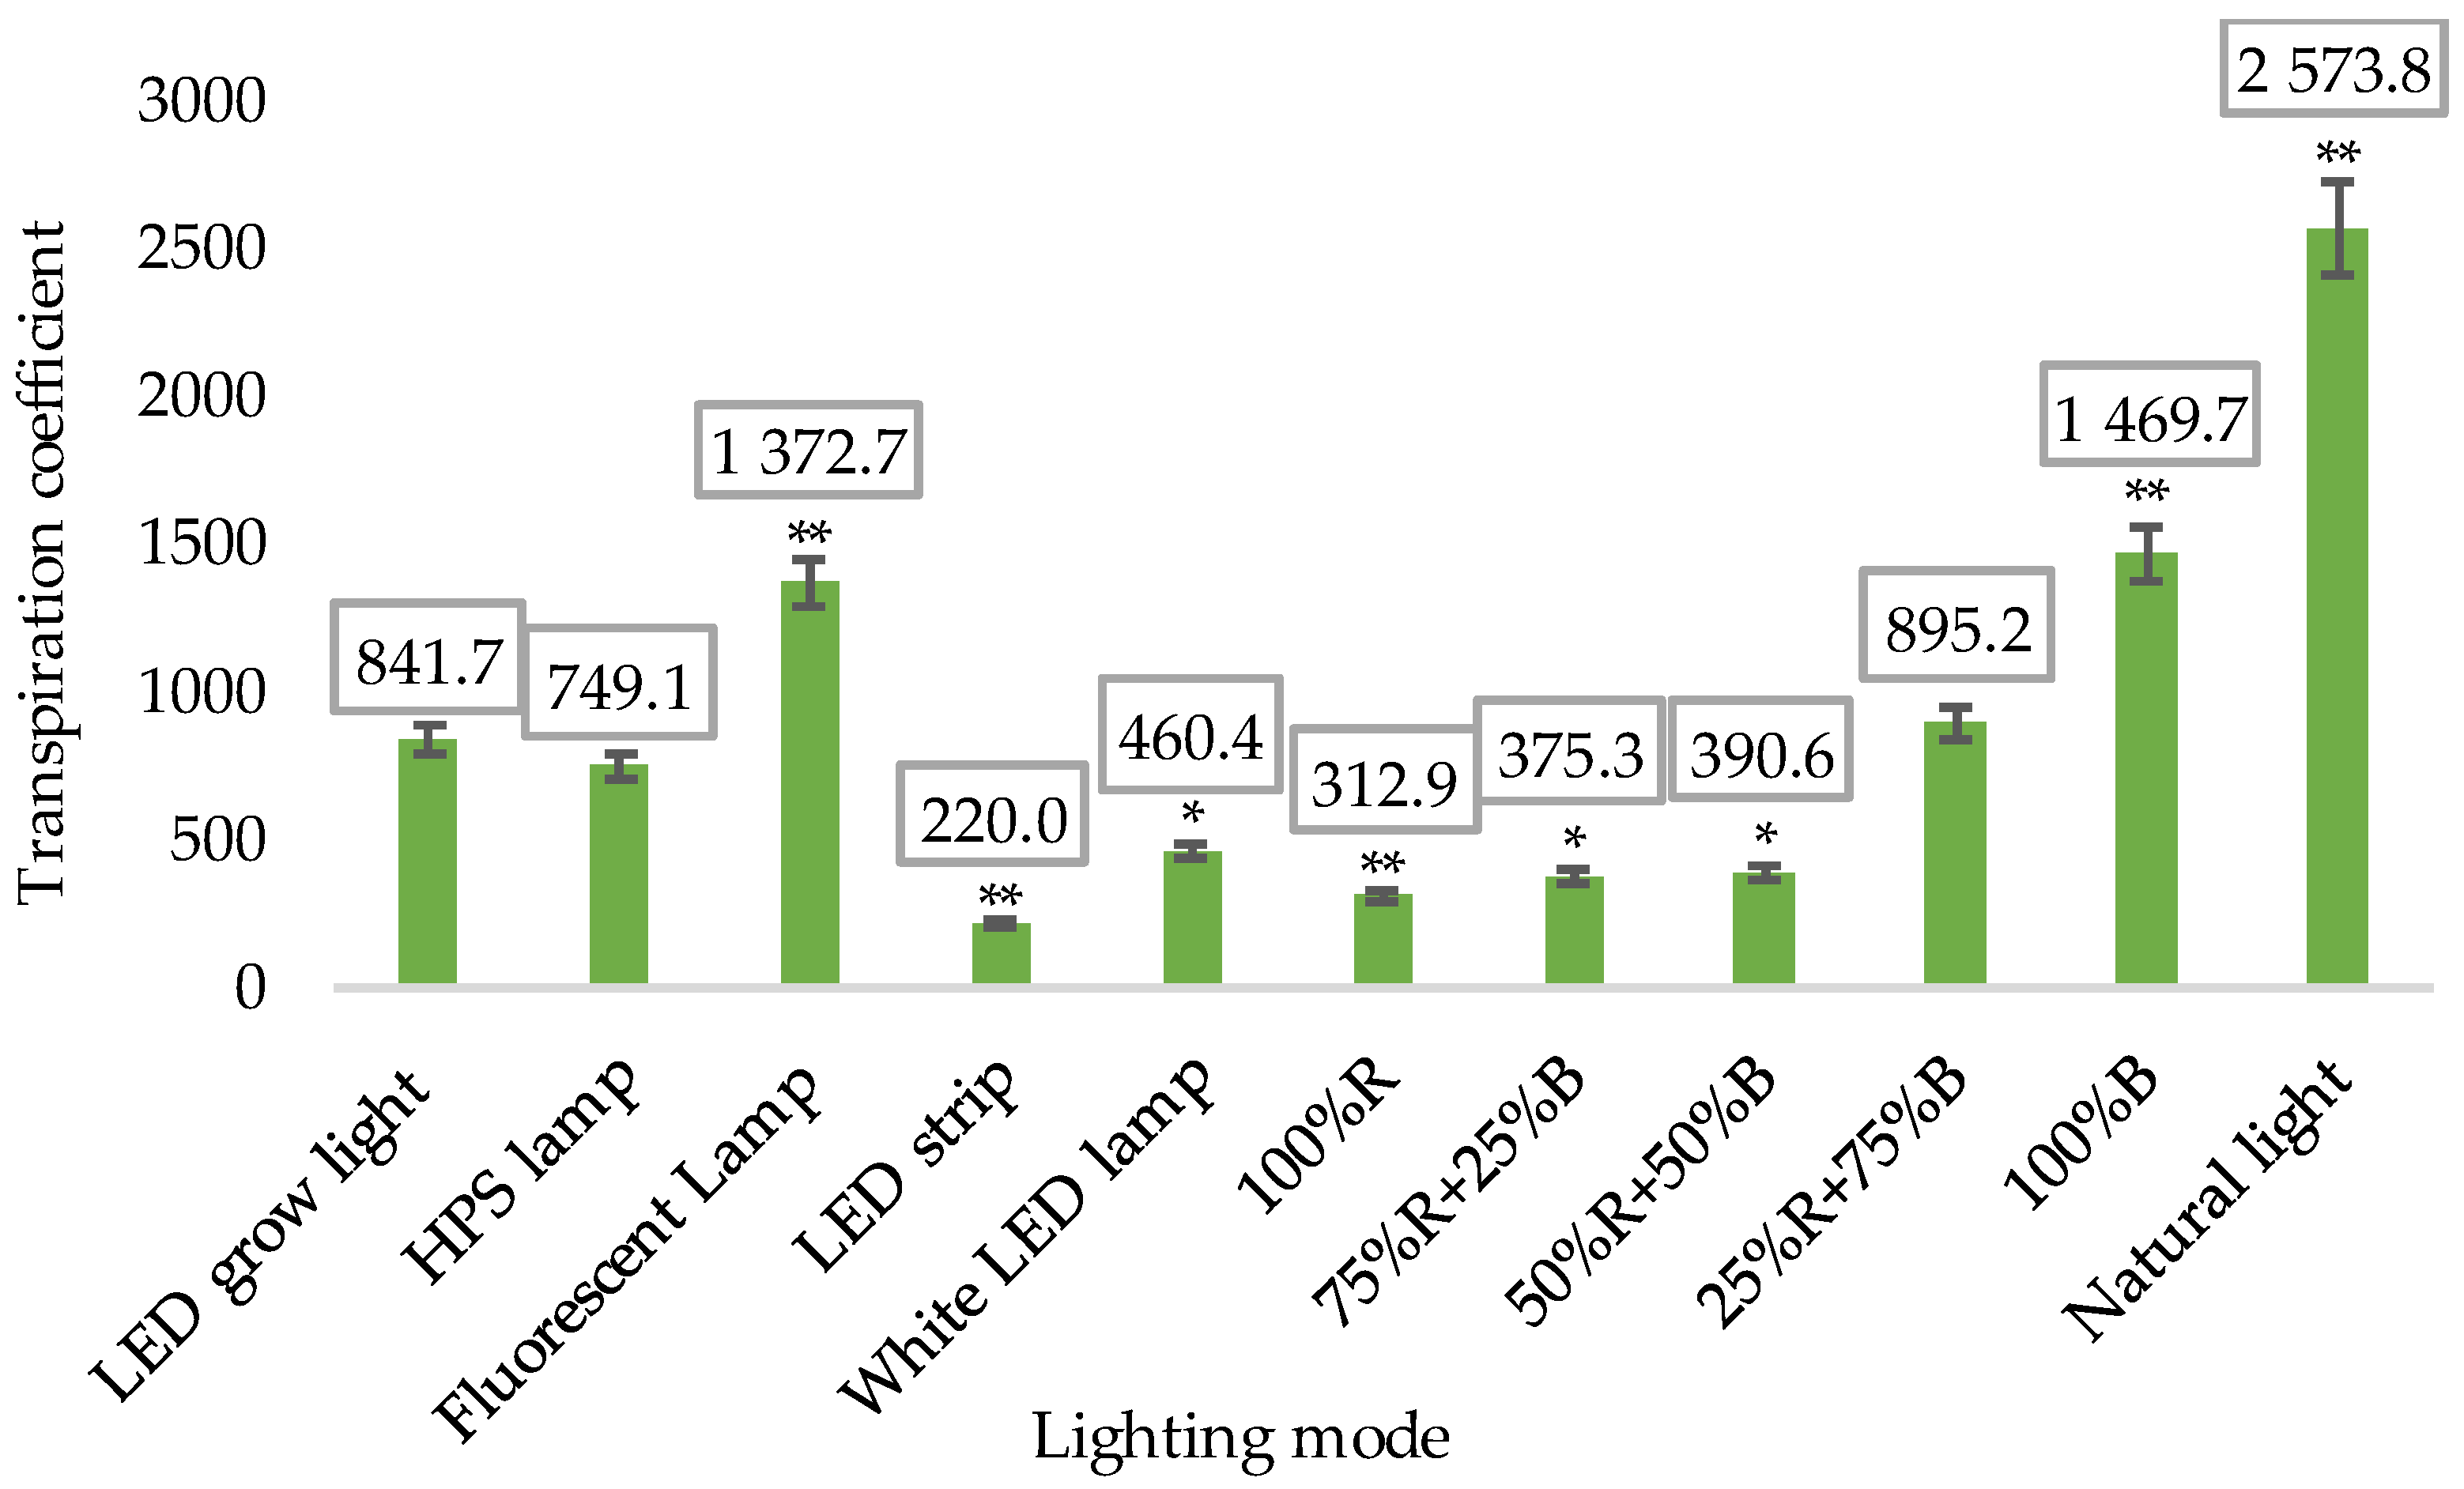
- Average water use (transpiration coefficient);
- (5)
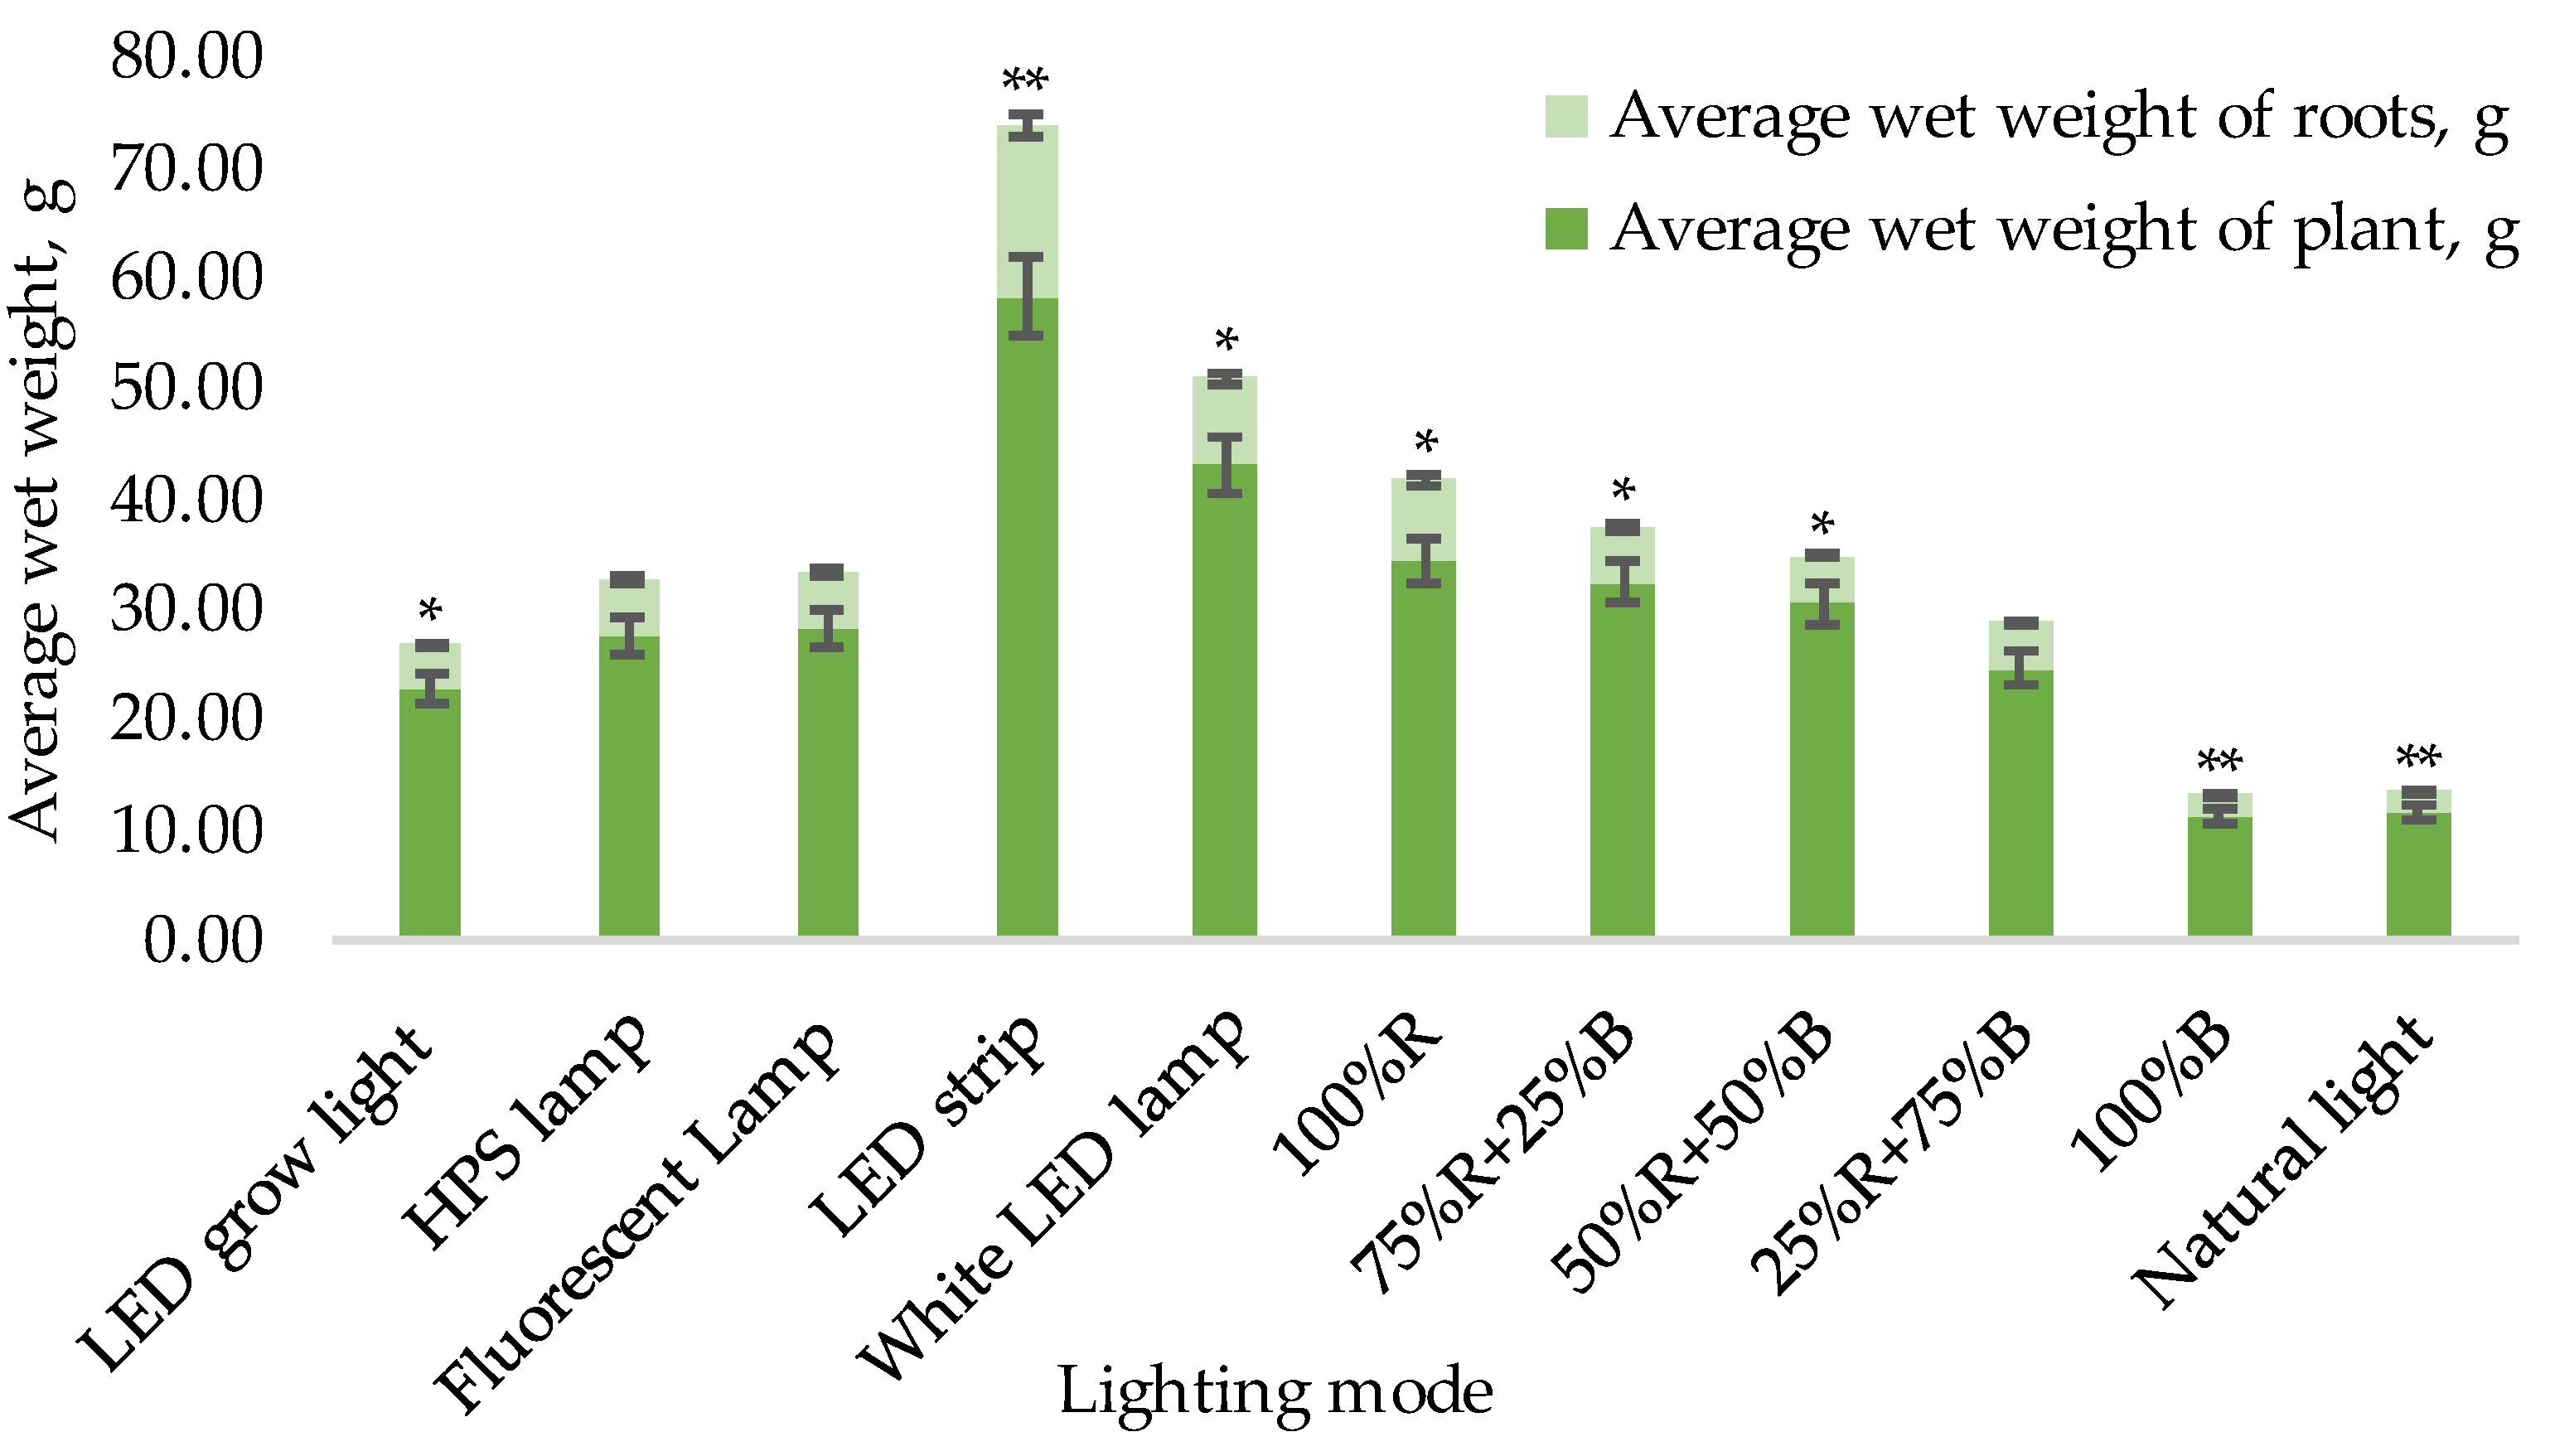
- Average values of dry, wet mass, and root mass for one plant (on the final 70th day of the experiment);
- (6)
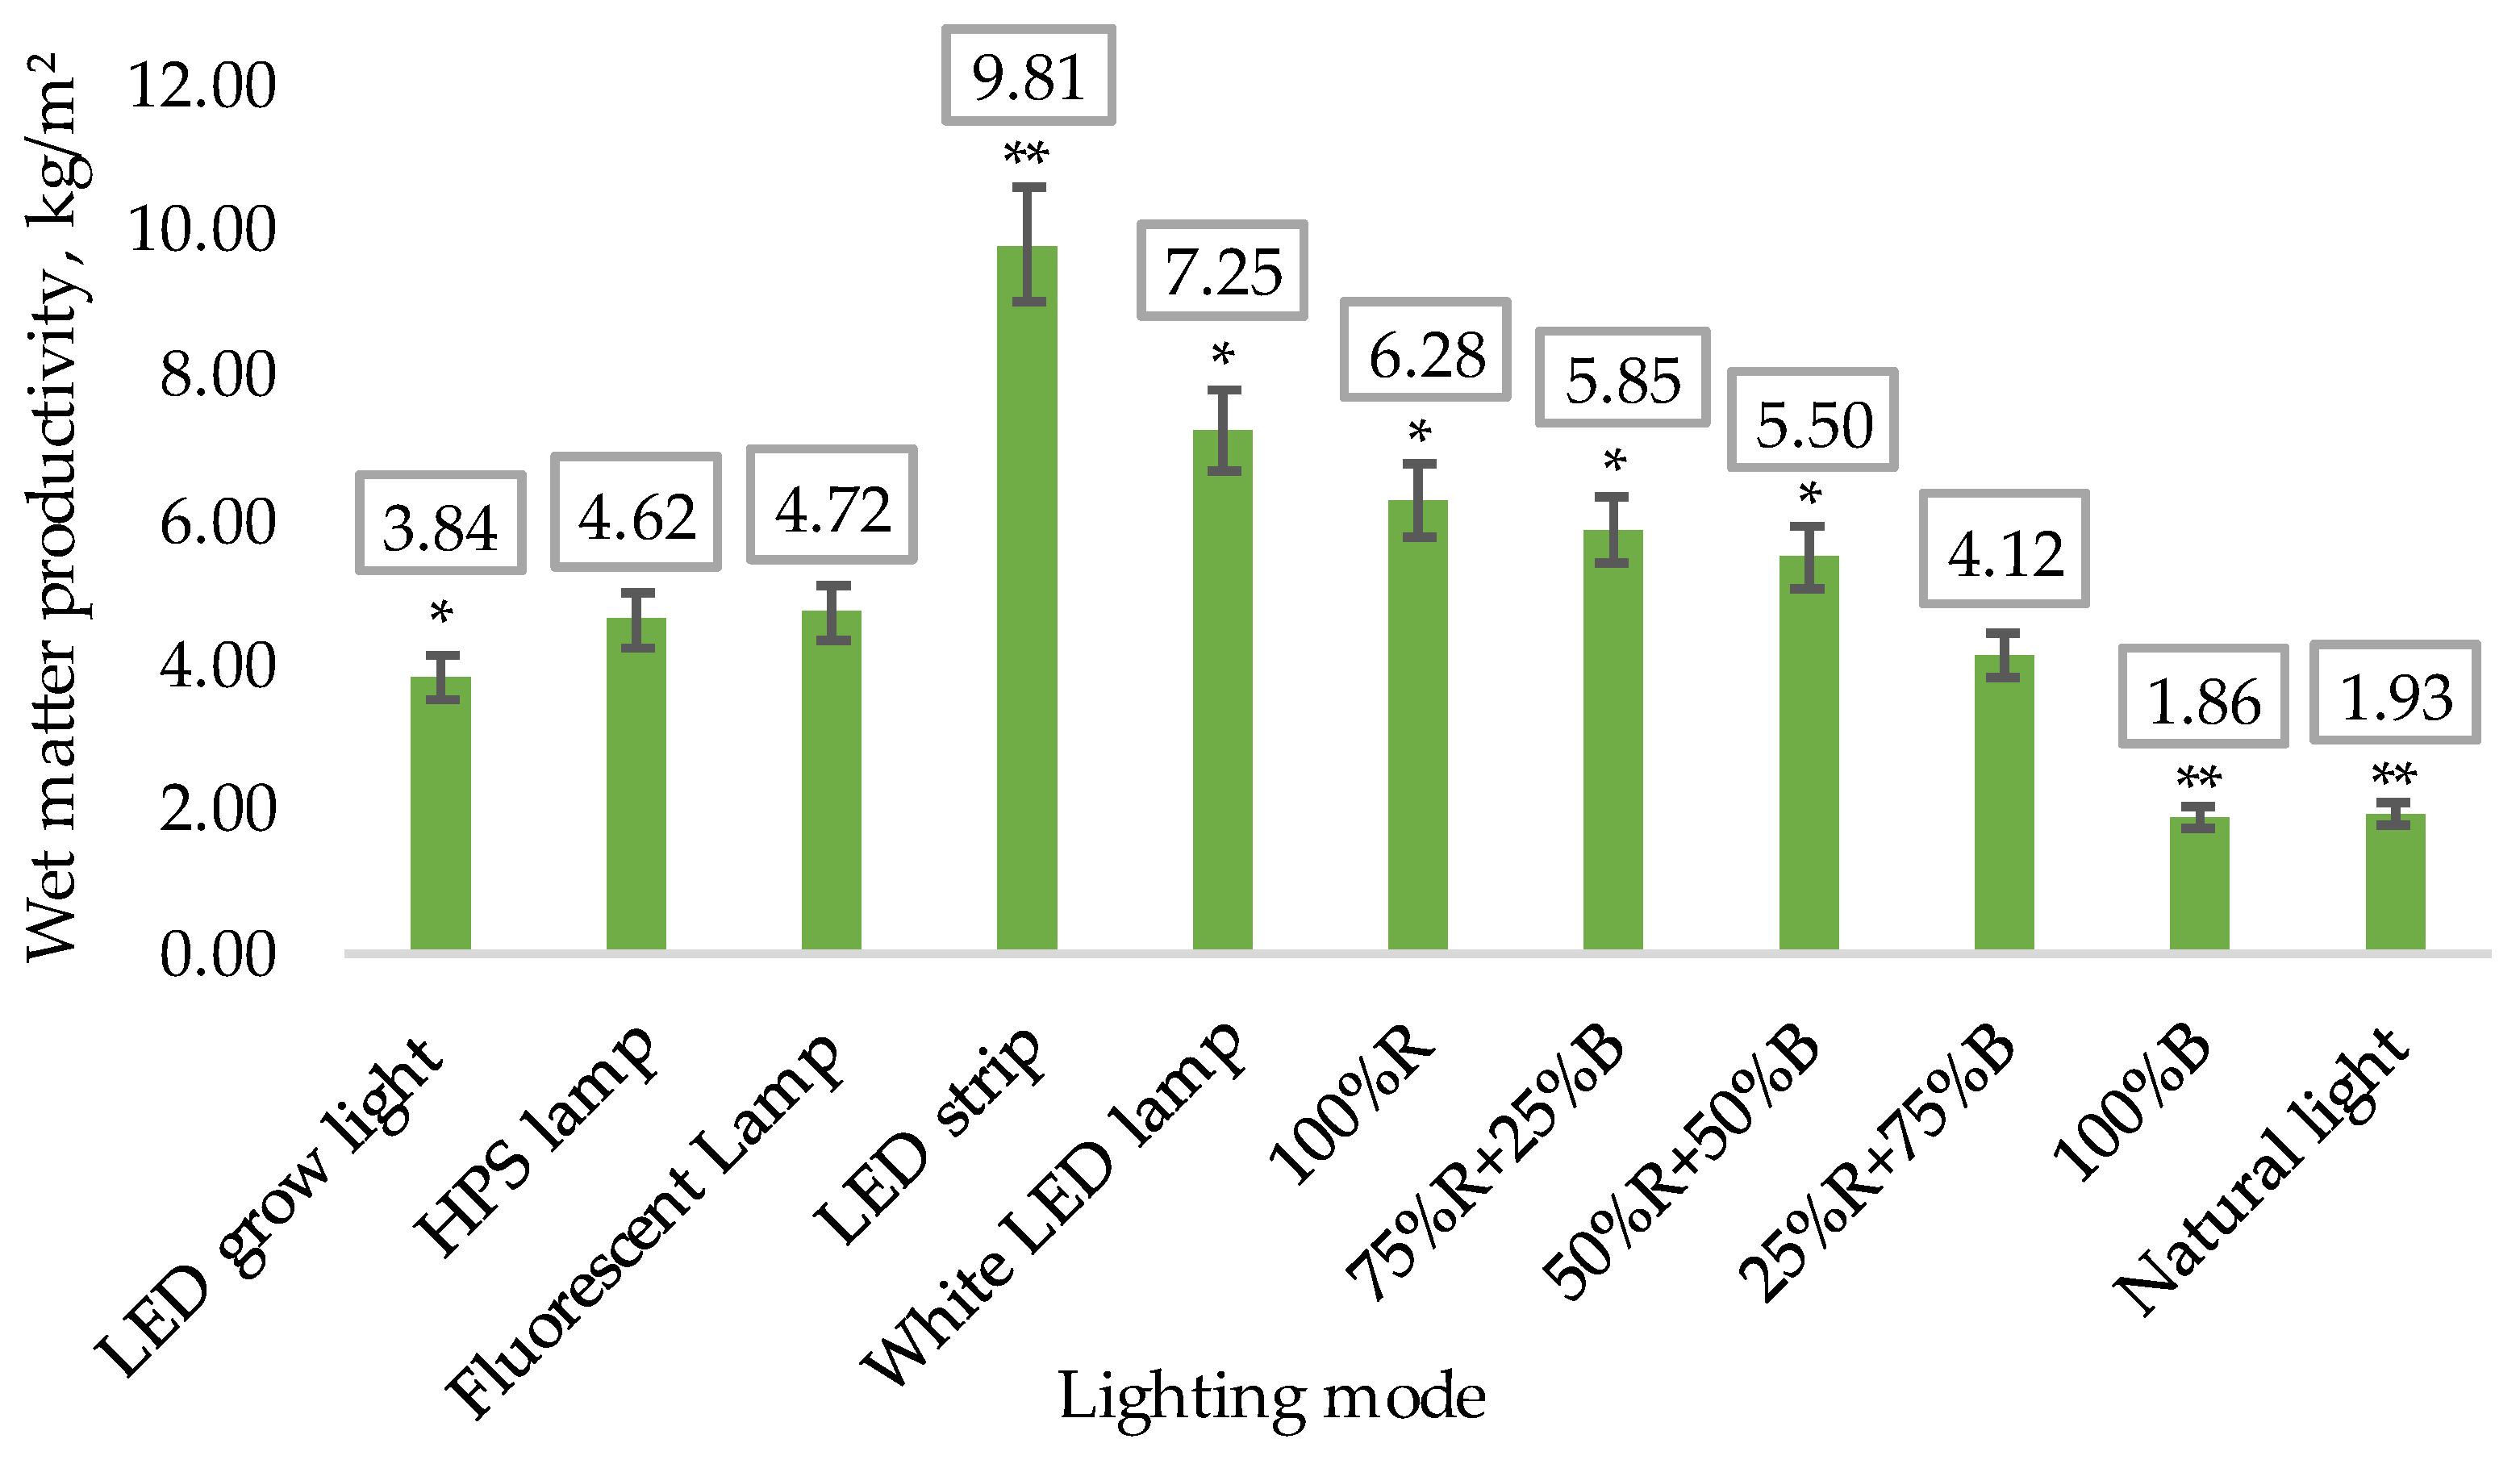
- Wet matter productivity on the final 70th day of the experiment.
2.2. Phytochemical Analysis of Ocimum basilicum L.
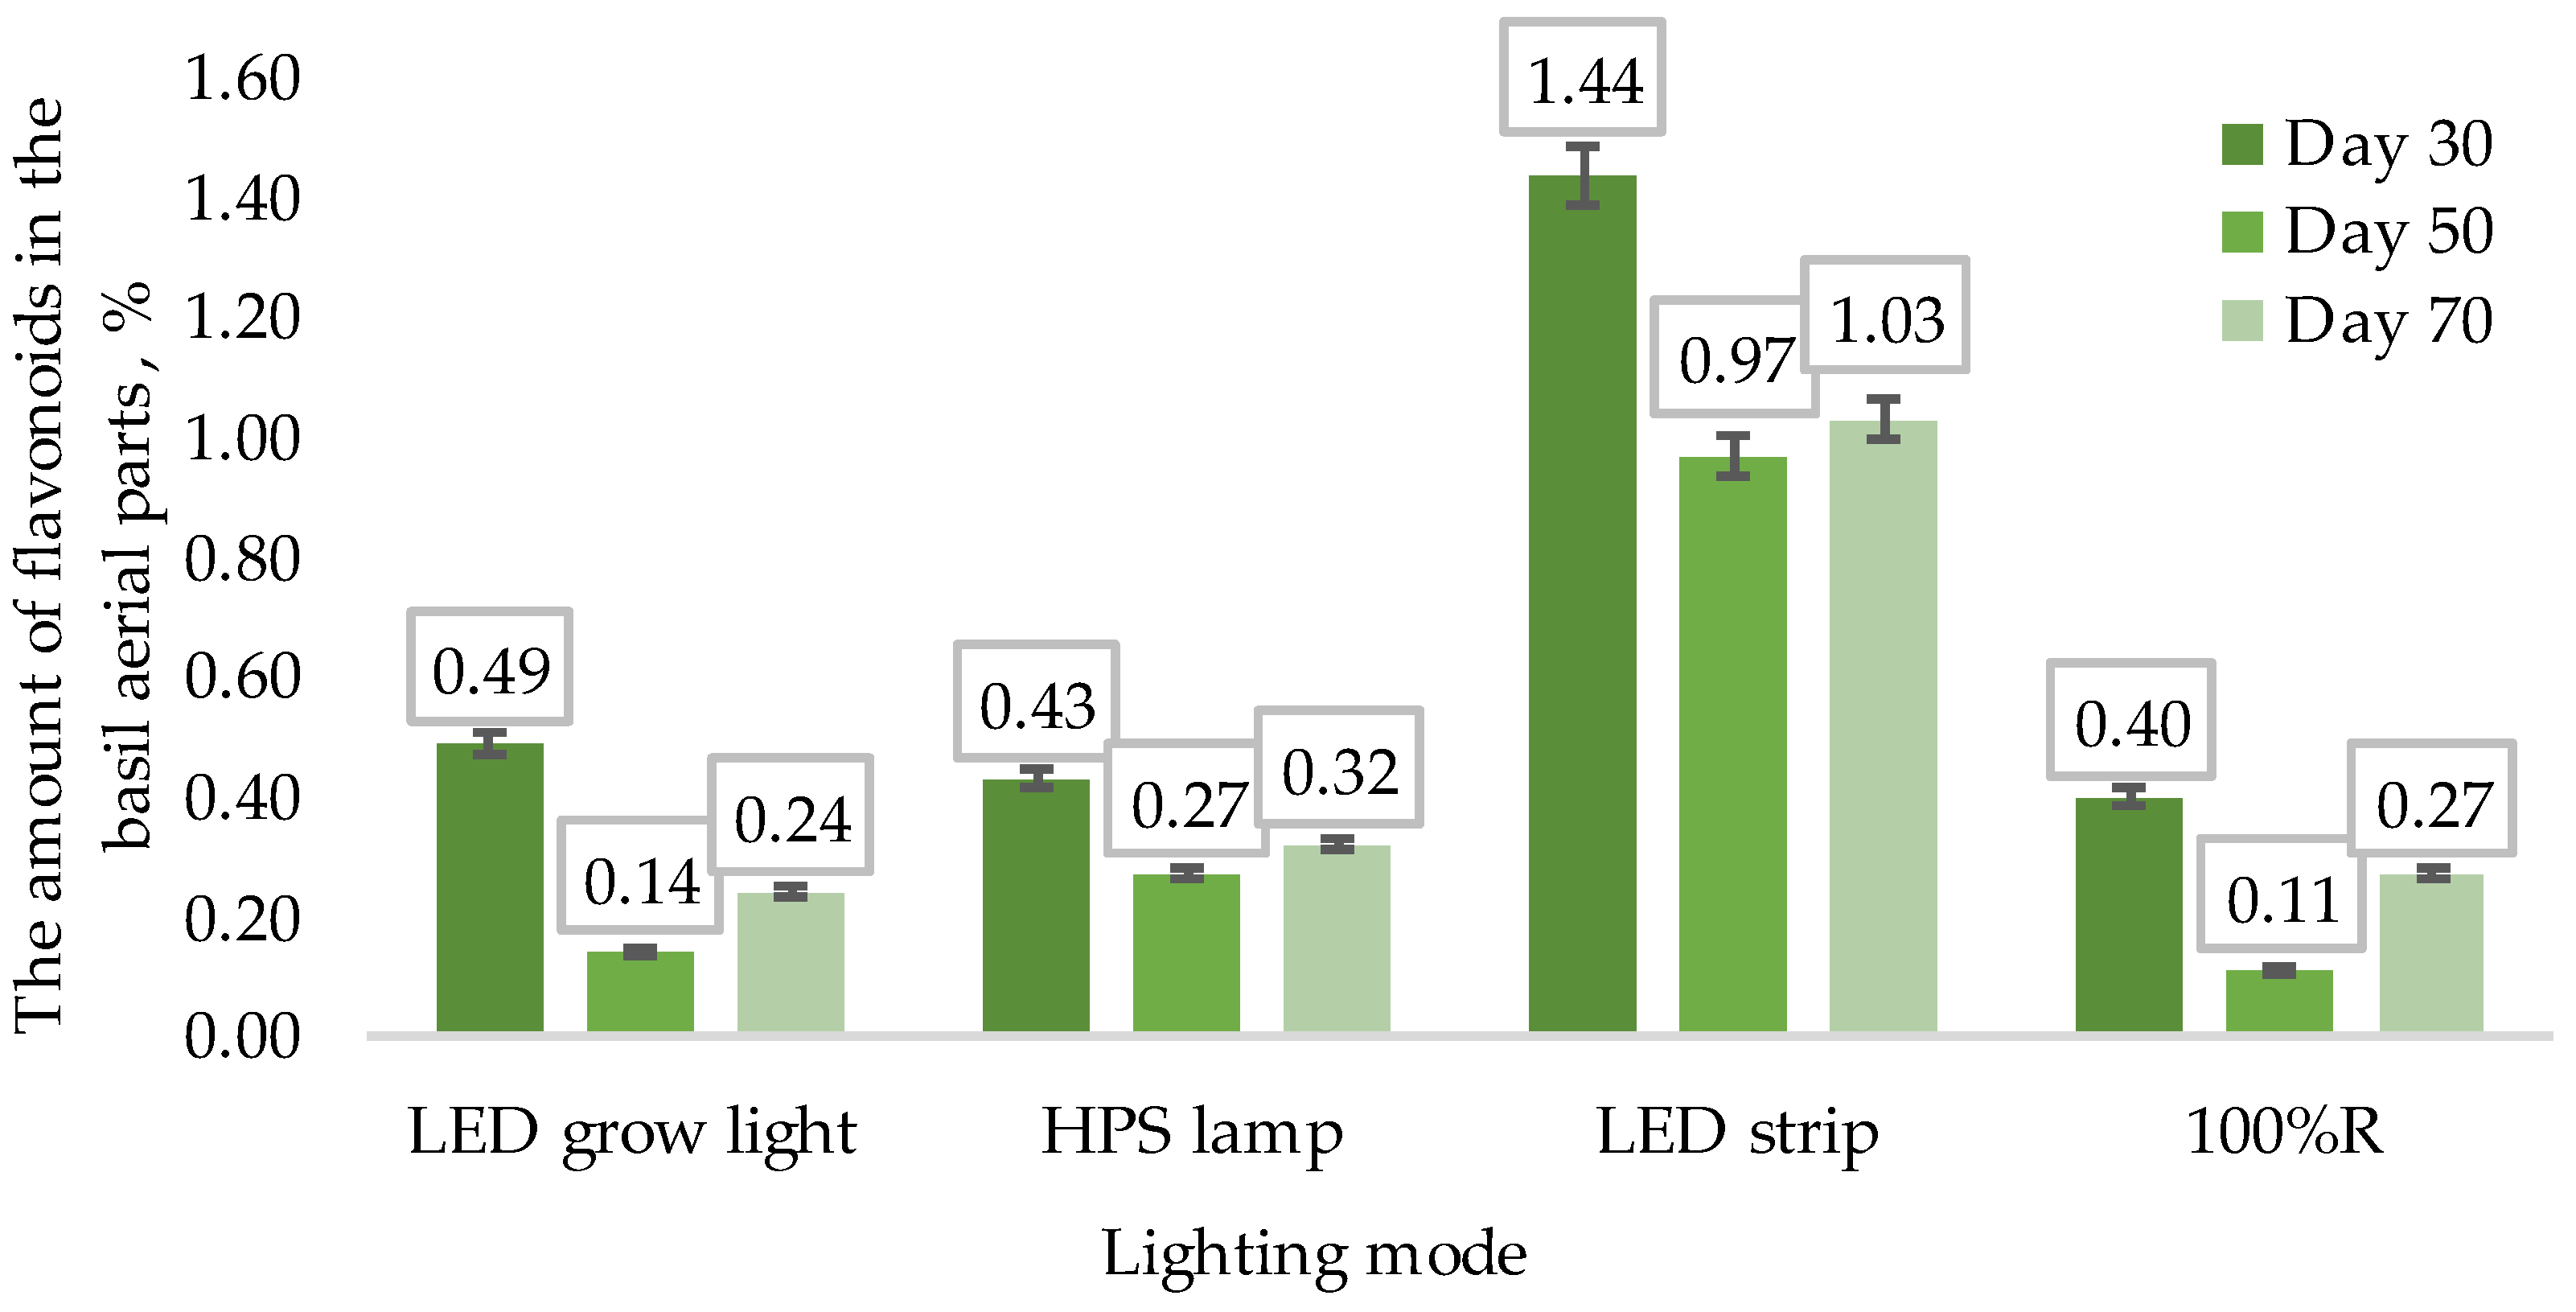
2.2.1. Quantification of Flavonoid Total Content in Terms of Rutin
2.2.2. HPLC analysis of O. basilicum Extracts
2.3. Statistical Analysis
3. Results
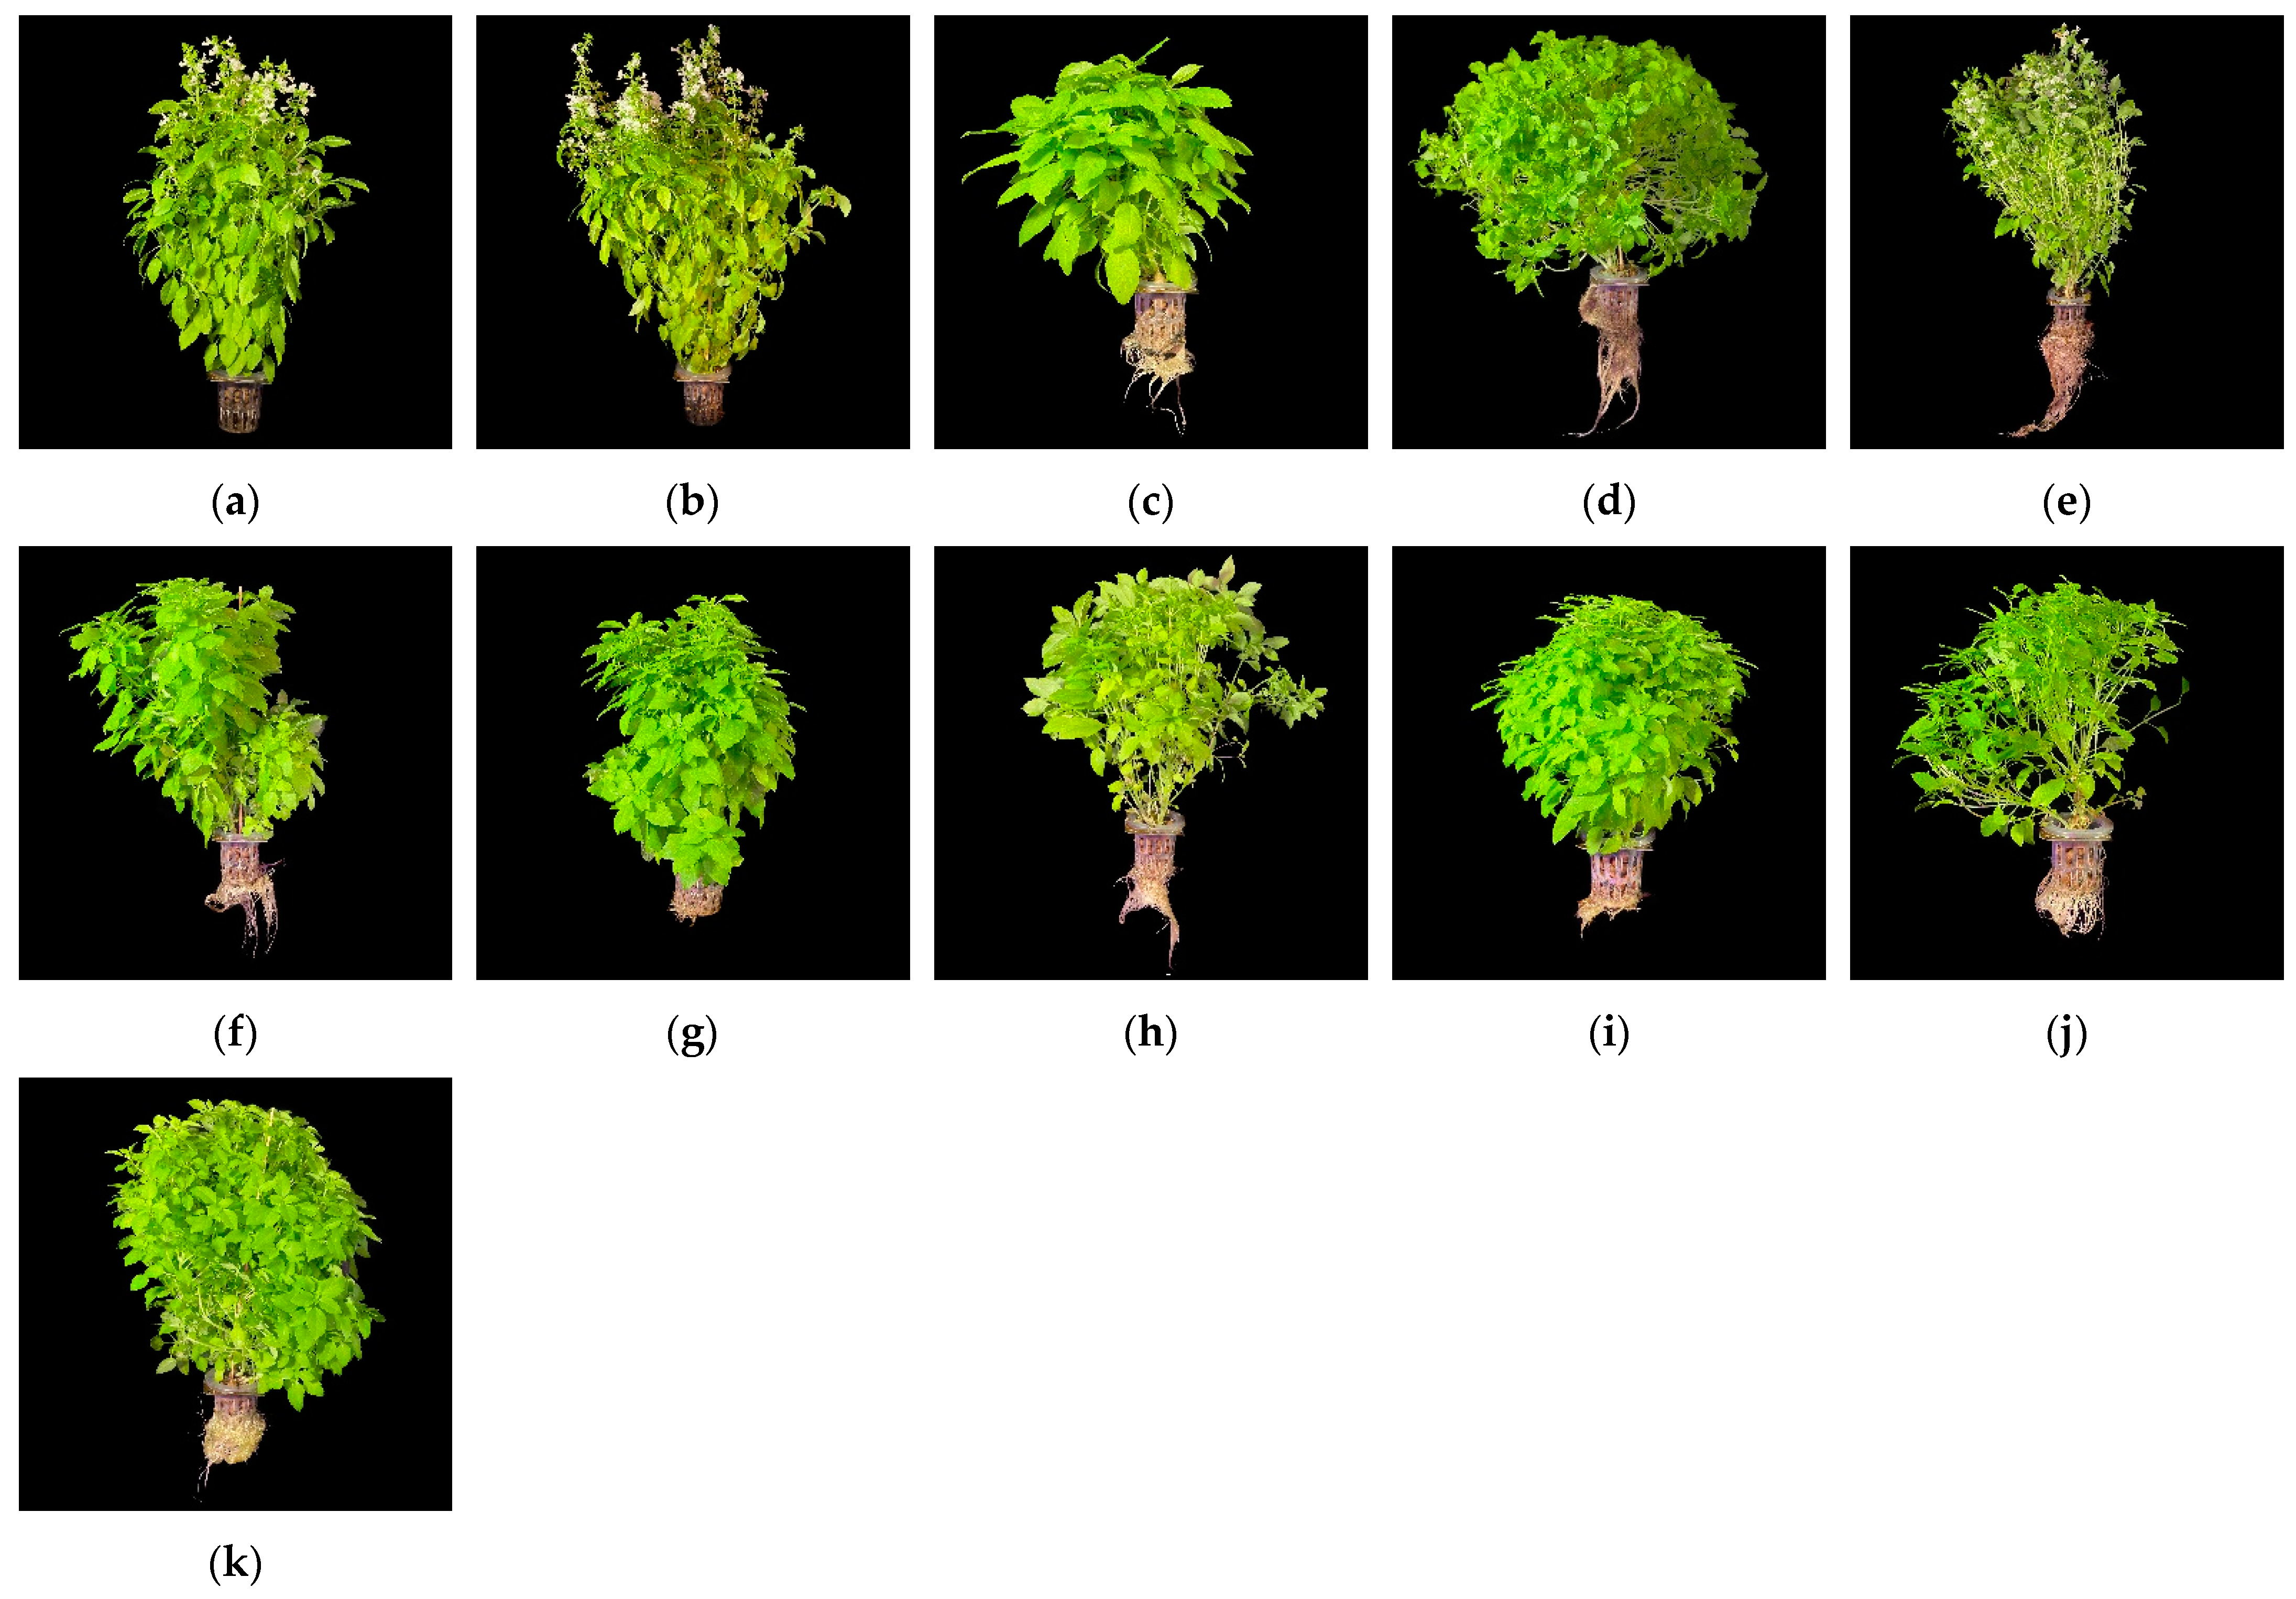
3.1. Biometric Measurements
3.2. Phytochemical Analysis
4. Discussion
5. Conclusions
Author Contributions
Funding
Institutional Review Board Statement
Informed Consent Statement
Data Availability Statement
Conflicts of Interest
References
- Le Mouël, C.; Forslund, A. How can we feed the world in 2050? A review of the responses from global scenario studies. Eur. Rev. Agric. Econ. 2017, 44, 541–591. [Google Scholar] [CrossRef]
- van Delden, S.H.; Sharath Kumar, M.; Butturini, M.; Graamans, L.J.A.; Heuvelink, E.; Kacira, M.; Kaiser, E.; Klamer, R.S.; Klerkx, L.; Kootstra, G.; et al. Current status and future challenges in implementing and upscaling vertical farming systems. Nat. Food 2021, 2, 944–956. [Google Scholar] [CrossRef] [PubMed]
- Urrestarazu, M. Manual práctico del cultivo sin suelo ehidroponía; Ediciones Mundi-Prensa: Madrid, Spain, 2015; p. 267. [Google Scholar] [CrossRef]
- Armanda, D.T.; Guinée, J.B.; Tukker, A. The second green revolution: Innovative urban agriculture’s contribution to food security and sustainability—A review. Glob. Food Secur. 2019, 22, 13–24. [Google Scholar] [CrossRef]
- Gubina, A.A.; Romanovich, M.M.; Degterev, A.E.; Levin, E. Study of the Characteristics of Semiconductor Light-Emitting Diodes and their Influence on the Growth of Vegetable Crops. In Proceedings of the IEEE Conference of Russian Young Researchers in Electrical and Electronic Engineering (ElConRus), Saint Petersburg, Russia, 25–28 January 2022. [Google Scholar] [CrossRef]
- Sipos, L.; Balázs, L.; Székely, G.; Jung, A.; Sárosi, S.; Radácsi, P.; Csambalik, L. Optimization of basil (Ocimum basilicum L.) production in LED light environments—A review. Sci. Hortic. 2021, 289, 110486. [Google Scholar] [CrossRef]
- Vogelmann, T.C.; Gorton, H.L. Leaf: Light capture in the photosynthetic organ. In The Structural Basis of Biological Energy Generation. Advances in Photosynthesis and Respiration (Including Bioenergy and Related Processes); Hohmann-Marriott, M., Ed.; Springer: Dordrecht, The Netherlands, 2014; Volume 39, pp. 363–377. [Google Scholar] [CrossRef]
- Meireles, J.E.; Cavender-Bares, J.; Townsend, P.A.; Ustin, S.; Gamon, J.A.; Schweiger, A.K.; Schaepman, M.E.; Asner, G.P.; Mar-tin, R.E.; Singh, A.; et al. Leaf reflectance spectra capture the evolutionary history of seed plants. New Phytol. 2020, 228, 485–493. [Google Scholar] [CrossRef]
- Ying, Q.; Kong, Y.; Jones-Baumgardt, C.; Zheng, Y. Responses of Yield and Appearance Quality of Four Brassicaceae Microgreensto Varied Blue Light Proportion in Red and Blue Light-Emitting Diodes Lighting. Sci. Hortic. 2020, 259, 108857. [Google Scholar] [CrossRef]
- Kami, C.; Lorrain, S.; Hornitschek, P.; Fankhauser, C. Light-Regulated Plant Growth and Development. Curr. Top. Dev. Biol. 2010, 91, 29–66. [Google Scholar] [CrossRef]
- McCree, K.J. The action spectrum, absorptance and quantum yield of photosynthesis in crop plants. Agric. Meteorol. 1971, 9, 191–216. [Google Scholar] [CrossRef]
- Dou, H.; Niu, G.; Gu, M.; Masabni, J. Effects of light quality on growth and phytonutrient accumulation of herbs under controlled environments. Horticulturae 2017, 3, 36. [Google Scholar] [CrossRef]
- Amaki, W.; Yamazaki, N.; Ichimura, M.; Watanabe, H. Effects of light quality on the growth and essential oil content in sweet basil. Acta Hortic. 2011, 907, 91–94. [Google Scholar] [CrossRef]
- Ivanitskikh, A.; Tarakanov, I.G. Effect of light spectral composition on the essential oils accumulation in basil plants grown with artificial lighting. Probl. Biol. Med. Pharm. Chem. 2022, 25, 3–9. [Google Scholar] [CrossRef]
- Semenova, N.A.; Smirnov, A.A.; Ivanitskikh, A.S.; Izmailov, A.Y.; Dorokhov, A.S.; Proshkin, Y.A.; Yanykin, D.V.; Sarimov, R.R.; Gudkov, S.V.; Chilingaryan, N.O. Impact of Ultraviolet Radiation on the Pigment Content and Essential Oil Accumulation in Sweet Basil (Ocimum basilicum L.). Appl. Sci. 2022, 12, 7190. [Google Scholar] [CrossRef]
- Litvin, A.G.; Currey, C.J.; Wilson, L.F. Effects of supplemental light source on basil, dill, and parsley growth, morphology, aroma, and flavor. J. Am. Soc. Hort. Sci. 2019, 145, 18–29. [Google Scholar] [CrossRef]
- Tabbert, J.M.; Krähmer, A.; Schulz, H. Investigation of LED Light Qualities for Peppermint (Mentha × piperita L.) Cultivation Focusing on Plant Quality and Consumer Safety Aspects. Front. Food Sci. Technol. 2022, 2, 852155. [Google Scholar] [CrossRef]
- Kang, S.; Kim, J.E.; Zhen, S.; Kim, J. Mild-Intensity UV-A Radiation Applied Over a Long Duration Can Improve the Growth and Phenolic Contents of Sweet Basil. Front. Plant Sci. 2022, 13, 858433. [Google Scholar] [CrossRef]
- Ghasemzadeh, A.; Ashkani, S.; Baghdadi, A.; Pazoki, A.; Jaafar, H.Z.E.; Rahmat, A. Improvement in Flavonoids and PhenolicAcids Production and Pharmaceutical Quality of Sweet Basil (Ocimum basilicum L.) by Ultraviolet-B Irradiation. Molecules 2016, 21, 1203. [Google Scholar] [CrossRef]
- Osman, N.; Ghazwani, A.; Balamash, K. Evaluation of the effect of gamma-irradiated Basil (Ocimum basilicum L.) on Liver Toxicity induced by Arsenic in Rats. J. Radiat. Res. Appl. Sci. 2020, 13, 552–559. [Google Scholar] [CrossRef]
- Sukardi, S.; Pulungan, M.H.; Purwaningsih, I.; Sita, P.F. Extraction of phenolic compounds from basil (Ocimum americanum L.) leaves with pretreatment using pulsed electric field (PEF). IOP Conf. Ser. Earth Environ. Sci. 2020, 475, 012056. [Google Scholar] [CrossRef]
- Walters, K.J.; Lopez, R.G.; Behe, B.K. Leveraging controlled-environment agriculture to increase key basil terpenoid and phenylpropanoid concentrations: The effects of radiation intensity and CO2 concentration on consumer preference. Front. Plant Sci. 2021, 11, 1641. [Google Scholar] [CrossRef]
- Toncer, O.; Karaman, S.; Diraz, E.; Tansi, S. Essential oil composition of Ocimum basilicum L. at different phenological stages in semi-arid environmental conditions. Fersenius Environ. Bull. 2017, 8, 5441–5446. [Google Scholar]
- Nadeem, H.R.; Akhtar, S.; Sestili, P.; Ismail, T.; Neugart, S.; Qamar, M.; Esatbeyoglu, T. Toxicity, antioxidant activity, and phytochemicals of basil (Ocimum basilicum L.) leaves cultivated in southern Punjab, Pakistan. Foods 2022, 11, 1239. [Google Scholar] [CrossRef] [PubMed]
- Krivenkov, L.V.; Vysotskaya, O.A.; Kharchenko, V.A.; Shevchenko, T.E. Evaluation of cultivar samples of Ocimum basilicum L. on the content of essential oil in the conditions of the Moscow region. In Proceedings of the Aromatic and Medicinal Plants: Introduction, Selection, Agricultural Technology, Biologically Active Substances, Influence on Humans: Abstracts of the International Scientific and Practical Conference, Yalta, Russia, 21–25 June 2021; Volume 19. (In Russian). [Google Scholar]
- Mehdizadeh, L.; Moghaddam, M. Hydroponic System for Cultivation of Medicinal Plants. In Biosynthesis of Bioactive Compounds in Medicinal and Aromatic Plants; Springer: Berlin/Heidelberg, Germany, 2023; pp. 213–234. [Google Scholar] [CrossRef]
- Gubina, A.A.; Levin, E.V.; Romanovich, M.M.; Degterev, A.E.; Patokov, N.O.; Lamkin, I.A.; Tarasov, S.A. Optimal Spectral Radiation Composition of a LED Phytolapm for Stimulating Carrot and Tomato Seed Development. J. Russ. Univ. Radioelectron. 2022, 25, 62–72. [Google Scholar] [CrossRef]
- Dou, H.; Niu, G.; Gu, M.; Masabni, J.G. Responses of Sweet Basil to Different Daily Light Integrals in Photosynthesis, Morphology, Yield, and Nutritional Quality. Hortic. Sci. 2018, 53, 496–503. [Google Scholar] [CrossRef]
- Islam, M.J.; Ryu, B.R.; Azad, M.O.K.; Rahman, M.H.; Rana, M.S.; Kang, C.-W.; Lim, J.-D.; Lim, Y.-S. Comparative growth, photosynthetic pigments, and osmolytes analysis of hemp (Cannabis sativa L.) seedlings under an aeroponics system with different LED light sources. Horticulturae 2021, 7, 239. [Google Scholar] [CrossRef]
- Jones, J.B. Complete Guide for Growing Plants Hydroponically, 1st ed.; CRC Press: Boca Raton, FL, USA, 2014. [Google Scholar] [CrossRef]
- Solis-Toapanta, E.; Gómez, C. Growth and photosynthetic capacity of basil grown for indoor gardening under constant orincreasing daily light integrals. HortTechnology 2019, 29, 880–888. [Google Scholar] [CrossRef]
- Hanusz, Z.; Tarasinska, J.; Zielinski, W. Shapiro–Wilk Test with Known Mean. Revstat Stat. J. 2016, 14, 89–100. [Google Scholar] [CrossRef]
- McKight, P.E.; Najab, J. Kruskal-Wallis Test. In The Corsini Encyclopedia of Psychology, 4th ed.; Weiner, I.B., Craighead, W.E., Eds.; Wiley & Sons: Hoboken, NJ, USA, 2010; p. 1. [Google Scholar] [CrossRef]
- Suloev, I.S.; Ponkratova, A.O.; Dudetskaya, N.A.; Teslov, L.S.; Luzhanin, V.G. Standardization of Canadian goldenrod (Solidago canadensis) herb. Farm. (Pharm.) 2020, 69, 13–20. [Google Scholar] [CrossRef]
- Jung, J.-H.; Domijan, M.; Klose, C.; Biswas, S.; Ezer, D.; Gao, M.; Khattak, A.K.; Box, M.S.; Charoensawan, V.; Cortijo, S. Phytochromes function as thermosensors in Arabidopsis. Science 2016, 354, 886–889. [Google Scholar] [CrossRef]
- Cao, K.; Yu, J.; Xu, D.; Ai, K.; Bao, E.; Zou, Z. Exposure to lower red to far-red light ratios improve tomato tolerance to salt stress. BMC Plant Biol. 2018, 18, 92. [Google Scholar] [CrossRef]
- Yoshida, H.; Hikosaka, S.; Goto, E.; Takasuna, H.; Kudou, T. Effects of light quality and light period on flowering of everbearing strawberry in a closed plant production system. Acta Hortic. 2012, 956, 107–112. [Google Scholar] [CrossRef]
- Jin, D.Z.; Su, X.F.; Li, Y.F.; Shi, M.M.; Yang, B.B.; Wan, W.C.; Wen, X.; Yang, S.J.; Ding, X.T.; Zou, J. Effect of Red and Blue Light on Cucumber Seedlings Grown in a Plant Factory. Horticulturae 2023, 9, 124. [Google Scholar] [CrossRef]
- Terashima, I.; Fujita, T.; Inoue, T.; Chow, W.S.; Oguchi, R. Green Light Drives Leaf Photosynthesis More Efficiently than Red Light in Strong White Light: Revisiting the Enigmatic Question of Why Leaves are Green. Plant Cell Physiol. 2009, 50, 684–697. [Google Scholar] [CrossRef]
- Evans, J.R.; Vogelmann, T.C. Profiles of 14C fixation through spinach leaves in relation to light absorption and photosynthetic capacity. Plant Cell Environ. 2003, 26, 547–560. [Google Scholar] [CrossRef]
- Dias, M.C.; Pinto, D.; Silva, A.M.S. Plant Flavonoids: Chemical Characteristics and Biological Activity. Molecules 2021, 26, 5377. [Google Scholar] [CrossRef] [PubMed]
- Dou, H.; Niu, G.; Gu, M.; Masabni, J. Morphological and Physiological Responses in Basil and Brassica Species to Different Proportions of Red, Blue, and Green Wavelengths in Indoor Vertical Farming. J. Amer. Soc. Hort. Sci. 2020, 145, 267–278. [Google Scholar] [CrossRef]
- Hu, J.; Dai, X.; Sun, G. Morphological and physiological responses of Morus alba seedlings under different light qualities. Not. Bot. Hort. Agrobot. Cluj-Napoca 2016, 44, 382–392. [Google Scholar] [CrossRef]
- Degtereva, M.M.; Levin, Y.; Degterev, A.E.; Bogdanov, A.A.; Lamkin, I.A.; Tarasov, S.A.; Sergeev, P.A. Assessment Procedure for the Advantages of LED Phyto-Strip Application in the Industrial Greenhouse Complexes. Photonics Russ. 2023, 17, 566–578. [Google Scholar] [CrossRef]


| Lighting Mode (Manufacturer) | Blue | Green | Red | PPFD, µmol∙m−2∙s−1 |
|---|---|---|---|---|
| LED grow light (GLANZEN, Kolomna, Russia) | 15 | 5 | 80 | 151 |
| HPS lamp (LEDVANCE GmbH, Garching, Germany) | 5 | 45 | 50 | 155 |
| Fluorescent lamp (Litarc Lighting & Electronic Ltd., Shenzhen, China) | 20 | 40 | 40 | 148 |
| LED strip (Arlight, Moscow, Russia) | 15 | 40 | 45 | 157 |
| White LED lamp (Fuzhou Linsheng Import&Export Trading Co., Ltd., Lianyungang, China) | 30 | 45 | 25 | 152 |
| 100%R (Epistar, Hsinchu, Taiwan) | - | - | 100 | 148 |
| 75%R + 25%B (Epistar, Hsinchu, Taiwan) | 25 | - | 75 | 150 |
| 50%R + 50%B (Epistar, Hsinchu, Taiwan) | 50 | - | 50 | 150 |
| 25%R + 75%B (Epistar, Hsinchu, Taiwan) | 75 | - | 25 | 150 |
| 100%B (Epistar, Hsinchu, Taiwan) | 100 | - | - | 146 |
Disclaimer/Publisher’s Note: The statements, opinions and data contained in all publications are solely those of the individual author(s) and contributor(s) and not of MDPI and/or the editor(s). MDPI and/or the editor(s) disclaim responsibility for any injury to people or property resulting from any ideas, methods, instructions or products referred to in the content. |
© 2023 by the authors. Licensee MDPI, Basel, Switzerland. This article is an open access article distributed under the terms and conditions of the Creative Commons Attribution (CC BY) license (https://creativecommons.org/licenses/by/4.0/).
Share and Cite
Degtereva, M.; Levin, Y.; Gubina, A.; Degterev, A.; Lamkin, I.; Konoplev, G.; Tarasov, S.; Whaley, A.; Whaley, A.; Suloev, I.; et al. Influence of the Spectral Composition of Illuminating Light Sources on Biometric and Phytochemical Characteristics of Ocimum basilicum L. Photonics 2023, 10, 1369. https://doi.org/10.3390/photonics10121369
Degtereva M, Levin Y, Gubina A, Degterev A, Lamkin I, Konoplev G, Tarasov S, Whaley A, Whaley A, Suloev I, et al. Influence of the Spectral Composition of Illuminating Light Sources on Biometric and Phytochemical Characteristics of Ocimum basilicum L. Photonics. 2023; 10(12):1369. https://doi.org/10.3390/photonics10121369
Chicago/Turabian StyleDegtereva, Mariya, Yevgeniy Levin, Anastasia Gubina, Aleksandr Degterev, Ivan Lamkin, Georgii Konoplev, Sergey Tarasov, Andrei Whaley, Anastasiia Whaley, Ivan Suloev, and et al. 2023. "Influence of the Spectral Composition of Illuminating Light Sources on Biometric and Phytochemical Characteristics of Ocimum basilicum L." Photonics 10, no. 12: 1369. https://doi.org/10.3390/photonics10121369