Low-Illumination Image Enhancement Based on Deep Learning Techniques: A Brief Review


1
College of Mechanical and Electronic Engineering, Nanjing Forestry University, Nanjing 210037, China
2
School of Automation, Southeast University, Nanjing 210096, China
3
College of Landscape Architecture, Nanjing Forestry University, Nanjing 210037, China
*
Author to whom correspondence should be addressed.
Photonics 2023, 10(2), 198; https://doi.org/10.3390/photonics10020198
Submission received: 25 November 2022
/
Revised: 4 February 2023
/
Accepted: 8 February 2023
/
Published: 12 February 2023
(This article belongs to the Special Issue Design and Applications of Optical Microscopy Imaging System)
Abstract
:As a critical preprocessing technique, low-illumination image enhancement has a wide range of practical applications. It aims to improve the visual perception of a given image captured without sufficient illumination. Conventional low-illumination image enhancement methods are typically implemented by improving image brightness, enhancing image contrast, and suppressing image noise simultaneously. Nevertheless, recent advances in this area are dominated by deep-learning-based solutions, and consequently, various deep neural networks have been proposed and applied to this field. Therefore, this paper briefly reviews the latest low-illumination image enhancement, ranging from its related algorithms to its unsolved open issues. Specifically, current low-illumination image enhancement methods based on deep learning are first sorted out and divided into four categories: supervised learning methods, unsupervised learning methods, semi-supervised learning methods, and zero-shot learning methods. Then, existing low-light image datasets are summarized and analyzed. In addition, various quality assessment indices for low-light image enhancement are introduced in detail. We also compare 14 representative algorithms in terms of both objective evaluation and subjective evaluation. Finally, the future development trend of low-illumination image enhancement and its open issues are summarized and prospected.
1. Introduction
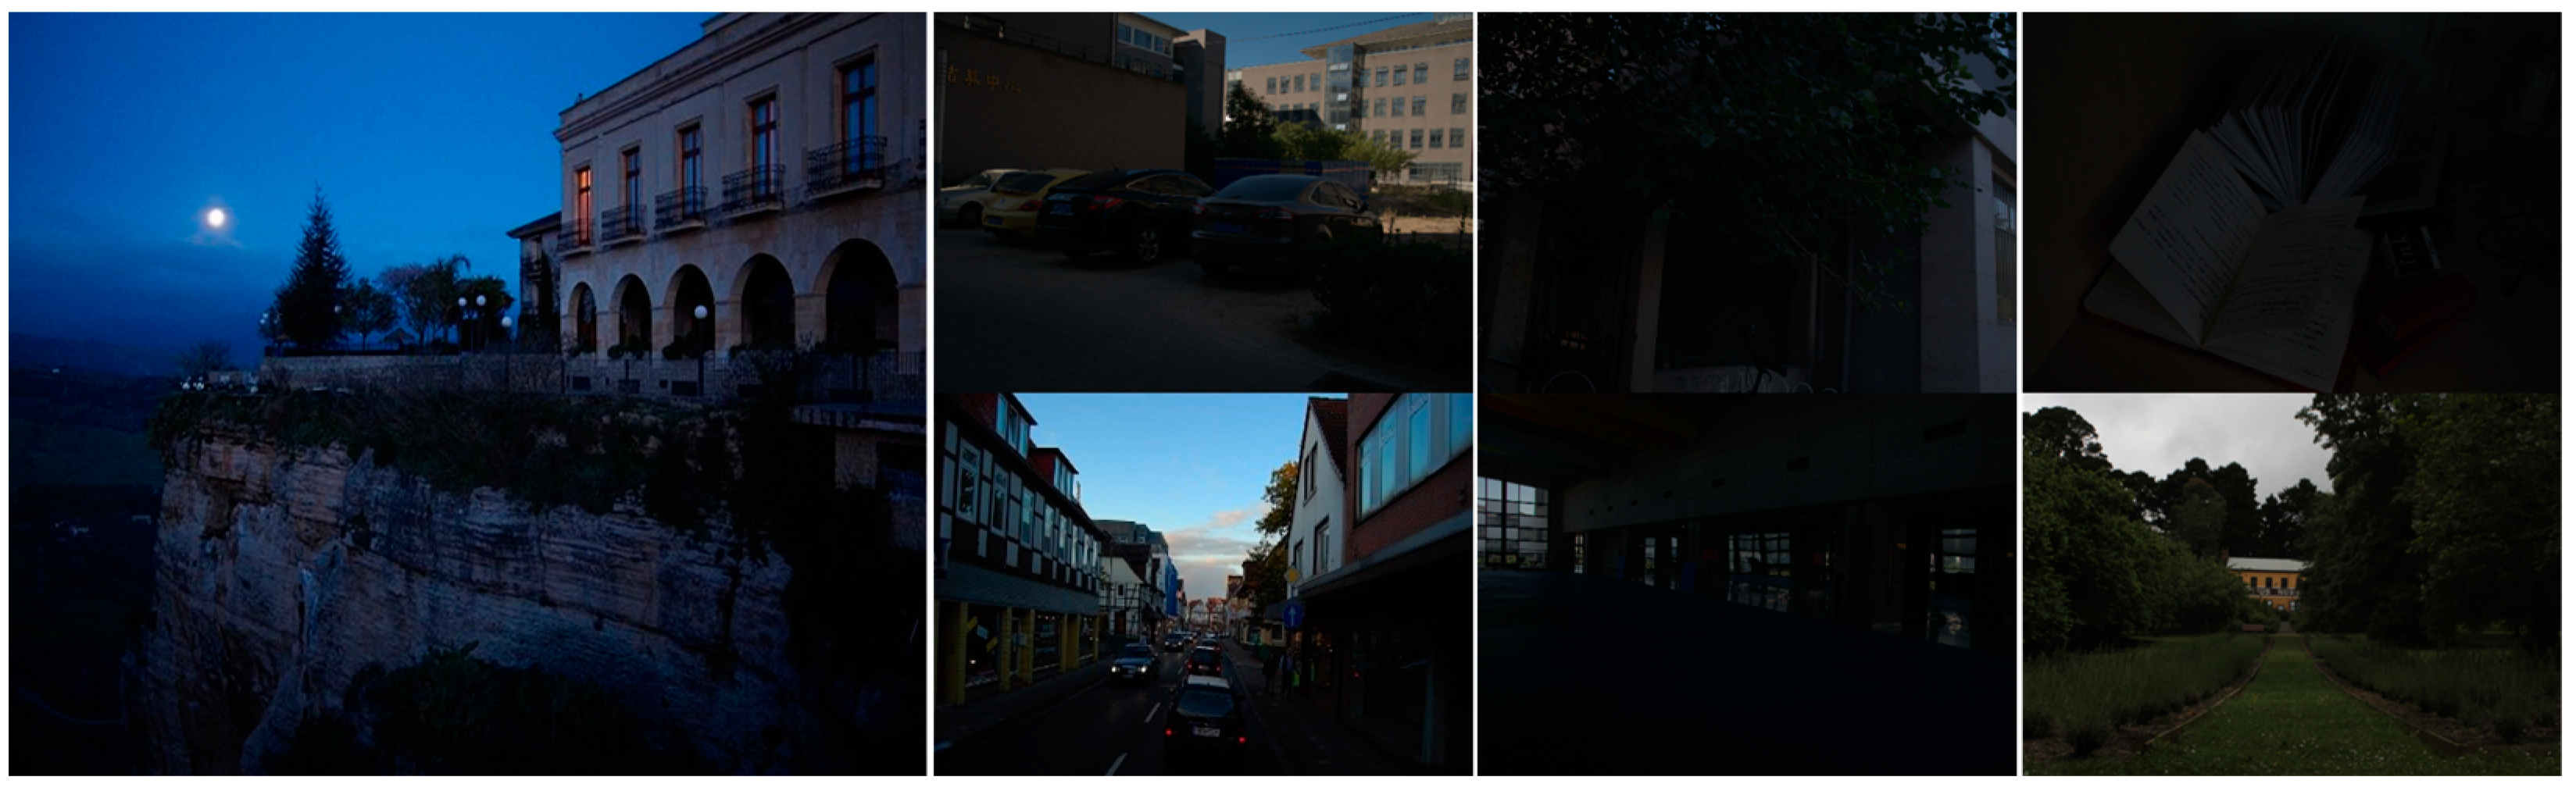
With the popularity of multimedia devices, the applications of videos and images are becoming increasingly widespread [1,2,3]. However, due to the limitations of imaging equipment or sub-optimal lighting conditions (i.e., moonlight, firelight, lamplight, etc.), it usually results in a serious reduction in visibility and contrast, and the image captured is mostly accompanied by large amounts of noise. Correspondingly, it is hard to get the reliable information we want [4,5,6,7]. Figure 1 shows some typical examples of low-illumination (or low-light) images. From the perspective of human perception, some images can hardly get valuable information, especially those with very low brightness. But for the computer, these invisible matrix data in the numerical difference is the key to reflecting the image information. To put it simply, the visual invisibility of human eyes is only a partial perception. Still, the computer can start from the difference and connection of the numerical distribution of the image to have a clearer understanding of the image. Therefore, how to use the deep learning algorithm to realize the conversion of invisible information to visible information is the purpose of the existing low illumination image enhancement technology based on deep learning [8,9]. Some video shooting devices even focus on the ability to take pictures at night [10,11]. Therefore, with a wide range of applications, low-illumination image enhancement has become a challenging and active research area for the image-processing community [12,13].
There are many traditional low-illumination image enhancement methods, including gray transformation, histogram equalization [14], Retinex model [15], frequency-domain processing [16], image fusion model [17], defogging model [18], etc. Among them, low-illumination image enhancement based on the Retinex model is the most prevalent, and many scholars have made a series of improvements to it, which can effectively improve the quality of image enhancement. Retinex is a commonly used image theory based on scientific experiments and analysis. The Retinex model methods decompose the low-illumination image into an illuminance image and reflection image, reduce or even remove the influence of the incident image through specific algorithms, and retain the reflection property image of the essence of the object. However, this algorithm has some limitations. Taking the reflection map as the enhancement result will lead to losing details, color distortion, and other problems. Moreover, this model ignores noise because a lot of noise is generated in the reflection map. The calculation of the reflection map itself is an ill-posed problem, which can only be calculated by approximate estimations.
In recent years, deep learning has been widely used in the field of image processing, and various experiments have proved that it has obvious advantages in many low-level visual tasks. With the advent of LLNet [19] in 2017, low-illumination image enhancement based on deep learning began to receive the most attention from researchers in this field. From 2017 to 2022, hundreds of low-illumination image enhancement algorithms based on deep learning have been proposed. This fully reflects that the methods based on deep learning are of better accuracy, robustness, and faster speed. Table 1 shows recent low-illumination image enhancement algorithms based on deep learning with the corresponding timelines.
In general, the existing low-illumination image enhancement algorithms based on deep learning are dominant, but they still face many problems that need to be overcome by researchers. Therefore, it is necessary to review and analyze existing methods comprehensively. To this end, we introduce the current progress of low-illumination image enhancement based on deep learning and analyze its datasets and objective evaluation indicators. Furthermore, the challenges and application defects of existing methods are also discussed in this paper, aiming to contribute to future research and development on this topic.
The rest of this paper is organized as follows: in Section 2, low-illumination enhancement algorithms based on deep learning are divided into four categories according to their learning and training fashions, and the characteristics of each algorithm are analyzed in detail. In Section 3, existing low-illumination image datasets are listed, and the representative datasets and the most frequently used datasets are examined in detail. In Section 4, a subjective visual comparison and objective evaluation of 14 representative enhancement algorithms are conducted. In the last section, existing bottlenecks in this field are summarized, and future research directions are prospected.
2. Classification of Low Illumination Image Enhancement Methods
According to the learning method used, we can classify existing low-illumination enhancement methods into four categories, i.e., supervised learning, unsupervised learning, semi-supervised learning, and zero-shot learning methods.
2.1. Supervised Learning Methods
The most crucial feature of supervised learning is that the required data sets are labeled. Supervised learning is learning the model from labeled training data and then using the model to predict its label for some new data. Meanwhile, the more similar the predicted tags are to the given tags, the better the supervised learning algorithm is. Low illumination image enhancement methods based on supervised learning can be roughly divided into end-to-end methods and Retinex theory methods.
2.1.1. End-to-End Methods
Back in 2017, a deep encoder-based method (LLNet) was first proposed [19], which used a variant of stacked sparse denoising autoencoder to identify features from the low-light image, adaptively enhance and denoise the image. This method is the first end-to-end low illumination enhancement method based on deep learning. Lv et al. [22] proposed a multi-branch image enhancement network MBLLEN. The MBLLEN consists of three types of modules, i.e., the feature extraction module (FEM), the enhancement module (EM), and the fusion module (FM). In this method, different image features are extracted from different levels, which can be enhanced by multiple sub-networks. Finally, the output image is generated by multi-channel fusion. The image noise and artifacts in the low-light area can be suppressed well by this method. At the same time, 3D convolution can be used instead of 2D convolution for low-illumination video enhancement. Wang et al. [66] proposed a Global Awareness and Detail Retention network (GLADNet), which put the input image into the encoder-decoder structure to generate a global illumination estimate and finally used a convolutional network to reconstruct images based on the global care estimate and the original days. To prove the effectiveness of this method, the target recognition performance test is tested on Google Cloud Vision API2. The results show that compared with the original image, Google Cloud Vision can detect more details in the enhanced image and label them. Lu et al. [37] proposed a multi-exposure fusion network, which transferred functions in two sub-networks to generate two enhanced images. Then the noise is further reduced by the simple average fusion method, and the effect is further refined by the refinement element. PRIEN [43] is a progressive enhancement network that is able to continuously extract features from low-illumination images using recursive units composed of recursive layers and residual blocks. This method is the first to directly input low-illumination images into the dual-attention model to extract features. In order to better ensure the network performance, the method reduces the number of parameters by recursively operating a single residual block. Although the network structure of this method is relatively simple, the enhancement effect is also more obvious. C-LIENet [67] includes an encoder-decoder structure composed of convolutional layers, and introduces a unique multi-context feature extraction module, which can extract context features in layers. This method proposes a three-part loss function, which has advantages in local features, structural similarity, and details. Lim et al. [41] proposed a deep Laplacian Restorer (DSLR) for low-illumination image enhancement, which can adjust the global luminance and local details from the input image and gradually fuse them in the image space. The proposed multi-scale Laplacian residuals block makes the training phase more efficient through rich connections of higher-order residuals defined in the multi-scale structure embedded in the feature space.
2.1.2. Deep Retinex-Based Methods
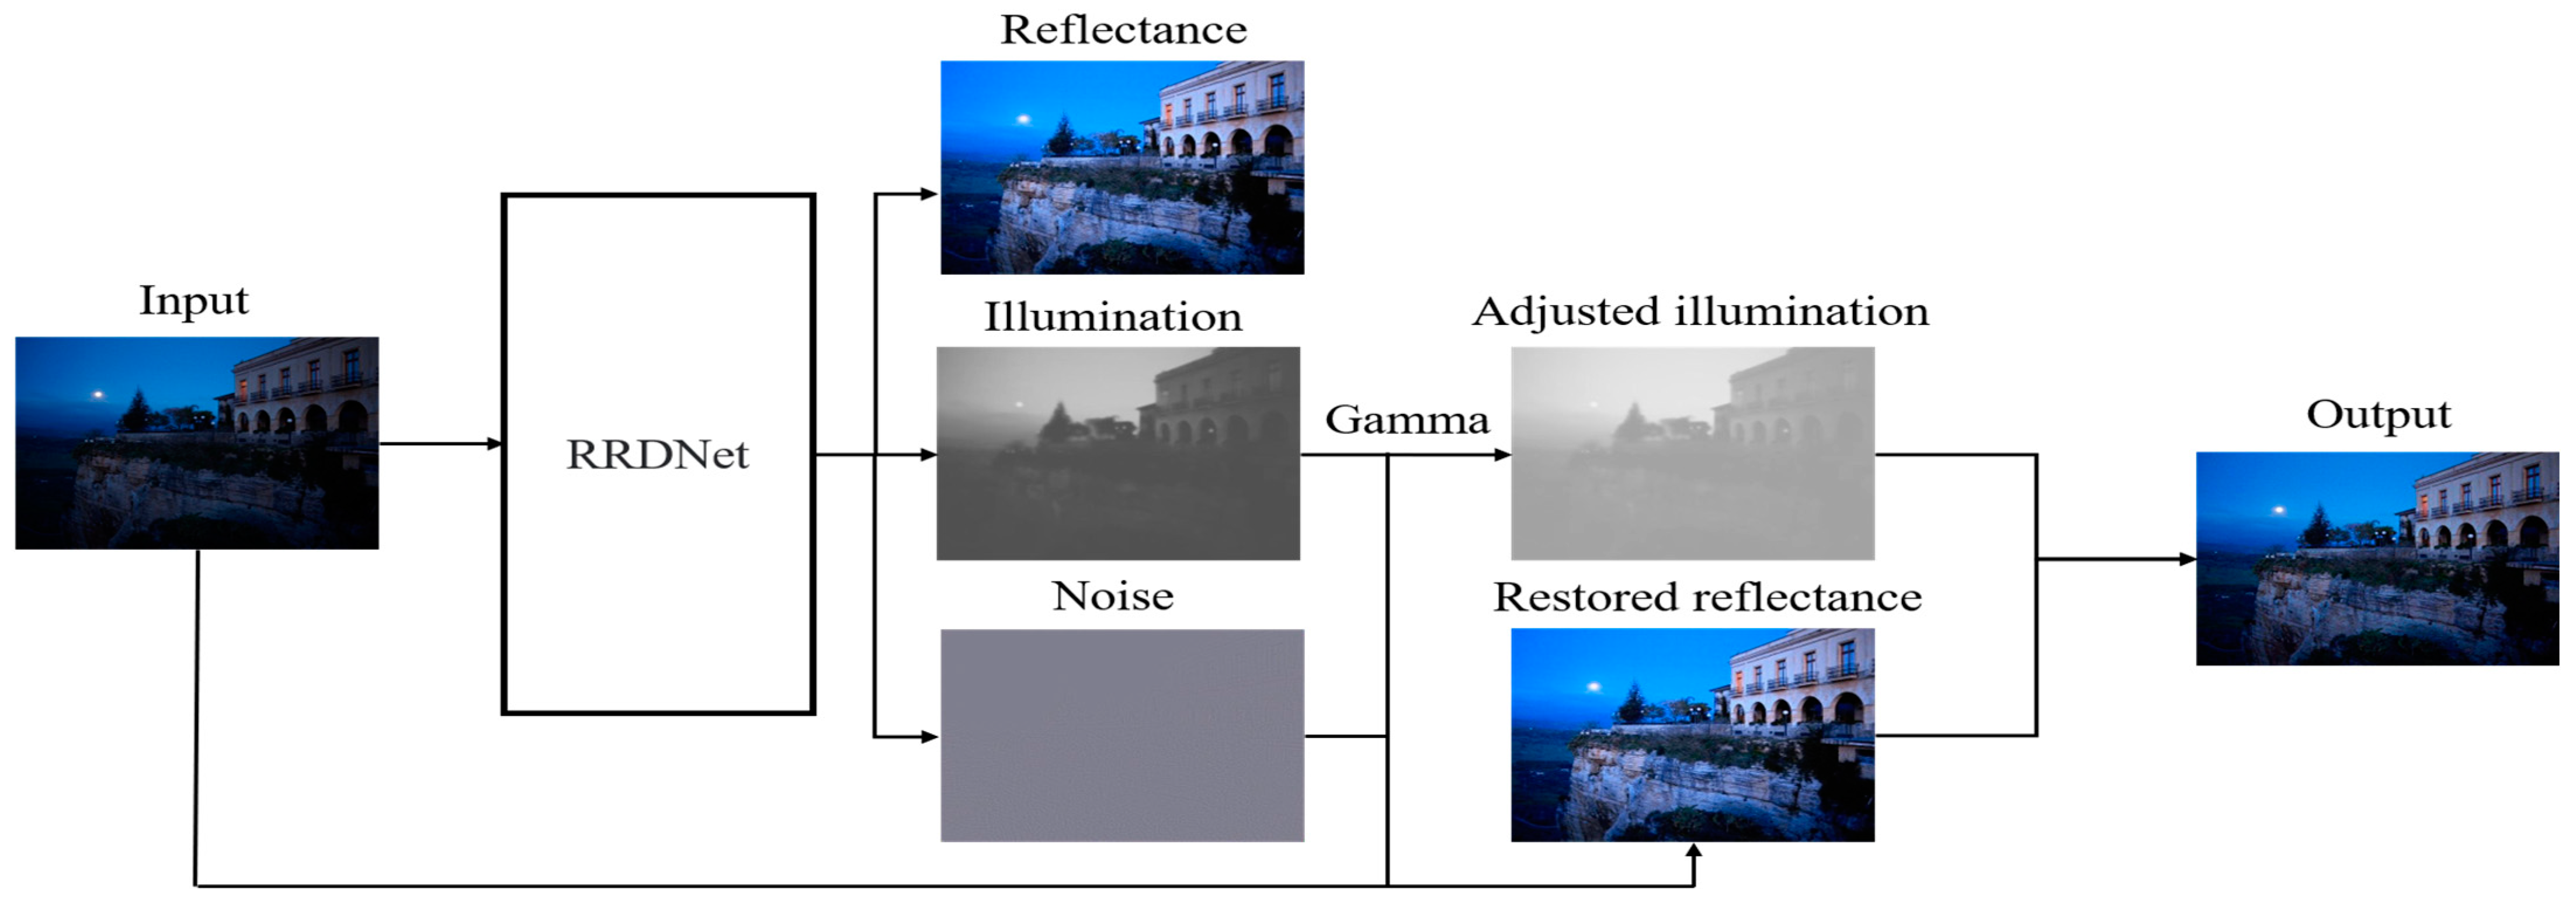
Compared with the result of end-to-end network learning directly, the method based on deep learning and the Retinex theory sometimes has a better enhancement effect. Wei et al. [24] proposed the first deep learning network based on a data-driven strategy and Retinex theory, which decomposed an image into a reflectance image of independent light rays and a structure-aware illumination image through a decomposition network. Then, a large area of illumination was enhanced by the enhancement network. Finally, the overall image effect was improved by clipping local distribution and BM3D noise reduction. A brief flow diagram of this algorithm is shown in Figure 2. Liang et al. [20] modeled MSR (Multi-Scale Retinex) and proposed the MSR-Net, which includes three modules: multi-scale logarithmic transformation, convolution difference, and color restoration. It directly learns the end-to-end mapping from low-illumination to the true image by training the synthesized low-illumination pair adjusted by Photoshop. Zhang et al. [29] constructed a deep network based on Retinex theory, which is divided into two branch networks, one for regulating illumination and one for removing degradation. It includes three modules: layer decomposition, reflectance restoration, and illuminance adjustment. Multi-scale illuminance enhancement module is used to avoid noise and distortion of enhanced image. R2RNet [42] is a new real-normal network based on the Retinex theory. It includes a decomposition module, a noise reduction module, and a brightness enhancement module and presents a large real-world image pair dataset (LSRW). Wei et al. [46] proposed a novel module, namely NCBC, based on Retinex theory to simultaneously suppress noise and control color deviation, which consists of a convolutional neural network and two loss functions. Its characteristic is that the NCBC module only calculates the loss function in the training stage, which makes the method faster than other algorithms in the test stage.
2.1.3. Deep Transformer-Based Methods
Vision Transformer is currently a research hotspot with supervision tasks. Cui et al. [68] proposed Illumination-Adaptive Transformer (IAT) network, which is a full supervision and training mode and belongs to an ultra-lightweight network. Different from the above solutions, this network adopts the idea of a target detection network DETR (Detection Transformer) [69] and designs an end-to-end transformer to overcome the impact of low illumination on visual effects. The performance of this method is very good, and the speed is the most important feature. Wang et al. [64] proposed a Low-Light Transformer based Network (LLFormer). The core components of the LLFormer are the axis-based multi-head self-attention and cross-layer attention fusion block, which reduces the computational complexity. Meanwhile, Wang et al. built a benchmark dataset of 4K and 8K UHD images (UHD-LOL) to evaluate the proposed LLFormer, which was also the first method to try to solve the UHD-LLIE task.
2.2. Unsupervised Learning Methods
There are two limitations to the aforementioned methods as mentioned above. First, the pairwise pictures in the datasets are limited. Second, training models on pairwise datasets would cause the over-fitting problem. To solve the above issues, scholars began to use unsupervised learning methods for enhancement. Unsupervised learning is characterized by a learning environment of unlabeled data. Jiang et al. [28] proposed the first unsupervised learning method called EnlightenGAN. A brief flow diagram of this algorithm is shown in Figure 3. EnlightenGAN is the first to introduce non-matching training to this field successfully. The proposed method has two improved parts. Firstly, the global-local discriminator structure deals with spatially varying illumination conditions in the input image. Secondly, the self-feature retention loss and self-regularization attention mechanism are used to keep the image content features unchanged before and after enhancement. Fu et al. [70] proposed a low-illumination enhancement network (LE-GAN) using an invariant identity loss and attention module. They used an illumination sensing attention module to enhance image feature extraction, which improved visual quality while realizing noise reduction and detail enhancement. At the same time, constant loss of identity can solve the problem of overexposure. This paper also established and released a sizeable unpaired low-illumination/normal-illumination image dataset called PNLI. Ni et al. [71] proposed an unsupervised enhancement method called UEGAN. The model is based on a single deep GAN incorporating an attention mechanism to capture more global and local features. The model proposes fidelity loss and quality loss to handle unsupervised image enhancement assurance loss is used to ensure that the content between the enhanced image and the input image is the same, and quality loss is used to assign the desired features to the image. Zhang et al. [72] proposed an unsupervised low-illumination image enhancement method (HEP) using histogram equalization. This method introduced the noise separation module (NDM), which separates the noise and content in the reflectance map with unmatched image pairs. Through histogram equalization and the NDM module, the texture information and brightness details of the image can be well enhanced, and the noise in the dark and yellow area of the image can be well suppressed.
2.3. Semi-Supervised Learning Methods
Semi-supervised learning was proposed not long ago. It combines the advantages of supervised learning and unsupervised learning. Semi-supervised learning requires labeled data as well as unlabeled data. The characteristic of the semi-supervised learning method is to use many unlabeled samples and a small number of labeled samples to train the classifier, which can solve the problem of more labeled samples and less unlabeled samples. Yang et al. [44] proposed a semi-supervised low-illumination image enhancement method (DRBN) based on frequency band representation. A brief flow diagram of this algorithm is shown in Figure 4. The network is a deep recursive band network, which first restores the linear band representation of the enhanced image based on pairwise low/standard light images, and obtains the improved band representation by relocating the given band. This band can remove not only noise but also correct image details. A semi-supervised learning network called HybirdNet was proposed by Robert et al. [27]. The network is divided into two branches. The first branch is responsible for receiving the supervised signals and is used to extract the invariant components. The second branch is entirely unsupervised and is used to reconstruct the model information discarded by the first branch as input data.
2.4. Zero-Shot Learning Methods
The advantage of zero-short learning is that training data is not required. This method does not need to be trained in advance and can directly take the low-light image to be enhanced as the input. Zhu et al. [39] proposed a new three-branch fully convolutional neural network called RRDNet. The input image is decomposed into three components: illumination, reflection, and noise. By iterating the loss function, the noise is estimated, and the lighting is effectively restored, allowing the noise to be predicted clearly, making it possible to eliminate image noise. RRDNet proposes a new loss algorithm to optimize the image decomposition effect, which can estimate the noise in the dark area according to the image brightness distribution to avoid the noise in the dark area being over-amplified. A brief flow diagram of this algorithm is shown in Figure 5. Inspired by the super-resolution model, Zhang et al. [33] proposed a CNN network (ExCNet) specifically for testing. In the test, the network estimates a parametric curve most suitable for the test backlight image, which can be used to enhance the image directly. The advantages of ExCNet are that it is ideal for complex shooting environments and severe backlight environments. In the video enhancement process, the following structure is guided by the parameters of the previous frame to avoid the phenomenon of artifacts.
3. Low-Illumination Image Datasets
Recently, promoted by the demand for algorithms, the number of low-illumination image datasets has gradually increased. Table 2 shows the representative datasets. It can be seen from the table that the overall datasets are from single to diverse, from simple to complex, and the number of images in a single dataset has also significantly increased. From 10 images in LIME in 2017 to 55,148 in LIL-Phone in 2021, these low-illumination image datasets provide solid data support for developing various algorithms. However, the existing datasets are generally only suitable for low-level image processing work. At the same time, collecting a similar number of datasets is not easy. It is difficult for human eyes to capture the low-illumination/standard image pairs of specific objects. Therefore, the generation of existing teams of data requires manual processes, but the manual labels are often not ideal, which makes the enhancement effect of the algorithm greatly affected.
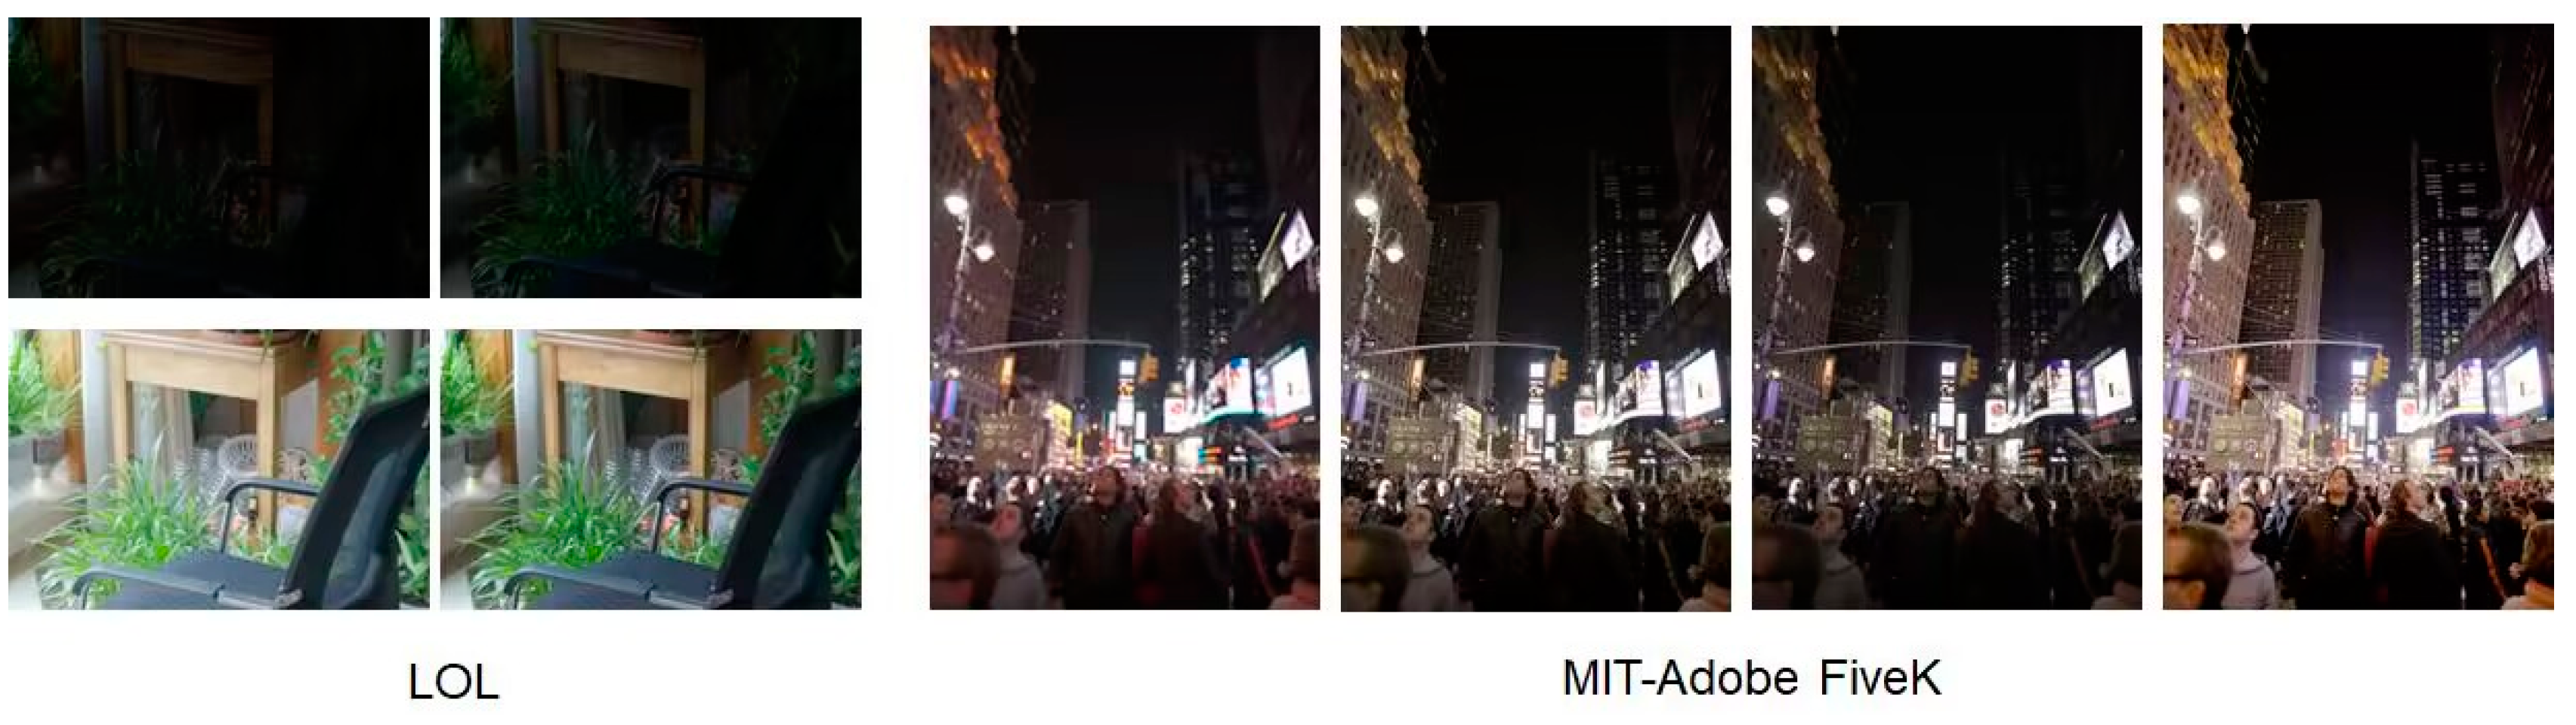
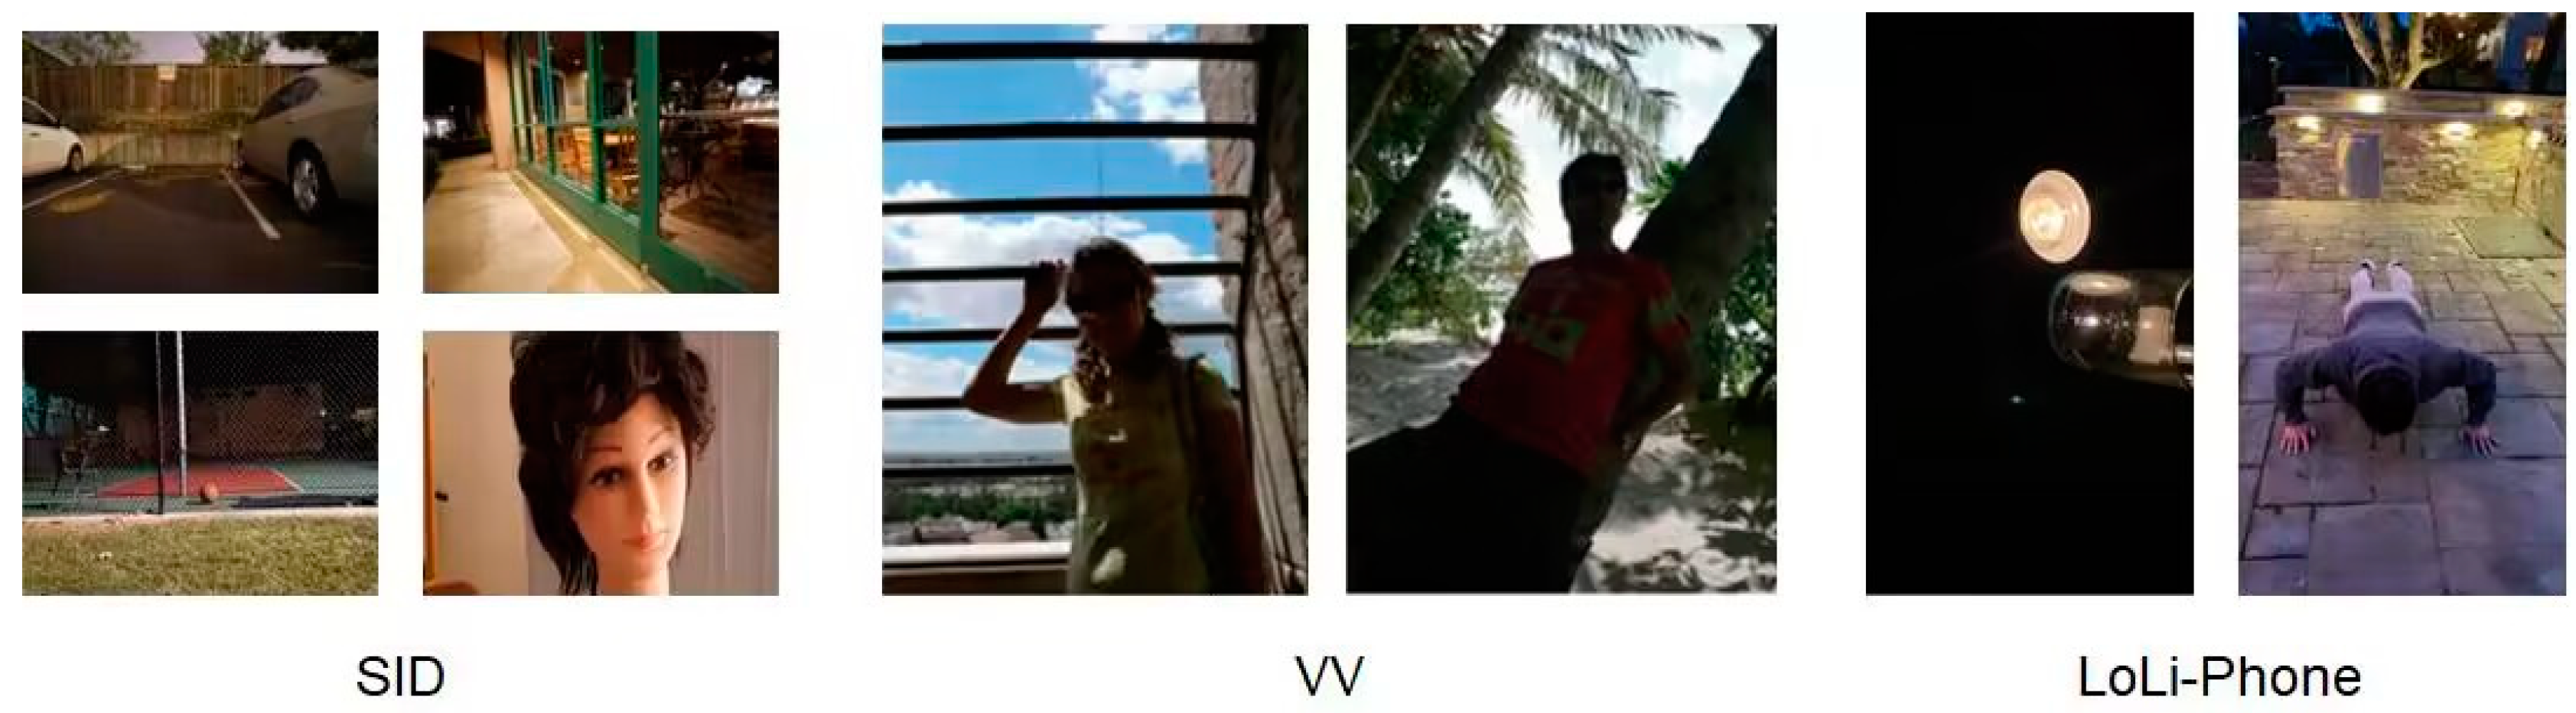
Early datasets are generally applied to traditional and model-based methods, which require less quantity and quality of datasets. Early datasets are all single images, but with the development of deep learning in low-illumination images, some paired low-illumination image datasets have been successively proposed, such as SID-RAW, LOL, and LSRW. Among them, the LOL (Low-light Dataset) dataset collected and sorted by Wei et al. in the year 2018 is the most representative one. Figure 6 shows low-light images from some sample datasets.
Low-illumination image datasets are summarized in Table 2. The MIT-Adobe FiveK dataset was taken with an SLR camera and includes 5000 images. The photos detail a wide range of scene information and lighting conditions. In addition, the data set also arranges for trained professionals to use Adobe Lightroom to adjust the hue so that the photos are visually pleasing to the human eye. SICE is a large-scale multi-exposure image dataset containing multi-scene high-resolution image sequences. The NPE is a combined data set consisting of 46 images taken with a digital camera and 110 images downloaded from various websites. The collected images are characterized by low contrast in local areas. LIME is a small data set containing only 10 images, which is mainly applied to the quality evaluation of algorithm enhancement effects. The DPED is a large data set of real images taken from three mobile phones and a single-lens reflex camera. The SID data set was collected and presented in 2018. The data set was taken by two cameras, the SONY Alpha 7SII and the Fuji X-T2, and contains 5094 raw exposure images, each with a corresponding long exposure reference image. The LOL dataset consisted of 500 low-light and normal-light image pairs, divided into 485 training pairs and 15 test pairs. Low-light images contain noise generated during photo capture. Most of the images are interior scenes. All images have a resolution of 400 × 600. BBD-100K is the largest data set of driving videos and contains 100K videos. The data set takes into account geographical, environmental, and other factors and is useful for training models with less environmental impact. SICE is a large-scale multi-exposure image dataset containing multi-scene high-resolution image sequences. The ExDark dataset contains low-light images from 10 different environments, from dusk to very low light, labeled into 12 categories. SMOID is a pair of videos synchronized in space and time. This data set also makes up for the defect that the previous low illumination video data sets only contain low illumination video but no control of normal brightness video. The DRV data set contains both the still video and the corresponding long-exposure video. This data set is derived from the SID data set extension.
The Dark-Face dataset consists of real low-light images taken in multiple scenes. All the images in this data set are marked with the face part with the boundary box, which is used as the main training set or verification set. NightCity is the largest real-world night semantic segmentation dataset with pixel-level tags. ELD data set is a noisy image synthesized by the noise model. This data set is collected by various camera equipment. Under extremely low illumination conditions, the quality of the image of this data set can be equivalent to the real data. LLVIP data set is the visible image and infrared image pairing data set. The dataset contains 27 dark scenes and two daytime scenes. LSRW is the first large-scale real-world low illuminance/normal brightness data set to be collected. Both VE-LOL-H and VE-LOL-L belong to the VE-LOL dataset. Among them, VE-LOL-L is built for low-level visual tasks, and VE-LOL-H is built for high-level visual tasks. VE-LOL-L is a composite image that includes a variety of backgrounds. VE-LOL-H is the largest low light detection data set for advanced visual tasks and can be used in joint enhancement and detection algorithms. The Oli-Phone is a large-scale data set containing both low-light images and low-light videos, which are taken by different brands of mobile phones under different lighting conditions. VV is a low-illumination data set that has been used in the field of low-illumination image enhancement.
In general, most of the existing low-illumination image datasets are single images in the natural environment, and the number of paired image datasets with reference is small. However, artificial labels often cannot avoid the influence of physical factors. Therefore, the data sets of low-illumination image enhancement methods are relatively backward compared with the data sets of other image processing tasks. In addition, in experiments, researchers tend to use test data collected by them because some data sets are not initially applied in low-illumination image enhancement, and there is no specific evaluation index to evaluate the enhancement effect except for paired data sets. Since data sets are the key to developing low-illumination image enhancement technology and are relatively backward compared with other image processing data sets, how to get rid of the dependence on pairwise data sets is the key to developing low-illumination image enhancement technology based on deep learning.
4. Image Quality Assessment
4.1. Objective Evaluation Indices
There are many objective evaluation indicators of images and different evaluation standards from different perspectives. Each evaluation standard has its corresponding advantages and disadvantages. Thus far, there is no evaluation index designed explicitly for low-light image enhancement. The existing Image Quality Assessment (IQA) methods can be divided into full reference evaluation indices and no reference evaluation indices.
Table 3 lists the latest quality evaluation indexes of several classic cores. The following is a detailed description of several commonly used indicators.
(i) Peak-Signal to Noise Ratio (PSNR) is one of the most widely used indicators. The unit is dB. It is used to measure the difference between two images. Such as the compressed image and original image, compressed image quality evaluation, restored image and actual image, restoration algorithm performance evaluation, etc. The higher the PSNR value, the less distortion. The formula of PSNR is:
where is the mean square error of two images; is the maximum value of image pixels.
(ii) Structural Similarity (SSIM) is the most widely used standard for referenced image quality evaluation. SSIM is used to highlight the brightness, contrast, and structural similarity between two images whose value range is 0–1; the closer to 1, the more similar the two images are. Assuming that x and y are two input images, the formula is:
where is brightness comparison, is contrast comparison, and is structural comparison. is greater than 0, which is used to adjust the three-part specific gravity. , , and have the following formulas respectively:
where and represent the average value of the two images, respectively and represent the standard deviations of the two images. represents the covariance of the two images. , , and are constants to avoid 0 in the denominator.
(iii) Mean Square Error (MSE) is also one of the most commonly used indicators to measure image quality. It refers to the expected value of the square difference between the estimated value and the true value. In an image processing algorithm, it is the mean value of the squared difference between the processed image pixel value and the original pixel value. The expression is as follows:
where is the height of the image and is the image’s width. and denote the original and enhanced image, respectively. The smaller the value of , the better the image quality.
(iv) Information Entropy (IE) reflects the amount of information carried by an image. The greater the information entropy, the richer the image information and the better the quality. IE is used to compare the difference in information content in different images. For example, images taken in the same area will also have different information content due to additional shooting times. The expression is as follows:
where is the probability density of gray level k, and is the maximum gray level.
(v) Standard Deviation (STD), also known as standard deviation, represents the average distance each item of data is from the average. STD is also the square root of the variance. STD can reflect the dispersion degree of a data set. Compared with images, STD reflects the dispersion degree between illustrations and the average value and is a measure of image contrast within a specific range. The larger the standard deviation, the more information contained in the image, and the better the visual effect. The formula is:
where is the height of the image, is the width of the image, and represents the gray value of the pixel at of the image. represents the average gray value of the image, and its expression is as follows:
where , , and denotes the same content as above.
(vi) Lightness Order Error (LOE) is the sequential difference in brightness of an image, and the illuminance change of an image is evaluated by evaluating the sequential change process of the brightness of the image in the neighborhood. LOE reflects the natural retention ability of the image. A smaller value indicates that the image has a better luminance order and looks more natural. The formula is:
where is the height of the image, N is the width of the image, and is the XOR operator, and and , respectively, represent the maximum value in the three-color channels. The smaller the value of , the better the brightness order of image retention.
4.2. Subjective Evaluation Indices
In addition to the aforementioned objective evaluation indices, there are some subjective ones: Differential Mean Opinion Score (MOS) or DMOS (Differential Mean Opinion Score). Among them, MOS is the most widely used subjective IQA method. Different people make subjective comparisons between the original image and the enhanced image to get the MOS score and, finally, get the average score. MOS scores range from 1 to 5, with higher scores indicating better subjective enhancement. The formula is:
where R represents the number of evaluators’ satisfaction scores for the image, and N represents the total number of evaluators.
4.3. Summary
Although PSNR, MSE, SSIM, and IE are classical and popular image evaluation indicators, these indicators are far from reaching the evaluation ability of human visual perception. At the same time, although these evaluation indices can evaluate the image quality, they cannot express the relationship between the low-illumination enhanced image and the actual image. Therefore, in the evaluation index of low-illumination image enhancement, we think that there is still a great effort to achieve the balance between human visual effects and machine perception.
5. Algorithm Comparisons and Result Analysis
We selected some datasets to enhance the images to compare the effects of various low-illumination image enhancement algorithms based on deep learning. We made an objective evaluation of these enhanced images. To ensure the fairness of the test, all the methods are tested under the same hardware environment after reaching the optimal level of training. Training environment configuration: Intel I7-8700 CPU, 32 GB RAM, and NVIDIA GeForce RTX2080 Ti GPU. TensorFlow/PyTorch framework, PyCharm software in 32 GB environment, Anaconda Python 3.7 interpreter built the network framework. Test environment configuration: Intel(R) Core (TM) i5-6300hq CPU @ 2.3 GHz, Windows10 operating system, PyCharm software in 12 GB environment, Anaconda Python 3.7 interpreter. Experiments were conducted on the unpaired LIME and SICE datasets and on the paired LOL and VE-LOL-L datasets, respectively. We analyzed the LLNet, RetinexNet, MBLLEN, EnlightenGAN, ExCNet, RRDNet, DRBN, TBEFN, IceNet, KinD++ [30], Sci, URetinexNet, and Zero-DCE++ [50], which are a total of 14 low-illumination image enhancement algorithms based on deep learning. LLNet, RetinexNet, MBLLEN, TBEFN, KinD++, URetinexNet, and LCDPNet belong to the supervised learning method. EnlightenGAN and Sci belong to the unsupervised model. DRBN belongs to the semi-supervised learning model. ExCNet, RRDNet, Zero-DCE++, and IceNet belong to the zero-shot learning method. The enhanced effects of these algorithms are shown in Figure 7, Figure 8, Figure 9 and Figure 10. Besides, we use the aforementioned indicators to carry out an objective evaluation of the 14 methods, and the evaluation results are shown in Table 4, Table 5, Table 6 and Table 7.
5.1. Subjective Analysis
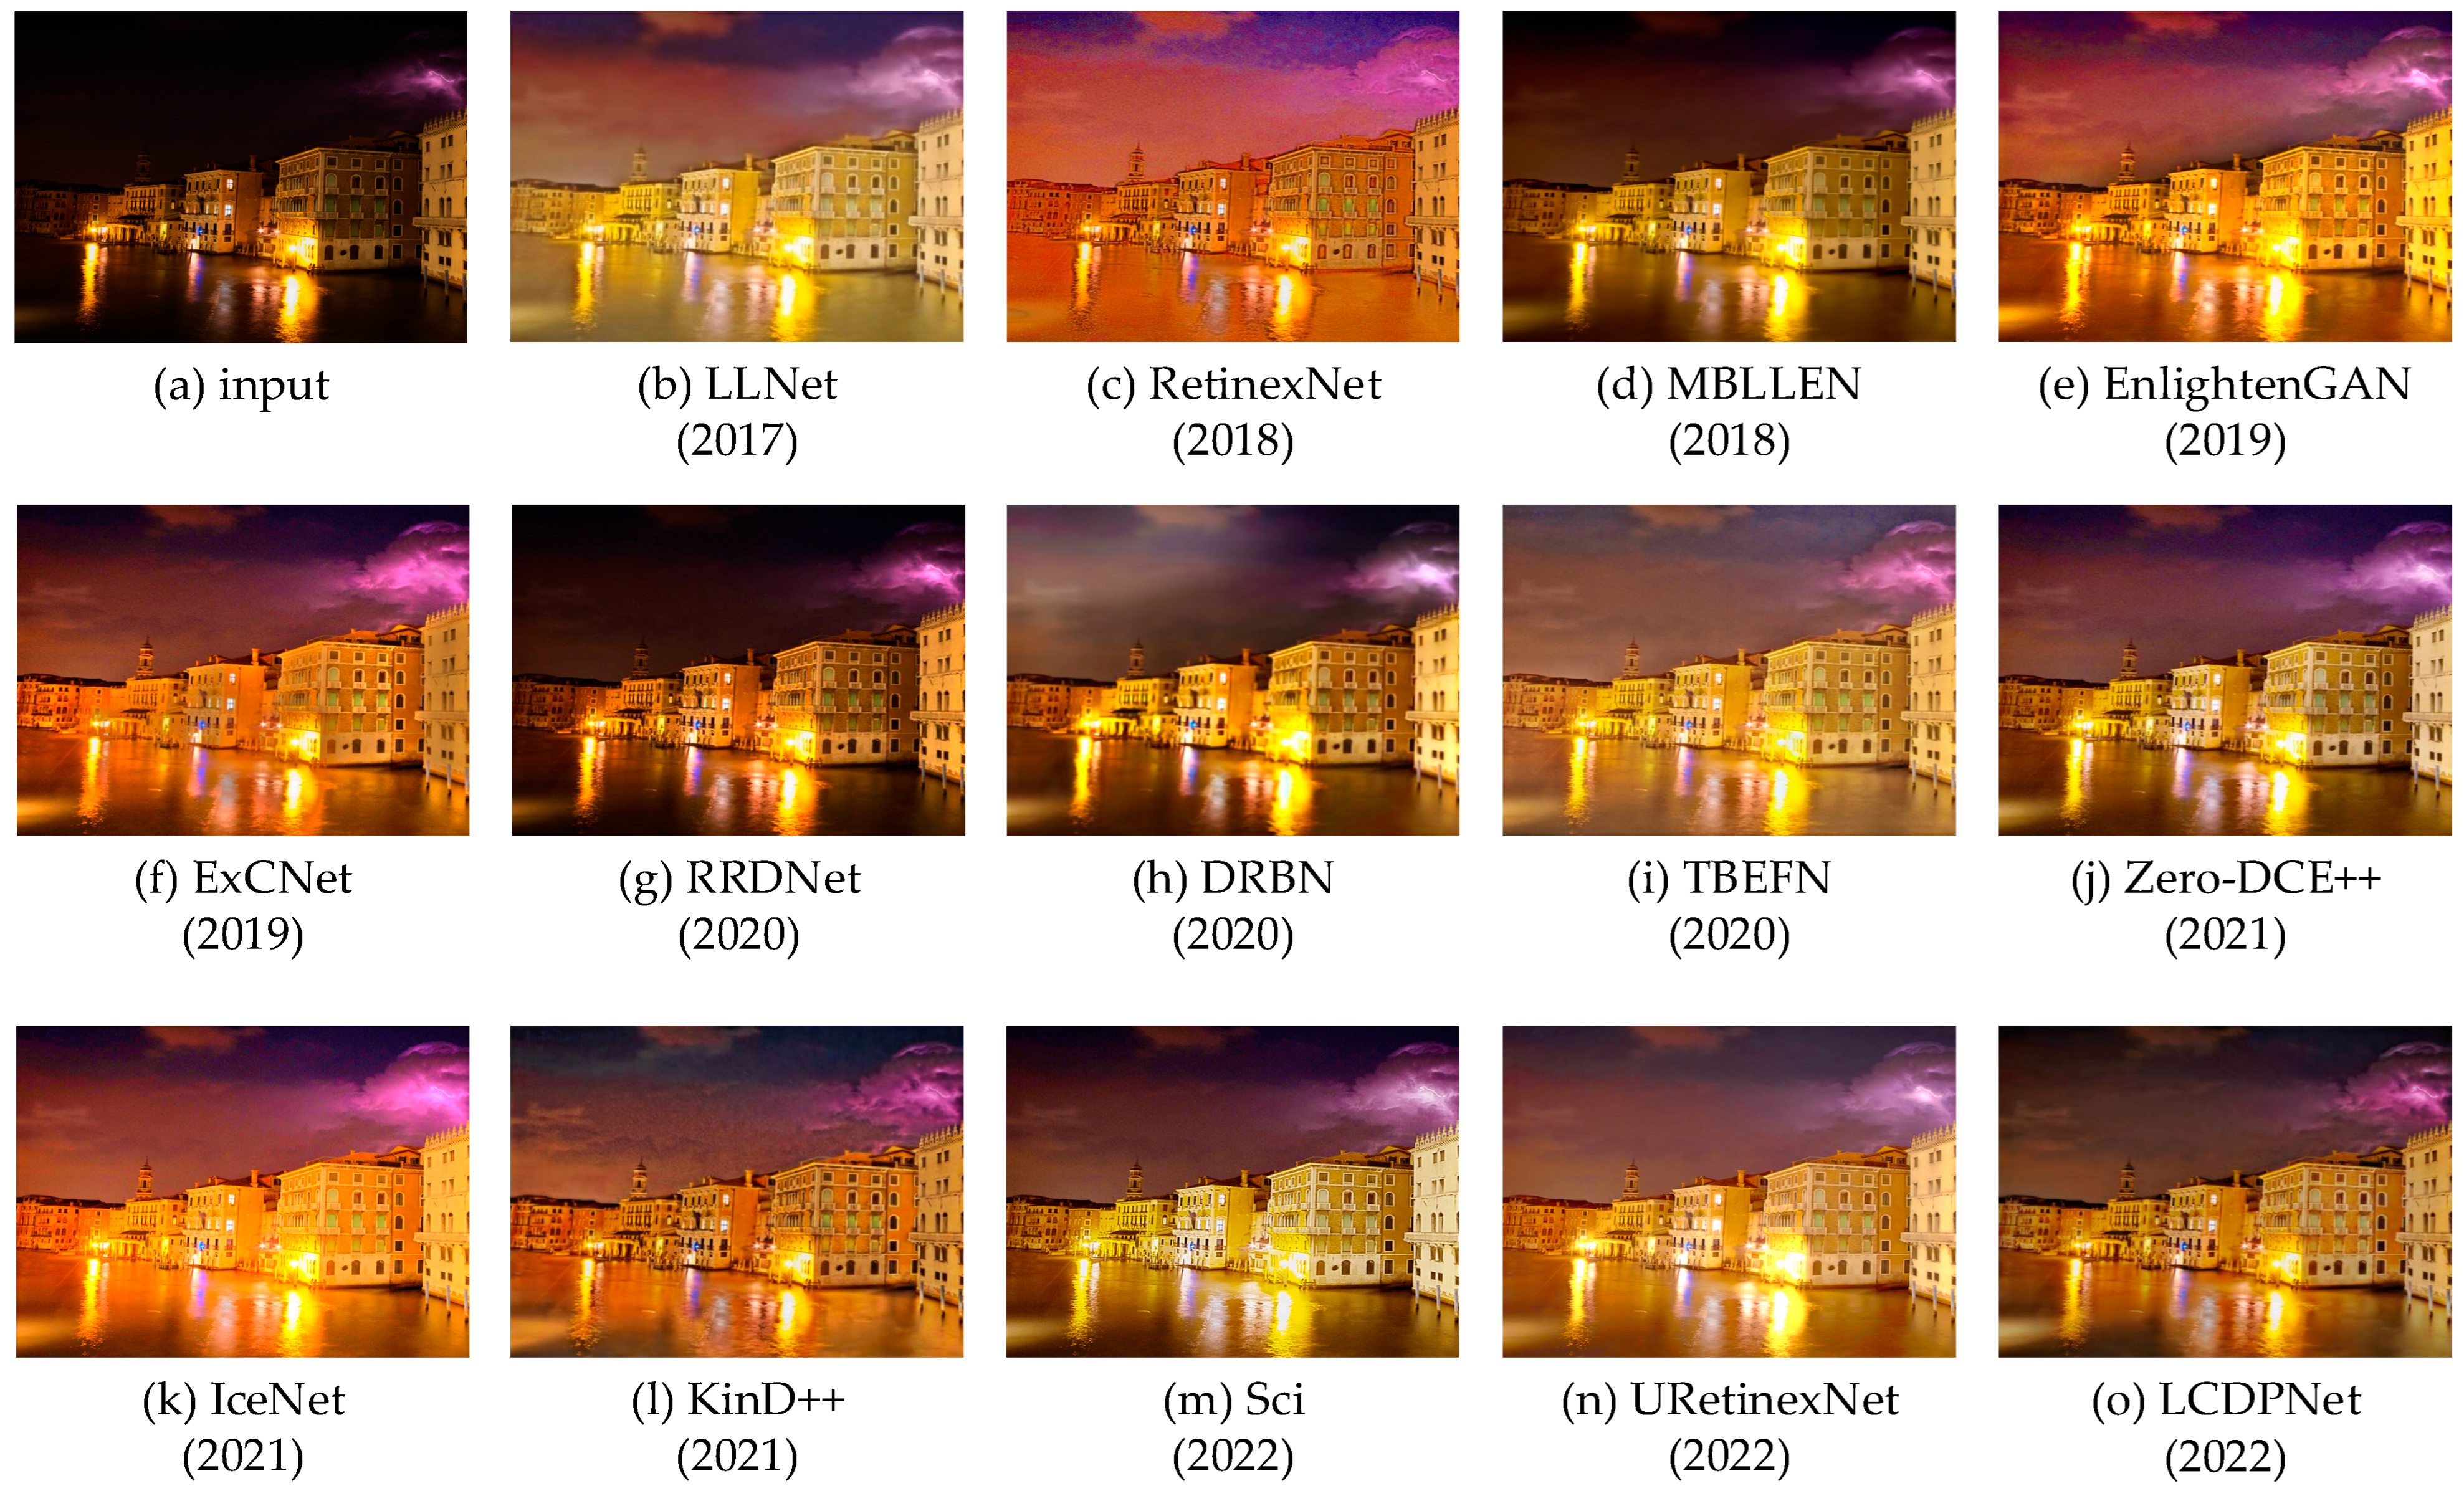
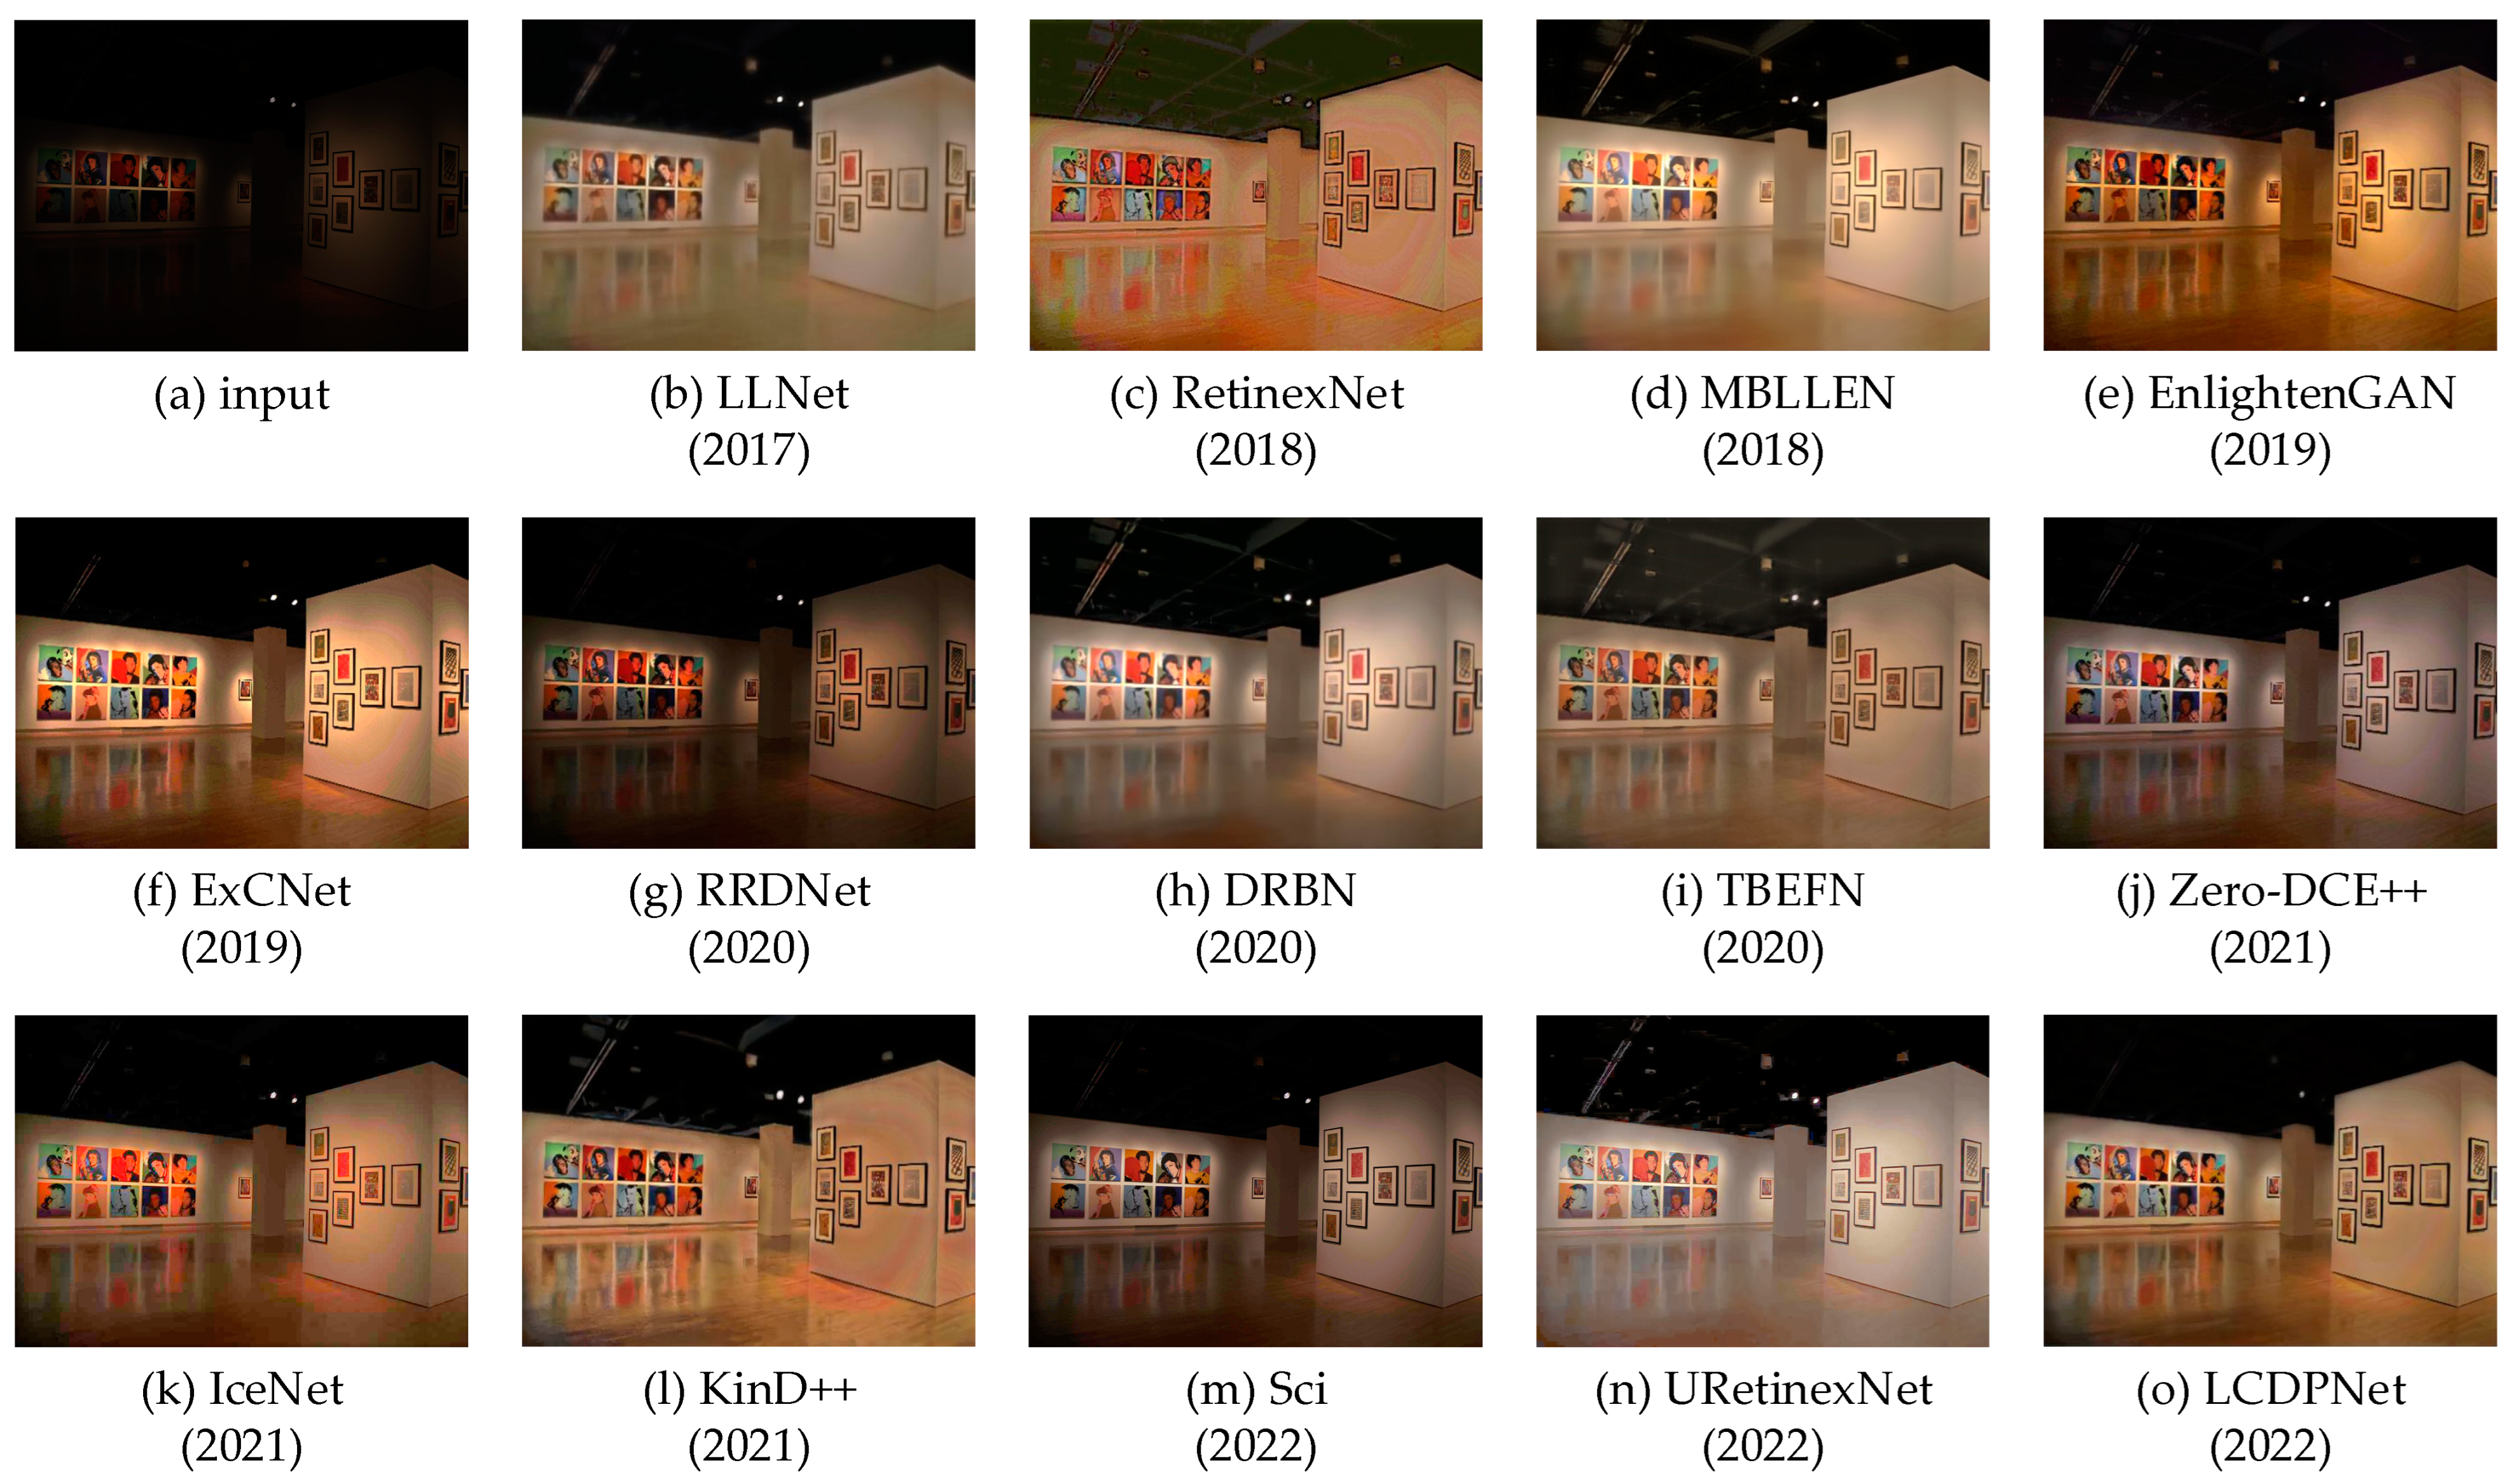
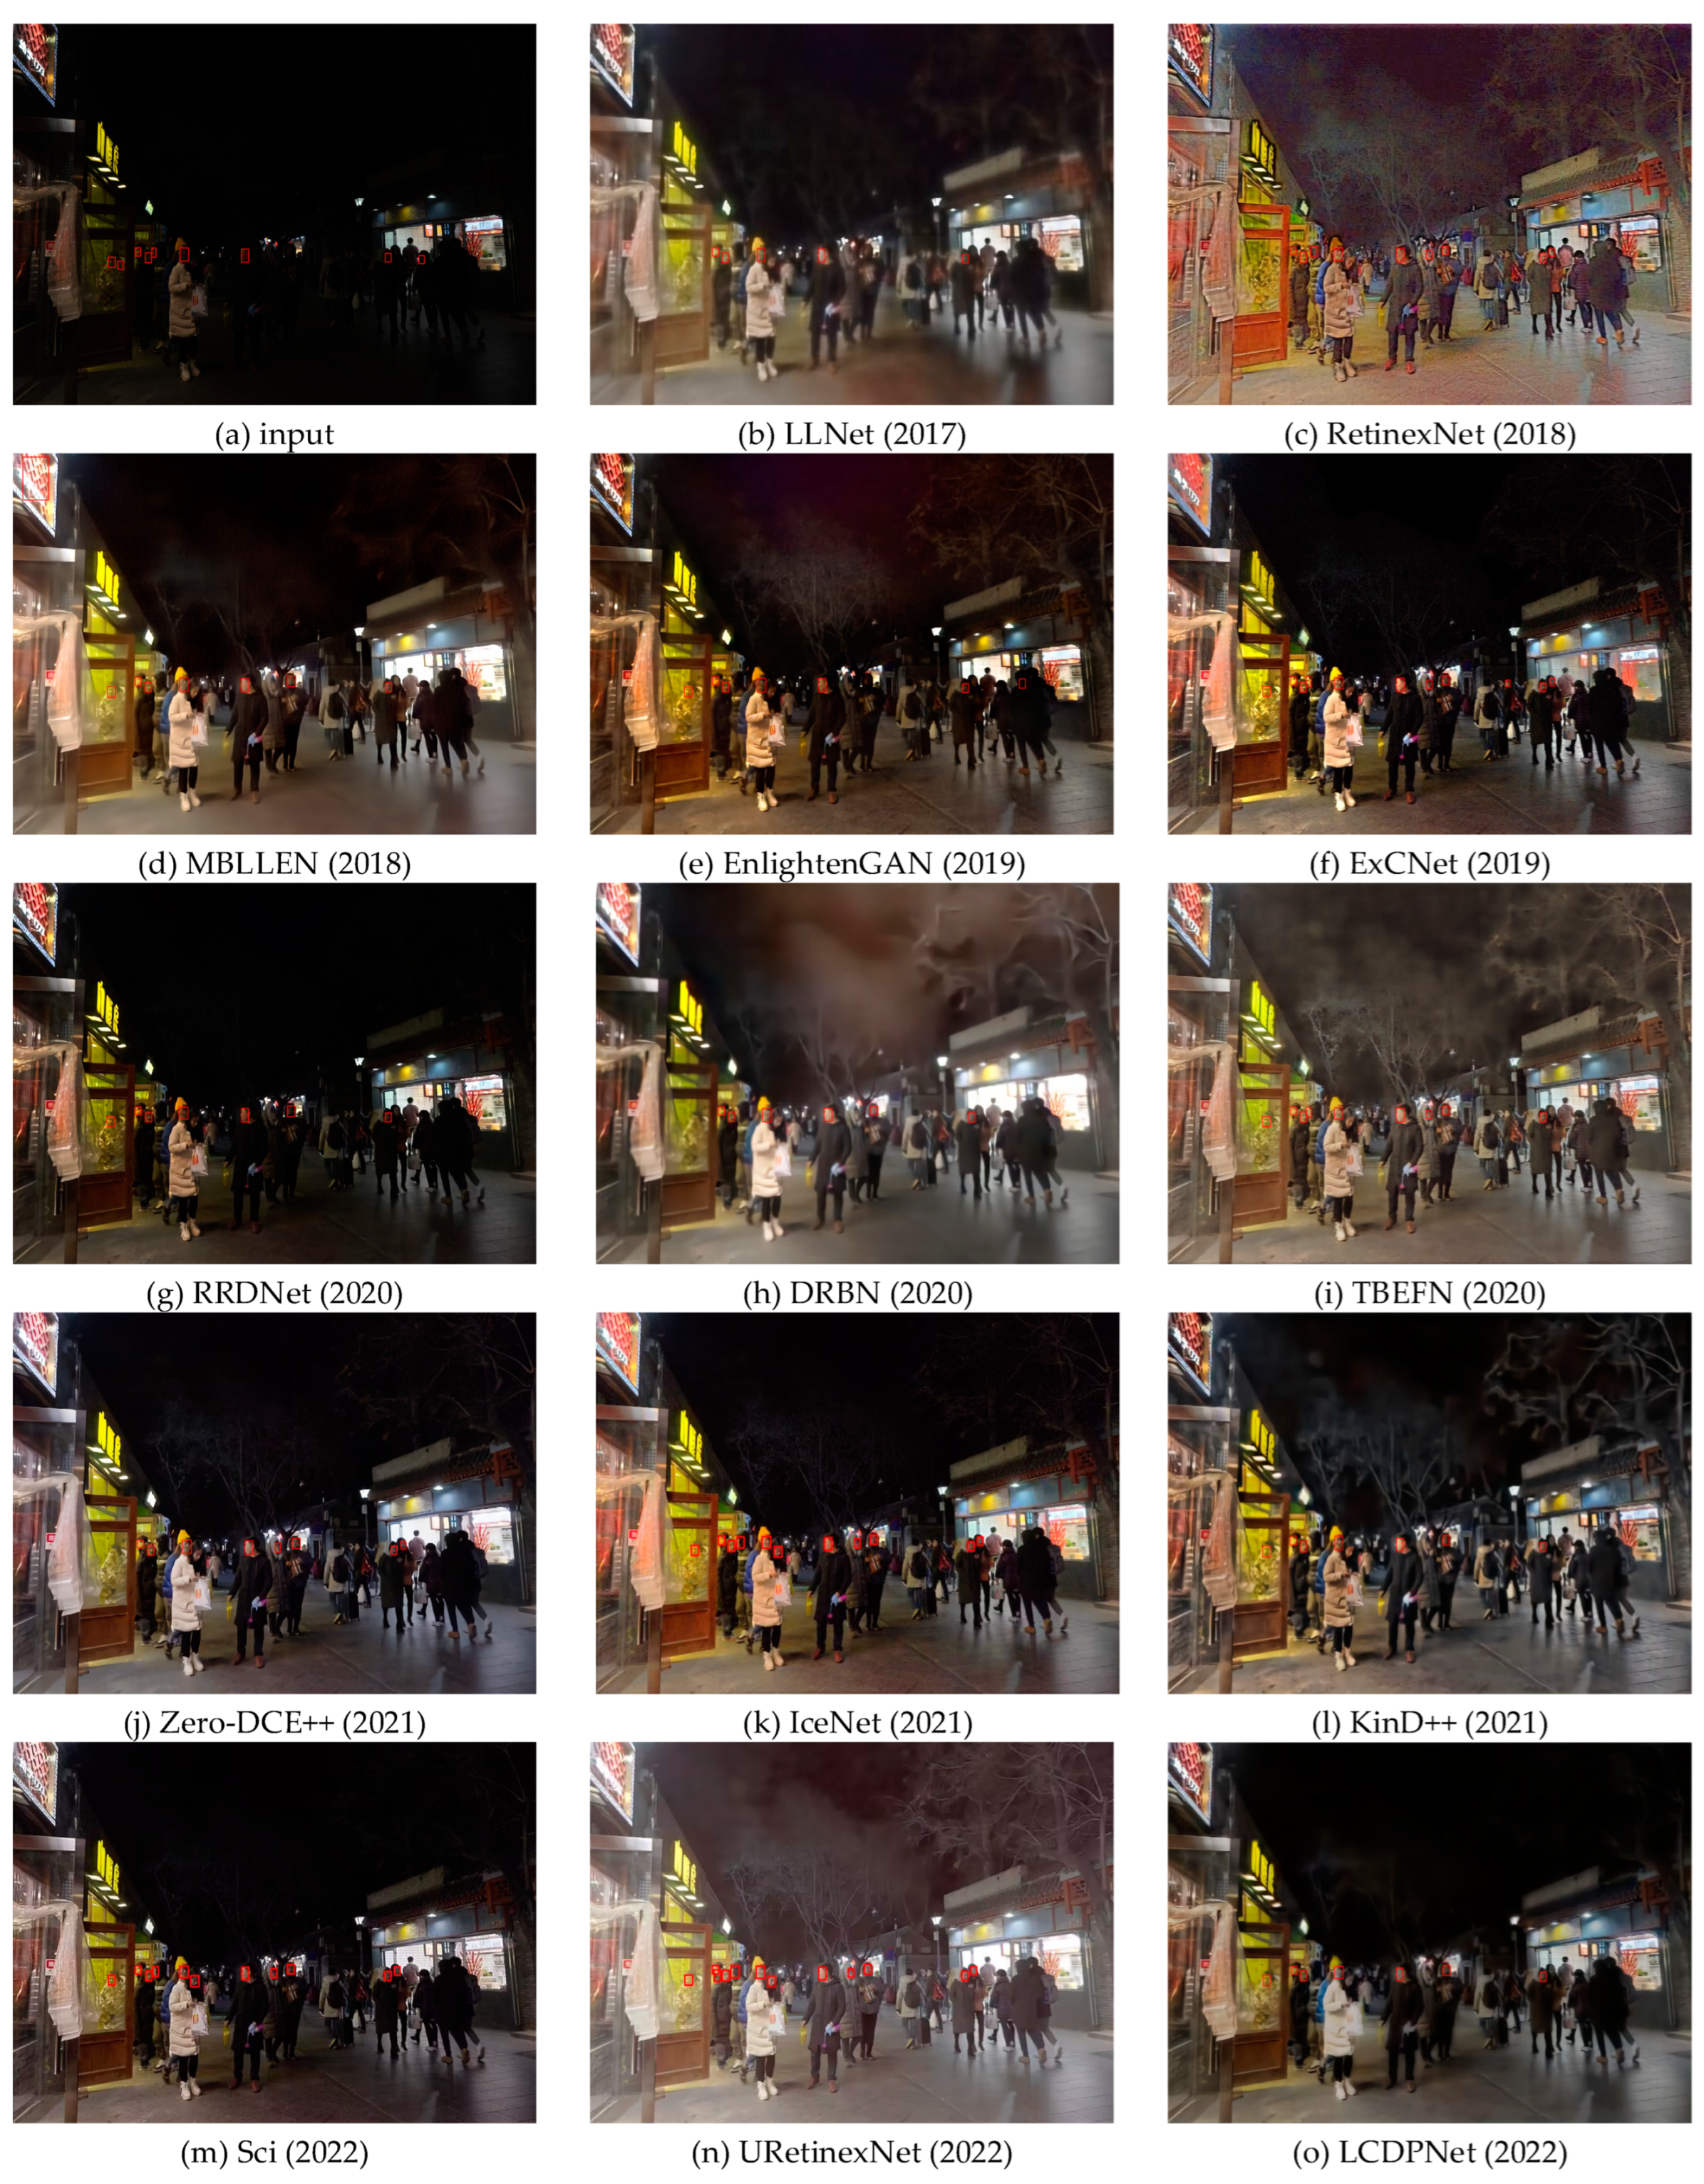
We applied the above 14 methods to demonstrate the enhancement effect of LIME, SCIE, LOL, and VE-LOL-L data sets, as shown in Figure 7, Figure 8, Figure 9 and Figure 10.
Figure 7 shows an enhanced rendering of the LIME data set. This image is an outdoor image. Some of the enhanced images have obvious color deviation, among which ExCNet and RetinexNet have the most serious color distortion. We also found that the RRDNet enhancement results in a low brightness increase compared to other methods. The figure, of course, in the light of the area in EnlightenGAN and URetinexNet method, there is the phenomenon of excessive exposure.
Figure 8 is an enhanced rendering of the SCIE data set, which is an indoor image. The image enhancement is not as noticeable on RRDNet, Zero-DCE++, and Sci. Moreover, the RetinexNet, ExCNet, IceNet, and KinD ++ all showed artifact phenomena, among which the image of RetinexNet is the most serious. URetinexNet has better visual effects than other methods.
Figure 9 is an enhanced rendering of the LOL dataset; the figure is an outdoor image. It is obvious EnlightenGAN and enhancing the image of MBLLEN leaves some color distortion that is serious. The former leaves yellow color, and the color is too bright. However, in the enhanced image obtained by LLNet and RetinexNet, the details are lost seriously, and the railings almost disappear in the image.
Figure 10 shows the enhanced effect of the VE-LOL-L data set, which is an indoor image. It is obvious that the lower left corner in Figure 10 is red, but the color presented by LLNet is more orange. Similarly, the color deviation of the desktop man in the image displayed by the RetinexNet is also large, and the overall color of the image is inconsistent. LLNet, RetinexNet, TBEFN, and KinD++ all produce a black aperture in the area of the light in the picture.
In general, the existing low-illumination image enhancement methods based on deep learning can effectively improve image brightness and contrast. But the visual effect is different. The existing methods still have a lot of room for improvement, such as how to eliminate the noise generated while improving the brightness, how to avoid the color distortion phenomenon, and so on. Some existing methods can solve one problem effectively but often ignore others.
5.2. Objective Analysis
As shown in Table 4, NIQE, IE, and LOE evaluation indexes were used to objectively evaluate the enhancement effects of 14 low illumination image enhancement methods based on deep learning on the LIME data set. Know from the table, in recent years, the method on the indicator can have a better result. The Sci in IE and LOE for indicators in the table to get the first three grades, EnlightenGAN on NIQE and IE performance is also good. The other five algorithms have their advantages by ranking the top three once each.
As shown in Table 5, Table 6 and Table 7, we used PSNR, SSIM, MSE, NIQE, IE, and LOE to objectively evaluate the enhancement results of 14 kinds of low-illumination images based on deep learning. Table 5 presents objective evaluations based on the SCIE dataset. As can be seen from the table, MBLLEN has a superior performance and achieved first place in PSNR, SSIM, MSE, and IE. URetinexNet did just as well. Table 6 is an objective evaluation based on the LOL dataset, which is the most widely used dataset. However, many use LOL data sets as training sets, but these algorithms have no advantage in testing. URetinexNet achieved excellent results in all reference indexes but not-so-good results in non-reference indexes. Table 7 is an objective evaluation based on the VE-LOL-L dataset, which is the latest large paired dataset. It can be seen from the table that LCDPNet has obvious advantages over other algorithms, but the distribution of other rankings is scattered.
In general, we can see from the above four tables that all the methods have a good improvement on the original indicators relative to the input image. Meanwhile, it is found that the supervised learning-based method has significantly better scores on the objective evaluation indicators than the methods based on unsupervised learning, semi-supervised learning, and zero-shot learning. Similarly, we found that the RRDNet method achieved the best performance in the LOE evaluation index of the four data sets, while KinD++ scored the worst. However, based on the visual representations in Figure 7, Figure 8, Figure 9 and Figure 10, the RRDNet enhancement is insignificant, and the brightness enhancement is low. In comparison, the Kindle ++ enhancement effect is relatively good. Therefore, we feel that the LOE index does not apply to low-illumination image enhancement. Similarly, we found that in the NIQE index, ICENet has obvious disadvantages, but in terms of visual effects, this method is significantly improved by methods, such as RetinexNet and RRDNet. Therefore, we feel that most of the non-reference indicators may not apply to the field of low-illumination image enhancement.
5.3. Low-Illumination Face Detection Performance
To better reflect the influence of low-illumination images on high-level visual tasks, we adopted the DSFD [102] method to carry out a low-illumination face detection experiment on the DarkFace data set using the above 14 methods, as shown in Figure 11. It can be seen from the figure that all low-illumination image enhancement methods based on deep learning effectively improve the accuracy of face detection. We also conducted a quantitative analysis of the effect of each enhanced image, as shown in Figure 12. As can be seen from it, the number of error detections after enhancement is less than that before enhancement, while the number of correct detections is generally increased. Moreover, compared with earlier methods, the number of correct detections predicted by recent ones has improved more significantly. The number of missed detections and the number of correct detections trend is opposite. In recent years, the number of missed detections has been less. The logarithmic trend line in Figure 12 also effectively illustrates that this year's method has better results for advanced visual tasks. It also shows that these methods can help high-level visual tasks.
5.4. Time Complexity
In Table 8, we compare the computational complexity of the 14 algorithms by the average running time of image enhancement in the VE-LOL-H dataset. We can see that the running time of the gap between all kinds of methods in Table 8 is more significant. More specifically, EnlightenGAN achieves the fastest speed, and RRDNet runs the slowest. Although most of the ways can run within 1 s, it is still challenging to accomplish the anticipation of real-time video processing.
5.5. Summary
It is not difficult to see that the values of objective evaluation indices of test images in LOL and VE-LOL-L datasets are more suitable for human visual effects than those in SCIE and LIME datasets. It can also be seen that the algorithm trained with pairwise data sets will get a more obvious enhancement effect. We can see from the data that the method based on supervised learning can achieve better results compared with other methods. Still, unsupervised learning, zero-shot learning, and semi-supervised learning are the current development trends, mainly because it is difficult to obtain paired images in a low-illumination environment. The method based on fully supervised learning has lower generalization ability and poor applicability compared with other methods. Moreover, the unsupervised learning method can introduce more prior knowledge reflecting environment characteristics by designing proper loss functions and network structures. The enhancement algorithm with a better subjective visual effect has not achieved good results in the objective evaluation, which is precisely where the aim evaluation index needs to be improved.
6. Conclusions
This paper summarizes the low-illumination image enhancement algorithms based on deep learning and introduces the representative algorithms from four classifications. Then, we present the existing image datasets, point out the shortcomings, and show the current subjective and objective evaluation indicators. We offer the enhancement results from 14 typical algorithms and analyze them in detail to further reveal the advantages and disadvantages of each algorithm. Here is the summary:
- (1)
- Most of the existing low-illumination image datasets are single images in the natural environment, and the number of paired image datasets with reference is small. The low illuminance/standard light image pairs composed by the synthetic method often have deviations. Still, artificial labels often fail to avoid the influence of physical factors; the brands are inaccurate, and so on. The existing data sets are not suitable for high-level visual tasks and often fail to meet the requirements of high-level visual tasks. They often fail to meet the requirements of high-level visual tasks. Therefore, enhancing the low-illumination image dataset is also a direction of future research.
- (2)
- The existing objective evaluation indicators are used in other research fields, such as image fog removal, rain removal, noise reduction, etc. These metrics are not designed for low-light image enhancement, and these evaluation metrics are far from achieving the natural perception effect of human beings. The quality of objective indicators is often different from the evaluation of human eyes, so it is urgent to design objective evaluation indicators for low-illumination image enhancement.
- (3)
- From a series of algorithm effects, it can be seen that the algorithms with fusion and model framework often have better generalization ability, and the unsupervised learning methods are more robust and stable than the supervised learning methods. However, the purpose of low-illumination image enhancement algorithms is to prepare for higher-level visual tasks. Hence, the current research aims to make universal low-illumination image enhancement algorithms that can serve higher-level visual tasks.
- (4)
- Low-illumination video enhancement is a method to decompose the video into frames, enhance the decomposed image, and then fuse it. However, it is difficult for various algorithms to achieve the speed of 30 frames per second. How to speed up the algorithms without weakening the enhancement effect still needs further research.
In conclusion, deep-learning-based low-illumination image enhancement algorithms can hardly achieve the optimal level in terms of brightness enhancement, noise reduction, and contrast enhancement simultaneously. Therefore, we need to choose the optimal method for practical application. Of course, it is hoped that through the research on the existing low-illumination image enhancement methods based on deep learning, the study on the direction of modification can be improved to a higher level so that it can play a more critical role in high-level visual tasks.
Author Contributions
Conceptualization, H.T. and C.X.; methodology, H.T.; software, H.T.; validation, H.Z.; formal analysis, L.F.; investigation, T.W.; resources, C.X.; data curation, Y.C.; writing—original draft preparation, H.T.; writing—review and editing, C.X.; visualization, H.T.; supervision, C.X.; project administration, C.X.; funding acquisition, C.X. All authors have read and agreed to the published version of the manuscript.
Funding
This research was funded in part by the National Natural Science Foundation of China under Grant 61901221, in part by the Postgraduate Research & Practice Innovation Program of Jiangsu Province under Grant KYCX21_0872, in part by the Nanjing Forestry University 2022 College Student Practice & Innovation Training Program under Grant 2022NFUSPITP0079, and in part by the National Key Research and Development Program of China under Grant 2019YFD1100404.
Institutional Review Board Statement
Not applicable.
Informed Consent Statement
Not applicable.
Data Availability Statement
The data presented in this study are openly available at https://github.com/csjcai/SICE, https://ieeexplore.ieee.org/abstract/document/7782813, https://daooshee.github.io/BMVC2018website/, https://flyywh.github.io/IJCV2021LowLight_VELOL/, accessed on 15 January 2018, 14 December 2016, 10 August 2018, and 11 January 2021, respectively.
Conflicts of Interest
The authors declare no conflict of interest.
References
- Ackar, H.; Abd Almisreb, A.; Saleh, M.A. A review on image enhancement techniques. Southeast Eur. J. Soft Comput. 2019, 8, 42–48. [Google Scholar] [CrossRef]
- Fang, M.; Li, H.; Lei, L. A review on low light video image enhancement algorithms. J. Chang. Univ. Sci. Technol. 2016, 39, 56–64. [Google Scholar]
- Yan, X.; Liu, T.; Fu, M.; Ye, M.; Jia, M. Bearing Fault Feature Extraction Method Based on Enhanced Differential Product Weighted Morphological Filtering. Sensors 2022, 22, 6184. [Google Scholar] [CrossRef]
- Wang, W.; Yuan, X.; Wu, X.; Liu, Y. Fast image dehazing method based on linear transformation. IEEE Trans. Multimed. 2017, 19, 1142–1155. [Google Scholar] [CrossRef]
- Yu, J.; Li, D.-p.; Liao, Q.-m. Color constancy-based visibility enhancement of color images in low-light conditions. Acta Autom. Sin. 2011, 37, 923–931. [Google Scholar]
- Sun, Y.; Li, M.; Dong, R.; Chen, W.; Jiang, D. Vision-Based Detection of Bolt Loosening Using YOLOv5. Sensors 2022, 22, 5184. [Google Scholar] [CrossRef] [PubMed]
- Yan, X.; Jia, M. Bearing fault diagnosis via a parameter-optimized feature mode decomposition. Measurement 2022, 203, 112016. [Google Scholar] [CrossRef]
- Wang, Y.-F.; Liu, H.-M.; Fu, Z.-W. Low-light image enhancement via the absorption light scattering model. IEEE Trans. Image Process. 2019, 28, 5679–5690. [Google Scholar] [CrossRef]
- Xu, Y.; Liu, J.; Wan, Z.; Zhang, D.; Jiang, D. Rotor Fault Diagnosis Using Domain-Adversarial Neural Network with Time-Frequency Analysis. Machines 2022, 10, 610. [Google Scholar] [CrossRef]
- Li, W.; Zhu, D.; Shao, W.; Jiang, D. Modeling of Internal Geometric Variability and Statistical Property Prediction of Braided Composites. Materials 2022, 15, 5332. [Google Scholar] [CrossRef]
- Abdullah-Al-Wadud, M.; Kabir, M.H.; Dewan, M.A.A.; Chae, O. A dynamic histogram equalization for image contrast enhancement. IEEE Trans. Consum. Electron. 2007, 53, 593–600. [Google Scholar] [CrossRef]
- Yang, Y.; Zhuang, Z.; Yu, Y. Defect removal and rearrangement of wood board based on genetic algorithm. Forests 2021, 13, 26. [Google Scholar] [CrossRef]
- Zhou, H.; Liu, Y.; Liu, Z.; Zhuang, Z.; Wang, X.; Gou, B. Crack Detection Method for Engineered Bamboo Based on Super-Resolution Reconstruction and Generative Adversarial Network. Forests 2022, 13, 1896. [Google Scholar] [CrossRef]
- Stark, J.A. Adaptive image contrast enhancement using generalizations of histogram equalization. IEEE Trans. Image Process. 2000, 9, 889–896. [Google Scholar] [CrossRef]
- Land, E.H.; McCann, J.J. Lightness and retinex theory. Josa 1971, 61, 1–11. [Google Scholar] [CrossRef]
- Liu, J.; Xu, D.; Yang, W.; Fan, M.; Huang, H. Benchmarking low-light image enhancement and beyond. Int. J. Comput. Vis. 2021, 129, 1153–1184. [Google Scholar] [CrossRef]
- Dai, Q.; Pu, Y.-F.; Rahman, Z.; Aamir, M. Fractional-order fusion model for low-light image enhancement. Symmetry 2019, 11, 574. [Google Scholar] [CrossRef]
- Ma, R.; Zhang, S. An improved color image defogging algorithm using dark channel model and enhancing saturation. Optik 2019, 180, 997–1000. [Google Scholar] [CrossRef]
- Lore, K.G.; Akintayo, A.; Sarkar, S. LLNet: A deep autoencoder approach to natural low-light image enhancement. Pattern Recognit. 2017, 61, 650–662. [Google Scholar] [CrossRef]
- Shen, L.; Yue, Z.; Feng, F.; Chen, Q.; Liu, S.; Ma, J. Msr-net: Low-light image enhancement using deep convolutional network. arXiv 2017, arXiv:1711.02488. [Google Scholar]
- Tao, L.; Zhu, C.; Xiang, G.; Li, Y.; Jia, H.; Xie, X. LLCNN: A convolutional neural network for low-light image enhancement. In Proceedings of the the 2017 IEEE Visual Communications and Image Processing (VCIP), St. Petersburg, FL, USA, 10–13 December 2017; pp. 1–4. [Google Scholar]
- Lv, F.; Lu, F.; Wu, J.; Lim, C. MBLLEN: Low-Light Image/Video Enhancement Using CNNs. In Proceedings of the the BMVC, Newcastle, UK, 3–6 September 2018; p. 4. [Google Scholar]
- Cai, J.; Gu, S.; Zhang, L. Learning a deep single image contrast enhancer from multi-exposure images. IEEE Trans. Image Process. 2018, 27, 2049–2062. [Google Scholar] [CrossRef] [PubMed]
- Wei, C.; Wang, W.; Yang, W.; Liu, J. Deep retinex decomposition for low-light enhancement. arXiv 2018, arXiv:1808.04560. [Google Scholar]
- Yu, R.; Liu, W.; Zhang, Y.; Qu, Z.; Zhao, D.; Zhang, B. Deepexposure: Learning to expose photos with asynchronously reinforced adversarial learning. Adv. Neural Inf. Process. Syst. 2018, 31. [Google Scholar]
- Chen, C.; Chen, Q.; Xu, J.; Koltun, V. Learning to see in the dark. In Proceedings of the IEEE Conference on Computer Vision and Pattern Recognition, Salt Lake City, UT, USA, 18–23 June 2018; pp. 3291–3300. [Google Scholar]
- Robert, T.; Thome, N.; Cord, M. HybridNet: Classification and Reconstruction Cooperation for Semi-supervised Learning. In Proceedings of the 15th European Conference on Computer Vision (ECCV), Munich, Germany, 8–14 September 2018; pp. 158–175. [Google Scholar]
- Jiang, Y.; Gong, X.; Liu, D.; Cheng, Y.; Fang, C.; Shen, X.; Yang, J.; Zhou, P.; Wang, Z. Enlightengan: Deep light enhancement without paired supervision. IEEE Trans. Image Process. 2021, 30, 2340–2349. [Google Scholar] [CrossRef]
- Zhang, Y.; Zhang, J.; Guo, X. Kindling the darkness: A practical low-light image enhancer. In Proceedings of the 27th ACM International Conference on Multimedia, Nice, France, 21–25 October 2019; pp. 1632–1640. [Google Scholar]
- Zhang, Y.; Guo, X.; Ma, J.; Liu, W.; Zhang, J. Beyond brightening low-light images. Int. J. Comput. Vis. 2021, 129, 1013–1037. [Google Scholar] [CrossRef]
- Wang, R.; Zhang, Q.; Fu, C.-W.; Shen, X.; Zheng, W.-S.; Jia, J. Underexposed photo enhancement using deep illumination estimation. In Proceedings of the IEEE/CVF Conference on Computer Vision and Pattern Recognition, Long Beach, CA, USA, 15–20 June 2019; pp. 6849–6857. [Google Scholar]
- Jiang, H.; Zheng, Y. Learning to see moving objects in the dark. In Proceedings of the IEEE/CVF International Conference on Computer Vision, Seoul, Korea, 27 October–2 November 2019; pp. 7324–7333. [Google Scholar]
- Zhang, L.; Zhang, L.; Liu, X.; Shen, Y.; Zhang, S.; Zhao, S. Zero-shot restoration of back-lit images using deep internal learning. In Proceedings of the 27th ACM International Conference on Multimedia, Nice, France, 21–25 October 2019; pp. 1623–1631. [Google Scholar]
- Zhu, M.; Pan, P.; Chen, W.; Yang, Y. Eemefn: Low-light image enhancement via edge-enhanced multi-exposure fusion network. In Proceedings of the AAAI Conference on Artificial Intelligence, New York, NY, USA, 7–12 February 2020; pp. 13106–13113. [Google Scholar]
- Guo, C.; Li, C.; Guo, J.; Loy, C.C.; Hou, J.; Kwong, S.; Cong, R. Zero-reference deep curve estimation for low-light image enhancement. In Proceedings of the IEEE/CVF Conference on Computer Vision and Pattern Recognition, Seattle, WA, USA, 12–16 October 2020; pp. 1780–1789. [Google Scholar]
- Fan, M.; Wang, W.; Yang, W.; Liu, J. Integrating semantic segmentation and retinex model for low-light image enhancement. In Proceedings of the 28th ACM International Conference on Multimedia, Seattle, WA, USA, 12–16 October 2020; pp. 2317–2325. [Google Scholar]
- Lu, K.; Zhang, L. TBEFN: A two-branch exposure-fusion network for low-light image enhancement. IEEE Trans. Multimed. 2020, 23, 4093–4105. [Google Scholar] [CrossRef]
- Wang, L.-W.; Liu, Z.-S.; Siu, W.-C.; Lun, D.P. Lightening network for low-light image enhancement. IEEE Trans. Image Process. 2020, 29, 7984–7996. [Google Scholar] [CrossRef]
- Zhu, A.; Zhang, L.; Shen, Y.; Ma, Y.; Zhao, S.; Zhou, Y. Zero-shot restoration of underexposed images via robust retinex decomposition. In Proceedings of the 2020 IEEE International Conference on Multimedia and Expo (ICME), London, UK, 6–10 July 2020; pp. 1–6. [Google Scholar]
- Munir, F.; Azam, S.; Jeon, M. LDNet: End-to-End Lane Detection Approach usinga Dynamic Vision Sensor. arXiv 2020, arXiv:2009.08020. [Google Scholar] [CrossRef]
- Lim, S.; Kim, W. DSLR: Deep stacked Laplacian restorer for low-light image enhancement. IEEE Trans. Multimed. 2020, 23, 4272–4284. [Google Scholar] [CrossRef]
- Hai, J.; Xuan, Z.; Yang, R.; Hao, Y.; Zou, F.; Lin, F.; Han, S. R2rnet: Low-light image enhancement via real-low to real-normal network. arXiv 2021, arXiv:2106.14501. [Google Scholar] [CrossRef]
- Li, J.; Feng, X.; Hua, Z. Low-light image enhancement via progressive-recursive network. IEEE Trans. Circuits Syst. Video Technol. 2021, 31, 4227–4240. [Google Scholar] [CrossRef]
- Qiao, Z.; Xu, W.; Sun, L.; Qiu, S.; Guo, H. Deep Semi-Supervised Learning for Low-Light Image Enhancement. In Proceedings of the 2021 14th International Congress on Image and Signal Processing, BioMedical Engineering and Informatics (CISP-BMEI), Shanghai, China, 23–25 October 2021; pp. 1–6. [Google Scholar]
- Wei, X.; Zhang, X.; Li, Y. Tsn-ca: A two-stage network with channel attention for low-light image enhancement. In Proceedings of the International Conference on Artificial Neural Networks, Beijing, China, 5–7 November 2022; pp. 286–298. [Google Scholar]
- Wei, X.; Zhang, X.; Wang, S.; Cheng, C.; Huang, Y.; Yang, K.; Li, Y. BLNet: A Fast Deep Learning Framework for Low-Light Image Enhancement with Noise Removal and Color Restoration. arXiv 2021, arXiv:2106.15953. [Google Scholar]
- Zhao, Z.; Xiong, B.; Wang, L.; Ou, Q.; Yu, L.; Kuang, F. Retinexdip: A unified deep framework for low-light image enhancement. IEEE Trans. Circuits Syst. Video Technol. 2021, 32, 1076–1088. [Google Scholar] [CrossRef]
- Liu, R.; Ma, L.; Zhang, J.; Fan, X.; Luo, Z. Retinex-inspired unrolling with cooperative prior architecture search for low-light image enhancement. In Proceedings of the IEEE/CVF Conference on Computer Vision and Pattern Recognition, Montreal, BC, Canada, 20–25 June 2021; pp. 10561–10570. [Google Scholar]
- Yang, W.; Wang, W.; Huang, H.; Wang, S.; Liu, J. Sparse gradient regularized deep retinex network for robust low-light image enhancement. IEEE Trans. Image Process. 2021, 30, 2072–2086. [Google Scholar] [CrossRef]
- Li, C.; Guo, C.; Loy, C.C. Learning to enhance low-light image via zero-reference deep curve estimation. arXiv 2021, arXiv:2103.00860. [Google Scholar] [CrossRef]
- Zheng, C.; Shi, D.; Shi, W. Adaptive Unfolding Total Variation Network for Low-Light Image Enhancement. In Proceedings of the IEEE/CVF International Conference on Computer Vision, Montreal, BC, Canada, 11–17 October 2021; pp. 4439–4448. [Google Scholar]
- Zhang, F.; Li, Y.; You, S.; Fu, Y. Learning temporal consistency for low light video enhancement from single images. In Proceedings of the IEEE/CVF Conference on Computer Vision and Pattern Recognition, Montreal, BC, Canada, 20–25 June 2021; pp. 4967–4976. [Google Scholar]
- Sharma, A.; Tan, R.T. Nighttime visibility enhancement by increasing the dynamic range and suppression of light effects. In Proceedings of the IEEE/CVF Conference on Computer Vision and Pattern Recognition, Montreal, BC, Canada, 20–25 June 2021; pp. 11977–11986. [Google Scholar]
- Wu, W.; Weng, J.; Zhang, P.; Wang, X.; Yang, W.; Jiang, J. URetinex-Net: Retinex-Based Deep Unfolding Network for Low-Light Image Enhancement. In Proceedings of the IEEE/CVF Conference on Computer Vision and Pattern Recognition, New Orleans, LA, USA, 19–20 June 2022; pp. 5901–5910. [Google Scholar]
- Tu, Z.; Talebi, H.; Zhang, H.; Yang, F.; Milanfar, P.; Bovik, A.; Li, Y. Maxim: Multi-axis mlp for image processing. In Proceedings of the IEEE/CVF Conference on Computer Vision and Pattern Recognition, New Orleans, LA, USA, 19–20 June 2022; pp. 5769–5780. [Google Scholar]
- Fan, C.-M.; Liu, T.-J.; Liu, K.-H. Half Wavelet Attention on M-Net+ for Low-Light Image Enhancement. arXiv 2022, arXiv:2203.01296. [Google Scholar]
- Dong, X.; Xu, W.; Miao, Z.; Ma, L.; Zhang, C.; Yang, J.; Jin, Z.; Teoh, A.B.J.; Shen, J. Abandoning the Bayer-Filter To See in the Dark. In Proceedings of the IEEE/CVF Conference on Computer Vision and Pattern Recognition, New Orleans, LA, USA, 19–20 June 2022; pp. 17431–17440. [Google Scholar]
- Zheng, D.; Zhang, X.; Ma, K.; Bao, C. Learn from Unpaired Data for Image Restoration: A Variational Bayes Approach. arXiv 2022, arXiv:2204.10090. [Google Scholar] [CrossRef] [PubMed]
- Ma, L.; Ma, T.; Liu, R.; Fan, X.; Luo, Z. Toward Fast, Flexible, and Robust Low-Light Image Enhancement. In Proceedings of the IEEE/CVF Conference on Computer Vision and Pattern Recognition, New Orleans, LA, USA, 19–20 June 2022; pp. 5637–5646. [Google Scholar]
- Cotogni, M.; Cusano, C. TreEnhance: A Tree Search Method For Low-Light Image Enhancement. Pattern Recognit. 2022, 136, 109249. [Google Scholar] [CrossRef]
- Liang, J.; Xu, Y.; Quan, Y.; Shi, B.; Ji, H. Self-Supervised Low-Light Image Enhancement Using Discrepant Untrained Network Priors. IEEE Trans. Circuits Syst. Video Technol. 2022, 32, 7332–7345. [Google Scholar] [CrossRef]
- Jin, Y.; Yang, W.; Tan, R.T. Unsupervised night image enhancement: When layer decomposition meets light-effects suppression. In Proceedings of the European Conference on Computer Vision, Tel Aviv, Israel, 24–28 October 2022; pp. 404–421. [Google Scholar]
- Wang, H.; Xu, K.; Lau, R.W. Local color distributions prior for image enhancement. In Proceedings of the European Conference on Computer Vision, Tel Aviv, Israel, 24–28 October 2022; pp. 343–359. [Google Scholar]
- Wang, T.; Zhang, K.; Shen, T.; Luo, W.; Stenger, B.; Lu, T. Ultra-High-Definition Low-Light Image Enhancement: A Benchmark and Transformer-Based Method. arXiv 2022, arXiv:2212.11548. [Google Scholar]
- Xu, X.; Wang, R.; Fu, C.-W.; Jia, J. SNR-Aware Low-Light Image Enhancement. In Proceedings of the IEEE/CVF Conference on Computer Vision and Pattern Recognition, New Orleans, LA, USA, 19–20 June 2022; pp. 17714–17724. [Google Scholar]
- Wang, W.; Wei, C.; Yang, W.; Liu, J. Gladnet: Low-light enhancement network with global awareness. In Proceedings of the 2018 13th IEEE International Conference on Automatic Face & Gesture Recognition (FG 2018), Xi’an, China, 15–19 May 2018; pp. 751–755. [Google Scholar]
- Ravirathinam, P.; Goel, D.; Ranjani, J.J. C-LIENet: A multi-context low-light image enhancement network. IEEE Access 2021, 9, 31053–31064. [Google Scholar] [CrossRef]
- Cui, Z.; Li, K.; Gu, L.; Su, S.; Gao, P.; Jiang, Z.; Qiao, Y.; Harada, T. Illumination Adaptive Transformer. arXiv 2022, arXiv:2205.14871. [Google Scholar]
- Carion, N.; Massa, F.; Synnaeve, G.; Usunier, N.; Kirillov, A.; Zagoruyko, S. End-to-end object detection with transformers. In Proceedings of the Computer Vision–ECCV 2020: 16th European Conference, Glasgow, UK, 23–28 August 2020; Proceedings, Part I 16. pp. 213–229. [Google Scholar]
- Fu, Y.; Hong, Y.; Chen, L.; You, S. LE-GAN: Unsupervised low-light image enhancement network using attention module and identity invariant loss. Knowl. -Based Syst. 2022, 240, 108010. [Google Scholar] [CrossRef]
- Ni, Z.; Yang, W.; Wang, S.; Ma, L.; Kwong, S. Towards unsupervised deep image enhancement with generative adversarial network. IEEE Trans. Image Process. 2020, 29, 9140–9151. [Google Scholar] [CrossRef] [PubMed]
- Zhang, F.; Shao, Y.; Sun, Y.; Zhu, K.; Gao, C.; Sang, N. Unsupervised low-light image enhancement via histogram equalization prior. arXiv 2021, arXiv:2112.01766. [Google Scholar]
- Kaufman, L.; Lischinski, D.; Werman, M. Content-Aware Automatic Photo Enhancement. In Proceedings of the Computer Graphics Forum, Reims, France, 25–29 April 2022; pp. 2528–2540. [Google Scholar]
- Lee, C.; Lee, C.; Lee, Y.-Y.; Kim, C.-S. Power-constrained contrast enhancement for emissive displays based on histogram equalization. IEEE Trans. Image Process. 2011, 21, 80–93. [Google Scholar]
- Lee, C.; Lee, C.; Kim, C.-S. Contrast enhancement based on layered difference representation of 2D histograms. IEEE Trans. Image Process. 2013, 22, 5372–5384. [Google Scholar] [CrossRef]
- Wang, S.; Zheng, J.; Hu, H.-M.; Li, B. Naturalness preserved enhancement algorithm for non-uniform illumination images. IEEE Trans. Image Process. 2013, 22, 3538–3548. [Google Scholar] [CrossRef]
- Guo, X.; Li, Y.; Ling, H. LIME: Low-light image enhancement via illumination map estimation. IEEE Trans. Image Process. 2016, 26, 982–993. [Google Scholar] [CrossRef]
- Yu, F.; Xian, W.; Chen, Y.; Liu, F.; Liao, M.; Madhavan, V.; Darrell, T. Bdd100k: A diverse driving video database with scalable annotation tooling. arXiv 2018, arXiv:1805.04687. [Google Scholar]
- Loh, Y.P.; Chan, C.S. Getting to know low-light images with the exclusively dark dataset. Comput. Vis. Image Underst. 2019, 178, 30–42. [Google Scholar] [CrossRef]
- Chen, C.; Chen, Q.; Do, M.N.; Koltun, V. Seeing motion in the dark. In Proceedings of the IEEE/CVF International Conference on Computer Vision, Seoul, Korea, 27 October–2 November 2019; pp. 3185–3194. [Google Scholar]
- Wang, W.; Wang, X.; Yang, W.; Liu, J. Unsupervised Face Detection in the Dark. IEEE Trans. Pattern Anal. Mach. Intell. 2022, 5, 1250–1266. [Google Scholar] [CrossRef]
- Tan, X.; Xu, K.; Cao, Y.; Zhang, Y.; Ma, L.; Lau, R.W. Night-time scene parsing with a large real dataset. IEEE Trans. Image Process. 2021, 30, 9085–9098. [Google Scholar] [CrossRef]
- Wei, K.; Fu, Y.; Yang, J.; Huang, H. A physics-based noise formation model for extreme low-light raw denoising. In Proceedings of the IEEE/CVF Conference on Computer Vision and Pattern Recognition, Seattle, WA, USA, 12–16 October 2020; pp. 2758–2767. [Google Scholar]
- Jia, X.; Zhu, C.; Li, M.; Tang, W.; Zhou, W. LLVIP: A visible-infrared paired dataset for low-light vision. In Proceedings of the IEEE/CVF International Conference on Computer Vision, Montreal, BC, Canada, 11–17 October 2021; pp. 3496–3504. [Google Scholar]
- Li, C.; Guo, C.; Han, L.-H.; Jiang, J.; Cheng, M.-M.; Gu, J.; Loy, C.C. Low-light image and video enhancement using deep learning: A survey. IEEE Trans. Pattern Anal. Mach. Intell. 2021, 44, 9396–9416. [Google Scholar] [CrossRef] [PubMed]
- Singh, A.; Gupta, K. A contrast enhancement technique for low light images. AIP Conf. Proc. 2016, 1715, 020057. [Google Scholar]
- Dong, X.; Pang, Y.; Wen, J. Fast efficient algorithm for enhancement of low lighting video. In ACM SIGGRAPH 2010 Posters; Association for Computing Machinery: New York, NY, USA, 2010; p. 1. [Google Scholar]
- Chai, T.; Draxler, R.R. Root mean square error (RMSE) or mean absolute error (MAE)?–Arguments against avoiding RMSE in the literature. Geosci. Model Dev. 2014, 7, 1247–1250. [Google Scholar] [CrossRef]
- Kellman, P.; McVeigh, E.R. Image reconstruction in SNR units: A general method for SNR measurement. Magn. Reson. Med. 2005, 54, 1439–1447. [Google Scholar] [CrossRef] [PubMed]
- Yu, C.; Xu, X.; Lin, H.; Xinyan, Y. Low-illumination image enhancement method based on a fog-degraded model. J. Image Graph. 2017, 22, 1194–1205. [Google Scholar]
- Zhang, R.; Isola, P.; Efros, A.A.; Shechtman, E.; Wang, O. The unreasonable effectiveness of deep features as a perceptual metric. In Proceedings of the IEEE Conference on Computer Vision and Pattern Recognition, Salt Lake City, UT, USA, 18–23 June 2018; pp. 586–595. [Google Scholar]
- Sheikh, H.R.; Bovik, A.C.; De Veciana, G. An information fidelity criterion for image quality assessment using natural scene statistics. IEEE Trans. Image Process. 2005, 14, 2117–2128. [Google Scholar] [CrossRef] [PubMed]
- Russakovsky, O.; Deng, J.; Su, H.; Krause, J.; Satheesh, S.; Ma, S.; Huang, Z.; Karpathy, A.; Khosla, A.; Bernstein, M. Imagenet large scale visual recognition challenge. Int. J. Comput. Vis. 2015, 115, 211–252. [Google Scholar] [CrossRef]
- Ignatov, A.; Kobyshev, N.; Timofte, R.; Vanhoey, K.; Van Gool, L. Wespe: Weakly supervised photo enhancer for digital cameras. In Proceedings of the IEEE Conference on Computer Vision and Pattern Recognition Workshops, Salt Lake City, UT, USA, 18–23 June 2018; pp. 691–700. [Google Scholar]
- Zhu, J.; Wang, Z. Low-illumination surveillance image enhancement based on similar scenes. Comput. Appl. Softw. 2015, 32, 203–205. [Google Scholar]
- Mittal, A.; Soundararajan, R.; Bovik, A.C. Making a “completely blind” image quality analyzer. IEEE Signal Process. Lett. 2012, 20, 209–212. [Google Scholar] [CrossRef]
- Fu, X.; Zeng, D.; Huang, Y.; Zhang, X.-P.; Ding, X. A weighted variational model for simultaneous reflectance and illumination estimation. In Proceedings of the IEEE Conference on Computer Vision and Pattern Recognition, Las Vegas, NV, USA, 26 June–1 July 2016; pp. 2782–2790. [Google Scholar]
- Ma, C.; Yang, C.-Y.; Yang, X.; Yang, M.-H. Learning a no-reference quality metric for single-image super-resolution. Comput. Vis. Image Underst. 2017, 158, 1–16. [Google Scholar] [CrossRef]
- Ke, J.; Wang, Q.; Wang, Y.; Milanfar, P.; Yang, F. Musiq: Multi-scale image quality transformer. In Proceedings of the IEEE/CVF International Conference on Computer Vision, Montreal, BC, Canada, 11–17 October 2021; pp. 5148–5157. [Google Scholar]
- Talebi, H.; Milanfar, P. NIMA: Neural image assessment. IEEE Trans. Image Process. 2018, 27, 3998–4011. [Google Scholar] [CrossRef] [Green Version]
- Fang, Y.; Zhu, H.; Zeng, Y.; Ma, K.; Wang, Z. Perceptual quality assessment of smartphone photography. In Proceedings of the IEEE/CVF Conference on Computer Vision and Pattern Recognition, Salt Lake City, UT, USA, 18–23 June 2018; pp. 3677–3686. [Google Scholar]
- Li, J.; Wang, Y.; Wang, C.; Tai, Y.; Qian, J.; Yang, J.; Wang, C.; Li, J.; Huang, F. DSFD: Dual shot face detector. In Proceedings of the IEEE/CVF Conference on Computer Vision and Pattern Recognition, Long Beach, CA, USA, 15–20 June 2019; pp. 5060–5069. [Google Scholar]
Figure 1.
Examples of low-illumination images.

Figure 2.
Flowchart of the RetinexNet algorithm. There are three parts: decomposition, adjustment, and reconstruction.
Figure 2.
Flowchart of the RetinexNet algorithm. There are three parts: decomposition, adjustment, and reconstruction.

Figure 3.
Flowchart of the EnlightenGAN algorithm.

Figure 4.
Flowchart of the DRBN algorithm, which consists of two stages: recursive band learning and band recomposition.
Figure 4.
Flowchart of the DRBN algorithm, which consists of two stages: recursive band learning and band recomposition.

Figure 5.
Flowchart of the RRDNet algorithm.

Figure 6.
Examples of low-light image datasets. Note that the first line is paired, while the second line is unpaired. The full names of some abbreviations are as follows: LOL (Low-light Dataset), SID (See in the dark), VV (Vasileios Vonikakis).
Figure 6.
Examples of low-light image datasets. Note that the first line is paired, while the second line is unpaired. The full names of some abbreviations are as follows: LOL (Low-light Dataset), SID (See in the dark), VV (Vasileios Vonikakis).


Figure 7.
Visual results of different algorithms on low-illumination images sampled from the LIME dataset.
Figure 7.
Visual results of different algorithms on low-illumination images sampled from the LIME dataset.

Figure 8.
Visual results of different algorithms on low-illumination images sampled from the SICE dataset.
Figure 8.
Visual results of different algorithms on low-illumination images sampled from the SICE dataset.

Figure 9.
Visual results of different algorithms on low-illumination images sampled from the LOL dataset.
Figure 9.
Visual results of different algorithms on low-illumination images sampled from the LOL dataset.

Figure 10.
Visual results of different algorithms on low-illumination images sampled from the VE-LOL-L dataset.
Figure 10.
Visual results of different algorithms on low-illumination images sampled from the VE-LOL-L dataset.

Figure 11.
Low-illumination face detection visualization results.

Figure 12.
Low-illumination face detection performance comparison graph.


Table 1.
Summary of essential features of deep-learning-based methods. “---” means this item is unavailable or not indicated in the corresponding paper.
Table 1.
Summary of essential features of deep-learning-based methods. “---” means this item is unavailable or not indicated in the corresponding paper.
| Year | Method | Training Data | Test Data | Evaluation Metrics | Platform |
|---|---|---|---|---|---|
| 2017 | LLNet | Gamma corrected image processing | Self-Selected | PSNR SSIM | Theano |
| 2017 | MSR-Net | Open-source data set | MEF NPE VV | SSIM NIQE | Caffe |
| 2017 | LLCNN | Gamma corrected image processing | Self-Selected | PSNR SSIM LOE SNM | --- |
| 2018 | MBLLEN | VOC | Self-Selected | PSNR SSIM AB VIF LOE TOMI | TensorFlow |
| 2018 | RetinexNet | LOL | VV MEF LIME NPE DICM | --- | TensorFlow |
| 2018 | SCIE | SCIE | SCIE | PSNR FSIM | Caffe&Matlab |
| 2018 | DeepExposure | MIT-Adobe FiveK | MIT-Adobe FiveK | MSE PSNR | TensorFlow |
| 2018 | Chen et al. | SID | SID | PSNR SSIM | TensorFlow |
| 2018 | HybirdNet | Places | CIFAR-10 STL-10 SVHN | --- | Caffe |
| 2019 | EnlightenGAN | Unpaired real images | NPE LIME MEF DICM VV BBD-100K ExDARK | NIQE | PyTorch |
| 2019 | KinD | LOL | LOL NPE LIME MEF | PSNR SSIM LOE NIQE | TensorFlow |
| 2019 | KinD++ | LOL | DICM LIME MEF NPE | PSNR SSIM LOE NIQE | TensorFlow |
| 2019 | DeepUPE | Homemade image pair | MIT-Adobe FiveK | PSNR SSIM | --- |
| 2019 | SMOID | SMOID | SMOID | PSNR SSIM MSE | TensorFlow |
| 2019 | EXCNet | real images | IEpsD | CDIQA LOD | PyTorch |
| 2020 | EEMEFN | SID | SID | PSNR SSIM | PyTorch |
| 2020 | Zero-DCE | SICE | SICE NPE LIME MEF DICM VV DARK FACE | PNSR SSIM | PyTorch |
| 2020 | DRBN | LOL | LOL | PSNR SSIM | PyTorch |
| 2020 | SemanticRetinex | analog image | self-selected | PSNR SSIM NIQE | --- |
| 2020 | TBEFN | SCIE LOL | SCIE LOL DICM MEF NPE VV | PSNR SSIM NIQE | TensorFlow |
| 2020 | DLN | analog image | LOL | PSNR SSIM NIQE | PyTorch |
| 2020 | RRDNet | --- | PE LIME MEF DICM | NIQE CPCQI | PyTorch |
| 2020 | LDNet | --- | DVS | --- | PyTorch |
| 2020 | DSLR | MIT-Adobe FiveK | MIT-Adobe FiveK self-selected | PSNR SSIM NIQMC NIQE BTMQI CaHDC | PyTorch |
| 2021 | R2RNet | LSRW | LOL LIME DICM NPE MEF VV | PSNR SSIM FSIM MAE GMSD NIQE | PyTorch |
| 2021 | PRIEN | MEF LOL Brightening-Train | LIME NPE MEF VV | PSNR SSIM LOE TMQI | PyTorch |
| 2021 | TSN-CA | LOL | LOL LIME DICM MEF NPE | PSNR SSIM VIF LPIPS FSIM UQI | --- |
| 2021 | BLNet | LOL | LOL LIME DICM MEF | --- | PyTorch |
| 2021 | RetinexDIP | --- | DICM ExDark Fusion LIME NASA NPE VV | NIQE NIQMC CPCQI | PyTorch |
| 2021 | RUAS | MIT-Adobe FiveKLOL | LOL MIT-Adobe FiveK DarkFace ExtremelyDarkFace | PSNR SSIM LPIPS | PyTorch |
| 2021 | Retinex-Net | New-LOL | New-LOL NPE DICM VV | PSNR SSIM UQI | PyTorch |
| 2021 | Zero-DCE++ | SICE | NPE LIME MEF DICM VV | PSNR SSIM MAE #P FLOPS | PyTorch |
| 2021 | UTVNet | ELD | SID | PSNR SSIM Params LPIPS MACs | PyTorch |
| 2021 | Zhang et al. | DAVIS | DAVIS | PSNR SSIM MABD | PyTorch |
| 2021 | Sharma et al. | HDR-Real SID Color-Constancy | HDR-Real | PSNR SSIM | PyTorch |
| 2022 | URetinex-Net | VV LIME VV DICM ExDark | LOL SICE MEF | PSNR SSIM MAE LPIPS | PyTorch |
| 2022 | MAXIM | LOL MIT-Adobe FiveK | LOL MIT-Adobe FiveK | PSNR SSIM | TensorFlow |
| 2022 | M-Net+ | LOL MIT-Adobe FiveK | LOL MIT-Adobe FiveK | PSNR SSIM LPILS | PyTorch |
| 2022 | Dong et al. | MCR | SID MCR | PSNR SSIM | PyTorch |
| 2022 | LUD-VAE | LUD-VAE | LOL | PSNR SSIM LPILS | PyTorch |
| 2022 | SCI | --- | MIT-Adobe FiveK LSRW | PSNR SSIM DE EME LOE NIQE | PyTorch |
| 2022 | TreEnhance | LOL MIT-Adobe FiveK | LOL MIT-Adobe FiveK | PSNR SSIM LPILS DeltaE | PyTorch |
| 2022 | Liang et al. | --- | LOL LIME NPE MEF DICM | NIQE ARISM NIQMC PSNR SSIM | PyTorch |
| 2022 | Jin et.al | LOL | Dark ZurichLOL LOL-Real | PSNR SSIM MSE LPIPS | PyTorch |
| 2022 | LCDPNet | MIT-Adobe FiveK MSEC LOL | MSEC LOL | PSNR SSIM | PyTorch |
| 2022 | LLFormer | UHD-LOL | UHD-LOL LOLMIT-Adobe FiveK | PSNR SSIM MAE LPIPS | PyTorch |
| 2022 | SNR-Aware | LOL SID SMID | LOL SID SMID SDSD | PSNR SSIM | PyTorch |
Annotation: LLNet [19], MSR-Net [20], LLCNN [21], MBLLEN [22], SICE [23], RetinexNet [24], DeepExposure [25], Chen et al. [26], HybirdNet [27], EnlightenGAN [28], KinD [29], KinD++ [30], DeepUPE [31], SMOID [32], ExCNet [33], EEMEFN [34], Zero-DCE [35], SemanticRetinex [36], TBEFN [37], DLN [38], RRDNet [39], LDNet [40], DSLR [41], R2RNet [42], PRIEN [43], DRBN [44], TSN-CA [45], BLNET [46], RetinexDIP [47], RUAS [48], Retinex-Net [49], Zero-DCE++ [50], UTVNet [51], Zhang et al. [52], Sharma et al. [53], URetinexNet [54], MAXIM [55], M-Net+ [56], Dong et al. [57], LUD-AVE [58], Sci [59], TreEnhance [60], Liang et al. [61], Jin et al. [62], LCDPNet [63], LLFormer [64], SNR-Aware [65].
Table 2.
Summary of low-illumination image datasets.
| Date | Dataset | Paired/Unpaired | Image/Video | No. of Images | Synthetic/Real |
|---|---|---|---|---|---|
| 2011 | MIT-Adobe FiveK [73] | Paired | Image | 5000 | Real |
| 2012 | MEF [74] | Unpaired | Image | 17 | Real |
| 2013 | DICM [75] | Unpaired | Image | 69 | Real |
| 2013 | NPE [76] | Unpaired | Image | 85 | Real |
| 2017 | LIME [77] | Unpaired | Image | 10 | Real |
| 2017 | DPED [41] | Paired | Image | 22,000 | Real |
| 2018 | SID [26] | Paired | Image | 5094 | Real |
| 2018 | LOL [24] | Paired | Image | 500 | Synthetic+Real |
| 2018 | BDD-100k [78] | Unpaired | Video | 10,000 | Real |
| 2018 | SICE [23] | Paired | Image | 5002 | Real |
| 2019 | ExDark [79] | Unpaired | Image | 7363 | Real |
| 2019 | SMOID [32] | Paired | Video | 202 | Real |
| 2019 | DRV [80] | Unpaired | Video | 179 | Real |
| 2020 | DarkFace [81] | Unpaired | Image | 6000 | Real |
| 2020 | NightCity [82] | Unpaired | Image | 4297 | Real |
| 2020 | ELD [83] | Paired | Image | 480 | Real |
| 2021 | LLVIP [84] | Paired | Image | 30,976 | Real |
| 2021 | LSRW [42] | Paired | Image | 5650 | Synthetic+Real |
| 2021 | VE-LOL-L [16] | Paired | Image | 2500 | Synthetic+Real |
| 2021 | VE-LOL-H [16] | Unpaired | Image | 10,940 | Real |
| 2021 | LoLi-Phone [85] | Unpaired | Image+Video | 55,148 | Real |
| --- | VV | Unpaired | Image | 24 | Real |
Annotation: DICM (digital cameras); NPE (naturalness preserved); MEF (multi-exposure image fusion); LIME (low-Light image enhancement); DPED (DSLR photo enhancement dataset); SID (see in the dark); LOL (low-light dataset); BBD-100k (a diverse driving video database with scalable annotation tooling); SICE (multi-exposure HDR images ), ExDark (exclusively dark dataset); SMOID (video data pairs of dynamic vehicles and pedestrians in street view); DRV (long exposure - short exposure video); DarkFace (ambient face image with low illumination); LSRW (large-scale real-world paired low/normal-light images dataset); ELD (extreme low-light denoising dataset); LLVIP (visible-infrared paired dataset for low-light vision); VE-LOL-L (vision enhancement in low-light condition for low level); VE-LOL-H (vision enhancement in low-light condition for high level); LoLi-phone (low-light image on the phone); NASA (national aeronautics and space administration); VV (Vasileios Vonikakis).
Table 3.
Abstract of objective quality evaluation index of the image.
| Abbreviation | Full-/Non-Reference |
|---|---|
| MSE (Mean Square Error) [86,87] | Full-Reference |
| MAE (Mean Absolute Error) [88] | Full-Reference |
| SNR (Signal to Noise Ratio) [89] | Full-Reference |
| PSNR (Peak-Signal to Noise Ratio) [90] | Full-Reference |
| LPIPS (Learned Perceptual Image Patch Similarity) [91] | Full-Reference |
| IFC (Information Fidelity Criterion) [92] | Full-Reference |
| VIF (Visual Information Fidelity) [93] | Full-Reference |
| SSIM (Structural Similarity Index) [94] | Full-Reference |
| IE (Information Entropy) [95] | Non-Reference |
| NIQE (Natural Image Quality Evaluator) [96] | Non-Reference |
| LOE (Lightness Order Error) [97] | Full-Reference |
| PI (Perceptual Index) [98] | Non-Reference |
| MUSIQ (Multi-scale Image Quality Transformer) [99] | Non-Reference |
| NIMA (Neural Image Assessment) [100] | Non-Reference |
| SPAQ (Smartphone Photography Attribute and Quality) [101] | Non-Reference |
Table 4.
Quantitative comparison of the LIME dataset (Unpaired Dataset) according to NIQE, IE, and LOE. The best result is bold in red, the second result is bold in blue, and the third result is bold in yellow.
Table 4.
Quantitative comparison of the LIME dataset (Unpaired Dataset) according to NIQE, IE, and LOE. The best result is bold in red, the second result is bold in blue, and the third result is bold in yellow.
| Method | NIQE↓ | IE↑ | LOE↓ |
|---|---|---|---|
| Input | 3.015 | 6.381 | 0 |
| LLNet 1 | 2.986 | 7.382 | 167.051 |
| RetinexNet 2 | 2.783 | 6.854 | 621.855 |
| MBLLEN 3 | 3.432 | 7.408 | 47.448 |
| EnlightenGAN 4 | 2.403 | 7.515 | 311.282 |
| ExCNet 5 | 2.386 | 7.413 | 206.526 |
| RRDNet 6 | 2.768 | 7.119 | 41.711 |
| DRBN 7 | 3.312 | 7.481 | 464.876 |
| TBEFN 8 | 2.693 | 7.097 | 158.634 |
| Zero-DCE++ 9 | 2.490 | 7.438 | 246.028 |
| ICENet 10 | 3.331 | 7.517 | 115.913 |
| KinD++ 11 | 2.426 | 7.292 | 347.293 |
| Sci 12 | 4.068 | 7.562 | 61.257 |
| URetinexNet 13 | 3.429 | 7.432 | 109.214 |
| LCDPNet 14 | 2.756 | 7.336 | 157.570 |
Source code: 1. https://github.com/pythonuser200/LLNet; 2. https://github.com/weichen582/RetinexNet; 3. https://github.com/Lvfeifan/MBLLEN; 4. https://github.com/VITA-Group/EnlightenGAN 5. https://cslinzhang.github.io/ExCNet/; 6. https://github.com/970416/RRDNet; 7 https://github.com/lingyanruan/DRBNet; 8 https://github.com/lukun199/TBEFN; 9. https://github.com/Li-Chongyi/Zero-DCE_extension; 10. https://github.com/keunsoo-ko/IceNet; 11. https://github.com/zhangyhuaee/KinD_plus; 12 https://github.com/tengyu1998/SCI; 13.https://github.com/AndersonYong/URetinex-Net;14.https://github.com/onpix/LCDPNet, accessed on 2 November 2022.
Table 5.
Quantitative comparison of the SCIE datasets (Paired Dataset) according to PSNR, SSIM, MSE, NIQE, IE, and LOE. The best result is bold in red, the second result is bold in blue, and the third result is bold in yellow.
Table 5.
Quantitative comparison of the SCIE datasets (Paired Dataset) according to PSNR, SSIM, MSE, NIQE, IE, and LOE. The best result is bold in red, the second result is bold in blue, and the third result is bold in yellow.
| Method | PSNR↑ | SSIM↑ | MSE (×103)↓ | NIQE↓ | IE↑ | LOE↓ |
|---|---|---|---|---|---|---|
| Input | 6.503 | 0.094 | 14.546 | 4.282 | 4.761 | 0 |
| LLNet | 14.963 | 0.726 | 2.074 | 4.001 | 6.576 | 250.756 |
| RetinexNet | 14.940 | 0.689 | 2.085 | 2.595 | 6.543 | 619.658 |
| MBLLEN | 20.334 | 0.790 | 0.602 | 3.261 | 7.146 | 172.254 |
| EnlightenGAN | 12.378 | 0.687 | 3.761 | 2.683 | 7.134 | 364.849 |
| ExCNet | 13.794 | 0.597 | 2.715 | 2.352 | 6.497 | 175.605 |
| RRDNet | 8.885 | 0.334 | 8.406 | 3.498 | 6.016 | 109.657 |
| DRBN | 15.182 | 0.663 | 1.972 | 4.043 | 7.051 | 203.220 |
| TBEFN | 14.234 | 0.681 | 2.453 | 2.911 | 6.904 | 322.813 |
| Zero-DCE++ | 11.197 | 0.395 | 4.936 | 3.034 | 6.465 | 277.180 |
| ICENet | 12.250 | 0.553 | 3.873 | 3.803 | 5.999 | 156.514 |
| KinD++ | 14.983 | 0.683 | 2.064 | 3.082 | 6.364 | 636.400 |
| Sci | 10.683 | 0.454 | 5.557 | 3.140 | 5.922 | 123.624 |
| URetinexNet | 18.550 | 0.614 | 0.908 | 3.408 | 6.465 | 145.845 |
| LCDPNet | 13.946 | 0.651 | 2.621 | 3.459 | 6.678 | 309.153 |
Table 6.
Quantitative comparison of the LOL datasets (Paired Dataset) according to PSNR, SSIM, MSE, NIQE, IE, and LOE. The best result is bold in red, the second result is bold in blue, and the third result is bold in yellow.
Table 6.
Quantitative comparison of the LOL datasets (Paired Dataset) according to PSNR, SSIM, MSE, NIQE, IE, and LOE. The best result is bold in red, the second result is bold in blue, and the third result is bold in yellow.
| Method | PSNR↑ | SSIM↑ | MSE (×103)↓ | NIQE↓ | IE↑ | LOE↓ |
|---|---|---|---|---|---|---|
| Input | 7.610 | 0.144 | 9.015 | 6.240 | 5.238 | 0 |
| LLNet | 18.739 | 0.567 | 0.869 | 3.845 | 7.215 | 385.358 |
| RetinexNet | 17.303 | 0.609 | 1.209 | 4.383 | 7.081 | 743.301 |
| MBLLEN | 16.305 | 0.567 | 1.523 | 3.236 | 7.409 | 163.754 |
| EnlightenGAN | 20.332 | 0.643 | 0.602 | 3.268 | 7.375 | 343.028 |
| ExCNet | 19.261 | 0.679 | 0.771 | 3.052 | 7.772 | 166.688 |
| RRDNet | 11.396 | 0.373 | 4.716 | 3.217 | 6.525 | 104.375 |
| DRBN | 20.331 | 0.669 | 0.603 | 3.664 | 7.190 | 413.652 |
| TBEFN | 19.151 | 0.731 | 0.791 | 3.164 | 7.007 | 398.717 |
| Zero-DCE++ | 14.914 | 0.310 | 2.098 | 3.035 | 7.197 | 454.495 |
| ICENet | 17.751 | 0.678 | 1.092 | 4.364 | 7.294 | 152.807 |
| KinD++ | 17.026 | 0.678 | 1.290 | 4.028 | 7.349 | 615.748 |
| Sci | 15.345 | 0.666 | 1.899 | 4.086 | 7.235 | 138.523 |
| URetinexNet | 23.038 | 0.814 | 0.323 | 3.517 | 7.172 | 193.717 |
| LCDPNet | 20.270 | 0.721 | 0.611 | 3.067 | 7.239 | 249.273 |
Table 7.
Quantitative comparison of the VE-LOL-L dataset (Paired Dataset) according to PSNR, SSIM, MSE, NIQE, IE, and LOE. The best result is bold in red, the second result is bold in blue, and the third result is bold in yellow.
Table 7.
Quantitative comparison of the VE-LOL-L dataset (Paired Dataset) according to PSNR, SSIM, MSE, NIQE, IE, and LOE. The best result is bold in red, the second result is bold in blue, and the third result is bold in yellow.
| Method | PSNR↑ | SSIM↑ | MSE (×103)↓ | NIQE↓ | IE↑ | LOE↓ |
|---|---|---|---|---|---|---|
| Input | 9.812 | 0.267 | 6.790 | 5.172 | 5.130 | 0 |
| LLNet | 21.823 | 0.821 | 0.427 | 3.392 | 7.016 | 381.035 |
| RetinexNet | 16.008 | 0.656 | 1.630 | 2.795 | 6.552 | 624.638 |
| MBLLEN | 20.380 | 0.712 | 0.596 | 2.815 | 7.292 | 132.327 |
| EnlightenGAN | 19.682 | 0.726 | 0.699 | 2.753 | 7.078 | 777.351 |
| ExCNet | 18.694 | 0.733 | 0.878 | 2.579 | 7.231 | 419.8283 |
| RRDNet | 16.177 | 0.736 | 1.568 | 2.474 | 6.636 | 94.710 |
| DRBN | 21.401 | 0.841 | 0.471 | 3.276 | 6.884 | 762.254 |
| TBEFN | 21.351 | 0.831 | 0.476 | 2.750 | 6.514 | 478.2779 |
| Zero-DCE++ | 21.591 | 0.578 | 0.451 | 2.420 | 6.653 | 489.985 |
| ICENet | 22.991 | 0.776 | 0.327 | 3.941 | 6.719 | 579.937 |
| KinD++ | 19.711 | 0.797 | 0.695 | 2.900 | 6.610 | 694.534 |
| Sci | 22.928 | 0.775 | 0.331 | 3.870 | 6.808 | 205.172 |
| URetinexNet | 17.019 | 0.769 | 1.292 | 3.737 | 6.782 | 201.452 |
| LCDPNet | 27.070 | 0.892 | 0.128 | 3.212 | 6.966 | 346.545 |
Table 8.
Average running time (in seconds) of image enhancement in VE-LOL-H. The best result is bold in red, the second result is bold in blue, and the third result is bold in yellow.
Table 8.
Average running time (in seconds) of image enhancement in VE-LOL-H. The best result is bold in red, the second result is bold in blue, and the third result is bold in yellow.
| Method | Running Time |
|---|---|
| LLNet | 4.021 |
| RetinexNet | 0.469 |
| MBLLEN | 3.975 |
| EnlightenGAN | 0.012 |
| ExCNet | 12.748 |
| RRDNet | 78.386 |
| DRBN | 0.935 |
| TBEFN | 0.120 |
| Zero-DCE++ | 0.747 |
| ICENet | 4.203 |
| KinD++ | 1.322 |
| Sci | 0.931 |
| URetinexNet | 2.467 |
| LCDPNet | 1.630 |
Disclaimer/Publisher’s Note: The statements, opinions and data contained in all publications are solely those of the individual author(s) and contributor(s) and not of MDPI and/or the editor(s). MDPI and/or the editor(s) disclaim responsibility for any injury to people or property resulting from any ideas, methods, instructions or products referred to in the content. |
© 2023 by the authors. Licensee MDPI, Basel, Switzerland. This article is an open access article distributed under the terms and conditions of the Creative Commons Attribution (CC BY) license (https://creativecommons.org/licenses/by/4.0/).
Share and Cite
MDPI and ACS Style
Tang, H.; Zhu, H.; Fei, L.; Wang, T.; Cao, Y.; Xie, C. Low-Illumination Image Enhancement Based on Deep Learning Techniques: A Brief Review. Photonics 2023, 10, 198. https://doi.org/10.3390/photonics10020198
AMA Style
Tang H, Zhu H, Fei L, Wang T, Cao Y, Xie C. Low-Illumination Image Enhancement Based on Deep Learning Techniques: A Brief Review. Photonics. 2023; 10(2):198. https://doi.org/10.3390/photonics10020198
Chicago/Turabian StyleTang, Hao, Hongyu Zhu, Linfeng Fei, Tingwei Wang, Yichao Cao, and Chao Xie. 2023. "Low-Illumination Image Enhancement Based on Deep Learning Techniques: A Brief Review" Photonics 10, no. 2: 198. https://doi.org/10.3390/photonics10020198
Note that from the first issue of 2016, this journal uses article numbers instead of page numbers. See further details here.