All-Fiber Laser Feedback Interferometry for Sequential Sensing of In-Plane and Out-of-Plane Displacements


School of Computer and Electronic Information, Nanjing Normal University, Nanjing 210023, China
*
Author to whom correspondence should be addressed.
Photonics 2023, 10(4), 480; https://doi.org/10.3390/photonics10040480
Submission received: 13 March 2023
/
Revised: 14 April 2023
/
Accepted: 20 April 2023
/
Published: 21 April 2023
(This article belongs to the Special Issue Advanced Photonic Sensing and Measurement)
Abstract
:In this paper, an all-fiber laser feedback interferometer (LFI) with a diffraction grating was developed for sequential measurement of in-plane and out-of-plane displacements without changing the optical arrangement. When the light emitted from an erbium-doped fiber ring laser is incident on a reflection grating at the Littrow angle, the diffracted light will return into the laser cavity along the original path, thus generating laser feedback interference. Experimental results reveal that the all-fiber system could achieve a precision of 40 nm in both in-plane and out-of-plane displacements sensing. Compared with the traditional all-fiber LFI, the proposed sensing system transfers the measuring scale from laser wavelength to grating period, and it has the advantages of good anti-interference performance and reliability.
1. Introduction
Laser feedback interference occurs when a small portion of light emitted from a laser is reflected or backscattered by an external object and the reflected light reenters the laser cavity, leading to the modulation in both the amplitude and frequency of the lasing field [1,2]. Laser feedback interferometry (LFI) has been widely used in the past decades, such as velocity sensing [3,4], acoustic emission measurement [5,6], micro-displacement sensing [7,8] and quantum communication [9,10]. Among different types of LFI, LFI in the erbium-doped fiber ring laser (EDFRL) is most competitive for coherent fiber-optic sensing applications owing to the benefit of remote optical pumping, immunity to electromagnetic interference, interrogation ability, and the capability of being a wavelength division multiplexed along a single fiber [11,12]. Similar to the conventional optical fiber interferometry, the measurement accuracy of an all-fiber LFI strongly depends on the wavelength stability. As a result, the environmental conditions have to be strictly controlled to achieve high measurement accuracy.
In this paper, we introduce a diffraction grating in an all-fiber LFI system, which transfers the measuring scale from laser wavelength to grating pitch. On the basis of the grating Doppler effect, the proposed system can achieve sequential sensing of in-plane and out-of-plane displacements without changing the optical arrangement. Owing to the low thermal expansion coefficient of the grating substrate, the displacement sensor has good stability and small zero drift. The measurement theory and signal processing are presented. Several experiments are performed to verify the performance of the proposed system. Furthermore, some measurement errors are discussed.
2. Principle
2.1. Theoretical Analysis of an All-Fiber LFI with a Grating
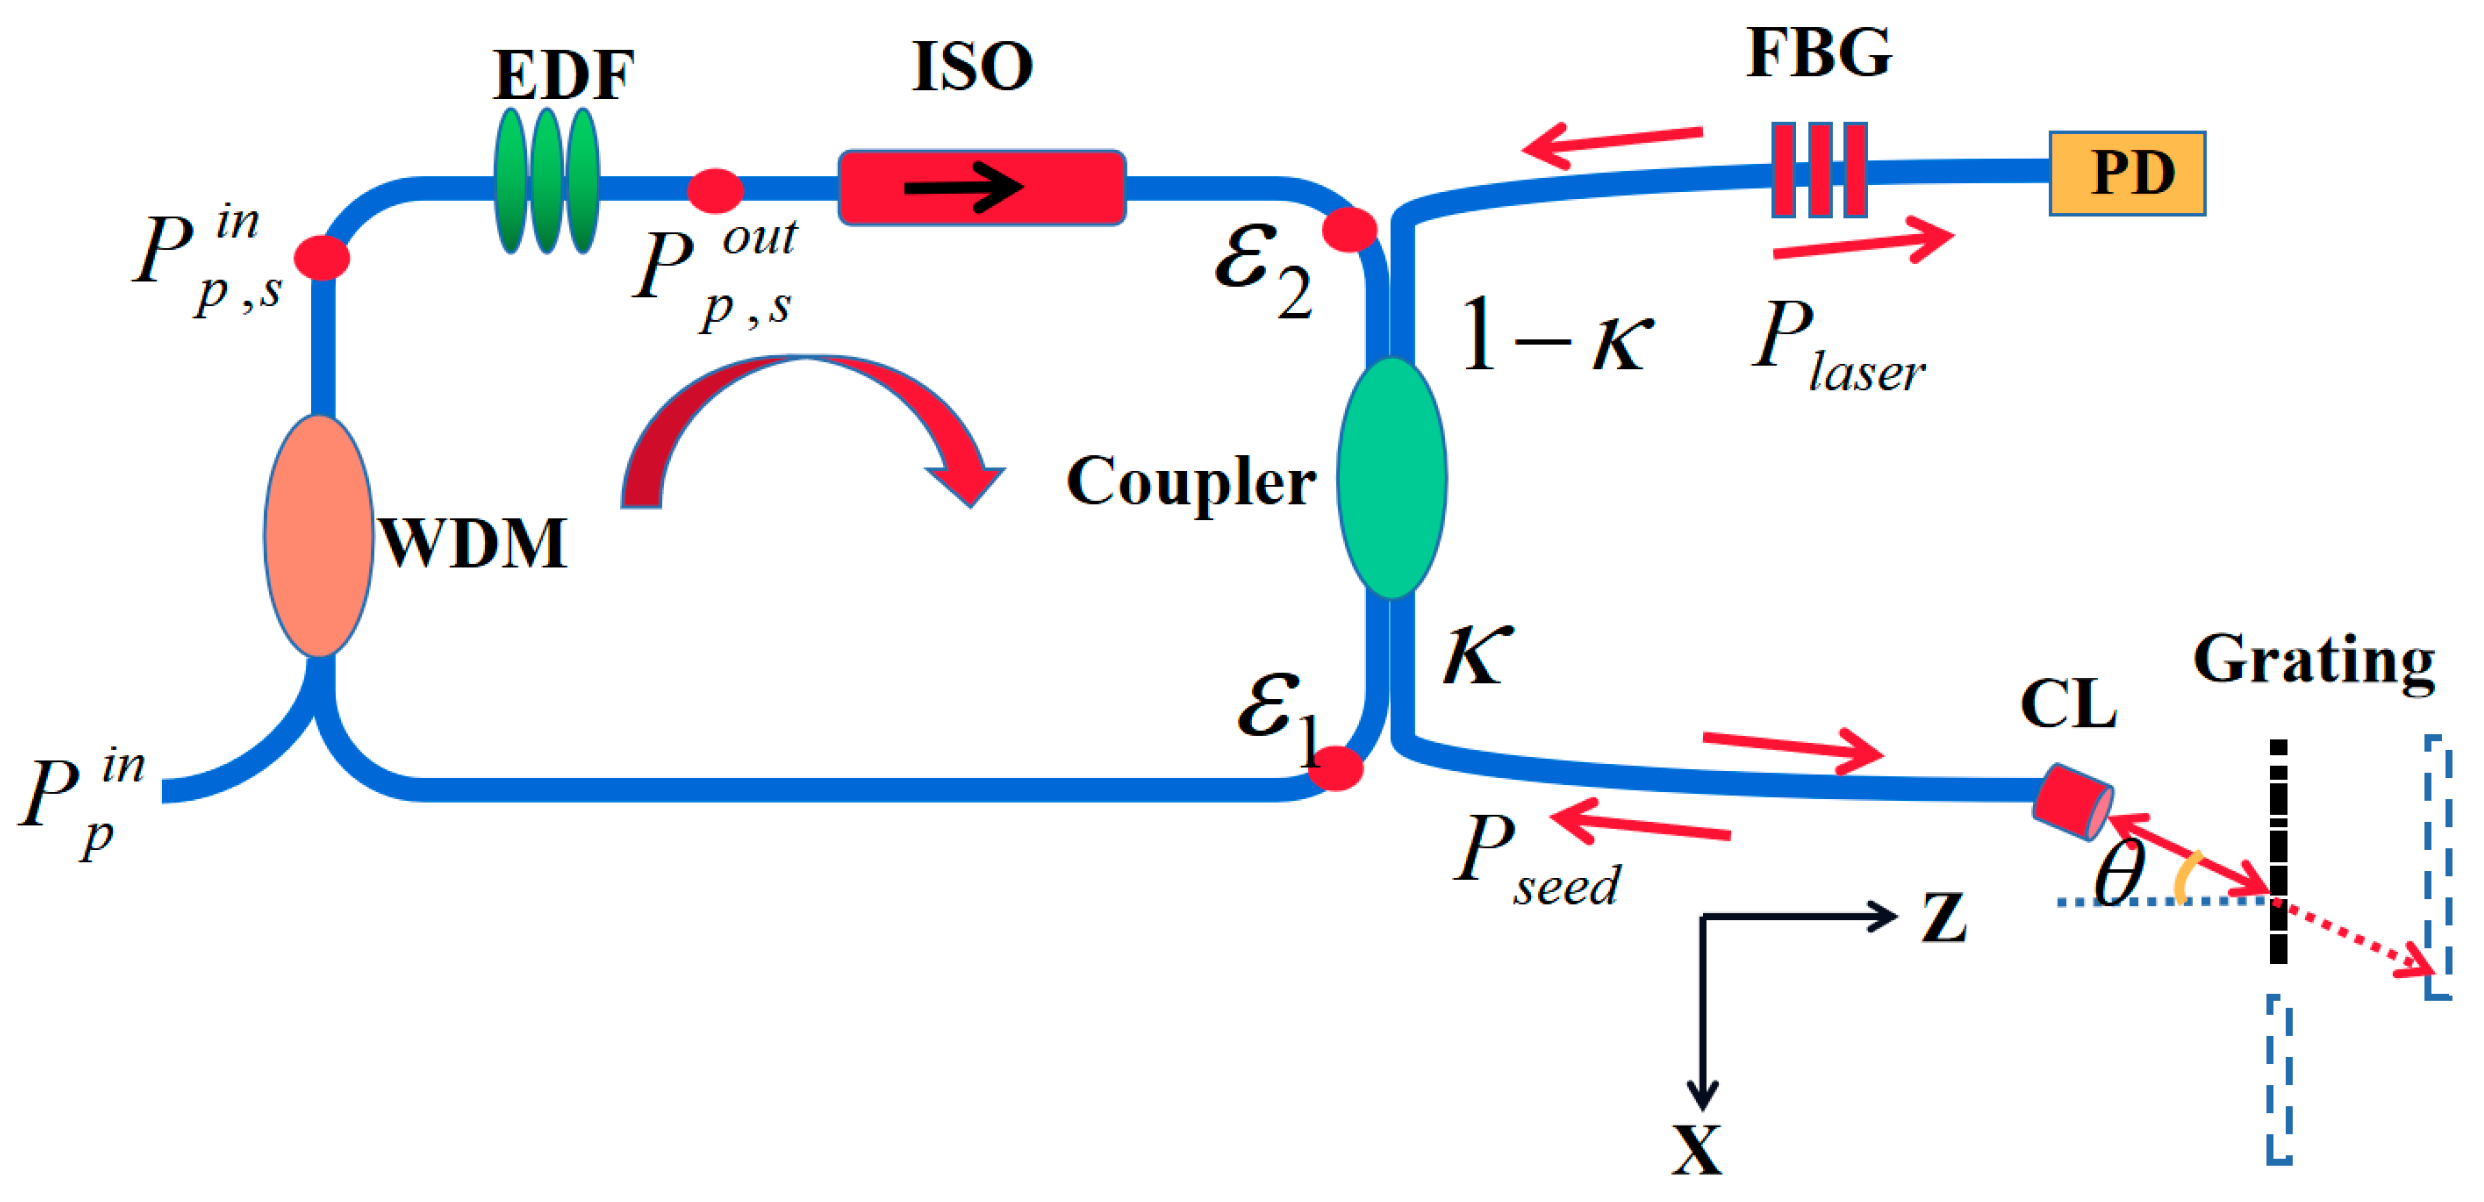
Figure 1 illustrates the schematic diagram of an all-fiber LFI with a diffraction grating. The pump light with wavelength 980 nm is coupled into the ring cavity through a wavelength division multiplexer (WDM) and then amplified by an erbium-doped fiber (EDF). The amplified light is transmitted to a 2 × 2 optical fiber coupler with a coupling ratio of κ. The optical isolator is used to ensure the beam one-way transmission in the ring cavity. As seen in Figure 1, Pin and Pout denote the input and output power of EDF. Remaining cavity losses (isolator, WDM, splices, etc.) are lumped into ε1 and ε2. The subscripts p and s represent the pump and signal light, respectively. Pseed represents the reflection power from the diffraction grating. The laser beam output from the fiber ring laser is projected onto a reflection grating at angle θ through a collimator lens (CL), the +1st-order diffracted beam returns along the incident path, thus generating the LFI effect. This angle θ is called the Littrow angle [13]. Another beam of light is reflected by the fiber Bragg grating (FBG). Plaser denotes the LFI signal detected by a photodetector (PD).
According to the diffraction law, incident angle θ can be expressed as:
where λ represents the wavelength of the fiber ring laser, and p denotes the pitch of the measured diffraction grating. According to the grating Doppler Effect [14], when the reflection grating moves only in the X-direction with Δx, a frequency shift is introduced in the diffracted +1st-order beam, and the corresponding phase change of the diffraction beam can be expressed as:
When the diffraction grating moves only in the Z-direction with Δz indicated in Figure 1, the +1st-order diffraction beam will generate a phase change due to the grating Doppler effect and a phase change due to the variation of the optical path. The total phase change of the interference signal caused by the out-of-plane displacement Δz can be expressed as:
Substituting Equation (1) into Equation (3), the following expression can be obtained:
For the fiber ring cavity, we begin with the amplifier equations for an EDF. These are derived as the steady-state solutions to the rate equations [15,16].
with
and saturation powers given by
In Equation (5) through Equation (7), L is the length of EDF. The emission (e) and absorption (a) cross-sections are denoted by σ, h is the Planck constant, ν is the emission frequency which shifts as a periodic function with respect to the external length, Aeff is the effective area of the mode, α is the small signal absorption coefficient (σαρ, where ρ is the Er doping concentration), τ is the upper state lifetime, and Γ is the optical mode–erbium overlap factor.
In the steady state, the power at Pout is conserved through one cavity round-trip [17]. We obtain the following expression for Pin at the laser wavelength:
where ε1 and ε2 denote the total attenuation (e.g., couple, FBG, and splices), and r1 represents the reflectivity of the FBG.
Using Equations (5) and (8), we obtain Equation (9) for one roundtrip.
Taking the logarithm of Equation (5), and solving for ΔPP, we arrive at the following expression:
Using Equation (5) with (6), we can arrive at another expression for:
Next, is subtracted from both sides of Equation (8) to arrive at:
Finally, Equations (10) and (12) are plugged into Equation (11) to arrive at the transcendental Equation (13).
where Ppin represents the power of the pump light, Pss and Pps denote the saturation power of signal light and pump light, respectively, and Pseed represents the reflected power from the measured target (reflection grating). The feedback light Pseed can be expressed as:
With equivalent reflectance, r* is:
where r22 is the diffraction efficiency of the grating, and η is the coupling efficiency from the grating to the CL. Equation (9) is solved numerically for Psout and the LFI signal detected by PD can finally be indicated as:
2.2. Numerical Simulation of the LFI Signal Corresponding to Grating Displacement
In order to verify the relationship between the number of interference fringes and the grating displacement, simulations are carried out according to the theoretical analysis. The grating pitch in our measurement system is p = 1.667 μm. Figure 2 presents the simulated results of the LFI signal when the grating moves only in the X-direction. Figure 2a is the simulated sinusoidal displacement of the grating with an amplitude of 8 μm (p–p). Figure 2b is the corresponding LFI signal. Theoretical analysis and simulation results show that each fringe in LFI signal corresponds to the displacement in the X-direction with 1.667 μm. Figure 3 is the simulated results of the LFI signal when the grating moves only in the Z-direction. Figure 3a is the simulated sinusoidal displacement of the grating with an amplitude of 7 μm (p–p). Figure 3b is the corresponding LFI signal. Theoretical analysis and simulation results show that each fringe in LFI signal corresponds to the displacement in the Z-direction with 0.875 μm. The fringe counting method is commonly used for displacement sensing in LFI technology. However, the measurement resolution is only one interference signal. In order to extract the grating displacement with high accuracy, the phase modulation technique is introduced below.
2.3. Displacement Extraction Method
In order to extract the phase variation corresponding to grating displacement with high accuracy, the sinusoidal phase modulation technique is introduced. Assuming that the phase modulation function is asin(2πfmt), where a is the modulation depth, and fm is the modulation frequency, the alternating component of the modulated interference signal can be obtained using Equation (17).
where P0 denotes the output power of the fiber ring laser without feedback. Expanding it in a Fourier series, the harmonics at fm and 2fm have the following expressions, respectively:
where Jn(a) is the n-th Bessel function. It can be seen from Equations (18) and (19) that P1(t) and P2(t) are amplitude-modulated by the sine and cosine functions of the phase Δφg. Here, an optimum extraction of the interference signals occurs when the modulation amplitude a is chosen to satisfy J1(a) = J2(a). Then, the phase variation corresponding to the grating displacement can be obtained by:
In the case of in-plane displacement measurement, the displacement Δx can be calculated by:
In the case of out-of-plane displacement measurement, the displacement Δz can be obtained by:
3. Experimental Results
The experimental setup of an all-fiber LFI system based on a grating is shown in Figure 4. The light output from the erbium-doped fiber amplifier (EDFA) is transmitted to the 2 × 2 coupler with a coupling ratio of 70:30. The fiber optical isolator is utilized to ensure the beam unidirectional transmission in the ring cavity. Port 3 of the coupler is connected to an FBG with 95% reflectivity at wavelength 1550 nm. The optical beam output from port 4 is projected onto a reflection grating at the +1st-order Littrow angle through a CL. The reflection grating with pitch 1.667 μm is fixed on a two axis nano-positioning stage (P762.2L, PI). Both a polarization controller (PC) and a phase modulator (PM) are put between the coupler and the CL.
3.1. Experimental Observations of the LFI Signal Corresponding to In-Plane or Out-of-Plane Displacement
In order to verify the theoretical and simulation analysis results in Section 2.1 and Section 2.2, experimental observations of an LFI signal corresponding to in-plane or out-of-plane displacement were conducted. First, both PC and PM were removed from the system shown in Figure 4. Figure 5 shows the LFI signal corresponding to the in-plane displacement Δx of the grating. Figure 5a shows the voltage signal obtained from the X-axis sensor monitor of the stage controller. Figure 5b presents the corresponding LFI signal. This result is consistent with the theoretical simulation results. Figure 6 shows the LFI signal corresponding to out-of-plane displacement Δz of the grating. Figure 6a presents the voltage signal obtained from the Z-axis sensor monitor of the stage controller. Figure 6b shows the corresponding LFI signal. It can be seen that the experimental results agree well with the theoretical and simulation analysis.
3.2. Sequential Measurement of In-Plane and Out-of-Plane Displacements
In order to evaluate the performance of the all-fiber LFI measurement system, reconstructions of in-plane or out-of-plane grating displacements were conducted. First, the two axis stage was controlled to move sinusoidally only in the X-direction at a frequency of 10 Hz. Figure 7 shows the reconstructed results of sinusoidal motion with amplitude (peak to peak) at 4000 nm, 5000 nm, 8000 nm, and 10,000 nm. In order to evaluate the repeatability of the measurement system proposed, repeated displacement measurements were performed. Table 1 reveals the repeatability of in-plane displacement measurement. Eight measurements were taken for each displacement, and their statistical distributions were analyzed. The mean and standard deviation (SD) of each set of measurements are also given in Table 1.
Second, the two-axis nano-positioning stage was controlled to move only in the Z-direction with amplitude (peak to peak) at 4000 nm, 5000 nm, 8000 nm, and 10,000 nm. The reconstructed results are shown in Figure 8. Similarly, Table 2 presents the repeatability of the measurements in the Z-direction. From above measurement results, it can be seen that the in-plane and out-of-plane displacements could be measured sequentially with rather satisfying precision and repeatability using the proposed all-fiber system with a grating.
4. Discussion
4.1. Measurement Sensitivity
On the basis of Equation (2) and Equation (4), the measurement sensitivity of in-plane and out-of-plane displacements can be written as:
It can be seen that the measurement sensitivity of in-plane displacement Sx is only dependent on the grating pitch p, while the sensitivity of out-of-plane displacement Sz depends on both the grating pitch p and the laser wavelength λ. In our experiments, the grating pitch was 1.667 μm and the laser wavelength was 1550 nm. Thus, Sx = 0.216°/nm and Sz = 0.411°/nm could be obtained from Equations (23) and (24).
4.2. Measurement Error
From Equation (21), it can be seen that the theoretical measurement error of the in-plane displacement |Δx| is determined by the error of grating pitch |Δp| and error of extracted phase |Δφgx|, which can be expressed as:
Similarly, the theoretical error of the out-of-plane displacement |Δz| is influenced by the error of grating pitch |Δp|, the error of extracted phase |Δφgz|, and the wavelength variation |Δλ|, which can be deduced from Equation (22).
Table 3 provides the theoretical measurement error of our system at displacement x = 1000 nm or z = 1000 nm. It can be seen that, when |Δp| and |Δφgx| (or |Δφgz|) are better than 1 nm and 1°, and the wavelength variation is better than 1 nm, the theoretical error of in-plane displacement |Δx| can be better than 5.23 nm, and the theoretical error of out-of-plane displacement |Δz| can be better than 5.84 nm.
4.3. Measurement Speed
As shown above, the phase was extracted from the first harmonic and the second harmonic of the modulated LFI signal. The occurrence of measurement error due to band overlapping in the frequency domain should be considered. The first harmonic and the second harmonic centered at fm and 2fm presented a spectral width proportional to the maximum velocity of the external target. To avoid overlapping problems, φg(t) can only have spectral components limited to fm/2, which can be expressed as:
Substituting Equations (2) and (4) into Equation (27), the following relationships can be obtained:
where vx and vz are the velocity of the in-plane and out-of-plane displacement, respectively. It can be seen that the maximum measurable velocity of the in-plane displacement depends on the grating pitch and the modulation frequency, while the maximum measurable velocity of the out-of-plane displacement relies on the laser wavelength, grating pitch, and the modulation frequency.
5. Conclusions
In summary, we proposed an all-fiber LFI based on a reflection grating for sequential measurement of in-plane and out-of-plane displacements without changing the optical arrangement. The in-plane displacement is traceable to the grating pitch, while the out-of-plane displacement depends on the grating pitch and the laser wavelength. A series of experiments were performed to demonstrate the performance of our proposed system. Theoretical analysis showed that the measurement precision of the system could achieve p/318 in in-plane sensing and p/285 in out-of-plane sensing. The measurement precision can be improved by further refining the system’s electronics and mechanics. This method has advantages such as high sensitivity and a compact structure. It can be a useful sensor to monitor the displacement and vibration of the precision motorized stage in a wide variety of research applications. Considering more industrial applications, our further research will focus on the simultaneous measurement of in-plane and out-of-plane displacements using an all-fiber LFI based system.
Author Contributions
Conceptualization, D.G., Z.X. and W.X.; methodology, M.Z.; software, J.L. and M.Z.; validation, D.G.; writing—original draft preparation, Z.X.; writing—review and editing, D.G., Z.X. and W.X.; visualization, D.G.; supervision, D.G. and W.X.; project administration, D.G.; funding acquisition, D.G. All authors have read and agreed to the published version of the manuscript.
Funding
This work was supported by the National Natural Science Foundation of China (51875292).
Institutional Review Board Statement
Not applicable.
Informed Consent Statement
Not applicable.
Data Availability Statement
Not applicable.
Conflicts of Interest
The authors declare no conflict of interest.
References
- Donati, S. Developing self-mixing interferometry for instrumentation and measurements. Laser Photonics Rev. 2012, 6, 393–417. [Google Scholar] [CrossRef]
- Wang, Y.; Zhu, K.; Lu, Y.; Zhang, S.; Tan, Y. Laser Scanning Feedback Imaging System Based on Digital Micromirror Device. IEEE Photonics Lett. 2020, 32, 146–149. [Google Scholar] [CrossRef]
- Chen, J.; Zhu, H.; Xia, W.; Guo, D.; Hao, H.; Wang, M. Self-mixing birefringent dual-frequency laser Doppler velocimeter. Opt. Express 2017, 25, 560–572. [Google Scholar] [CrossRef] [PubMed]
- Lim, Y.L.; Kliese, R.; Bertling, K.; Tanimizu, K.; Jacobs, P.A.; Rakic, A.D. Self-mixing flow sensor using a monolithic VCSEL array with parallel readout. Opt. Express 2010, 18, 11720–11727. [Google Scholar] [CrossRef] [PubMed]
- Liu, B.; Ruan, Y.; Yu, Y. All-fiber Laser-self-mixing Sensor for Acoustic Emission Measurement. J. Light. Technol. 2021, 39, 4062–4068. [Google Scholar] [CrossRef]
- Liu, B.; Ruan, Y.; Yu, Y.; Xi, J.; Guo, Q.; Tong, J. Laser self-mixing fiber Bragg grating sensor for acoustic emission measurement. Sensors 2018, 18, 1956. [Google Scholar] [CrossRef] [PubMed]
- Zhu, D.; Zhao, Y.; Tu, Y.; Li, H.; Xu, L.; Yu, B.; Lu, L. All-fiber laser feedback interferometer using a DBR fiber laser for effective sub-picometer displacement measurement. Opt. Lett. 2021, 46, 114–117. [Google Scholar] [CrossRef] [PubMed]
- Zhu, K.; Guo, B.; Lu, Y.; Zhang, S.; Tan, Y. Single-spot two-dimensional displacement measurement based on self-mixing interferometry. Optica 2017, 4, 729–735. [Google Scholar] [CrossRef]
- Gu, J.; Cao, X.Y.; Fu, Y.; He, Z.W.; Yin, Z.J.; Yin, H.L.; Chen, Z.B. Experimental measurement-device-independent type quantum key distribution with flawed and correlated sources. Sci. Bull. 2022, 67, 2167–2175. [Google Scholar] [CrossRef] [PubMed]
- Xie, Y.M.; Lu, Y.S.; Weng, C.X.; Cao, X.Y.; Jia, Z.J.; Bao, Y.; Wang, Y.; Fu, Y.; Yin, H.L.; Chen, Z.B. Breaking the Rate-Loss Bound of Quantum Key Distribution with Asynchronous Two-Photon Interference. PRX Quantum 2022, 3, 020315. [Google Scholar] [CrossRef]
- Wang, Y.F.; Li, Y.H.; Xu, X.; Tian, M.W.; Zhu, K.Y.; Tan, Y.D. All-fiber laser feedback interferometry with 300 m transmission distance. Opt. Lett. 2021, 46, 821–824. [Google Scholar] [CrossRef] [PubMed]
- Zhao, Y.K.; Wang, C.C.; Zhao, Y.Y.; Zhu, D.S.; Lu, L. An All-Fiber Self-Mixing Range Finder With Tunable Fiber Ring Cavity Laser Source. J. Light. Technol. 2021, 39, 4217–4224. [Google Scholar] [CrossRef]
- Guardalben, M.J. Littrow angle method to remove alignment errors in grating pulse compressors. Appl. Opt. 2008, 47, 4959–4964. [Google Scholar] [CrossRef] [PubMed]
- Cheng, F.; Fan, K. Linear diffraction grating interferometer with high alignment tolerance and high accuracy. Appl. Opt. 2011, 50, 4550–4556. [Google Scholar] [CrossRef] [PubMed]
- Dragic, P.D. Analytical model for injection-seeded erbium-doped fiber ring lasers. IEEE Photonics Technol. Lett. 2005, 17, 1629–1631. [Google Scholar] [CrossRef]
- Shi, L.; Guo, D.; Cui, Y.; Hao, H.; Xia, W.; Wang, Y.; Ni, X.; Wang, M. Design of a multiple self-mixing interferometer for a fiber ring laser. Opt. Lett. 2018, 43, 4124–4127. [Google Scholar] [CrossRef] [PubMed]
- Lu, L.; Yang, J.; Zhai, L.; Wang, R.; Cao, Z.; Yu, B. Self-mixing interference measurement system of a fiber ring laser with ul-tra-narrow linewidth. Opt. Express 2012, 20, 8598–8607. [Google Scholar] [CrossRef] [PubMed]
Figure 1.
Schematic diagram of an all-fiber LFI with a reflection grating. WDM, wavelength division multiplexer; EDF, erbium-doped fiber; ISO, fiber optic isolator; FBG, fiber Bragg grating; PD, photodetector; CL, collimator lens.
Figure 1.
Schematic diagram of an all-fiber LFI with a reflection grating. WDM, wavelength division multiplexer; EDF, erbium-doped fiber; ISO, fiber optic isolator; FBG, fiber Bragg grating; PD, photodetector; CL, collimator lens.

Figure 2.
Simulation results of the LFI signal corresponding to in-plane displacement Δx (8000 nm p–p). (a) The simulated displacement of Δx. (b) The simulated LFI signal.
Figure 2.
Simulation results of the LFI signal corresponding to in-plane displacement Δx (8000 nm p–p). (a) The simulated displacement of Δx. (b) The simulated LFI signal.

Figure 3.
Simulation results of the LFI signal corresponding to out-of-plane displacement Δz (7000 nm p–p). (a) The simulated displacement of Δz. (b) The simulated LFI signal.
Figure 3.
Simulation results of the LFI signal corresponding to out-of-plane displacement Δz (7000 nm p–p). (a) The simulated displacement of Δz. (b) The simulated LFI signal.

Figure 4.
Experimental setup of an all-fiber LFI for displacement sensing.

Figure 5.
Experimental results of the LFI signal corresponding to in-plane displacement Δx (8000 nm p–p). (a) The voltage obtained from the sensor monitor corresponding to displacement Δx. (b) Experimental LFI signal.
Figure 5.
Experimental results of the LFI signal corresponding to in-plane displacement Δx (8000 nm p–p). (a) The voltage obtained from the sensor monitor corresponding to displacement Δx. (b) Experimental LFI signal.

Figure 6.
Experimental results of the LFI signal corresponding to out-of-plane displacement Δz (7000 nm p–p). (a) The voltage obtained from the sensor monitor corresponding to displacement Δz. (b) Experimental LFI signal.
Figure 6.
Experimental results of the LFI signal corresponding to out-of-plane displacement Δz (7000 nm p–p). (a) The voltage obtained from the sensor monitor corresponding to displacement Δz. (b) Experimental LFI signal.

Figure 7.
Reconstructed results of the sinusoidal motion of grating only in X-direction with amplitude (p–p) at 4000 nm, 5000 nm, 8000 nm, and 10,000 nm.
Figure 7.
Reconstructed results of the sinusoidal motion of grating only in X-direction with amplitude (p–p) at 4000 nm, 5000 nm, 8000 nm, and 10,000 nm.

Figure 8.
Reconstructed results of the sinusoidal motion of grating only in the Z-direction with amplitude (p–p) at 4000 nm, 5000 nm, 8000 nm, and 10,000 nm.
Figure 8.
Reconstructed results of the sinusoidal motion of grating only in the Z-direction with amplitude (p–p) at 4000 nm, 5000 nm, 8000 nm, and 10,000 nm.


Table 1.
Measurement results of in-plane displacement Δx.
| Δxp-p (nm) | 4000 | 5000 | 8000 | 10,000 |
|---|---|---|---|---|
| 1st | 4047 | 4968 | 7994 | 10,031 |
| 2nd | 4051 | 5008 | 7993 | 10,001 |
| 3rd | 4042 | 4964 | 7982 | 9992 |
| 4th | 4031 | 4980 | 7970 | 9981 |
| 5th | 4041 | 4948 | 7916 | 9948 |
| 6th | 4003 | 5032 | 7947 | 9998 |
| 7th | 4019 | 5047 | 7939 | 9995 |
| 8th | 4026 | 4986 | 7949 | 10,029 |
| Mean | 4032.5 | 4994.63 | 7961.25 | 9996.87 |
| SD | 16.09 | 34.55 | 27.98 | 26.41 |
Table 2.
Measurement results of out-of-plane displacement Δz.
| Δzp-p (nm) | 4000 | 5000 | 8000 | 10,000 |
|---|---|---|---|---|
| 1st | 3949 | 4983 | 7934 | 9973 |
| 2nd | 3956 | 4913 | 7926 | 9918 |
| 3rd | 3939 | 4964 | 7947 | 9949 |
| 4th | 3953 | 4909 | 7981 | 9969 |
| 5th | 3910 | 4978 | 7923 | 9944 |
| 6th | 3960 | 4911 | 8006 | 9850 |
| 7th | 3919 | 4960 | 7922 | 9946 |
| 8th | 3962 | 4910 | 8016 | 9928 |
| Mean | 3943.5 | 4941 | 7956.88 | 9934.97 |
| SD | 19.39 | 33.15 | 38.59 | 38.62 |
Table 3.
Theoretical measurement error.
| Error of Parameters | |Δx| | |Δz| | |
|---|---|---|---|
| |Δφgx| (or |Δφgz|) | 1° | 4.63 nm | 4.86 nm |
| |Δp| | 1 nm | 0.60 nm | 0.16 nm |
| |Δλ| | 1 nm | --- | 0.82 nm |
| Total error | --- | 5.23 nm | 5.84 nm |
Disclaimer/Publisher’s Note: The statements, opinions and data contained in all publications are solely those of the individual author(s) and contributor(s) and not of MDPI and/or the editor(s). MDPI and/or the editor(s) disclaim responsibility for any injury to people or property resulting from any ideas, methods, instructions or products referred to in the content. |
© 2023 by the authors. Licensee MDPI, Basel, Switzerland. This article is an open access article distributed under the terms and conditions of the Creative Commons Attribution (CC BY) license (https://creativecommons.org/licenses/by/4.0/).
Share and Cite
MDPI and ACS Style
Xie, Z.; Zhang, M.; Li, J.; Xia, W.; Guo, D. All-Fiber Laser Feedback Interferometry for Sequential Sensing of In-Plane and Out-of-Plane Displacements. Photonics 2023, 10, 480. https://doi.org/10.3390/photonics10040480
AMA Style
Xie Z, Zhang M, Li J, Xia W, Guo D. All-Fiber Laser Feedback Interferometry for Sequential Sensing of In-Plane and Out-of-Plane Displacements. Photonics. 2023; 10(4):480. https://doi.org/10.3390/photonics10040480
Chicago/Turabian StyleXie, Zhanwu, Meng Zhang, Jie Li, Wei Xia, and Dongmei Guo. 2023. "All-Fiber Laser Feedback Interferometry for Sequential Sensing of In-Plane and Out-of-Plane Displacements" Photonics 10, no. 4: 480. https://doi.org/10.3390/photonics10040480
Note that from the first issue of 2016, this journal uses article numbers instead of page numbers. See further details here.