A Polarized Structured Light Method for the 3D Measurement of High-Reflective Surfaces
by
 , , ,
, , ,
Jixin Liang
1,2,† ,
,
Yuping Ye
1,†,
Feifei Gu
1,3,†,
Jiankai Zhang
1,
Juan Zhao
1,3 and
Zhan Song
1,3,* 1
Shenzhen Institute of Advanced Technology, Chinese Academy of Sciences, Shenzhen 518055, China
2
College of Engineering, Southern University of Science and Technology, Shenzhen 518055, China
3
The Department of Mechanical and Automation Engineering, The Chinese University of Hong Kong, Hong Kong 999077, China
*
Author to whom correspondence should be addressed.
†
These authors contributed equally to this work.
Photonics 2023, 10(6), 695; https://doi.org/10.3390/photonics10060695
Submission received: 4 May 2023
/
Revised: 4 June 2023
/
Accepted: 6 June 2023
/
Published: 19 June 2023
(This article belongs to the Special Issue Optical Imaging and Measurements)
Abstract
:The reflection phenomenon exhibited by highly reflective surfaces considerably affects the quality of captured images, thereby rendering the task of structured light (SL) 3D reconstruction. In this paper, a polarized SL method is proposed to address the reconstruction issues on high-reflectance surfaces. The SL system we build in this paper involves a four-channel polarizing camera and a digital light processing (DLP) projector equipped with a polarizer in the lens. The built system enables the simultaneous acquisition of four groups of fringe images, each with different brightness differences. Then, a binary time-multiplexing SL method is adopted to obtain four distinct point clouds. Additionally, a fusion algorithm is proposed to merge the four point clouds into a single, precise, and complete point cloud. Several experiments have been conducted to demonstrate that the proposed method is capable of achieving excellent reconstruction outcomes on highly reflective surfaces.
1. Introduction
As a crucial component of computer vision, 3D reconstruction technology has been rapidly developed and has gained widespread applications in various fields, such as intelligent terminal, biomedical, mechanical manufacturing, and virtual reality [1,2]. Among vision-based 3D reconstruction methods, the typical time-coded SL system consists of a projector and a camera. The projector projects a pre-coded fringe pattern onto the surface of object, and the camera captures a series of images with pattern illuminations [3,4]. The feature points of camera and projector were matched by decoding method, and the 3D information of the object’s surface is calculated by triangulation based on the calibration results [5,6]. The time-multiplexing SL method is capable of attaining both high accuracy and dense point clouds, therefore, it has a high application value in industrial inspections due to its high precision and high reconstruction density [7].
In industrial manufacturing, there are a large number of samples with highly reflective surfaces such as metal workpieces, and the highly reflective phenomenon caused by the projected light will make the projected stripes blur in the camera field of view, which will seriously affect the accuracy of 3D reconstruction and lead to irreversible loss of measurement information. Therefore, finding ways to suppress and eliminate the highly reflective phenomenon becomes a difficult problem that needs to be addressed in SL 3D reconstruction.
For the problem of highlight in SL method, the existing solutions mainly include adaptive projection intensity, multiple exposures, multi-view method, and the use of optical filters [8,9,10,11,12]. These methods can alleviate the reconstruction issue caused by high-reflective surfaces to some extent. However, the adaptive projection intensity, multiple exposure, and multi-view methods all require multiple acquisitions under different conditions, which are time-consuming and have complex algorithms. In contrast, using an optical filter such as a polarizer, which suppresses highlight areas from an optical imaging perspective, can avoid multiple scans of highly reflective surfaces.
In this paper, an SL 3D reconstruction method of high reflectance surface using polarized light technique is proposed. The SL system employed in this study comprises a DLP fitted with a fixed-angle linear polarizer and a four-channel polarizing camera. The striped images of the four polarization channels with brightness differences are acquired by the SL scanning. Then, a binary code time-multiplexing SL method is adopted to obtain four distinct point clouds. The weight map is generated based on the four texture maps and depth maps to guide the point cloud fusion, and the best points are selected from the four point clouds to smooth the missing parts by the point cloud smoothing and noise reduction strategy. Finally, a precise and complete point cloud is obtained with a single scan, which has advantages in terms of time and precision.
The organization of this paper is as follows. Related SL methods are briefly reviewed in Section 2. A detailed introduction of our polarized SL method is presented in Section 3. Experimental results are provided in Section 4. Discussion for our polarized SL method is displayed in Section 5. Conclusions are offered in Section 6.
2. Related Work
In SL scanning, a pre-designed fringe pattern is actively projected onto the target surface, and the camera captures the image with the corresponding fringe information for 3D reconstruction. The commonly used sinusoidal coded stripes and gray code combined with phase-shift encoded stripes are all based on the projection intensity [13]. However, the periodic change in illumination intensity caused by these stripes results in blurred fringe information when the surface reflectance is uneven. To address this issue, a binary fringe based on Gray code combined with line shift coding has been proposed [14], which is independent of fringe intensity and shows better robustness against uneven surface reflectance. Nonetheless, highly reflective surfaces can cause overexposure in the camera image, leading to the loss of fringe information.
There are many solutions for the problem of SL scanning on surfaces with high reflectivity. In [8], a method based on camera response function, which adaptively adjusts the pixel-level intensity of projected fringe pattern according to the reflectivity of object surface, is proposed to deal with the highlight surface.This method can effectively improve the image quality of fringe, but it takes a lot of time to extract the reflectance information of object surface and calculate the projection intensity. In [9], the binary line shift fringe pattern is projected multiple times under different exposure times, and the fringe images at different exposure times are fused into well-exposed fringe images with the high dynamic range (HDR) image fusion technology for three-dimensional reconstruction. This method can also reconstruct a relatively complete point cloud, but the selection of multiple exposure times is based on experience, and multiple exposure increases the scanning time. In [10], a binocular SL system is proposed to process highly reflective surface, different angles of cameras on both sides are used to avoid specular reflection on the same surface, and highlight areas are detected separately, therefore, two point clouds can be reconstructed for splicing and fusion. Although this method can improve the reconstruction effect of the point cloud, it does not directly solve the highlight problem, and the outcome is not good for some free-form high-reflectance surfaces. In [11], a transparent screen is placed in front of the camera and the intensity of its corresponding screen pixels is adjusted according to the camera response function, which can improve the dynamic range of the camera and weaken the influence of highlights in structural light scanning. This method is equivalent to adding an optical filter to deal with the problem of high reflection. In [12], the difference in sensitivity efficiency of monochromatic laser under the RGB channel of color sensor is used to obtain images with different brightness values, which are fused to obtain images with high dynamic range for reconstruction. This method utilizes optical filters on the color sensor and HDR technology to accomplish high-dynamic-range 3D reconstruction.
Polarized light technology has been widely used in computer vision. This technology is to filter random vibration light signals into light signals that vibrate regularly along the polarization direction through polarization devices, eliminate the impact of stray reflected light on camera imaging, and achieve the removal of highly reflective areas [15]. In [16], a method is proposed to project sinusoidal encoded fringes and collect four groups of fringe images by a four-channel polarization camera. Through traversing the pixels of the four channel images, the appropriate channels were selected to enhance the fringe and then three-dimensional reconstruction was performed. However, the channel selection method is random and noise is easy to be introduced during reconstruction. In [17], a method of three-dimensional measurement of the dynamic objects by using the circularly polarized light and polarizing camera is proposed. The method also adopts sinusoidal coding, and speckle will be produced because laser is used as the light source, which will affect the measurement accuracy. In [18], a polarization-based method is proposed to remove image highlight and a normalized weighted algorithm is used to recover the surface information of the highlight region. This method can restore fringe information to complete reconstruction by adjusting the angle of polarizer and multiple exposures. However, the method of manually adjusting polarizer for measurement is difficult to adapt to complex and varied industrial scenes. In [19], a method is proposed to estimate the interval optimal projection intensity according to the camera response function under the polarization system and obtain the optimal fringe image by image fusion method, based on which 3D reconstruction is performed. Although the polarizer is not adjusted in the reconstruction process, the projection intensity is estimated according to the images acquired by multiple projections, which requires a certain preparation time.
3. Methodology
The flow chart and visual pipeline of 3D reconstruction based on our method is shown in Figure 1 and Figure 2. Firstly, the high-reflective target is scanned by our polarized SL system to acquire 4 groups of fringe images. Subsequently, the first channel is utilized to calibrate the projector and camera, and four point clouds can be reconstructed through decoding, the point clouds are then registered to the spatial coordinate system of the first channel. Then, a weight map is computed based on the texture and depth maps to guide the preliminary point cloud fusion. Further, suitable points are selected from the four point clouds to ensure the smooth completion of missing parts. Ultimately, a complete fused point cloud with high quality is generated, integrating information from all four channels.
3.1. Binary Coding Polarized SL System
Light is an electromagnetic wave, the direction of electric and magnetic fields are mutually perpendicular to the direction of light propagation. This phenomenon can be mathematically represented as follows:
where is the instantaneous intensity, is amplitude, is angular velocity, t is time, is initial phase, is the number of wavelengths of light contained in cycles, is the position.
As shown in Figure 3, it can be assumed that the linear polarizer is composed of regular thin metal wire arrays parallel to each other. Under the condition of sufficiently thin wires, electrons are constrained to move along a single direction, and only the electromagnetic field components in the same direction as the linear polarizer do work on the electrons. As a result, the energy of the incident light undergoes attenuation and eventually causes the light to vibrate solely in a single plane. Consequently, when a beam of polarized light traverses a polarizer:
where is intensity of polarized light passing through a polarizer, is original intensity of polarized light, is the angle between the polarized light and the polarizer.
As shown in Figure 4, a linear polarizer is placed in front of the lens of a DLP projector, hence the projector will project linear polarizing light with a fixed polarization angle. The polarizer array is located above the CMOS photographic array in the system’s polarizing camera. In this way, adjacent pixels receive only light with a fixed polarization state. After adjusting the angle of the polarizer such that it is not perpendicular to the four polarization channels of the polarizing camera, fringe patterns are projected by the projector, so the polarizing camera can capture four sets of images distinguished by varying degrees of luminance and shade through a single shot. Since the image resolution of all the four channels is the same, any channel of the polarization camera can be selected to calibrate the camera and projector. In this paper, the first channel is selected for calibration. By decoding the fringe patterns obtained, point clouds of four polarization channels can be reconstructed on the basis of the calibrated parameters.
3.2. Point Cloud Registration
The acquired images from the four polarization channels are generated by splicing separated pixels, respectively, resulting in the image information being acquired in a discontinuous manner. This leads to a pixel offset in the images of the four channels when capturing the same target. Such a phenomenon not only undermines the accurate detection of checkerboard corners and disrupts the calibration parameters of the four channels, but also affects the positioning and decoding of projected fringes. It is worth noting that the projected stripes are strictly vertical, thus, any pixel shift has a particularly severe impact on the channels with horizontal pixel deviation.
As mentioned in Section 3.1, the 3D reconstruction of our method is based on the calibration parameters of the first channel. According to the distribution of the polarizer array, the second and fourth channels have horizontal pixel deviation from the first channel, and the third channel has vertical pixel deviation from the first channel. Therefore, when decoding the fringe images in the second and fourth channels, horizontal pixel offset will occur in the positioning of fringe edges, resulting in spatial displacement of point clouds. As shown in the Figure 5, the point cloud of the second channel and the fourth channel has obvious spatial displacement with the first channel, while the point cloud of the third channel is almost in the same coordinate system with the first channel.
According to the above analysis, point cloud registration should be used to align the position of point clouds. The specific steps are as follows:
- (1)
- Use the system to scan a calibration plate and output four point clouds according to pixel array. The missing positions were recorded with identifiers;
- (2)
- Traversing according to pixel array, only the pixels with 4 effective points are retained, and 4 point clouds are stored, respectively;
- (3)
- Point clouds of the other three polarization channels are registered with the first polarization channel, respectively.
For any two point clouds in the space, the following relationships exist:
where is the rotation matrix, is the translation vector.
Translated into an optimization problem:
Define the point cloud centroid:
Finally, the optimization function can be simplified as:
Since both terms of the optimization function are values greater than or equal to zero, and the first term is only related to the rotation matrix , it is feasible to initially obtain the rotation matrix by solving the minimum value of the first term. Thereafter, by substituting the obtained rotation matrix into the second term, the translation vector can be determined. With the aid of the rotation matrix and the translation vector , the point clouds of diverse polarization channels can be converted into the same coordinate system to eliminate the point cloud migration stratification problem caused by pixel migration.
3.3. Point Cloud Fusion
SL scanning is a 3D reconstruction technology based on vision, and the generated point cloud corresponds to the pixel of the texture map one by one. Therefore, the point cloud fusion strategy in this paper is based on the four texture maps collected and the depth map of the reconstructed point cloud, to calculate the fusion weight map for the preliminary selection of points, and then smooth filling of the missing parts.
The accurate positioning of fringe edges is crucial for achieving precise 3D reconstruction in SL scanning technology. Failure to locate these edges precisely can result in the loss of point cloud information or noise generated by reconstruction errors. When the projection light falls on a highly reflective surface, irregular scattering can occur, leading to overexposed highlights that obscure the projection fringe. Similarly, in dark or black areas, the projection fringes may be difficult to distinguish accurately. To address the challenge of unclear fringe patterns in overexposed or underexposed regions, this paper draws on the principle of image exposure fusion. Specifically, the optimal pixel with normal gray value and rich details from multiple images is selected to represent the same position in the reconstructed image [20].
According to prior knowledge, a gray value of 0 is usually in the overly dark region, while a gray value of 255 is usually in the overexposed region. Therefore, the Gaussian model can be used to extract the well-exposed region:
where is brightness weight, is gray value, is default value of well-exposed, is variance. Usually, .
For over-exposed and over-dark areas, these areas are usually smooth and have low contrast due to lack of detailed information. Therefore, image gradient can be used to extract detailed areas:
where is contrast weight, I is image, is Laplacian operator.
Considering moderate brightness and rich texture details, the initial weight is the superposition of brightness weight and contrast weight. In order to select the optimal pixel, the largest weight value in the ownership remap can be set to 1, and the rest can be set to 0, so as to regenerate the optimal weight map:
where is initial weight, is optimal weight.
The initial weight map in image fusion only considers the information of individual pixels, leading to the presence of scattered and chaotic points that can result in rough and uneven fusion results. To address this issue, guided filtering is employed as a filter model with edge protection. Guided filtering is capable of smoothing regions with low gradient while retaining areas with rich texture information, resulting in a more refined and visually appealing fusion result [21]. The texture map can be used as a guide map to smoothly remove the messy scatter points of the weight map:
where is the weight map after guided filtering.
The depth distribution of the point cloud is expressed according to the depth map generated by the reconstructed point cloud, and the existence of the point cloud information can be expressed by binarizing the depth map, which is equivalent to a mask. Then, the final weight map of fusion is as follows:
where is final weight, is depth image.
The weight map generated in the fusion process is utilized to select corresponding spatial points from the four point clouds for preliminary fusion based on the pixel array. However, due to the filtering effect of the guide filter and depth map, the effective pixels of the weight map do not cover the entire pixel array. To ensure a smooth and complete surface for the final fusion point cloud, the best points from the four point clouds for smoothing and completing the missing parts based on a smoothing and noise reduction strategy [22].
In a sets of point clouds, a three-dimensional surface is composed of discrete points. To ensure accurate reconstruction, the normal vector of each point must be perpendicular to the tangent plane of the surface at that point. In the local neighborhood with the point as the vertex, the surface can be approximated as a small plane. The degree of local smoothness is inversely related to the degree of vertex protrusion relative to the surrounding points. Therefore, point cloud smoothing and denoising algorithms typically remove such outliers. Approximately, the problem of finding the best fusion point can be transformed into the problem of finding the closest point from the four point cloud to the surface fitting plane, that is, the problem of eliminating outliers.
Firstly, points in the vertex neighborhood are used to fit a plane parallel to the tangent plane of the surface. Suppose the equation of the fitting plane is as follows:
Therefore, the point fitting plane problem can be transformed into an optimization problem:
where is a set of surrounding neighborhood points.
After the fitting plane equation is obtained, the distance between the four points to be selected and the plane can be calculated, respectively, that is, the distance from the plane along the direction of the normal vector:
where is The distance from the point to the plane.
At this time, the point closest to the plane is the point that minimizes the curvature of the neighborhood. Taking this point as the fusion point, the missing part of the weight graph can be completely and smoothly supplemented.
4. Experimental Results
As shown in Figure 6, the polarized SL system constructed in this paper consists of a polarizing camera (Daheng, Shenzhen, China, MER2-503-36U3M POL, resolution pixels, 4 polarization channels ) and a DLP projecotor (TI3010DMD, resolution ). A polarizer with adjustable angles is installed in front of the projector. The projector projects 18 binary fringe patterns to the surface of the measured target in sequence, triggers the camera to collect fringe patterns, divides and splicing them into 4 groups of 18 fringe patterns for reconstruction. The experiments were conducted indoors under normal light, and the system was fixed on an optical platform with a working distance of 265 mm and a projected field of vision of 150 mm × 120 mm. Additionally the fusion algorithm is deployed on GPU (Nvidia, CA, USA, GeForce RTX 3070).
As discussed in Section 3.1, the polarization angle of the polarizer should not be perpendicular to the four polarization channels of the polarizing camera, to make brightness difference in the images of the four channels. Through calculating transmittance of the polarized light pass through the four channels of the polarizing camera, as presented in Table 1, selecting as projector polarization angle of polarizer.
The binary coding strategy is based on our previous work [23], which employed Gray-code combined with a line-shifting pattern. As shown in Figure 7, the first ten illuminated patterns are Gray-code patterns used to construct 256 subregions, each with a unique code word. The last eight are thin stripe patterns with a width of four pixels, which will shift eight times to encode a position within each subregion.
4.1. Analysis of Point Cloud Registration
As shown in Table 2, the reconstruction of four point clouds is calculated based on the calibration results of the first polarization channel. As discussed in Section 3.2, pixel migration can adversely affect the position of the reconstructed point cloud and subsequently impede point cloud fusion. To address this issue, the point cloud of the first polarization channel is used as the reference for registering the point clouds of the remaining three polarization channels. Specifically, the point clouds are transformed to the coordinate system of the first polarization channel to mitigate the effects of pixel migration and facilitate accurate point cloud fusion.
As shown in Table 3, the entire rotation matrix is approximately equal to the identity matrix, so there is no significant angular offset in the space of the four point clouds, but only displacement offset, mainly in the z direction. The distance error after registration is shown in Figure 8 and Table 4.
4.2. Point Cloud Fusion
As shown in Figure 9 and Figure 10, we scanned a stainless steel stamping with free-form surface at the exposure time t = 20,000 μs and a sheet of folded aluminum foil at exposure time t = 30,000 μs, and collected images of light and shade difference existing among the following four groups, to reconstruct the four pieces of point cloud, respectively. Because the fringes become blurred in overexposed and overdark areas, the complete point cloud cannot be accurately reconstructed using a single channel.
The point cloud fusion algorithm described in Section 3.3 is adopted to select points of channels with good exposure and rich details for preliminary fusion, and then select appropriate points for smooth completion. The fused point cloud and its corresponding depth map are shown in Figure 11 and Figure 12. It can be seen that the surface of the generated point cloud is smooth and complete, and there are no disordered points, and the stratification phenomenon has been solved due to the point cloud registration. According to the generated depth map, it can be seen that the fused point cloud only has a small amount of deletion at the edge of the pixel array, and there is almost no deletion at the main contour position of the measured target.
Our fusion algorithm is deployed on the GPU, and through parallel processing, the total time is between 50 s and 200 s, which is negligible compared with the exposure time of over 10,000 s. Therefore, compared with the multi-exposure method or multi-view method that requires multiple scans to capture multiple sets of fringe patterns, our method only requires one scan to reconstruct multiple point clouds for fusion, which has a speed advantage.
To evaluate the precision of our method, the reconstructed result of the stainless steel stamping sprayed with white powder is used as the ground truth. By registering the two 3D models, an error map is generated as shown in Figure 13. The absolute mean error is calculated as 0.03 mm with a standard deviation of 0.43 mm.
To better verify the effect of polarization SL system and fusion algorithm, several experiments are conducted in this paper. As shown in Figure 14, we separately scanned a stainless steel stamping at exposure time 30,000 s, a stainless steel bowl at exposure time 20,000 s, and some coins at exposure time 20,000 s.
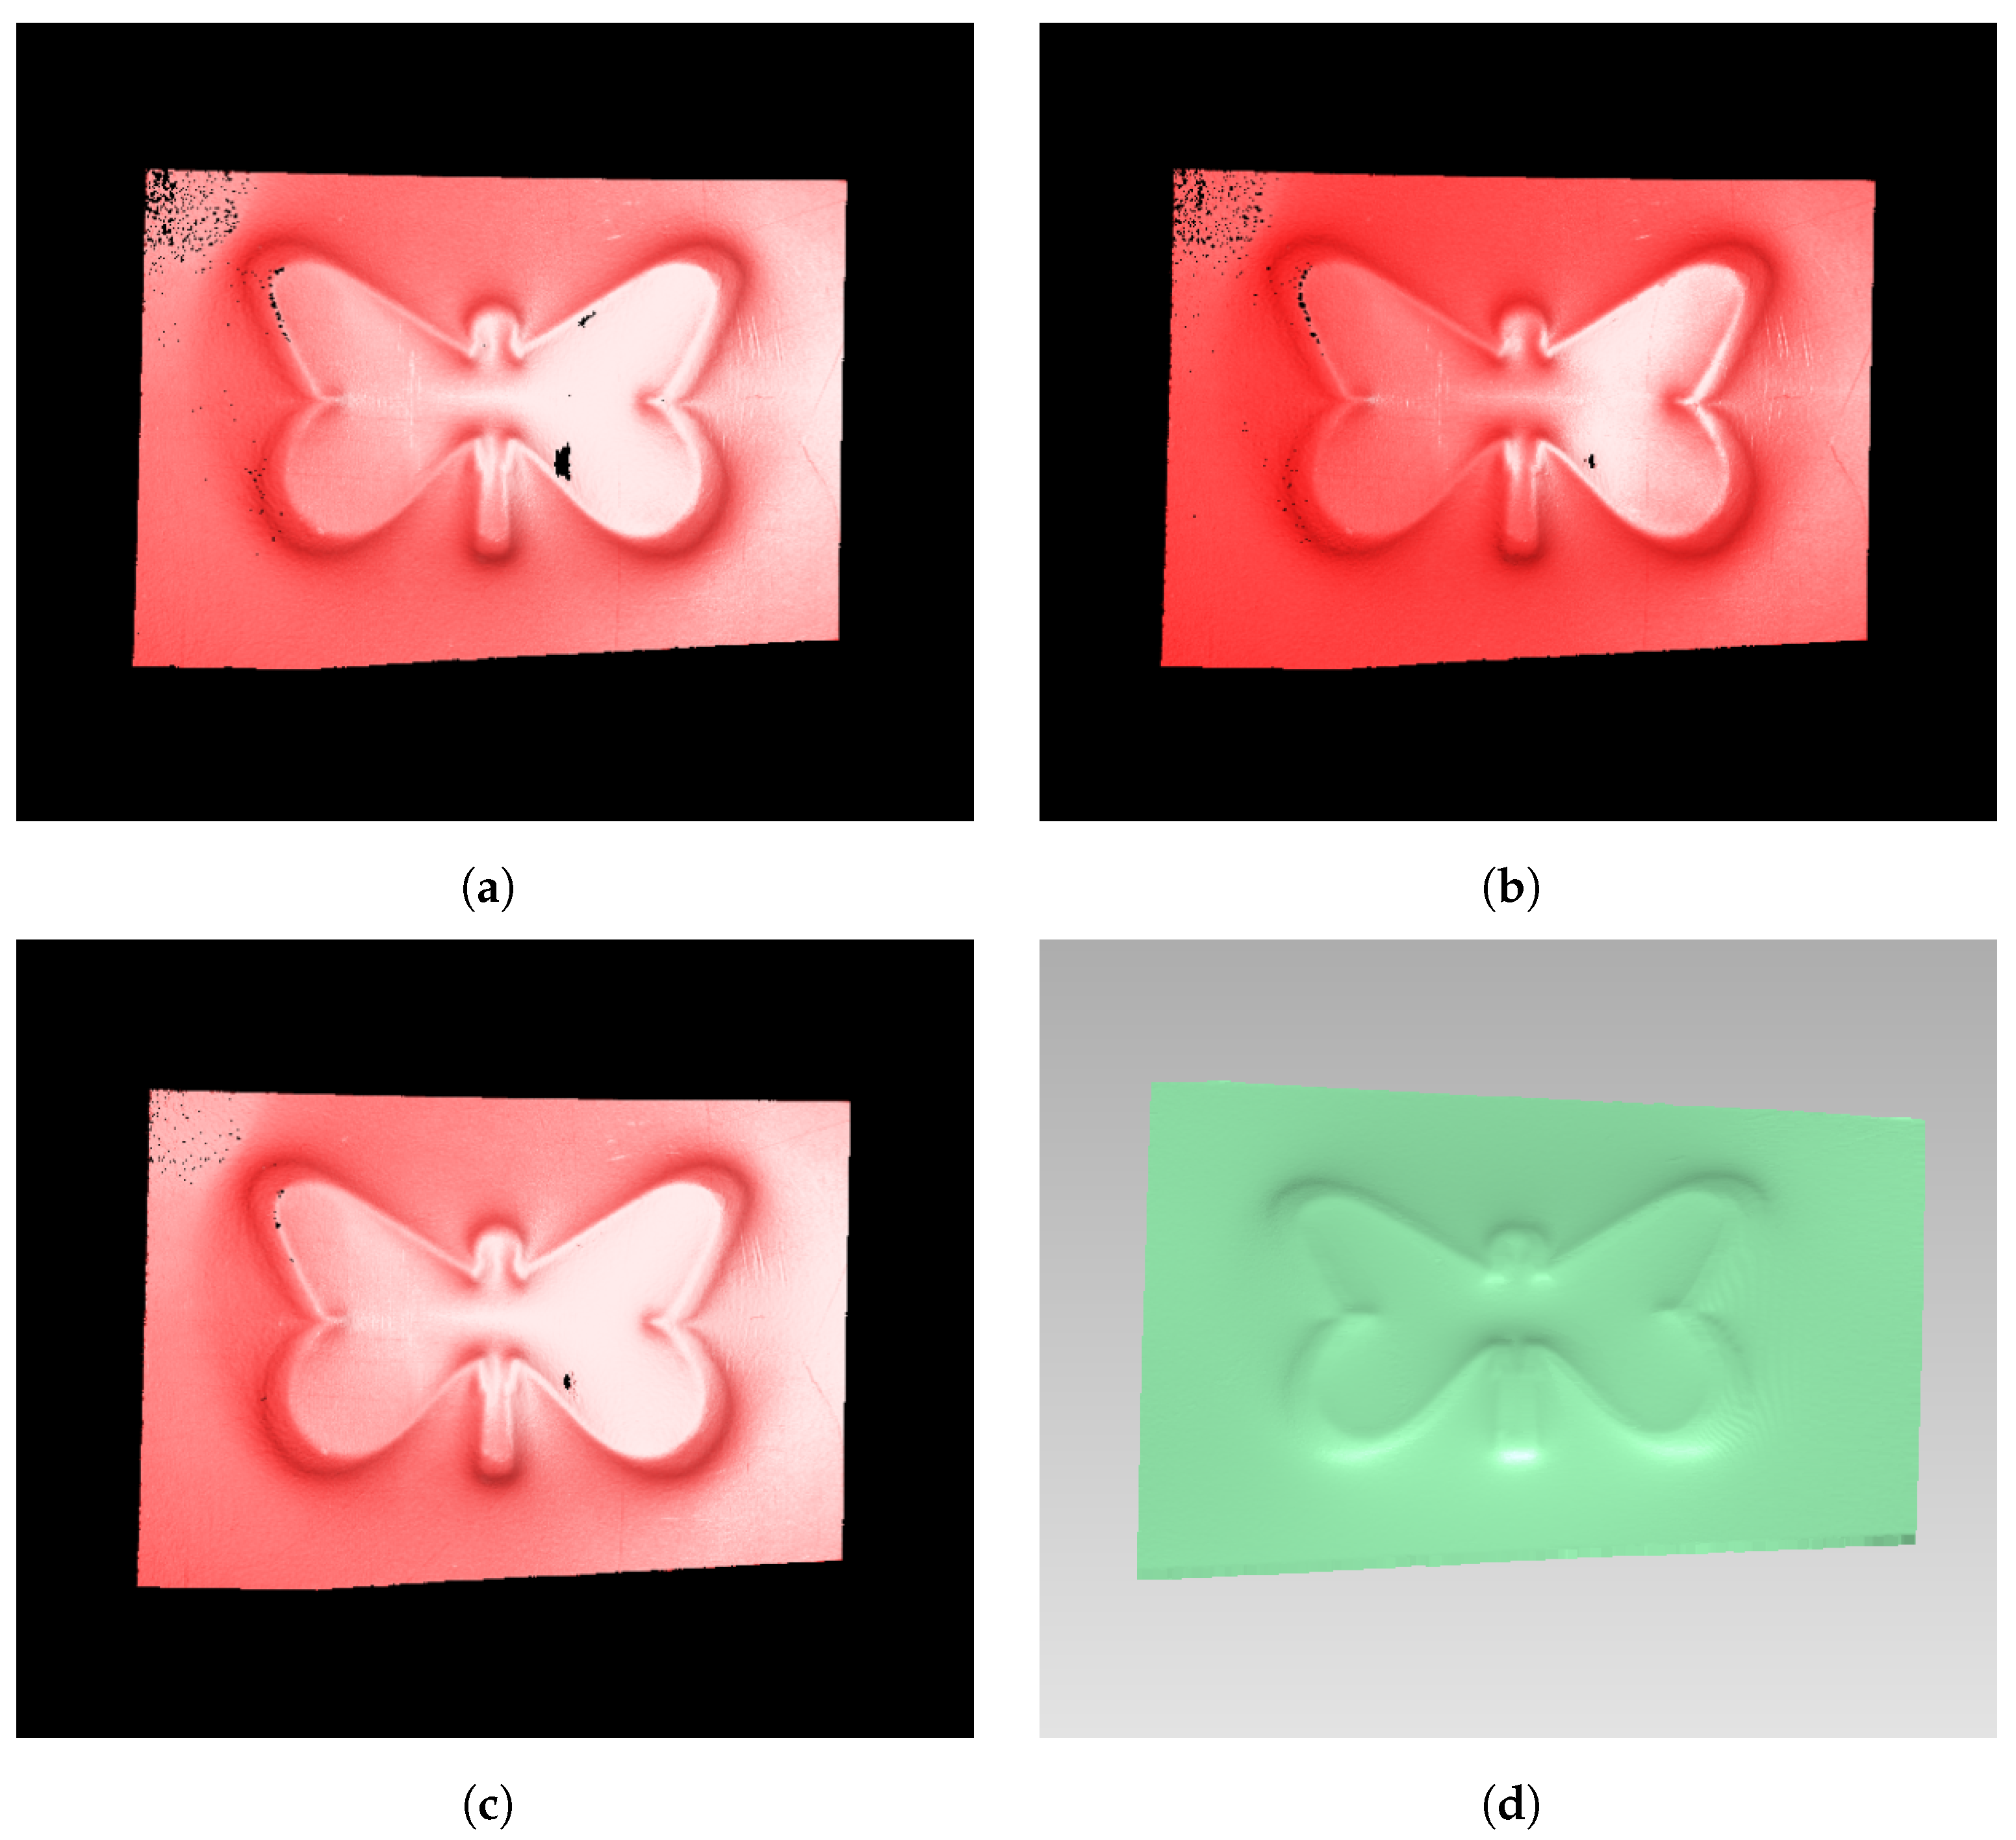
Multi-exposure SL methods are another popular solution for 3D reconstruction of surfaces with high reflectivity [9]. This methods collects fringe images for multiple times under different exposure times and synthesizes well-exposed fringe images through high dynamic range (HDR) image fusion technology for 3D reconstruction. To perform a comparison between the multi-exposure method and the proposed polarization system, we build another SL 3D camera the with same field of view to capture the target as the input of multi-exposure methods. As shown in Figure 15a, it can be seen that there are point clouds missing in single exposure due to the existence of highlight reflection. Although the multi-exposure method proposed by Song [9] can repair the missing part of point cloud to a certain extent as shown in Figure 15b,c, it can not reconstruct the highlighted area. The built polarization system can reconstruct the entire point cloud in one scan, as shown in Figure 15d, which has the advantages of both time and completeness for the 3D measurement of high-reflective surface and can meet the demand of high-speed measurement in industry.
5. Discussion
- (1)
- The polarized SL method proposed in this paper reconstructs four channels of point clouds simultaneously for point cloud fusion by projecting 18 binary-encoded stripe patterns at a time. The method does not require manual adjustment of hardware devices or multiple acquisitions of the target, which has the advantage of speed; it uses polarization technology to suppress high light and directly generates four point clouds for fusion, but fusion, which can achieve complete reconstruction, based on more robust binary-encoded stripe reconstruction with high precision [23] and high-precision registration by calibration plate, it can obtain high-precision fused point clouds. Therefore, this method is capable of fast, complete and high-precision reconstruction of highly reflective surfaces.
- (2)
- The polarized SL method we proposed also has some problems. Firstly, the polarization camera is used to split the four channels to obtain the images, so the resolution of the fringe patterns is decreased, and the number of point clouds is also decreased. Secondly, only the first channel of the polarization camera is used for calibration in this paper, so the phenomenon of pixel deviation is generated. This phenomenon is solved by using high-precision point cloud registration in this paper. In addition, polarization methods rely on spatial multiplexity and sacrifice SNR due to pixelated polarizers, resulting in lower total signal strength at a fixed acquisition time [24]. Using a circular polarizer might alleviate the problem of light intensity reduction.
- (3)
- Next, we will investigate the principles of pixel shifting and continue to improve the speed and robustness of our polarized SL method, applied to dynamic scanning. Additionally, we will reproduce other phase-shift coding methods for highly reflective surfaces and compare them with ours.
6. Conclusions
This paper proposes a 3D reconstruction method for highly reflective surfaces using SL and polarization techniques. Fringe patterns of polarized light are projected at a fixed angle, and the resulting fringe images with different brightness are captured using a 4-channel polarizing camera for 3D reconstruction. However, the polarizing camera images may be affected by pixel migration in the four channels, thus necessitating point cloud registration using a scanning calibration plate. The SL method can suffer from exposed and underexposed pixels, making it difficult to accurately locate the fringe and resulting in point cloud loss. To address this issue, the high dynamic range (HDR) exposure fusion technology is employed to extract the well-exposed areas in the texture map to generate the initial weight map. The guide filter is then used to eliminate the chaotic scattered points in the weight graph, while the depth map is combined with the weight map to generate the final weight map. The weight map is used to select points from the four point clouds for preliminary fusion, and the point cloud smoothing and noise reduction strategy is adopted to fill outliers and select the best points for smoothing and complementing. As a result, a smooth and complete fusion point cloud is obtained. Experimental results on stainless steel stamping parts and aluminum foil paper with highly reflective surfaces demonstrate the effectiveness of the proposed method for 3D reconstruction of highly reflective objects.
Author Contributions
Conceptualization, J.L., Y.Y. and F.G.; Methodology, J.L.; Software, J.L.; Resources, J.Z. (Jiankai Zhang); Writing—original draft, J.L.; Writing—review & editing, Y.Y., F.G., J.Z. (Juan Zhao) and Z.S.; Visualization, J.L.; Supervision, F.G., J.Z. (Juan Zhao) and Z.S.; Project administration, Z.S.; Funding acquisition, J.Z. (Jiankai Zhang) and Z.S. All authors have read and agreed to the published version of the manuscript.
Funding
This research was funded by the Key-Area Research and Development Program of Guangdong Province, grant number 2019B010149002; the National Natural Science Foundation of China (NSFC), grant number 62105352; the Guangdong Basic and Applied Basic Research Foundation, grant number 2021A1515011802; the Shenzhen Science and Technology Program, grant number JSGG20220831092801003; the Shenzhen Science and Technology Program, grant number RCBS20200714114921207; the Shenzhen Fundamental Research Program, grant number JCYJ20190806171403585.
Institutional Review Board Statement
Not applicable.
Informed Consent Statement
Not applicable.
Data Availability Statement
Data is contained within the article.
Conflicts of Interest
The authors declare no conflict of interest.
References
- Ye, Y.; Chang, H.; Song, Z.; Zhao, J. Accurate infrared structured light sensing system for dynamic 3D acquisition. Appl. Opt. 2020, 59, E80–E88. [Google Scholar] [CrossRef]
- Wan, M.; Kong, L.; Peng, X. Single-Shot Three-Dimensional Measurement by Fringe Analysis Network. Photonics 2023, 10, 417. [Google Scholar] [CrossRef]
- Zhang, S. Recent progresses on real-time 3D shape measurement using digital fringe projection techniques. Opt. Lasers Eng. 2010, 48, 149–158. [Google Scholar] [CrossRef]
- Cao, W.; Wang, R.; Ye, Y.; Shi, C.; Song, Z. CSIE: Coded strip-patterns image enhancer embedded in structured light-based methods. Opt. Lasers Eng. 2023, 166, 107561. [Google Scholar] [CrossRef]
- Hartley, R.; Zisserman, A. Multiple View Geometry in Computer Vision; Cambridge University Press: Cambridgeshire, UK, 2003. [Google Scholar]
- Gu, F.; Cao, H.; Xie, P.; Song, Z. Accurate Depth Recovery Method Based on the Fusion of Time-of-Flight and Dot-Coded Structured Light. Photonics 2022, 9, 333. [Google Scholar] [CrossRef]
- Sansoni, G.; Carocci, M.; Rodella, R. Calibration and performance evaluation of a 3-D imaging sensor based on the projection of structured light. IEEE Trans. Instrum. Meas. 2000, 49, 628–636. [Google Scholar] [CrossRef]
- Lin, H.; Han, Z. Automatic optimal projected light intensity control for digital fringe projection technique. Opt. Commun. 2021, 484, 126574. [Google Scholar] [CrossRef]
- Song, Z.; Jiang, H.; Lin, H.; Tang, S. A high dynamic range structured light means for the 3D measurement of specular surface. Opt. Lasers Eng. 2017, 95, 8–16. [Google Scholar] [CrossRef]
- Li, B.; Xu, Z.; Gao, F.; Cao, Y.; Dong, Q. 3d reconstruction of high reflective welding surface based on binocular structured light stereo vision. Machines 2022, 10, 159. [Google Scholar] [CrossRef]
- Cao, J.; Li, C.; Li, C.; Zhang, X.; Tu, D. High-reflectivity surface measurement in structured-light technique by using a transparent screen. Measurement 2022, 196, 111273. [Google Scholar] [CrossRef]
- Zhang, Y.; Qiao, D.; Xia, C.; Yang, D.; Fang, S. A method for high dynamic range 3D color modeling of objects through a color camera. Mach. Vis. Appl. 2023, 34, 6. [Google Scholar] [CrossRef]
- Porras-Aguilar, R.; Falaggis, K. Absolute phase recovery in structured light illumination systems: Sinusoidal vs. intensity discrete patterns. Opt. Lasers Eng. 2016, 84, 111–119. [Google Scholar] [CrossRef]
- Gühring, J. Dense 3D surface acquisition by structured light using off-the-shelf components. SPIE Proc. 2000, 4309, 220–231. [Google Scholar]
- Wolff, L.B. Using polarization to separate reflection components. In Proceedings of the 1989 IEEE Computer Society Conference on Computer Vision and Pattern Recognitiony, San Diego, CA, USA, 4–8 June 1989; pp. 363–364. [Google Scholar]
- Salahieh, B.; Chen, Z.; Rodriguez, J.J.; Liang, R. Multi-polarization fringe projection imaging for high dynamic range objects. Opt. Express 2014, 22, 10064–10071. [Google Scholar] [CrossRef] [PubMed]
- Chen, Z.; Wang, X.; Liang, R. Snapshot phase shift fringe projection 3D surface measurement. Opt. Express 2015, 23, 667–673. [Google Scholar] [CrossRef]
- Zhu, Z.; Xiang, P.; Zhang, F. Polarization-based method of highlight removal of high-reflectivity surface. Optik 2020, 221, 165345. [Google Scholar] [CrossRef]
- Zhu, Z.; Zhu, T.; Sun, X.; Zhang, F. 3D reconstruction method based on the optimal projection intensity of a polarization system. Appl. Opt. 2022, 61, 10290–10298. [Google Scholar] [CrossRef] [PubMed]
- Mertens, T.; Kautz, J.; Van Reeth, F. Exposure fusion. In Proceedings of the 15th Pacific Conference on Computer Graphics and Applications (PG’07), Maui, HI, USA, 29 October–2 November 2007; pp. 382–390. [Google Scholar]
- Li, S.; Kang, X.; Hu, J. Image fusion with guided filtering. IEEE Trans. Image Process. 2013, 22, 2864–2875. [Google Scholar]
- Han, X.F.; Jin, J.S.; Wang, M.J.; Jiang, W.; Gao, L.; Xiao, L. A review of algorithms for filtering the 3D point cloud. Signal Process. Image Commun. 2017, 57, 103–112. [Google Scholar] [CrossRef]
- Song, Z.; Chung, R.; Zhang, X.T. An accurate and robust strip-edge-based structured light means for shiny surface micromeasurement in 3-D. IEEE Trans. Ind. Electron. 2012, 60, 1023–1032. [Google Scholar] [CrossRef]
- Feng, S.; Zhang, L.; Zuo, C.; Tao, T.; Chen, Q.; Gu, G. High dynamic range 3d measurements with fringe projection profilometry: A review. Meas. Sci. Technol. 2018, 29, 122001. [Google Scholar] [CrossRef]
Figure 1.
The flow chart of our polarized SL algorithm.

Figure 2.
The visual pipeline of our polarized SL system for the 3D measurement of high-reflective surfaces.
Figure 2.
The visual pipeline of our polarized SL system for the 3D measurement of high-reflective surfaces.
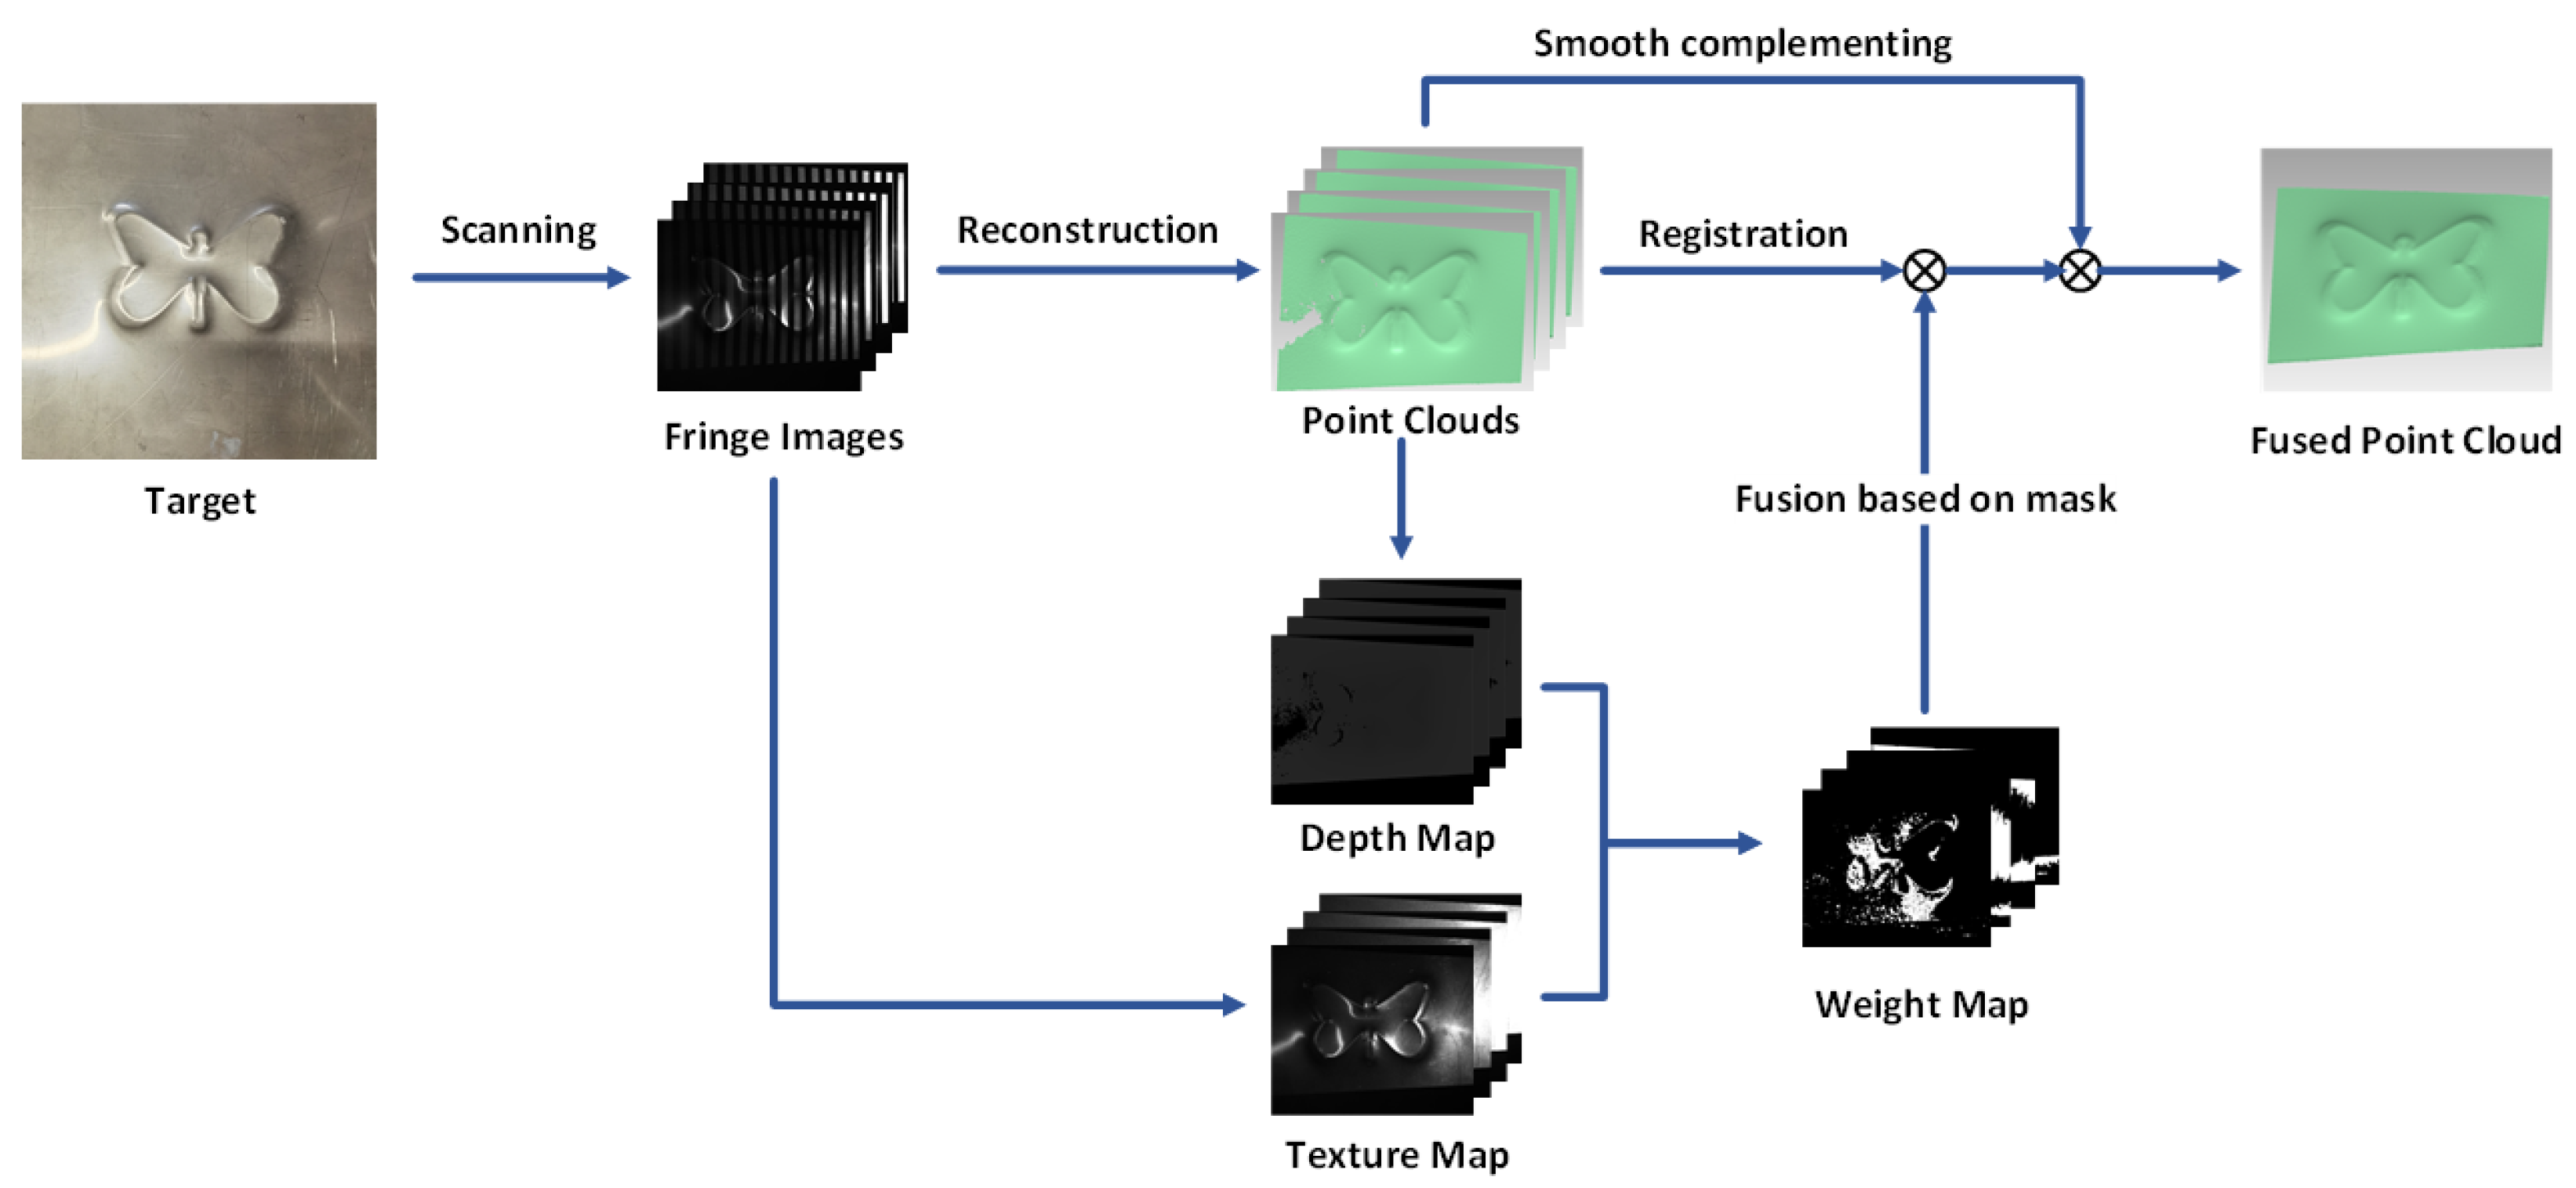
Figure 3.
Schematic diagram of polarized light.

Figure 4.
Schematic diagram of our polarized SL system.

Figure 5.
Point cloud layering caused by pixel deviation. (a) Channel 2 to Channel 1. (b) Channel 3 to Channel 1. (c) Channel 4 to Channel 1.
Figure 5.
Point cloud layering caused by pixel deviation. (a) Channel 2 to Channel 1. (b) Channel 3 to Channel 1. (c) Channel 4 to Channel 1.
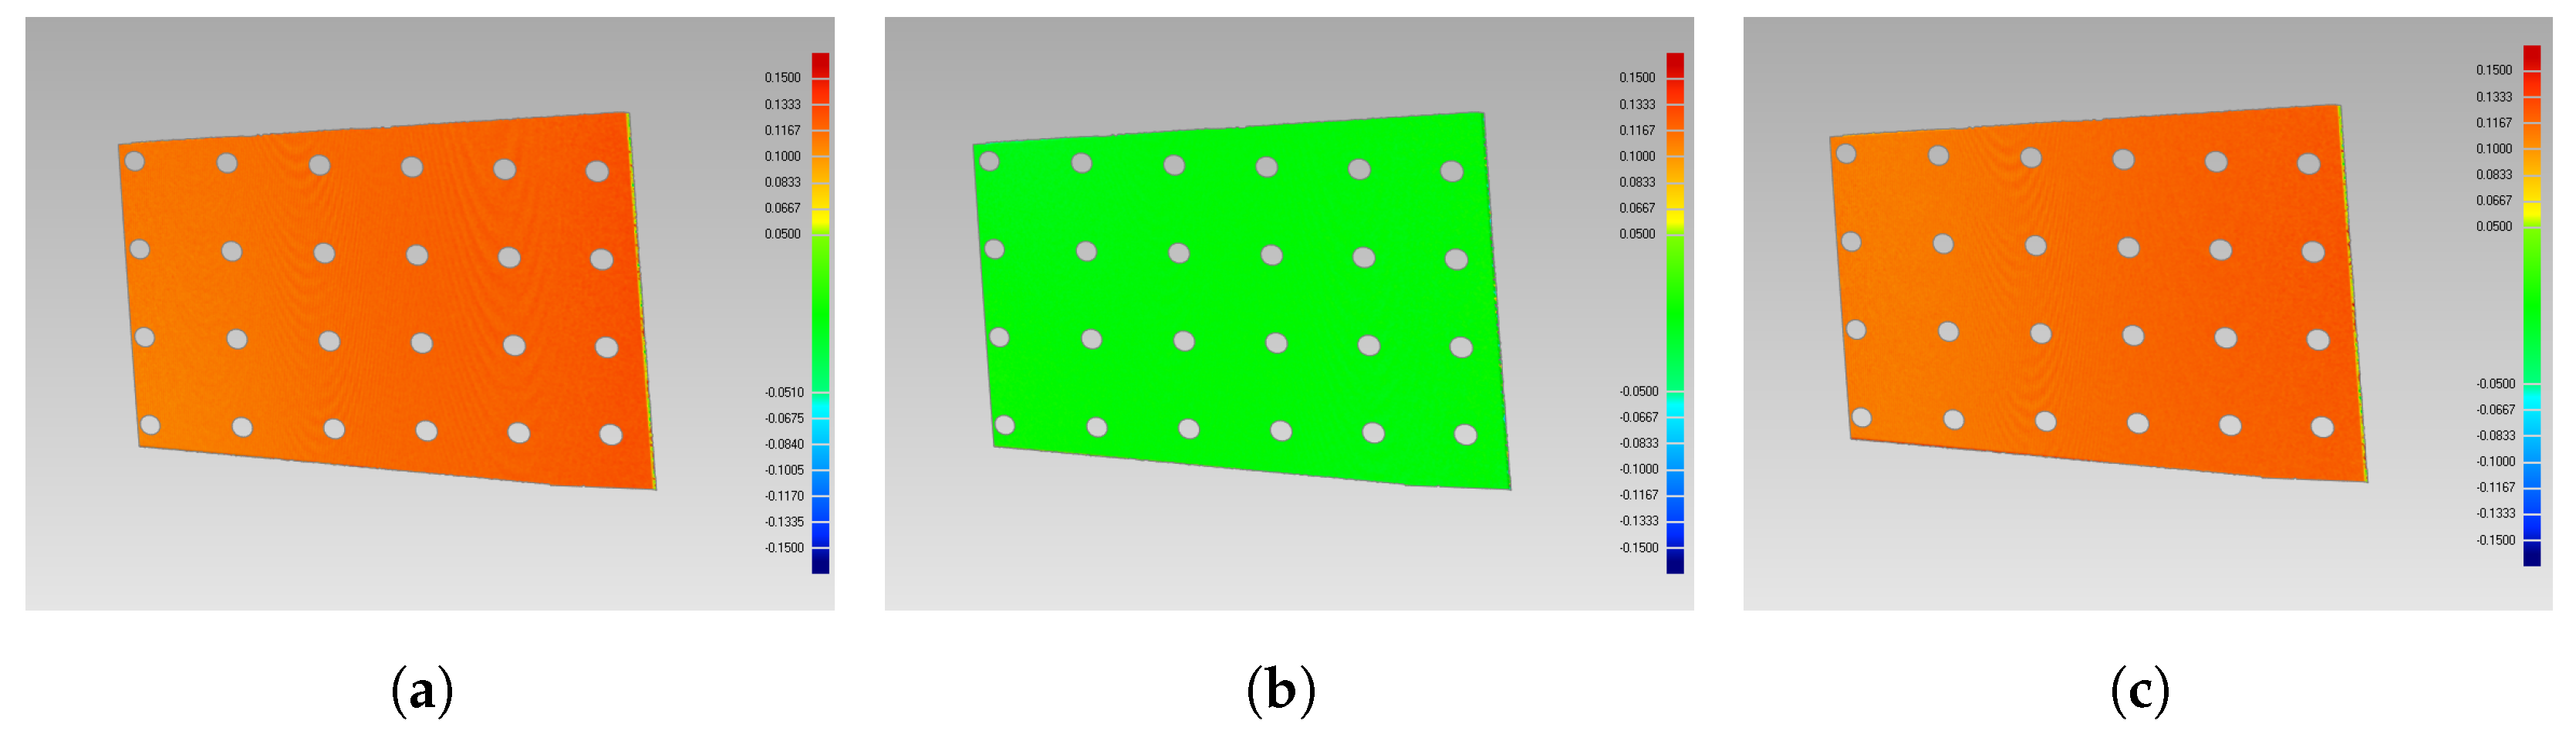
Figure 6.
The polarized structured light system.
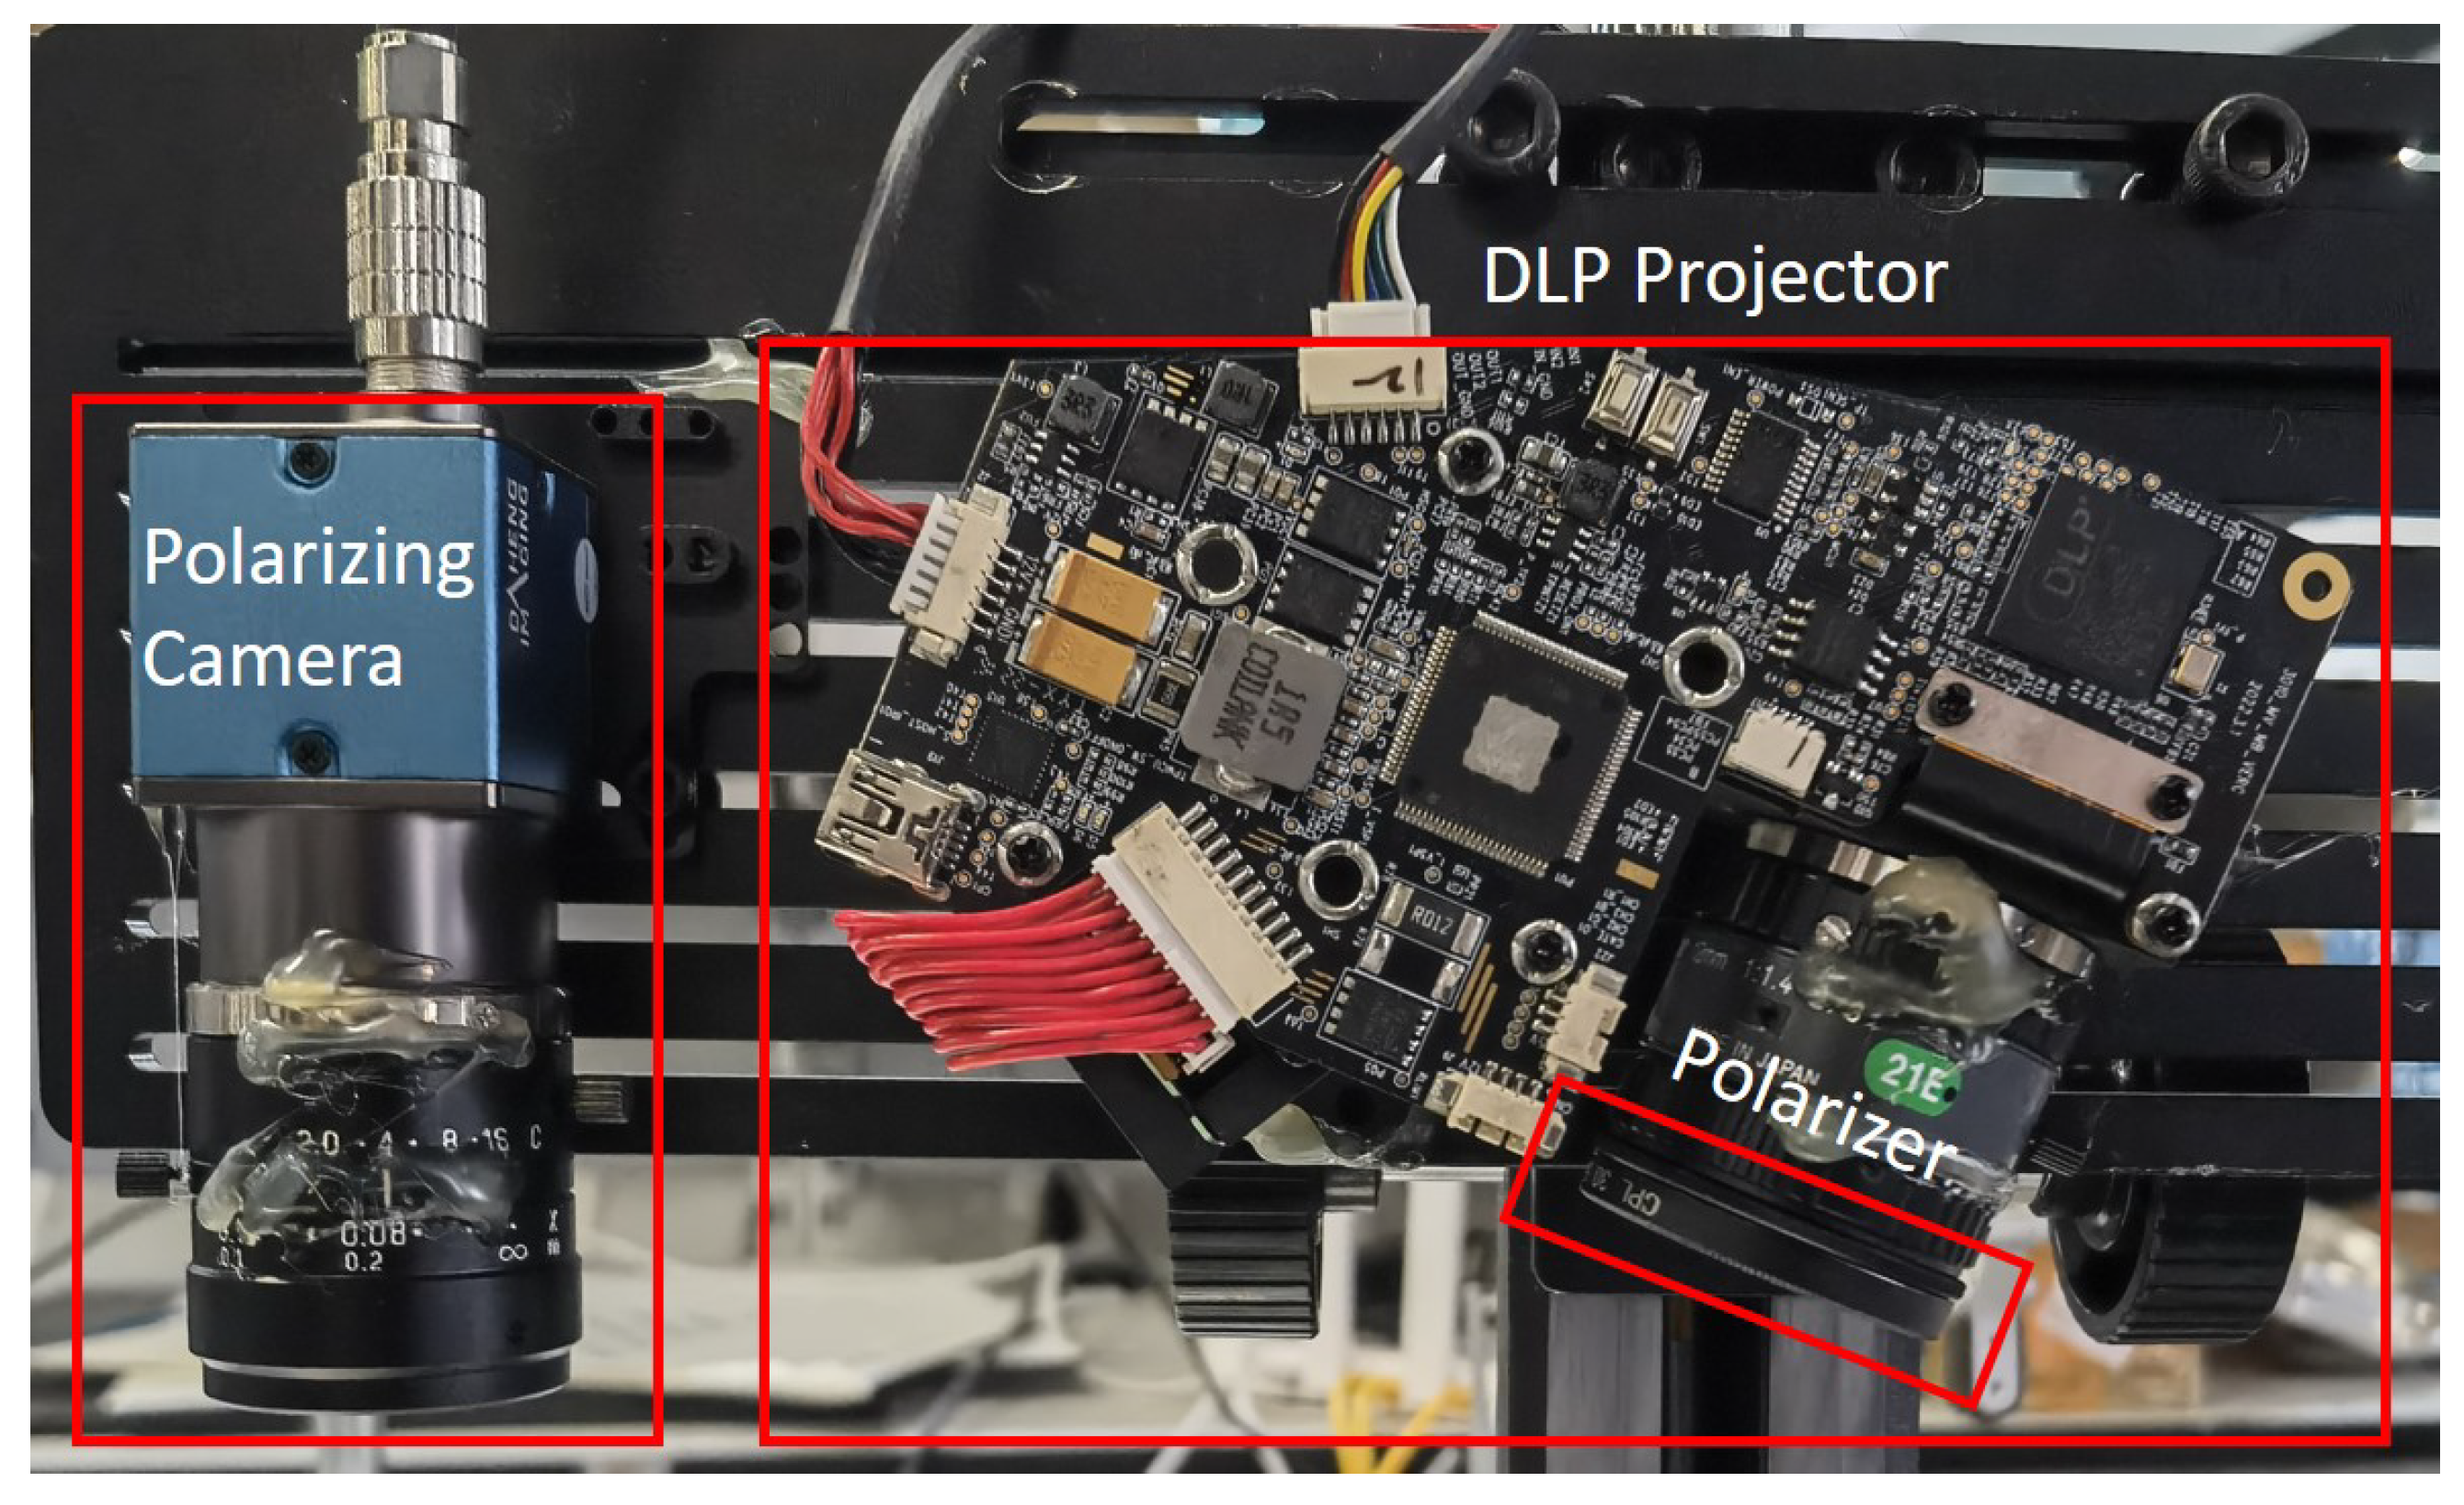
Figure 7.
Our polarized SL system’s coding strategy of Gray code combined with strip shifting pattern. (a) Gray code combined with strip shifting pattern. (b) Eighth pattern. (c) Seventeenth pattern.
Figure 7.
Our polarized SL system’s coding strategy of Gray code combined with strip shifting pattern. (a) Gray code combined with strip shifting pattern. (b) Eighth pattern. (c) Seventeenth pattern.

Figure 8.
The distribution of distance error from other channels to the first channel. (a) Channel 2 to Channel 1. (b) Channel 3 to Channel 1. (c) Channel 4 to Channel 1.
Figure 8.
The distribution of distance error from other channels to the first channel. (a) Channel 2 to Channel 1. (b) Channel 3 to Channel 1. (c) Channel 4 to Channel 1.
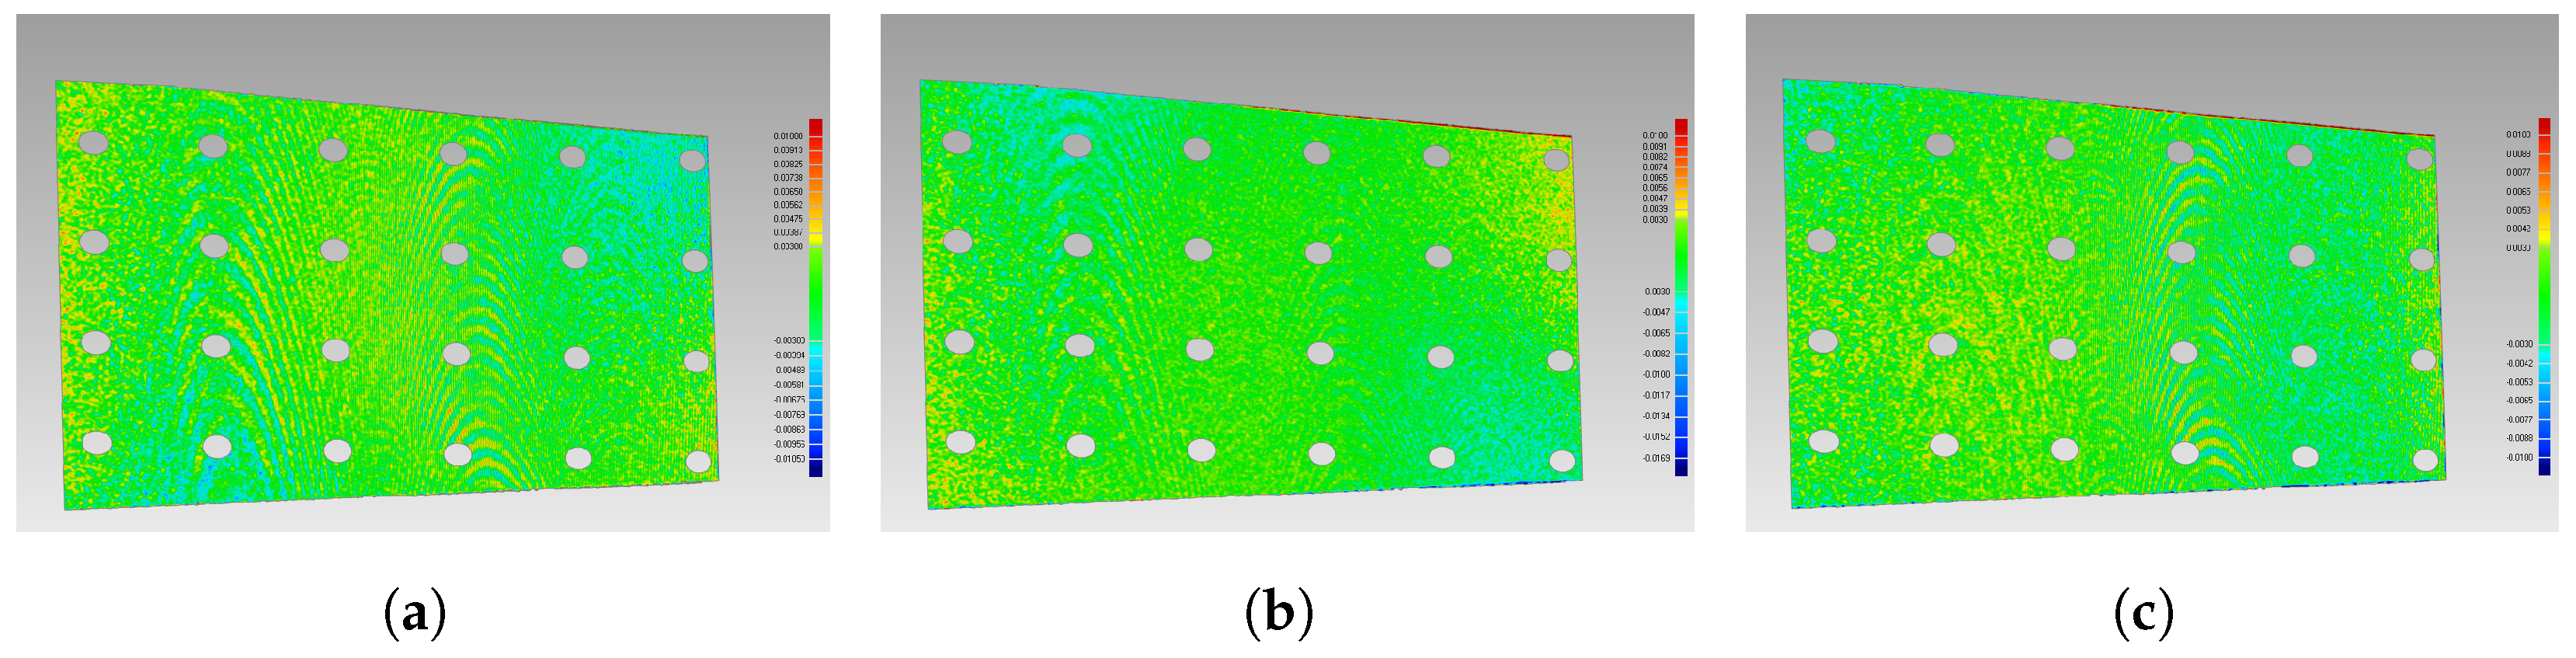
Figure 9.
Texture images and point clouds in 4 channels of a stainless steel stamping (, , , ).

Figure 10.
Texture images and point clouds in 4 channels of a sheet of folded aluminum foil (, , , ).
Figure 10.
Texture images and point clouds in 4 channels of a sheet of folded aluminum foil (, , , ).

Figure 11.
Fused point cloud of the stainless steel stamping. (a) Point cloud. (b) Depth Image.

Figure 12.
Fused point cloud of the folded aluminum foil. (a) Point cloud. (b) Depth Image.

Figure 13.
Error distribution of our polarized SL method. (a) Stainless steel stamping sprayed with white powder. (b) Error Map.
Figure 13.
Error distribution of our polarized SL method. (a) Stainless steel stamping sprayed with white powder. (b) Error Map.
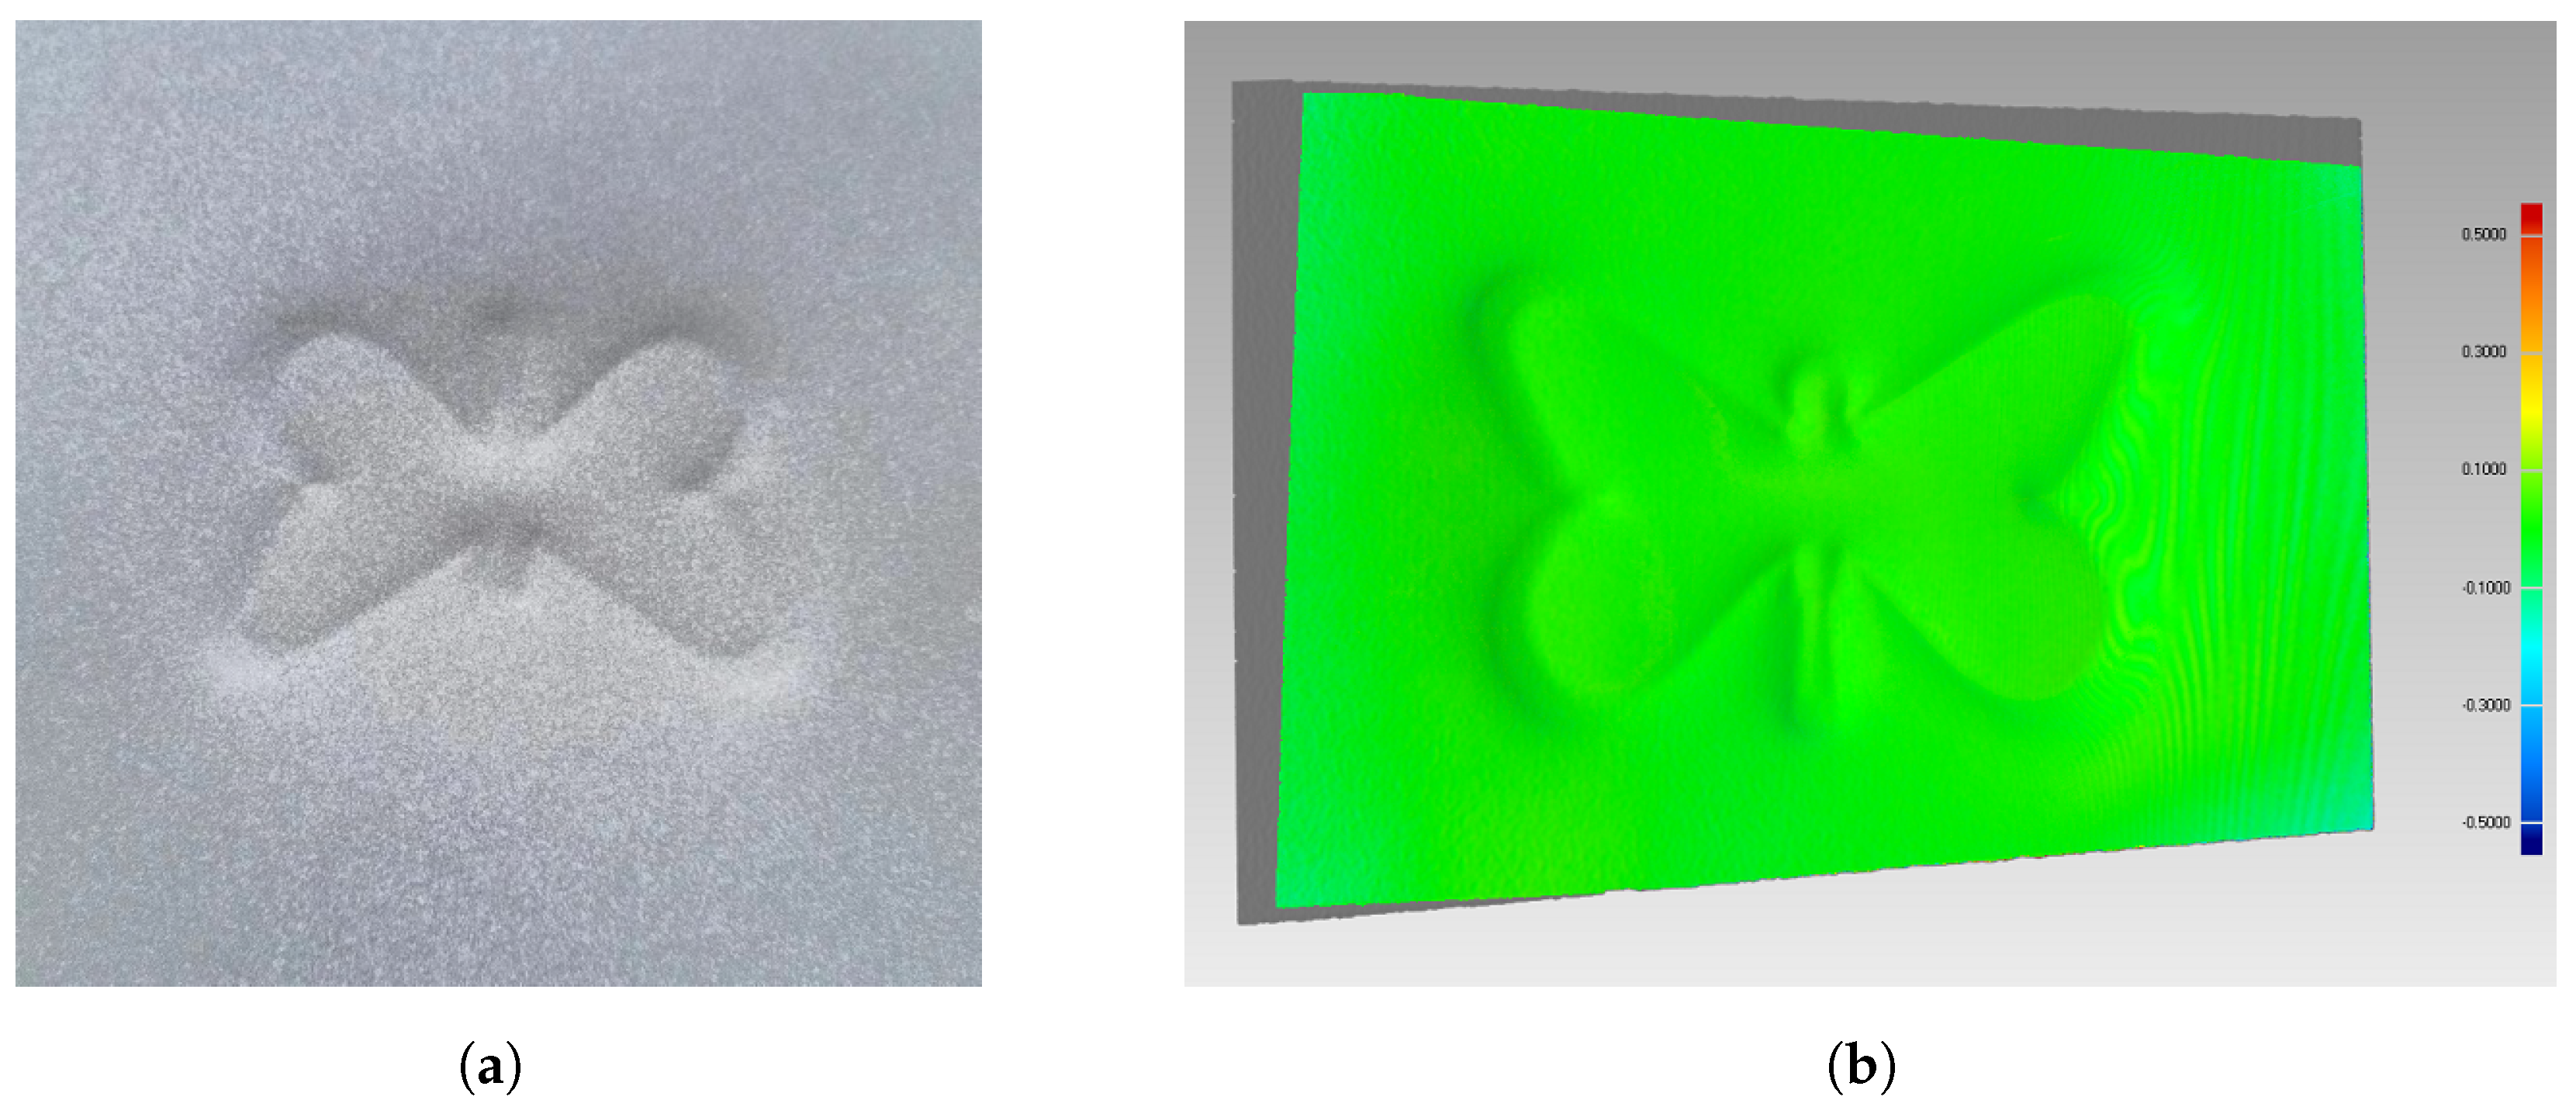
Figure 14.
Fused point cloud of some high-reflective surfaces via our polarized SL method.
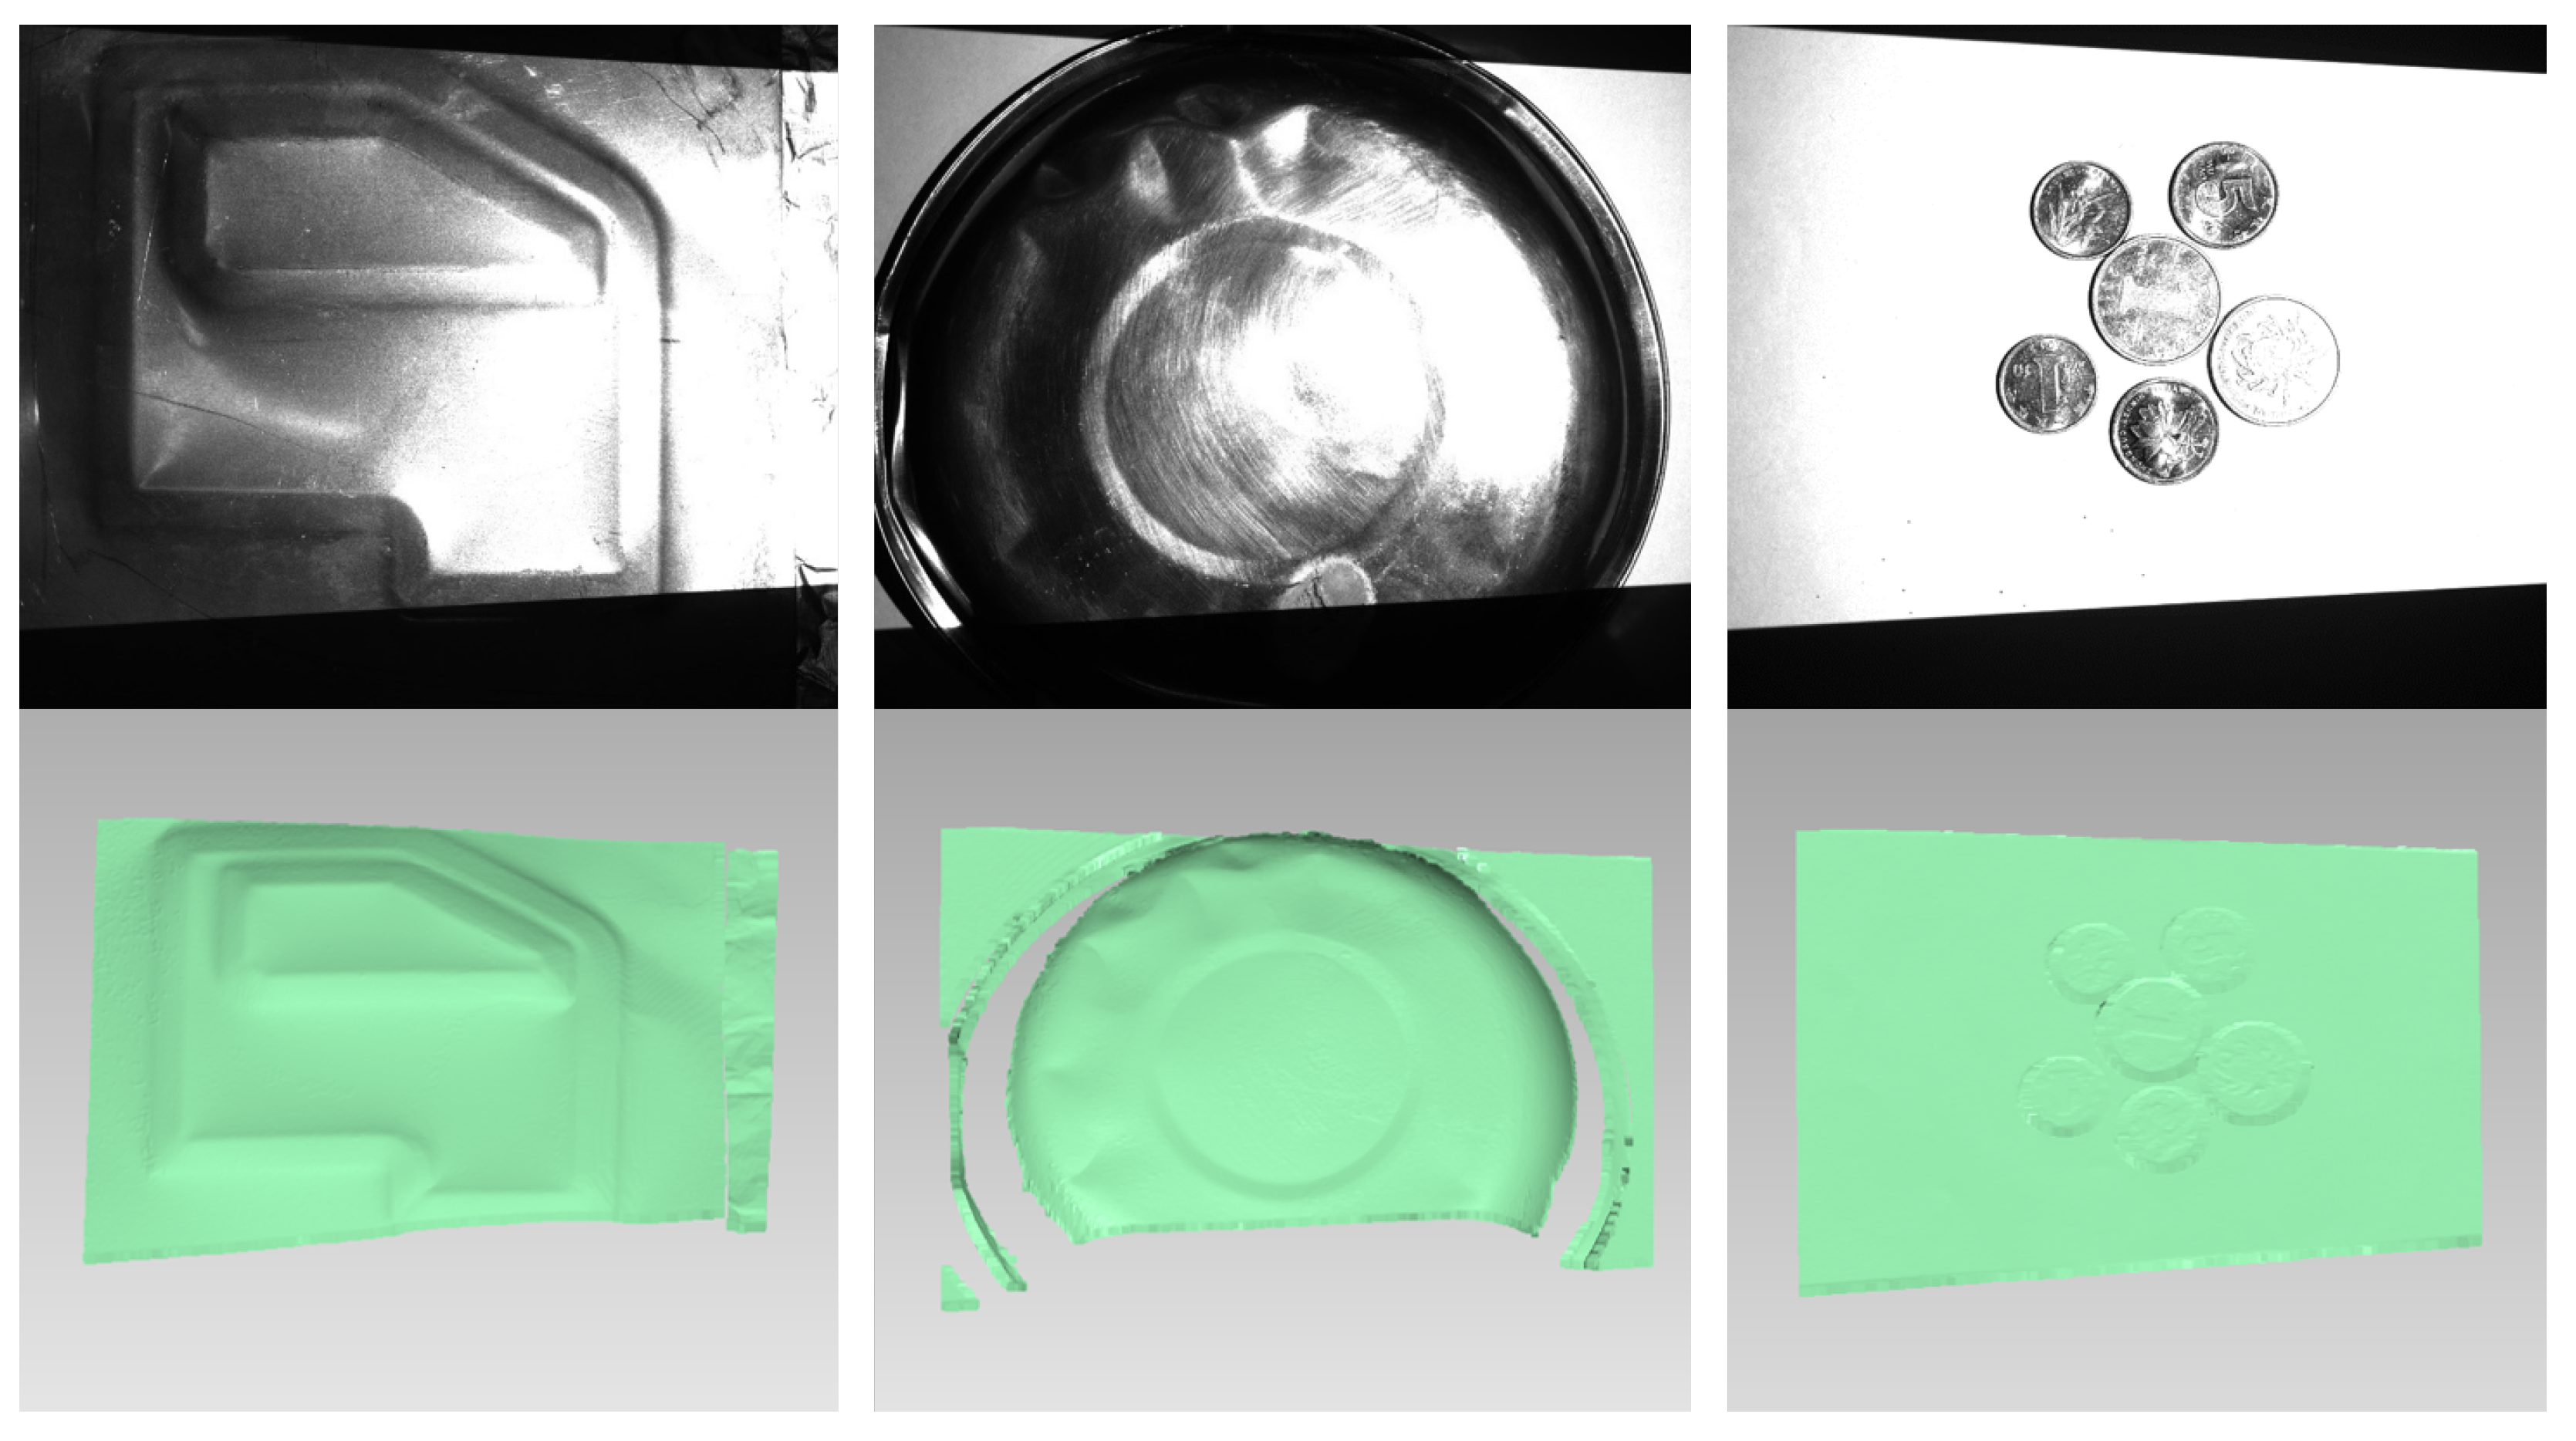
Figure 15.
Comparison between the multiple exposures method and our polarized SL method. (a) Single exposure (t = 20,000 s). (b) Double exposure fusion using Song [9] method ( = 10,000 s, = 20,000 s). (c) Triple exposure fusion using Song [9] method ( = 10,000 s, = 20,000 s, = 30,000 s). (d) Our proposed method.

Table 1.
The transmittance of four camera channels.
| Transmittance | ||||
|---|---|---|---|---|
Table 2.
The calibration parameters of our built SL system.
(Pixels) | (Pixels) | ||||||
|---|---|---|---|---|---|---|---|
| Camera | 2305.5486 2305.1569 | 609.9492 536.1492 | |||||
| Projector | 2230.4738 2230.5685 | 500.0181 305.3961 | |||||
| R | T (mm) | ||||||
Table 3.
The registration of rotation matrix and translation vector between point clouds collected by four channels.
Table 3.
The registration of rotation matrix and translation vector between point clouds collected by four channels.
| Channel | R | T (mm) | ||||
|---|---|---|---|---|---|---|
Table 4.
The distance error of registration from other channels to the first channel.
| Channel | Distance (mm) | |||
|---|---|---|---|---|
| Min | Max | Mean | std. | |
| 2 → 1 | ||||
| 3 → 1 | ||||
| 4 → 1 | ||||
Disclaimer/Publisher’s Note: The statements, opinions and data contained in all publications are solely those of the individual author(s) and contributor(s) and not of MDPI and/or the editor(s). MDPI and/or the editor(s) disclaim responsibility for any injury to people or property resulting from any ideas, methods, instructions or products referred to in the content. |
© 2023 by the authors. Licensee MDPI, Basel, Switzerland. This article is an open access article distributed under the terms and conditions of the Creative Commons Attribution (CC BY) license (https://creativecommons.org/licenses/by/4.0/).
Share and Cite
MDPI and ACS Style
Liang, J.; Ye, Y.; Gu, F.; Zhang, J.; Zhao, J.; Song, Z. A Polarized Structured Light Method for the 3D Measurement of High-Reflective Surfaces. Photonics 2023, 10, 695. https://doi.org/10.3390/photonics10060695
AMA Style
Liang J, Ye Y, Gu F, Zhang J, Zhao J, Song Z. A Polarized Structured Light Method for the 3D Measurement of High-Reflective Surfaces. Photonics. 2023; 10(6):695. https://doi.org/10.3390/photonics10060695
Chicago/Turabian StyleLiang, Jixin, Yuping Ye, Feifei Gu, Jiankai Zhang, Juan Zhao, and Zhan Song. 2023. "A Polarized Structured Light Method for the 3D Measurement of High-Reflective Surfaces" Photonics 10, no. 6: 695. https://doi.org/10.3390/photonics10060695
Note that from the first issue of 2016, this journal uses article numbers instead of page numbers. See further details here.