Fluorescence-Based Aqueous Phosphate Sensing Using Eu(cpboda)(DMF)2


1
Applied Sciences Laboratory, Institute for Shock Physics, Washington State University, Spokane, WA 99210, USA
2
ExMat Research Inc., Spokane, WA 99223, USA
*
Author to whom correspondence should be addressed.
Photonics 2024, 11(3), 250; https://doi.org/10.3390/photonics11030250
Submission received: 28 December 2023
/
Revised: 11 February 2024
/
Accepted: 7 March 2024
/
Published: 11 March 2024
(This article belongs to the Special Issue Advanced Photonic Sensing and Measurement II)
Abstract
:Fluorescence-based phosphate sensing using phosphate-sensitive phosphors is a promising approach for in situ monitoring of phosphate pollution in waterways and reservoirs. To date, the most sensitive phosphor developed for this purpose is Tb(cpboda)(DMF)2, where cpboda = (3,3′-((5-Carboxy-1,3-phenylene)bis(oxy))dibenzoic acid). In this study, we further improve this sensitivity by replacing the ions with ions to make Eu(cpboda)(DMF and find concentration-independent phosphate-sensitivity of 1570 ± 120, which is more sensitive than the Tb-version. This improvement is attributed to having a hypersensitive transition, while does not. Additionally, we characterize the phosphor’s optical properties, photodegradation, and water solubility. We find that the phosphor presents challenges with regards to both photodegradation and solubility, as it is found to be poorly soluble in water and is quickly photodegraded under UV radiation nm. However, these obstacles can, in theory, be overcome with the use of direct excitation of the ions at 394 nm and careful design of an analysis instrument to reduce concentration variations.
1. Introduction
Phosphates are useful compounds that find many applications in industry and agriculture [1,2,3,4,5,6,7,8,9,10,11,12,13,14,15]. Unfortunately, this wide use leads to them being a common pollutant in water sources [10], where their presence can lead to eutrophication and contamination of sources of drinking water [1,5,6,7,10]. Given the environmental and health risks related to phosphate contamination, there exists a need for reliable techniques that can measure aqueous phosphate concentrations of <3 μM [16].
Currently, there are a wide range of techniques used to detect phosphates in water, including [17,18] optical colorimetry, electrochemistry, chromatography, mass spectroscopy, UV-Vis spectroscopy, and phosphate-sensitive fluorescent phosphors. This last technique—phosphate-sensitive fluoresence phosphors—is of particular interest for in situ phosphate detection, as these phosphors offer high sensitivity, high selectivity, and rapid responses [19,20,21,22,23,24,25,26,27,28,29,30,31,32,33]. Note, to avoid confusion, we emphasize that in this paper the term “phosphor” refers to a fluorescent material used to detect “phosphates”, which are materials containing phosphorous. Typically, the fluorescence of these phosphors is quenched by presence of phosphates; however, there are cases where the phosphate has the opposite effect and turns on fluorescence [28]. One of the most sensitive and selective phosphors reported in the literature is Tb(cpboda)(DMF [cpboda = (3,3’-((5-Carboxy-1,3-phenylene) bis(oxy))dibenzoic acid)], which has a reported quenching coefficient of 0.668 and a limit of detection (LOD) of 45 nM for the experimental configuration used [19]. While this performance is impressive, we hypothesize that this phosphor’s performance can be further improved by switching to a lanthanide that has a hypersensitive transition (namely ), as does not have such a transition [34].
We have, therefore, synthesized Eu(cpboda)(DMF and performed characterization of its optical properties, photodegradation, and phosphate sensitivity and make comparisons to the -based version of this phosphor. We find that switching to does indeed improve the phosphate sensitivity. However, we also find that the phosphor is poorly soluble in water (which is also observed for Tb(cpboda)(DMF) and undergoes significant photodegradation under UV illumination. Both of these findings are challenges to overcome to use the phosphor as a real world phosphate sensing material. We conclude the paper by considering several avenues to address these challenges in future work.
2. Method
2.1. Eu(cpboda)(DMF Synthesis
To prepare Eu(cpboda)(DMF, we purchased cpboda (3,3’-((5-Carboxy-1,3-pheny -lene)bis(oxy))dibenzoic acid), 96% from Alfa Chemistry (Ward Hill, MA, USA)and Europium (III) nitrate hydrate, REacton, 99.99%, from Alfa Aesar (Ward Hill, MA, USA). Sodium hydroxide, >97%, was obtained from Fisher BioReagents (Walther, MA, USA) and Dimethylformamide (DMF), 99.8%, J. T. Baker A.C.S. reagent from Avantor (Allentown, PA, USA). We prepared Eu(cpboda)(DMF using hydro-solvothermal synthesis [19,35] by dissolving a mixture of H3cpboda, Eu(N6O and NaOH in 14.0 mL of DMF-O (v/v = 5/2) solution and stirring in a high pressure reaction vessel with 25 mL PTFE cup and cover for hydro-solvothermal synthesis. We placed the PTFE cup and cover in the reaction vessel and the secondary stainless-steel lid was hand-tightened and placed into a preheated oven at 140 °C for 72 h, followed by a natural cool down to room temperature. The resulting Eu(cpboda)(DMF was collected by centrifugation and washed with distilled water three times by placing it in a 15 mL centrifuge vial, vortex mixing it, then centrifuging it at 6000 rpm for 1 min. The supernatant was decanted each time and the DI water was refilled and vortexed to wash the solution. The remaining Eu(cpboda)(DMF left in the bottom of the centrifugation vial was placed in a vacuum chamber at 25 mmHg for drying overnight at room temperature. Figure 1 shows the chemical structure of the phosphor. Note that this material was previously made and structurally characterized by Yang et al. for a different application [35] and our structural results are consistent with theirs.
2.2. Solutions
To prepare aqueous solutions for testing, we first prepared large stock batches of a phosphate solution (1) and a phosphor solution (2). 1 was prepared by dissolving NaPO (Sigma Aldrich (Burlington, MA, USA) ≥99.0%) in water at a concentration of 1000 mg/L (8335 M). To obtain lower phosphate concentrations (8 nM to 8335 nM), we simply diluted 1 with distilled water. Moreover, 2 was prepared by first dispersing 100 mg of Eu(cpboda)(DMF in 100 mL of water. Note that Eu(cpboda)(DMF is poorly soluble in water, so at this concentration, the dispersed phosphor produces a suspension and not a solution. The suspension was then sonicated for 30 min and aged for 24 h. The resulting supernatant was removed and added to 100 mL of water, which was then sonicated for 15 mins and centrifuged at 6000 RPM for 5 min. To test the phosphate sensing capabilities of Eu(cpboda)(DMF, we combined dilutions of 1 with 2 in 1:1 ratios.
2.3. Fluorescence Spectroscopy
Fluorescence measurements were performed using either a custom built fluorescence microscope or an Ocean Insight Cube Cuvette holder, with excitation provided by one of three different light sources: a 280 nm fiber-coupled LED (Thorlabs M280F5, Newton, NJ, USA), a DPSS UV Laser (Photonics Industries DCH-355-5, Ronkonkoma, NY, USA), or an Opotek Radiant HE OPO (210–2100 nm, 10 Hz, 10 ns, Carlsbad, CA, USA). For both measurement modalities, the spectra were recorded using a fiber-coupled spectrometer consisting of a Spectra Pro 2500i Monochromator (0.5 m, 600 g/mm, 500 nm blaze) and a Princeton Instruments PI-Max 4 ICCD (Princeton, NJ, USA). Note that unless specified otherwise, our data were obtained using five measurements, with the resulting spectra averaged and the uncertainty determined by the standard deviation.
3. Results and Discussions
3.1. Fluorescence Properties
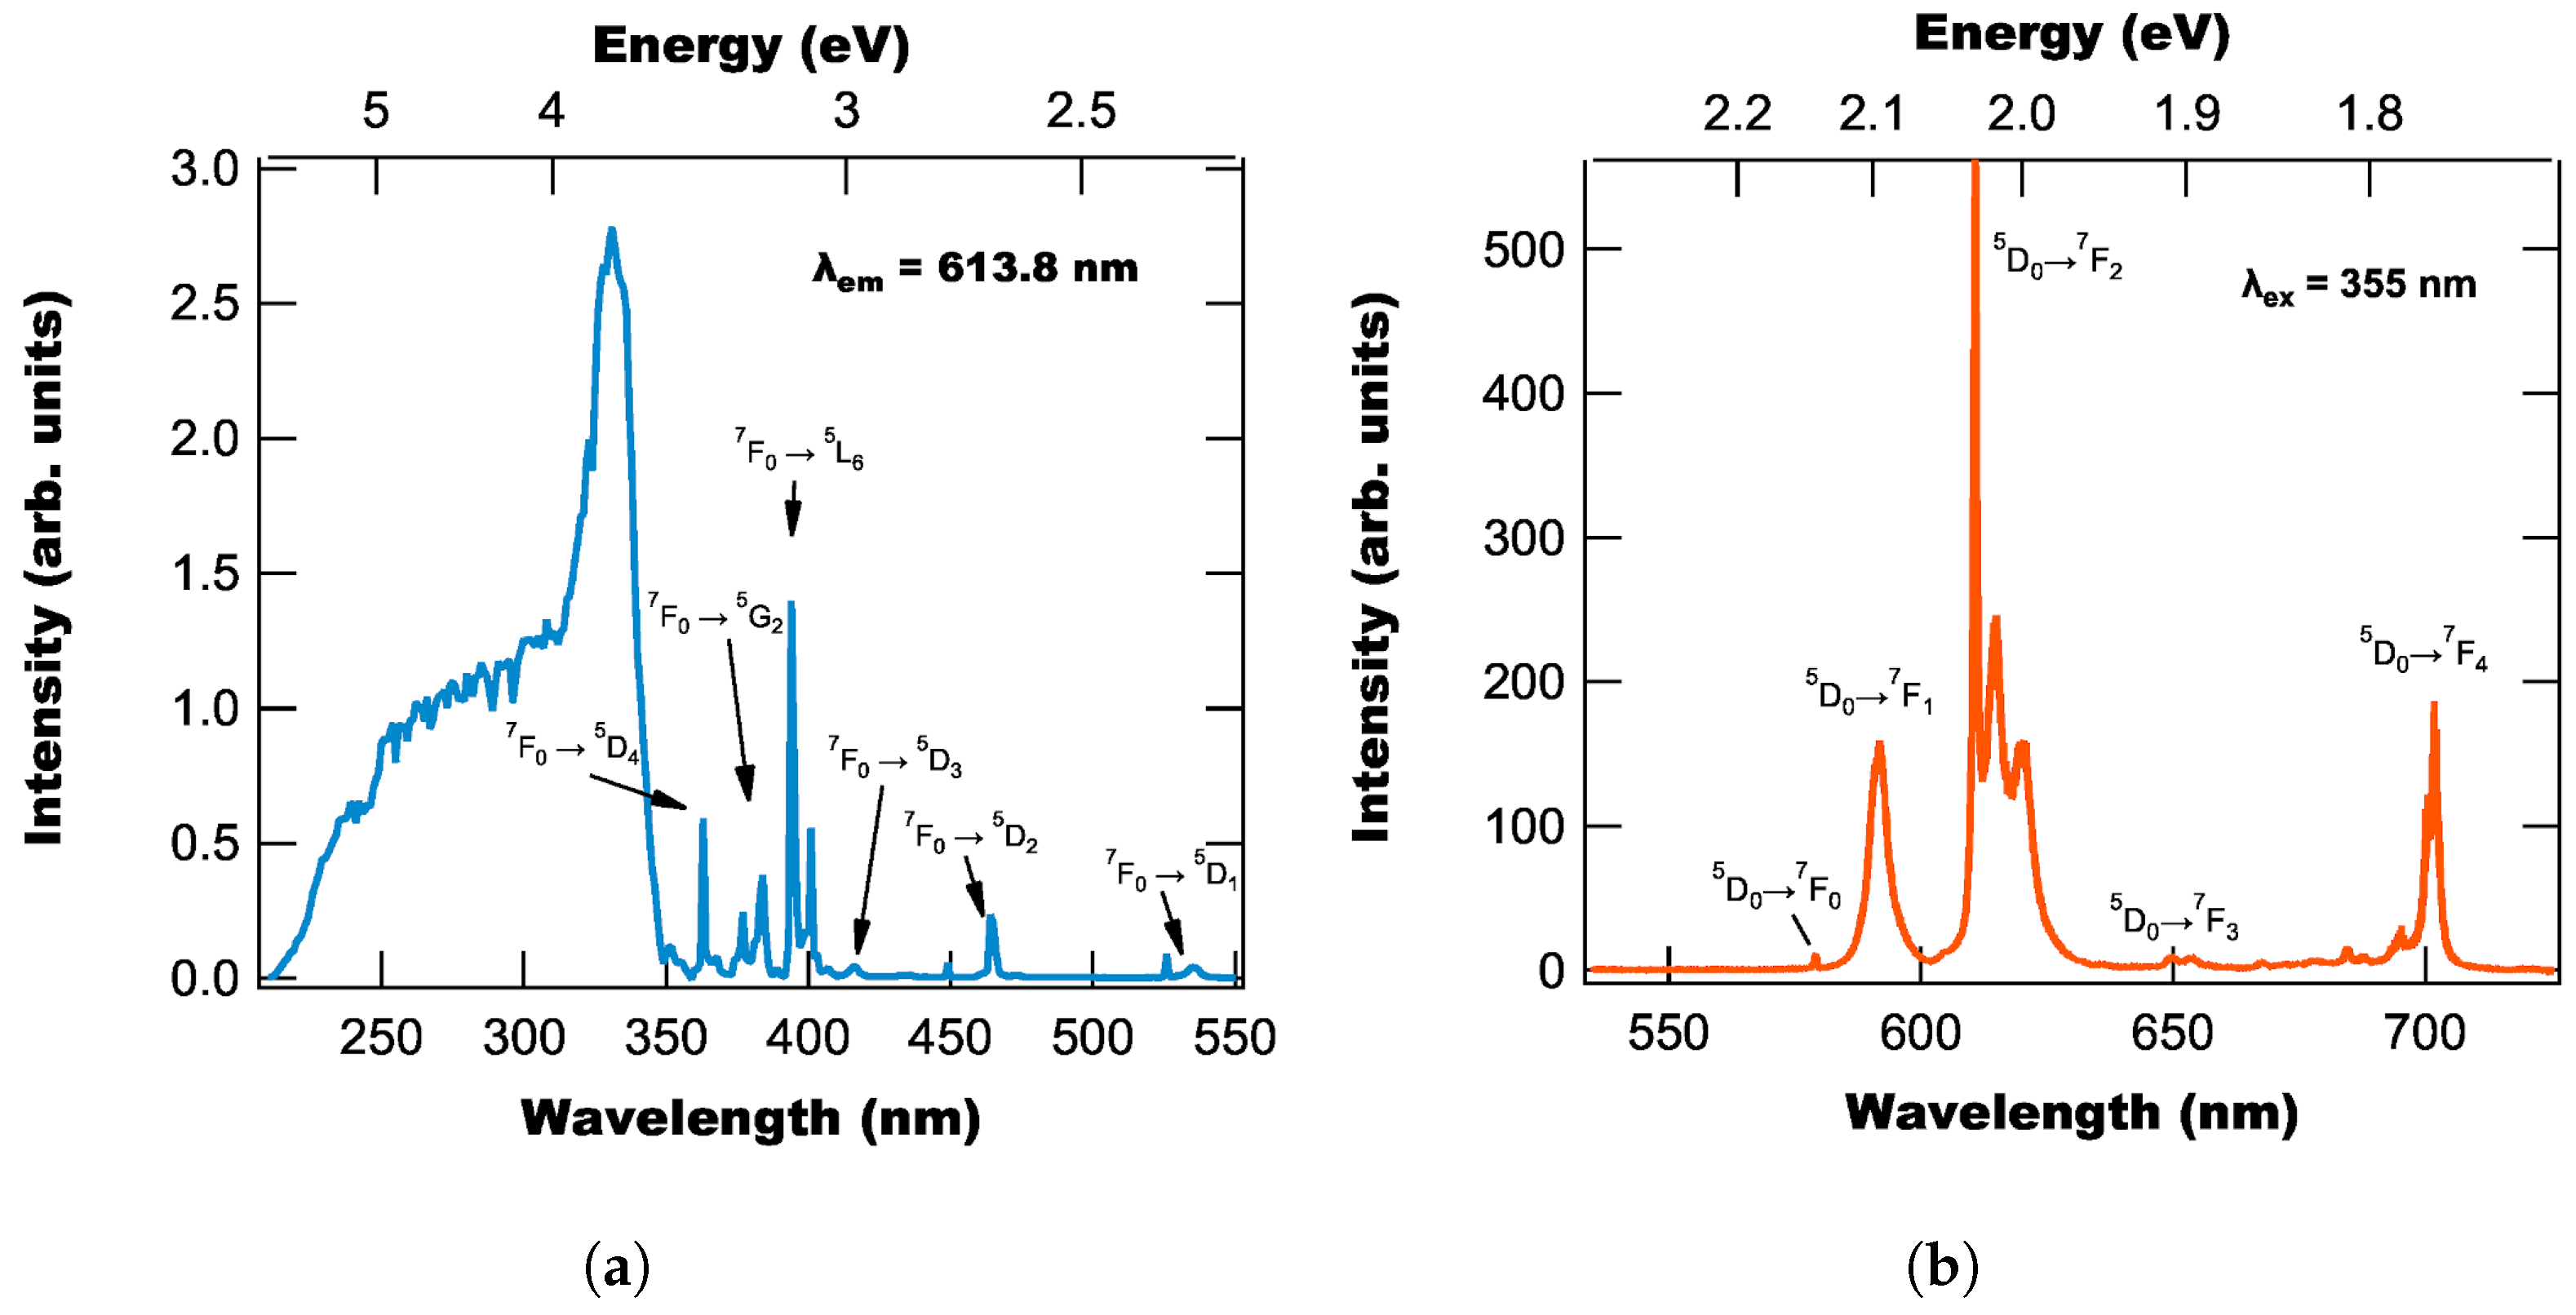
After synthesizing Eu(cpboda)(DMF, we first characterized its photoluminescence (PL) properties. Figure 2a shows its PL excitation spectra and Figure 2b shows the emission spectra for excitation at 355 nm. Additionally, we measured its lifetime using a 355 nm pulsed laser and find it to be 874 ± 10 s. From Figure 2a, we observe broad excitation bands below ≈ 360 nm due to the ligand absorbing light and transferring energy to the ions, as well as multiple sharp peaks above 360 nm corresponding to direct excitation of the ions. Using multipeak curve fitting, we determine the direct excitation peaks locations and proposed transition assignments, which are tabulated in Table 1. Similarly, we perform multipeak fitting of the emission spectra and report the peak locations and transitions assignments in Table 1. Given the observation of the transition, we know that the Eu ions occupy sites with a symmetry [36], which we further refine to either or symmetry as the crystal structure of the Tb version of this complex was found to be triclinic [35].
To complete our analysis of Eu(cpboda)(DMF’s photoluminescence properties, we analyzed the emission spectra using JOES software (v2.7) [37] to compute the phosphor’s Judd-Offelt parameters and its estimated quantum efficiency. These values are tabulated in Table 2, with the quantum efficiency found to be 0.25, which is on the lower end of Eu-based phosphors reported in the literature [38].
3.2. Photodegradation
While performing our initial measurements with Eu(cpboda)(DMF, we observed that the spectra decreased in intensity with extended exposure to DUV light, which suggests that the phosphor undergoes photodegradation when irradiated with DUV light. To characterize the rate and degree to which this occurs, we performed photodegradation experiments where we exposed powdered Eu(cpboda)(DMF and an Eu(cpboda)(DMF/water suspension to either 280 nm or 355 nm light. For the powders, we used our fluorescence microscope apparatus, while for the solutions, we used an Ocean Insight Cuvette holder with a magnetic stirrer inserted to continually agitate the solution during the experiment. This agitation helps to both stop the suspension from settling and mitigate photodegradation as the Eu(cpboda)(DMF molecules are cycled through the UV beam.
For these measurements, we turned on the UV light source and measured the fluorescence at 20 s intervals for at least one hour. After collecting the spectra, we measured the peak intensity as a function of time, normalized it to the initial intensity, and plotted the resulting traces in Figure 3. From Figure 3, we find that Eu(cpboda)(DMF undergoes photodegradation under illumination with both 280 nm and 355 nm light, with the powdered samples degrading much more quickly than the stirred solution, which is both a function of the pump intensity and the fact that for the powder sample the same Eu(cpboda)(DMF molecules are exposed the entire time. Note that while the time scales for degradation with 280 nm and 355 nm appear similar in Figure 3, the 280 nm excitation is much more damaging than the 355 nm excitation, since for these measurements, the 355 nm intensity is significantly higher than the 280 nm light source.
Based on Figure 3, we find that for these fluences in solution the 280 nm excitation takes only 20 s to decrease the intensity to 90%, while for the 355 nm light, it takes almost 8 min. While the 355 nm excitation is found to be less damaging than the 280 nm excitation, we must note that excitation at 280 nm is more efficient (see excitation spectra in Figure 2a. This means that we can use lower detector gains and shorter exposure times with 280 nm excitation than with 355 nm excitation, which helps minimize the noise in the spectral measurements.
3.3. Solution Variance
During our initial testing with Eu(cpboda)(DMF/water suspensions, we determined that Eu(cpboda)(DMF remains partially insoluable in water and the resulting solutions did not have well-defined concentrations due to settling and concentration gradients. These uncertainties in concentration represent significant problem for using Eu(cpboda)(DMF in aqueous phosphate detection, as the detection technique relies on comparing the fluorescence intensity of test solution (containing phosphates) to a reference solution (containing no phosphates). If both solutions have different Eu(cpboda)(DMF concentrations, the comparison will be invalid.
Given these concerns, we performed a series of measurements to quantify the intensity variance in a series of ”identical” solutions. These samples were first prepared by making a large batch of Eu(cpboda)(DMF/water, from which five 1 mL samples were taken for testing. To reduce the impact of photodegradation on these measurements, we used 355 nm excitation and limited exposure times to minimize the UV dose. We first characterized the spectral intensity variance for a single vial by taking twelve spectra (with the liquid agitated between measurements) and determined the peak intensities for each agitation, as shown in Figure 4a. From these intensities, we calculated an average and standard deviation, whose levels are shown as solid lines in Figure 4a, and found that the percent error is 7.5%. Note that we have characterized the systematic uncertainty of the spectroscopy system for a stable sample to be 0.8%, which means the extra 7.46% error is due to variance in the concentration of Eu(cpboda)(DMF in solution (as uncertainties add as the sum of squares, the additional variance is given by ).
With the intensity uncertainty from a single vial characterized, we next considered how consistent the solutions are between vials. To determine this variance, we measure the five different vials five times each and compute their spectral averages and uncertainties. The resulting average peak intensities are shown in Figure 4b, with the single vial average and uncertainty added for reference. From Figure 4b, we find that three of the five intensities are within uncertainty of each other, while two of the vials are outliers.
3.4. Effect of on Fluorescence
To determine the effect of contamination on Eu(cpboda)(DMF’s fluorescence in an aqueous solution, we first prepared a large batch of Eu(cpboda)(DMF in water. We then separated the phosphor solution into twelve vials and added an equal amount of phosphate solution to each vial with a different concentration from 0 nM to 8335 nM. These vials were then measured five times (using 280 nm excitation) with the solution agitated between each measurement. Each spectral measurement took 4 s, with the excitation source turned off between measurements to minimize photodegradation and ensure that each vial received the same dose of UV radiation. Note that we agitated the sample between measurements and only had the UV light on during measurements to minimize any impact on our results due to concentration gradients and photodegradation, respectively. These steps are found to work well to ensure that the observed fluorescence changes are due to the phosphates and not some other influence.
Once these five spectra were measured, we then computed the average and standard deviation of the spectra for each concentration, with Figure 5 showing the average spectra for each phosphate concentration. Note that we also attempted to perform fluorescence lifetime and absorbance measurements on the different solutions to further determine the impact of contamination, but found that the phosphor concentration was so low that both measurements were indistinguishable from the noise of the detection systems. Our fluorescence spectral measurements were successful because we used a long integration time of 4 s. For reference, our measurements of the powder used an integration time of 1 ms.
From Figure 5, we find that for concentrations ≤625 nM the spectral intensity slowly decreases as the concentration increases, but once it passes 625 nM, there is a sharp drop in intensity, with the fluorescence almost being completely quenched. We characterize this behavior by calculating the peak intensity ratio , where is the zero-phosphate solution’s peak intensity and I is the contaminated solutions peak intensity, with the resulting ratios shown in Figure 6. From Figure 6, we find that the ratio follows a linear trend for concentrations ≤ 625 nM, which is typically associated with collisional quenching between the phosphate ions and excited phosphor molecules [34]. However, above this concentration, the ratio function becomes nonlinear and increases super-linearly before settling to an asymptotic value. This behavior is consistent with Yang et al.’s paper on the Tb-doped version of this complex [19], but differs from the observed functionalities of the ratio for other phosphors, where the nonlinear range displays sublinear growth [20,39,40]. Most likely, this difference in nonlinear behavior arises due to the nature of the phosphor-phosphate complex formed at high concentrations and whether it is luminescent or not. For instance, one phosphor found to behave sublinearly, Eu(acac, is found to interact at high phosphate concentrations to produce EuP, which is still luminescent. This remaining Luminescence “slows” the quenching curve, which leads to the sublinear behavior. However, in the case of Eu(cpboda)(DMF the phosphate-phosphor complex formed at high concentrations is non-luminescent, which leads to a more rapid “cut-off” of fluorescence as the phosphate concentration increases.
Having measured the intensity ratio as a function of phosphate concentration we next determine the quenching coefficient () and level of detection (LOD) by fitting the linear range of the ratio to the Stern–Volmer equation:
where C is the phosphate concentration. Fitting the linear range of Figure 6 to Equation (1), we find the quenching coefficient to be 1.083 (±0.081) . Next, we calculated the LOD—defined as (where is the uncertainty in the reference intensity ratio determined earlier)—and find it to be 0.208 ± 0.016 M.
Directly comparing these results to those previously reported by Yang et al. for the Tb version of this complex, we find that the Eu version’s quenching coefficient is larger—1.083 (±0.081) vs. 0.668 —which demonstrates that switching from Tb to Eu has improved the phosphor’s phosphate sensitivity, which is further supported by the observation that the ratio’s nonlinear behavior begins around 0.7 M for the Eu version, while the ratio remains linear til about 1.5 M for the Tb version.
However, this direct comparison is actually inappropriate, as the quenching coefficient depends on the phosphor concentration [39]. The more appropriate parameter to compare phosphors is the concentration-independent sensitivity , which is equal to , where is the phosphor concentration. For phosphors that are soluble in water, this procedure is relatively straightforward, as the concentration is easily determined. However, for the phosphors currently under comparison, they are not soluble in water, which makes their concentration poorly defined. On the other hand, we can make a rough comparison by noting that Yang et al. prepared their initial suspension with 10 mg of phosphor in 50 mL of water, while we used 100 mg of phosphor in 100 mL of water. If we blindly assume these are the actual concentrations, we can calculate a concentration-independent sensitivity of 194 for the Tb version and 1570 ± 120 for the Eu version, which is approximately an eight-fold improvement. This qualitative comparison shows that switching to the Eu dopant makes the phosphor more sensitive. However, the actual quantitative numbers need to be taken with a grain of salt given the assumptions used.
Lastly, despite this evidence for the greater sensitivity of the Eu-based complex, we note that Yang et al.’s reported LOD is smaller than we report (45 nM vs. 208 ± 16 nM). This discrepancy is due to our determination of significantly higher uncertainties in the no-phosphate ratio than Yang et al. used (e.g., 0.075 vs. 0.01). While it is unclear from their paper how they determined their uncertainties, the small value they used of 0.01 suggests that they only measured the uncertainty of their spectroscopy system and neglected to include the uncertainty due to phosphor concentration variations, which we have shown are of greater significance than the spectroscopy system uncertainties. Note that if we only consider the uncertainty due to the spectroscopy system, our LOD becomes 22 nM.
3.5. Applications
Based on the results above we find that Eu(cpboda)(DMF is more sensitive to phosphates than the currently most sensitive phosphor Tb(cpboda)(DMF. We also anticipate that it will have similar selectivity to Tb(cpboda)(DMF (which displays high selectivity [19]), as the selectivity of the phosphor is primarily due to the ligands [34,41], which are the same for both phosphors. For instance, Pierre and Wilharm characterized a range of phosphors’ selectivities to different ions and found that the selectivity of the phosphors depended on the “basicities of the coordinating ligand and of the targeted anion, the acidity of the lanthanide ion, and the geometry of the ligand” [41]. While there is some dependence on the lanthanide ion (namely its acidity), we note that both Eu and Tb have similar acidities [42]. This is further supported by Zhou et al., who compared the selectivities of Ln(PMBB(O2 (Ln = Eu,Tb) for different ions and found them to have similar selectivities despite the different metal ion [43]. Additionally, we plan on experimentally testing this hypothesis in a future project.
The phosphors phosphate sensitivity and selectivity alone suggest that Eu(cpboda) (DMF is an excellent phosphor for aqueous phosphate detection. However, our results also show two major challenges to any real-world application of Eu(cpboda)(DMF as an aqueous phosphate sensor, namely, the phosphor undergoes significant photodegradation under UV illumination and it has poor solubility in water.
To address the challenges presented by photodegradation, we note that photodegradation primarily occurs due to the organic ligands absorbing UV light, which results in photochemical reactions. This process can be mitigated by directly exciting the ions using a wavelength not absorbed by the ligands. Based on the excitation spectra shown in Figure 2a, the most promising wavelength for this purpose is 394 nm, which has an intensity similar excitation with 280 nm. Note that there are a number of commercially available inexpensive LEDs at 395 nm, which would be suitable for this purpose.
While the issue of photodegradation can be addressed simply, the phosphor’s poor solubility in water presents a bigger challenge. To address this challenge, we propose two different approaches: using a buffer solution and an experimental redesign to average over concentration variations. For the buffer solution approach, we first need to determine a solvent in which the phosphor is soluble. Note that these solvent tests are planned for a future project. The resulting solution with dissolved phosphor would then be mixed with contaminated water to precisely control the phosphor’s concentration. Note that we have successfully used this approach with the phosphor Eu:(acac [39], which is soluble in methanol, but not water.
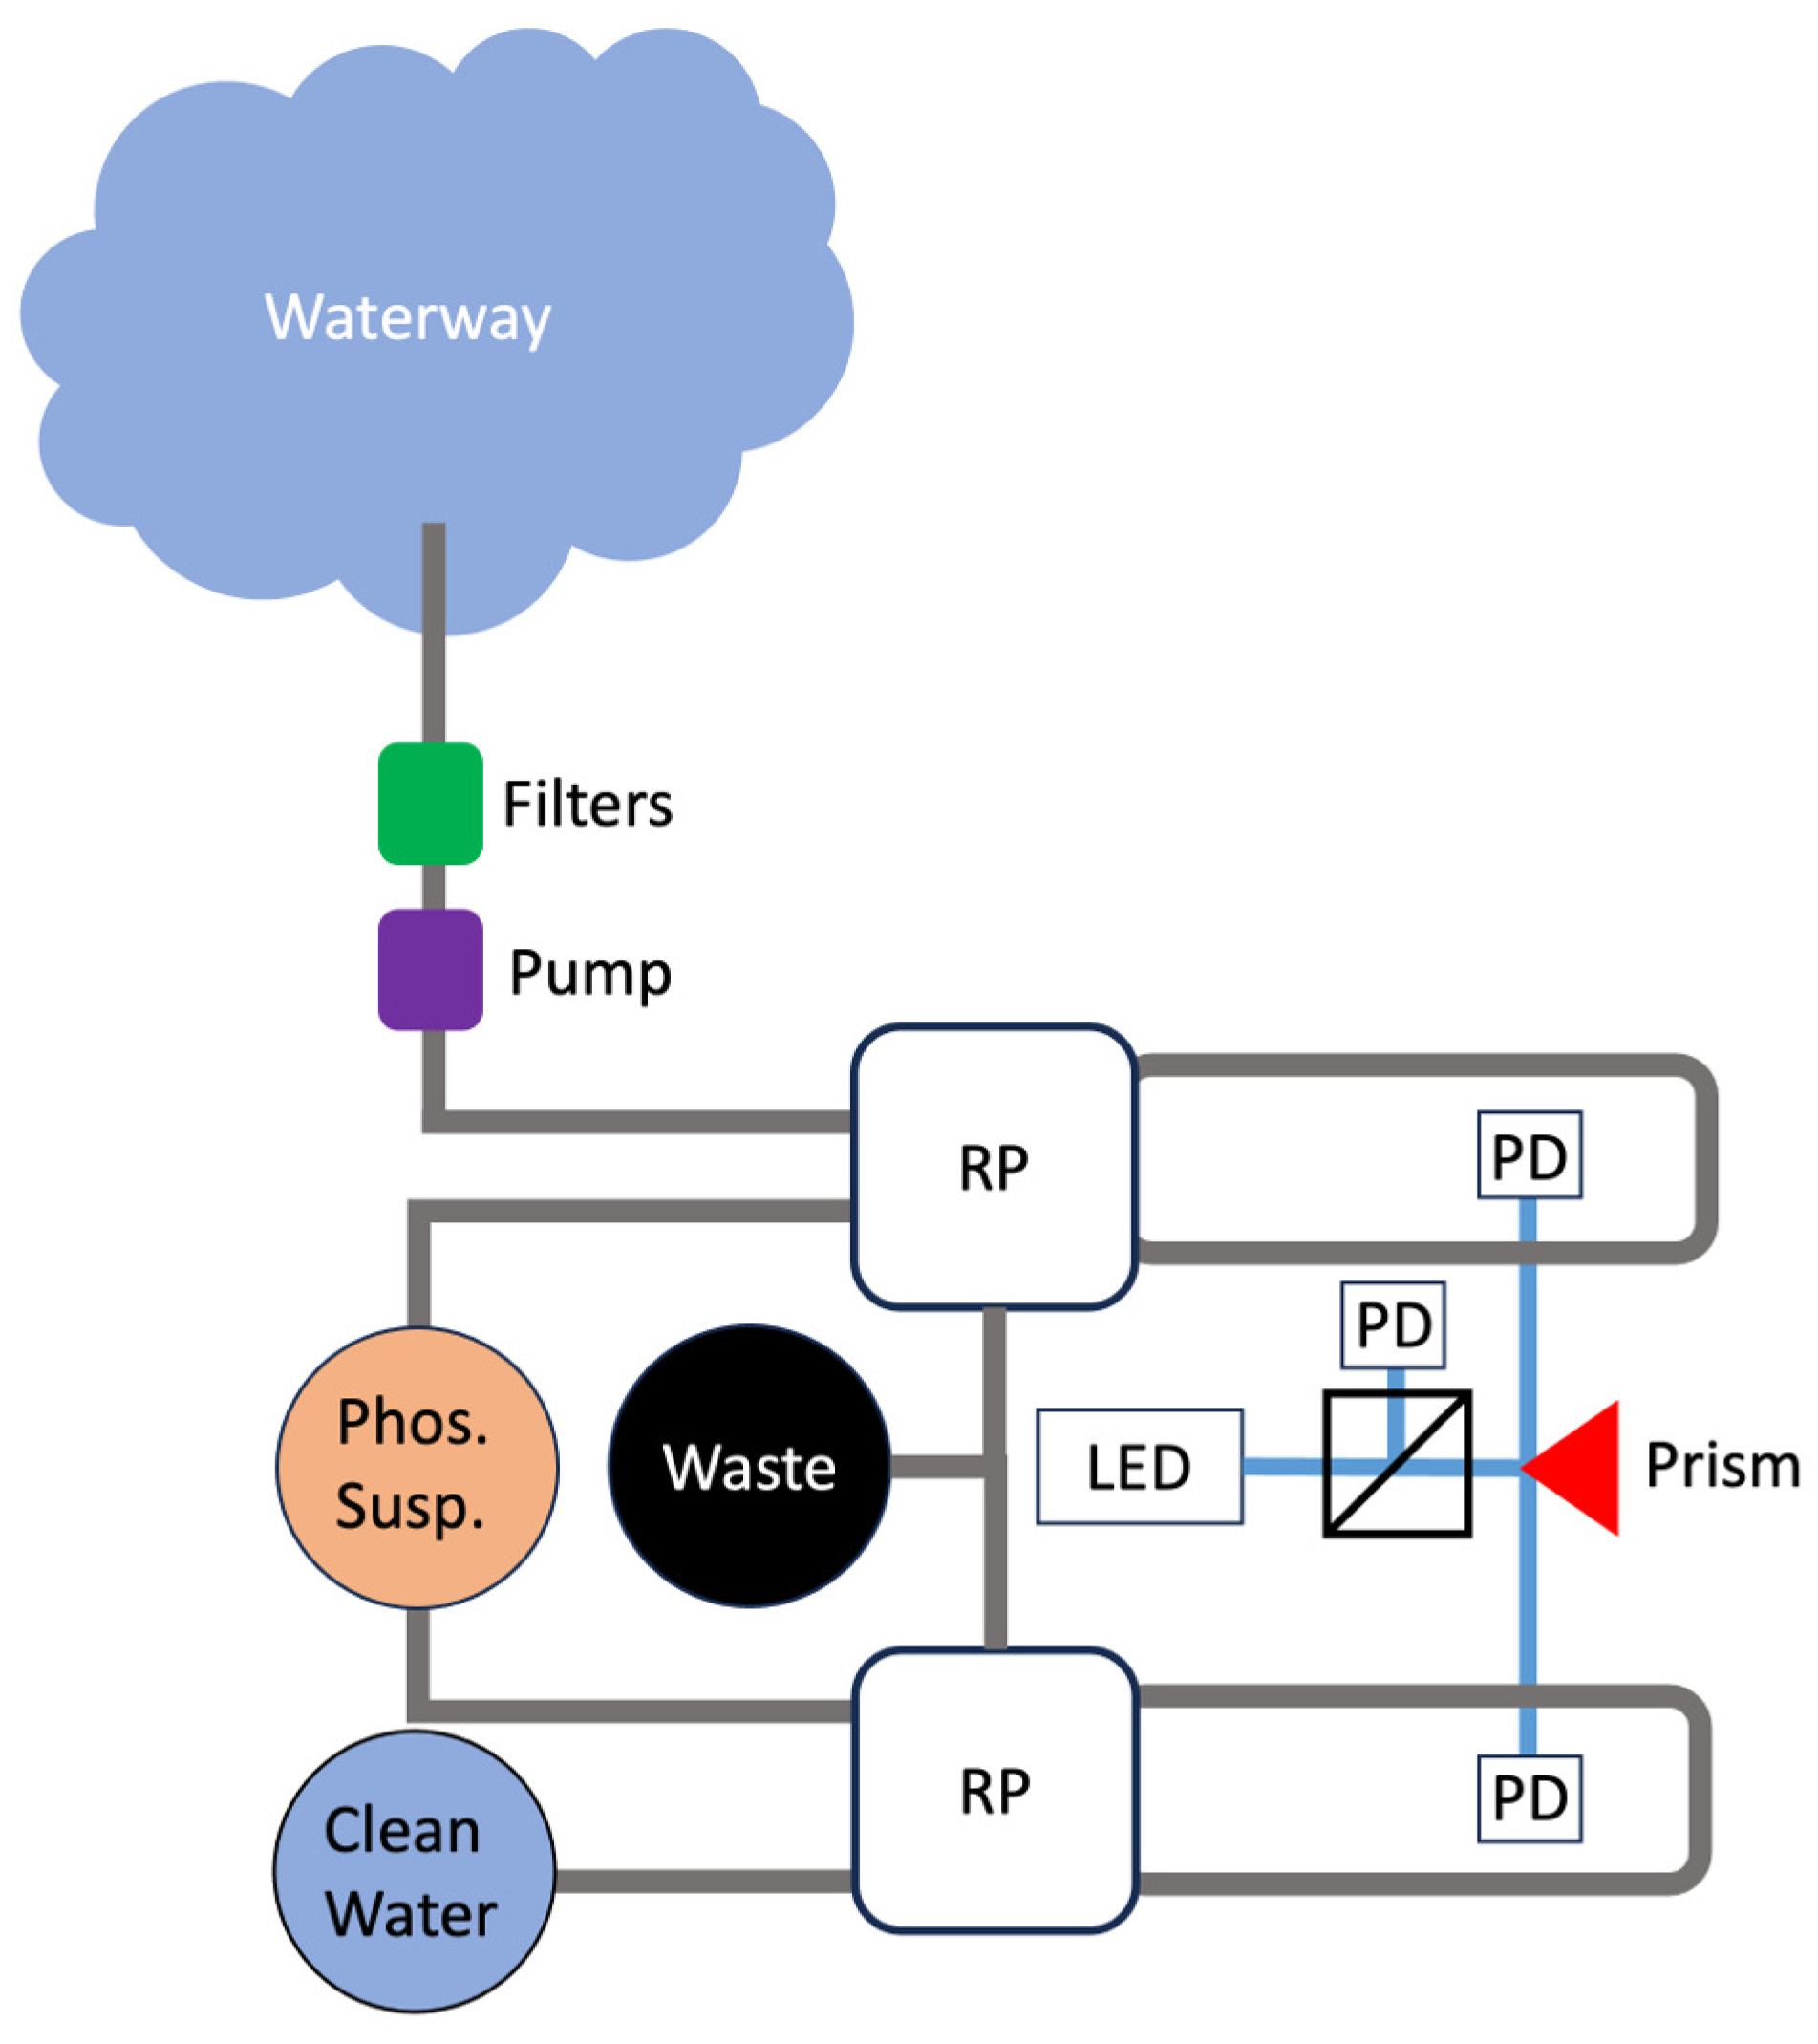
If no suitable solvent can be identified for Eu(cpboda)(DMF, our next approach will be to design an experimental configuration to both minimize concentration variations and perform averaging over concentration variations. A schematic of such a design is shown in Figure 7. The system design begins with a storage tank containing the phosphor dispersed in distilled water, which is maintained in a uniform suspension using an immersion sonicator. When analyzing a contaminated water sample, a portion of the phosphor suspension will be extracted and split into two analysis loops, one mixed with the contaminated water and one mixed with distilled water (to act as a reference). Both analysis loops use recirculating pumps to cycle the sample solution through the optical path of a collimated 394 nm LED, with the resulting fluorescence detected using bandpass filtered photodiodes (PDs). These signals are then compared to calibration data to check that the phosphate-free signal is as expected and to calculate the phosphate concentration of the contaminated water sample. At the same time, we also use a third photodiode to measure the intensity of the LED to account for pump intensity variations.
4. Conclusions
In this study, we have characterized the optical properties, phosphate sensitivity, photodegradation, and solubility of the phosphate-sensitive phosphor Eu(cpboda) (DMF. Optically, the material is found to be most efficiently excited using UV light below 350 nm, which corresponds to the absorption band of the ligand. This observation implies that there is good energy transfer between the ligand and ion. The resulting emission spectrum has an observable transition, which when coupled with the material’s known triclinic crystal structure, suggests that the ions reside in sites having either or symmetry. We also determined the material’s quantum efficiency to be 0.25.
For phosphate sensitivity, we find that the materials has a quenching coefficient of 1.083 (±0.081) , which corresponds to a level of detection (LOD) of 0.208 ± 0.016 M. This quenching coefficient is larger than reported for the Tb-based phosphor and a rough calculation of the concentration-independent sensitivity shows that the Eu version is about eight times more sensitive than the Tb version. These observations confirm our hypothesis that utilizing Eu’s hypersensitive transition improves the phosphate detection sensitivity relative to the Tb version.
While Eu(cpboda)(DMF has excellent phosphate sensitivity, we do observe two challenges to practical application of both this phosphor and Tb(cpboda)(DMF (as they have the same ligands) to in situ phosphate detection. Namely, the ligands are found to have poor photostability under UV excitation and poor solubility in water. To address the challenge of photodegradation, we propose to use a longer wavelength light source that can directly excite the ions and not damage the organic ligands. The most promising wavelength for this purpose is 394 nm, which is found to have an excitation peak with an intensity similar to observed for 280 nm. To address the issue of solubility, we propose two approaches. First, there may be a solvent in which the phosphor is soluble. If identified, this solvent can be used as a buffer solution to precisely control the phosphor concentration when mixing with a contaminated water sample. Alternatively, we can use a systematic approach to average over concentration variations by using a recirculation pump and multiple measurements of a test sample.
5. Disclaimer
This report was prepared as an account of work sponsored by an agency of the United States Government. Neither the United States Government nor any agency thereof, nor any of their employees, makes any warranty, express or implied, or assumes any legal liability or responsibility for the accuracy, completeness, or usefulness of any information, apparatus, product, or process disclosed, or represents that its use would not infringe privately owned rights. Reference herein to any specific commercial product, process, or service by trade name, trademark, manufacturer, or otherwise does not necessarily constitute or imply its endorsement, recommendation, or favoring by the United States Government or any agency thereof. The views and opinions of authors expressed herein do not necessarily state or reflect those of the United States Government or any agency thereof.
Author Contributions
All authors helped conceive the experiments. N.G. and P.N. prepared the solutions. B.R.A. performed the experiments and data analysis, and wrote the manuscript with input from all authors. All authors have read and agreed to the published version of the manuscript.
Funding
This material is based upon work supported by the U.S. Department of Energy, Office of Science, under Award Number(s) DE-SC0022391.
Institutional Review Board Statement
Not applicable.
Informed Consent Statement
Not applicable.
Data Availability Statement
Data underlying the results presented in this paper are available from the authors upon reasonable request.
Conflicts of Interest
The authors declare no conflicts of interest.
References
- Connecticut Department of Energy & Environmental Protection. Aquatic Life Impacts of Phosphorus. Available online: https://portal.ct.gov/DEEP/Water/Inland-Water-Monitoring/Aquatic-Life-Impacts-of-Phosphorus-Research (accessed on 23 February 2023).
- Griffiths, N.A.; Sebestyen, S.D. Dynamic vertical profiles of peat porewater chemistry in a northern peatland. Wetlands 2016, 36, 1119–1130. [Google Scholar] [CrossRef]
- USA Department of Energy. Earth and Environmental Systems Sciences Division, Strategic Plan. Available online: https://science.osti.gov/-/media/ber/pdf/workshop-reports/2018_CESD_Strategic_Plan.pdf (accessed on 23 February 2023).
- Pellerin, B.A.; Stauffer, B.A.; Young, D.A.; Sullivan, D.J.; Bricker, S.B.; Walbridge, M.R.; Clyde, G.A.; Shaw, D.M. Emerging tools for continuous nutrient monitoring networks: Sensors advancing science and water resources protection. J. Am. Water Resour. Assoc. 2016, 52, 993–1008. [Google Scholar] [CrossRef]
- USA Environmental Protection Agency. Methods for Evaluating Wetland Condition: #18 Biogeochemical Indicators. Available online: https://www.epa.gov/sites/default/files/documents/wetlands_18biogeochemical.pdf (accessed on 23 February 2023).
- USA Environmental Protection Agency. National Aquatic Resource Surveys. Available online: https://www.epa.gov/national-aquatic-resource-surveys/indicators-phosphorus (accessed on 23 February 2023).
- USA Environmental Protection Agency. Nutrient Pollution. Available online: https://www.epa.gov/nutrientpollution/issue (accessed on 23 February 2023).
- Water Research Center. Phosphates in the Environment. Available online: https://www.knowyourh2o.com/outdoor-4/phosphates-in-the-environment (accessed on 23 February 2023).
- Reddy, K.R.; Kadlec, R.H.; Flaig, E.; Gale, P.M. Phosphorus retention in streams and wetlands: A review. Crit. Rev. Environ. Sci. Technol. 1999, 29, 83–146. [Google Scholar] [CrossRef]
- USA Geological Survey. Phosphorus and Water. Available online: https://www.usgs.gov/special-topic/water-science-school/science/phosphorus-and-water?qt-science_center_objects=0#qt-science_center_objects (accessed on 23 February 2023).
- Watson, S.J.; Cade-Menun, B.J.; Needoba, J.A.; Peterson, T.D. Phosphorus forms in sediments of a river-dominated estuary. Front. Mar. Sci. 2018, 5, 302. [Google Scholar] [CrossRef]
- Brenner, J.; Porter, W.; Phillips, J.R.; Childs, J.; Yang, X.; Mayes, M.A. Phosphorus sorption on tropical soils with relevance to earth system model needs. Soil Res. 2019, 57, 17. [Google Scholar] [CrossRef]
- USA Department of Energy. Research Priorities to Incorporate Terrestrial-Aquatic Interfaces in Earth System Models. Available online: https://ess.science.energy.gov/wp-content/uploads/2020/12/TAI_Workshop2016-1.pdf (accessed on 23 February 2023).
- Dunne, E.; Clark, M.; Mitchell, J.; Jawitz, J.; Reddy, K. Soil phosphorus flux from emergent marsh wetlands and surrounding grazed pasture uplands. Ecol. Eng. 2010, 36, 1392–1400. [Google Scholar] [CrossRef]
- Dodds, W.K.; Bouska, W.W.; Eitzmann, J.L.; Pilger, T.J.; Pitts, K.L.; Riley, A.J.; Schloesser, J.T.; Thornbrugh, D.J. Eutrophication of u.s. freshwaters: Analysis of potential economic damages. Environ. Sci. Technol. 2008, 43, 12–19. [Google Scholar] [CrossRef]
- Mueller, D.K.; Helsel, D.R. Nutrients in the Nation’s Waters—Too Much of a Good Thing? Available online: https://pubs.usgs.gov/circ/circ1136/ (accessed on 23 February 2023).
- Patel, V.; Kruse, P.; Selvaganapathy, P.R. Review-solid state sensors for phosphate detection in environmental and medical diagnostics. J. Electrochem. Soc. 2022, 169, 077505. [Google Scholar] [CrossRef]
- Zhu, X.; Ma, J. Recent advances in the determination of phosphate in environmental water samples: Insights from practical perspectives. Trends Anal. Chem. 2020, 127, 115908. [Google Scholar] [CrossRef]
- Yang, D.-D.; Lu, L.-P.; Zhu, M.-L. A design for detecting phosphate ions in aqueous solution by luminescent tb-coordination polymer. Inorg. Chim. Acta 2021, 515, 120030. [Google Scholar] [CrossRef]
- Kröckel, L.; Lehmann, H.; Wieduwilt, T.; Schmidt, M.A. Fluorescence detection for phosphate monitoring using reverse injection analysis. Talanta 2014, 125, 107–113. [Google Scholar] [CrossRef]
- Zhang, Y.; Sheng, S.; Mao, S.; Wu, X.; Li, Z.; Tao, W.; Jenkinson, I.R. Highly sensitive and selective fluorescent detection of phosphate in water environment by a functionalized coordination polymer. Water Res. 2019, 163, 114883. [Google Scholar] [CrossRef]
- Yang, J.; Dai, Y.; Zhu, X.; Wang, Z.; Li, Y.; Zhuang, Q.; Shi, J.; Gu, J. Metal–organic frameworks with inherent recognition sites for selective phosphate sensing through their coordination-induced fluorescence enhancement effect. J. Mater. Chem. 2015, 3, 7445–7452. [Google Scholar] [CrossRef]
- Xu, H.; Cao, C.-S.; Zhao, B. A water-stable lanthanide-organic framework as a recyclable luminescent probe for detecting pollutant phosphorus anions. Chem. Commun. 2015, 51, 10280–10283. [Google Scholar] [CrossRef]
- Jiang, S.-Q.; Zhou, Z.-Y.; Zhuo, S.-P.; Shan, G.-G.; Xing, L.-B.; Wang, H.-N.; Su, Z.-M. Rational design of a highly sensitive and select turn-on fluorescent sensor for detection. Dalton Trans. 2015, 44, 20830–20833. [Google Scholar] [CrossRef]
- Ji, G.; Gao, X.; Zheng, T.; Guan, W.; Liu, H.; Liu, Z. Postsynthetic metalation metal-organic framework as a fluorescent probe for the ultrasensitive and reversible detection of ions. Inorg. Chem. 2018, 57, 10525–10532. [Google Scholar] [CrossRef]
- Asha, K.S.; Bhattacharjee, R.; Mandal, S. Complete transmetalation in a metal-organic framework by metal ion metathesis in a single crystal for selective sensing of phosphate ions in aqueous media. Angew. Chem. Int. Ed. 2016, 55, 11528–11532. [Google Scholar] [CrossRef]
- Zhao, S.; Xiao, J.; Zheng, T.; Liu, M.; Wu, H.; Liu, Z. Highly Selective and Sensitive Detection of Ions in Aqueous Solution by a Luminescent Terbium Metal–Organic Framework. ASC Omega 2019, 4, 16378–16384. [Google Scholar] [CrossRef]
- Das, A.; Das, S.; Trivedi, V.; Biswas, S. A dual functional MOF-based fluorescent sensor for intracellular phosphate and extracellular 4-nitrobenzaldehyde. Dalton Trans. 2019, 48, 1332–1343. [Google Scholar] [CrossRef]
- Li, P.; Dong, L.; Jin, H.; Yang, J.; Tu, Y.; Wang, C.; He, Y. Fluorescence detection of phosphate in an aqueous environment by an aluminum-based metal-organic framework with amido functionalized ligands. Front. Environ. Sci. Eng. 2022, 16, 159. [Google Scholar] [CrossRef]
- Rao, P.C.; Mandal, S. Europium-based metal–organic framework as a dual luminescence sensor for the selective detection of the phosphate anion and fe3+ ion in aqueous media. Inorg. Chem. 2018, 57, 11855–11858. [Google Scholar]
- Wu, H.; Tong, C. A specific turn-on fluorescent sensing for ultrasensitive and selective detection of phosphate in environmental samples based on antenna effect-improved FRET by surfactant. ACS Sens. 2018, 3, 1539–1545. [Google Scholar] [CrossRef]
- Zhao, D.; Wan, X.; Song, H.; Hao, L.; Su, Y.; Lv, Y. Metal-organic frameworks (MOFs) combined with ZnO quantum dots as a fluorescent sensing platform for phosphate. Sens. Actuators D Chem. 2014, 197, 50–57. [Google Scholar] [CrossRef]
- Naskar, K.; Bhanja, A.K.; Paul, S.; Pal, K.; Sinha, C. Trace quantity detection of H2 by fluorescent metal–organic framework (f-MOF) and bioimaging study. Cryst. Growth Des. 2020, 20, 6453–6460. [Google Scholar] [CrossRef]
- Bünzli, J.-C.G.; Eliseeva, S.V. Basics of Lathanide Photophysics. In Lanthanide Luminescence: Photophysical, Analytical and Biological Aspects; Hanninen, P., Harma, H., Eds.; Springer: Berlin/Heidelberg, Germany, 2010. [Google Scholar]
- Yang, D.-D.; Lu, L.-P.; Zhu, M.-L. A new family of lanthanide coordination polymers based on 3,3’-[(5-carboxylato-1,3-phenylene)bis(oxy)]dibenzoate: Synthesis, crystal structures and magnetic and luminescence properties. Acta Crystallogr. Sect. Struct. Chem. 2020, 76, 763–770. [Google Scholar] [CrossRef]
- Binnemans, K. Interpretation of Europium(III) Spectra. Coord. Chem. Rev. 2015, 295, 1–45. [Google Scholar] [CrossRef]
- Ciric, A.; Stojadinovic, S.; Sekulic, M.; Dramicanin, M.D. JOES: An application software for Judd-Ofelt analysis from Eu3+ emission spectra. J. Lumin. 2019, 205, 351–356. [Google Scholar] [CrossRef]
- Anderson, B.R.; Gese, N.; Eilers, H. Spectroscopic properties of Eu:Y(acac)3(DPEPO) and characterization of its photo- and thermal- degradation. J. Lumin. 2022, 251, 119183. [Google Scholar] [CrossRef]
- Anderson, B.R.; Gese, N.; Nawani, P.; Eilers, H. Aqueous Phosphate Detection using Eu(acac)3. Appl. Phys. B 2023, 129, hl188. [Google Scholar] [CrossRef]
- Saeed, M.A.; Powell, D.R.; Hossain, M.A. Fluorescent detection of phosphate anion by a highly selective chemosensor in water. Tetrahedron Lett. 2010, 51, 4904–4907. [Google Scholar] [CrossRef]
- Pierre, V.C.; Wilharm, R.K. Design Principles and Applications of Selective Lanthanide-Based Receptors for Inorganic Phosphate. Front. Chem. 2022, 10, 821020. [Google Scholar] [CrossRef] [PubMed]
- Shiery, R.C.; Cooper, K.A.; Cantu, D.C. Computational Prediction of All Lanthanide Aqua Ion Acidity Constants. Inorg. Chem. 2021, 60, 10257–10266. [Google Scholar] [CrossRef] [PubMed]
- Zhou, Z.; Wang, C.; Zhu, G.; Du, B.; Yu, B.; Wang, C. Water-stable europium(III) and terbium(III)-metal organic frameworks as fluorescent sensors to detect ions, antibiotics and pesticides in aqueous solutions. J. Mol. Struct. 2022, 1251, 132009. [Google Scholar] [CrossRef]
Figure 1.
Chemical structure of Eu(cpboda)(DMF)2. Note that the structure was drawn based on a figure from ref. [19].
Figure 1.
Chemical structure of Eu(cpboda)(DMF)2. Note that the structure was drawn based on a figure from ref. [19].
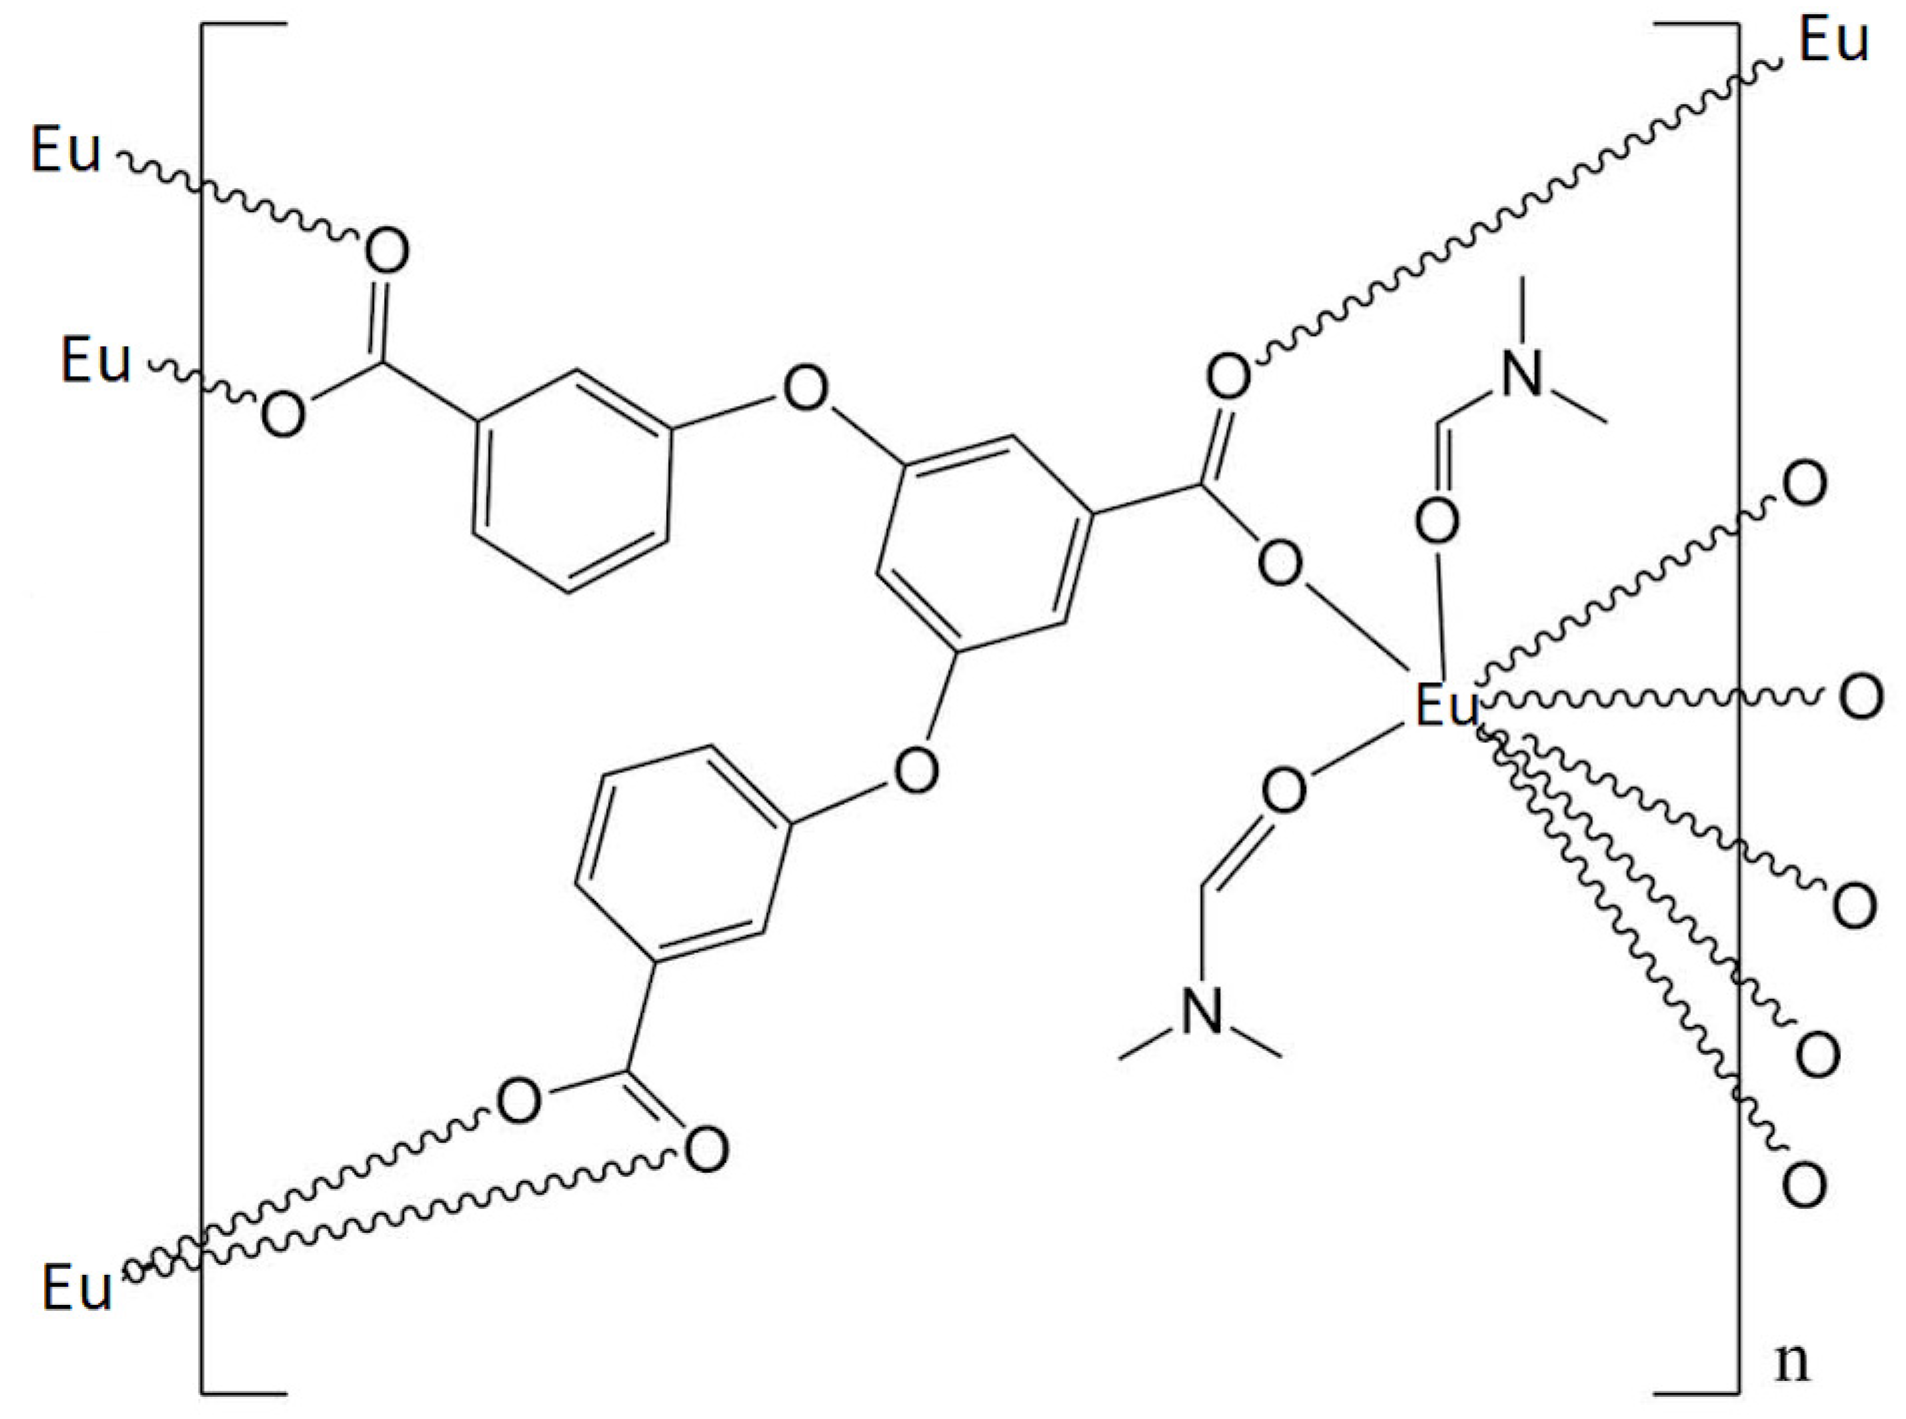
Figure 2.
UV excitation (a) and visible emission (b) spectra of Eu(cpboda)(DMF with transition assignments labeled. Note that the broad excitation peaks below 350 nm are due to absorption by the cpboda ligand, while the sharp peaks above 350 nm are due to direct excitation of the Eu ions.
Figure 2.
UV excitation (a) and visible emission (b) spectra of Eu(cpboda)(DMF with transition assignments labeled. Note that the broad excitation peaks below 350 nm are due to absorption by the cpboda ligand, while the sharp peaks above 350 nm are due to direct excitation of the Eu ions.

Figure 3.
Normalized peak intensity as a function of time during photodegradation for a powder sample (a) and a stirred solution (b). Note that each data point was collected over 1 s and are spaced by 20 s.
Figure 3.
Normalized peak intensity as a function of time during photodegradation for a powder sample (a) and a stirred solution (b). Note that each data point was collected over 1 s and are spaced by 20 s.
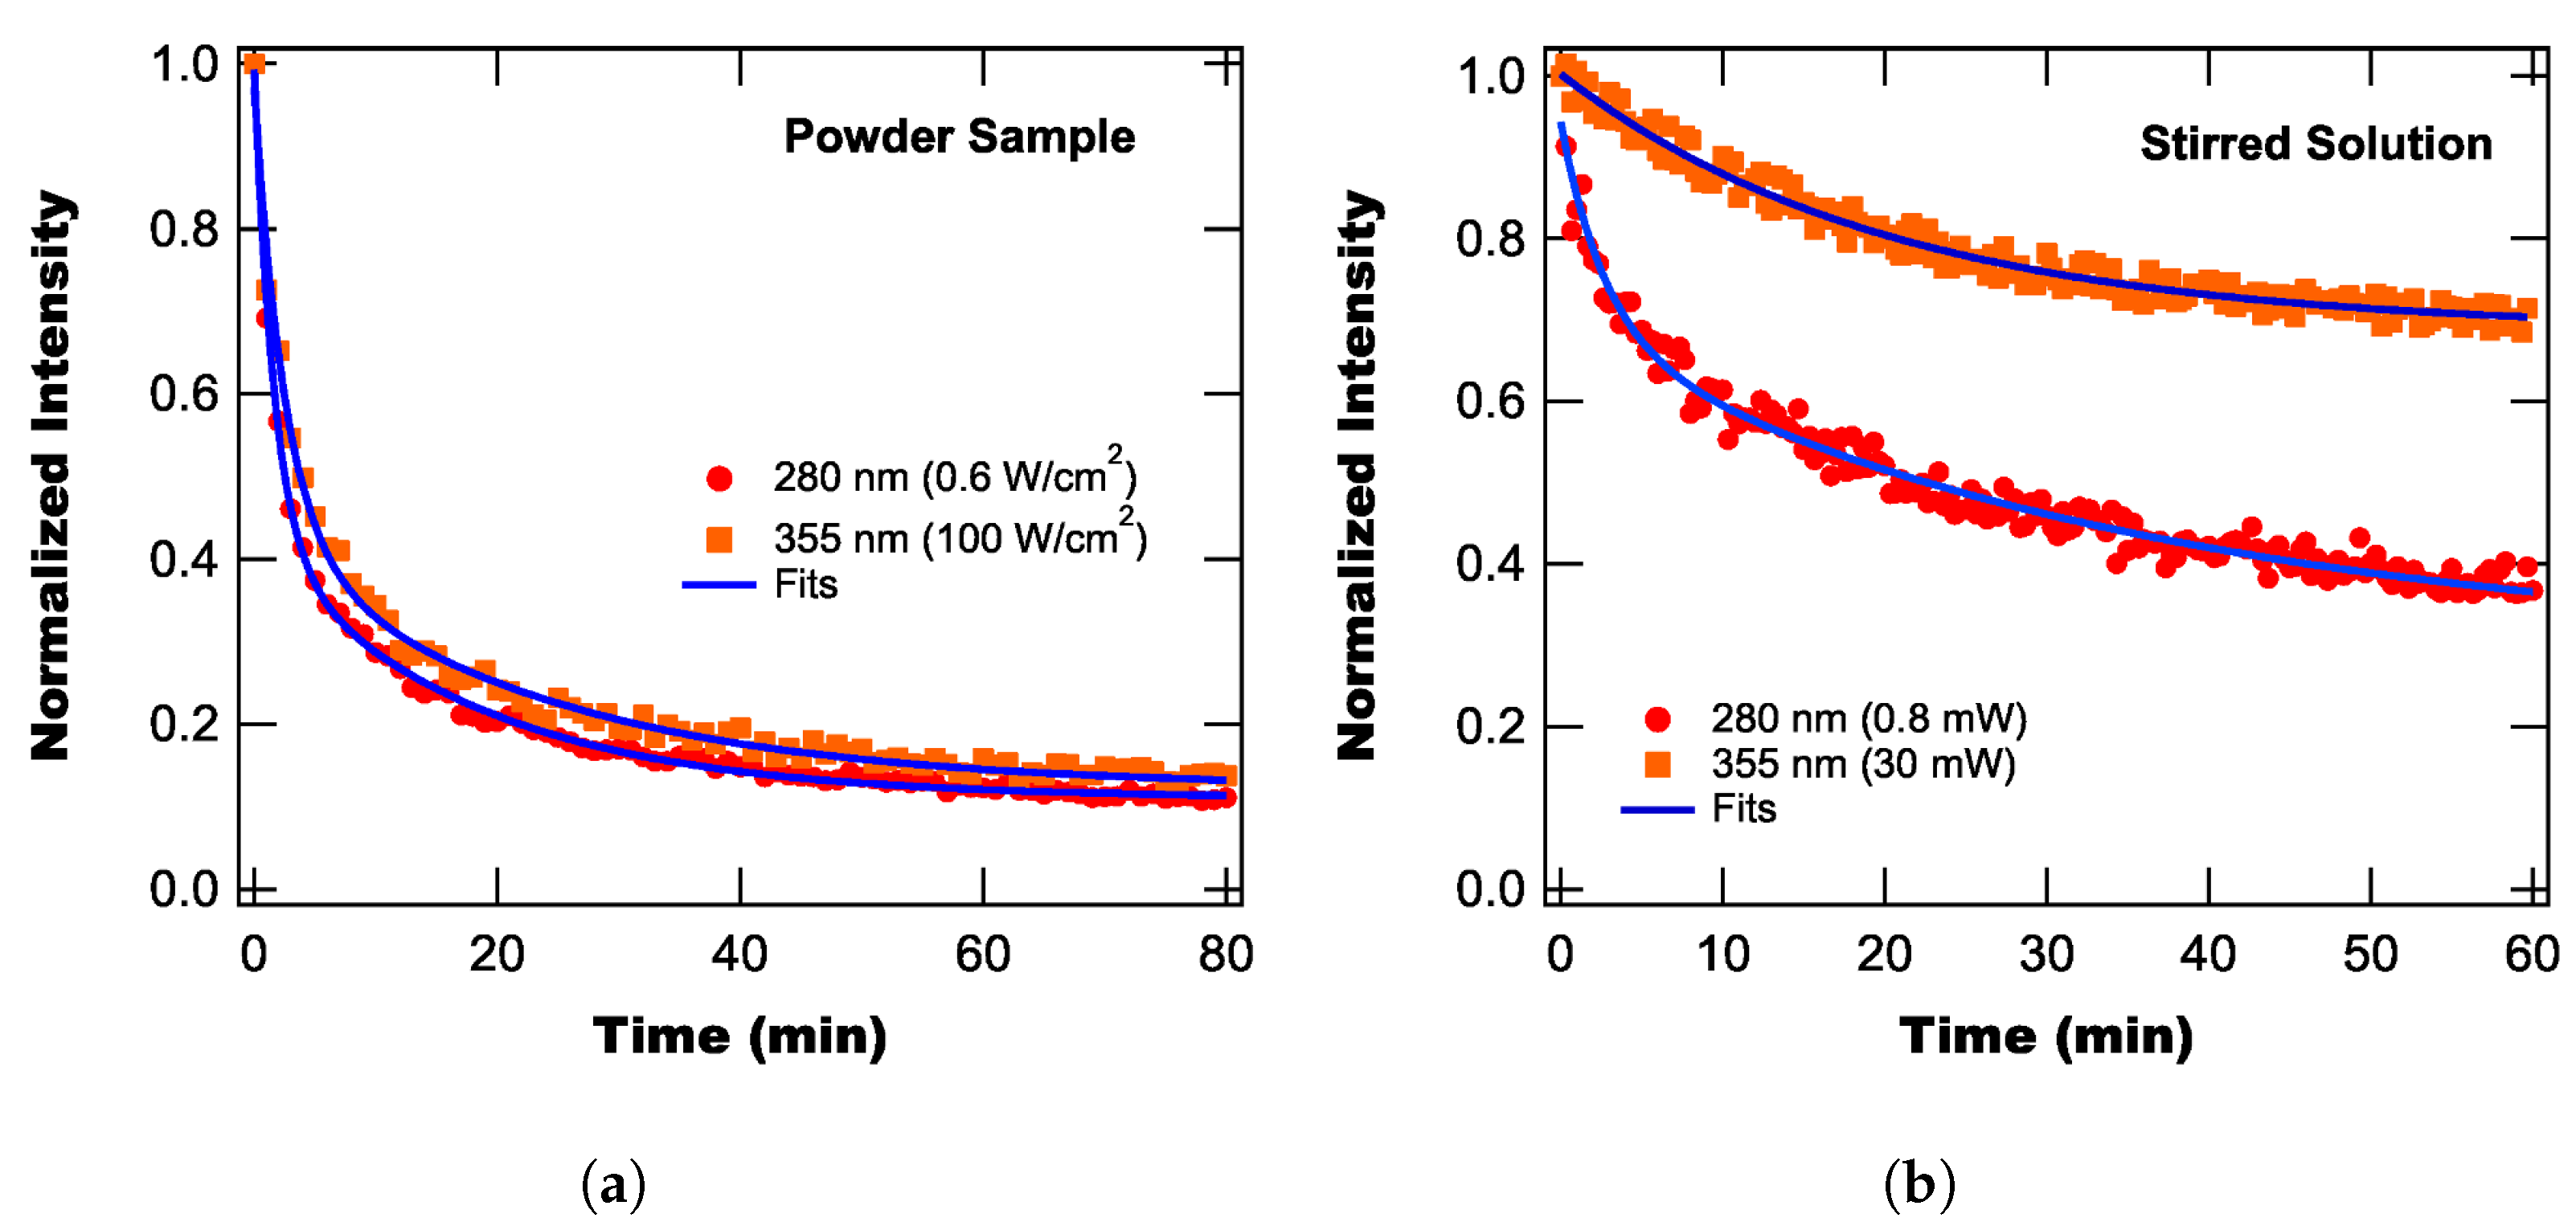
Figure 4.
Peak intensity of spectra measured from a single vial (with agitation between measurements) (a) and from five different vials (b).
Figure 4.
Peak intensity of spectra measured from a single vial (with agitation between measurements) (a) and from five different vials (b).
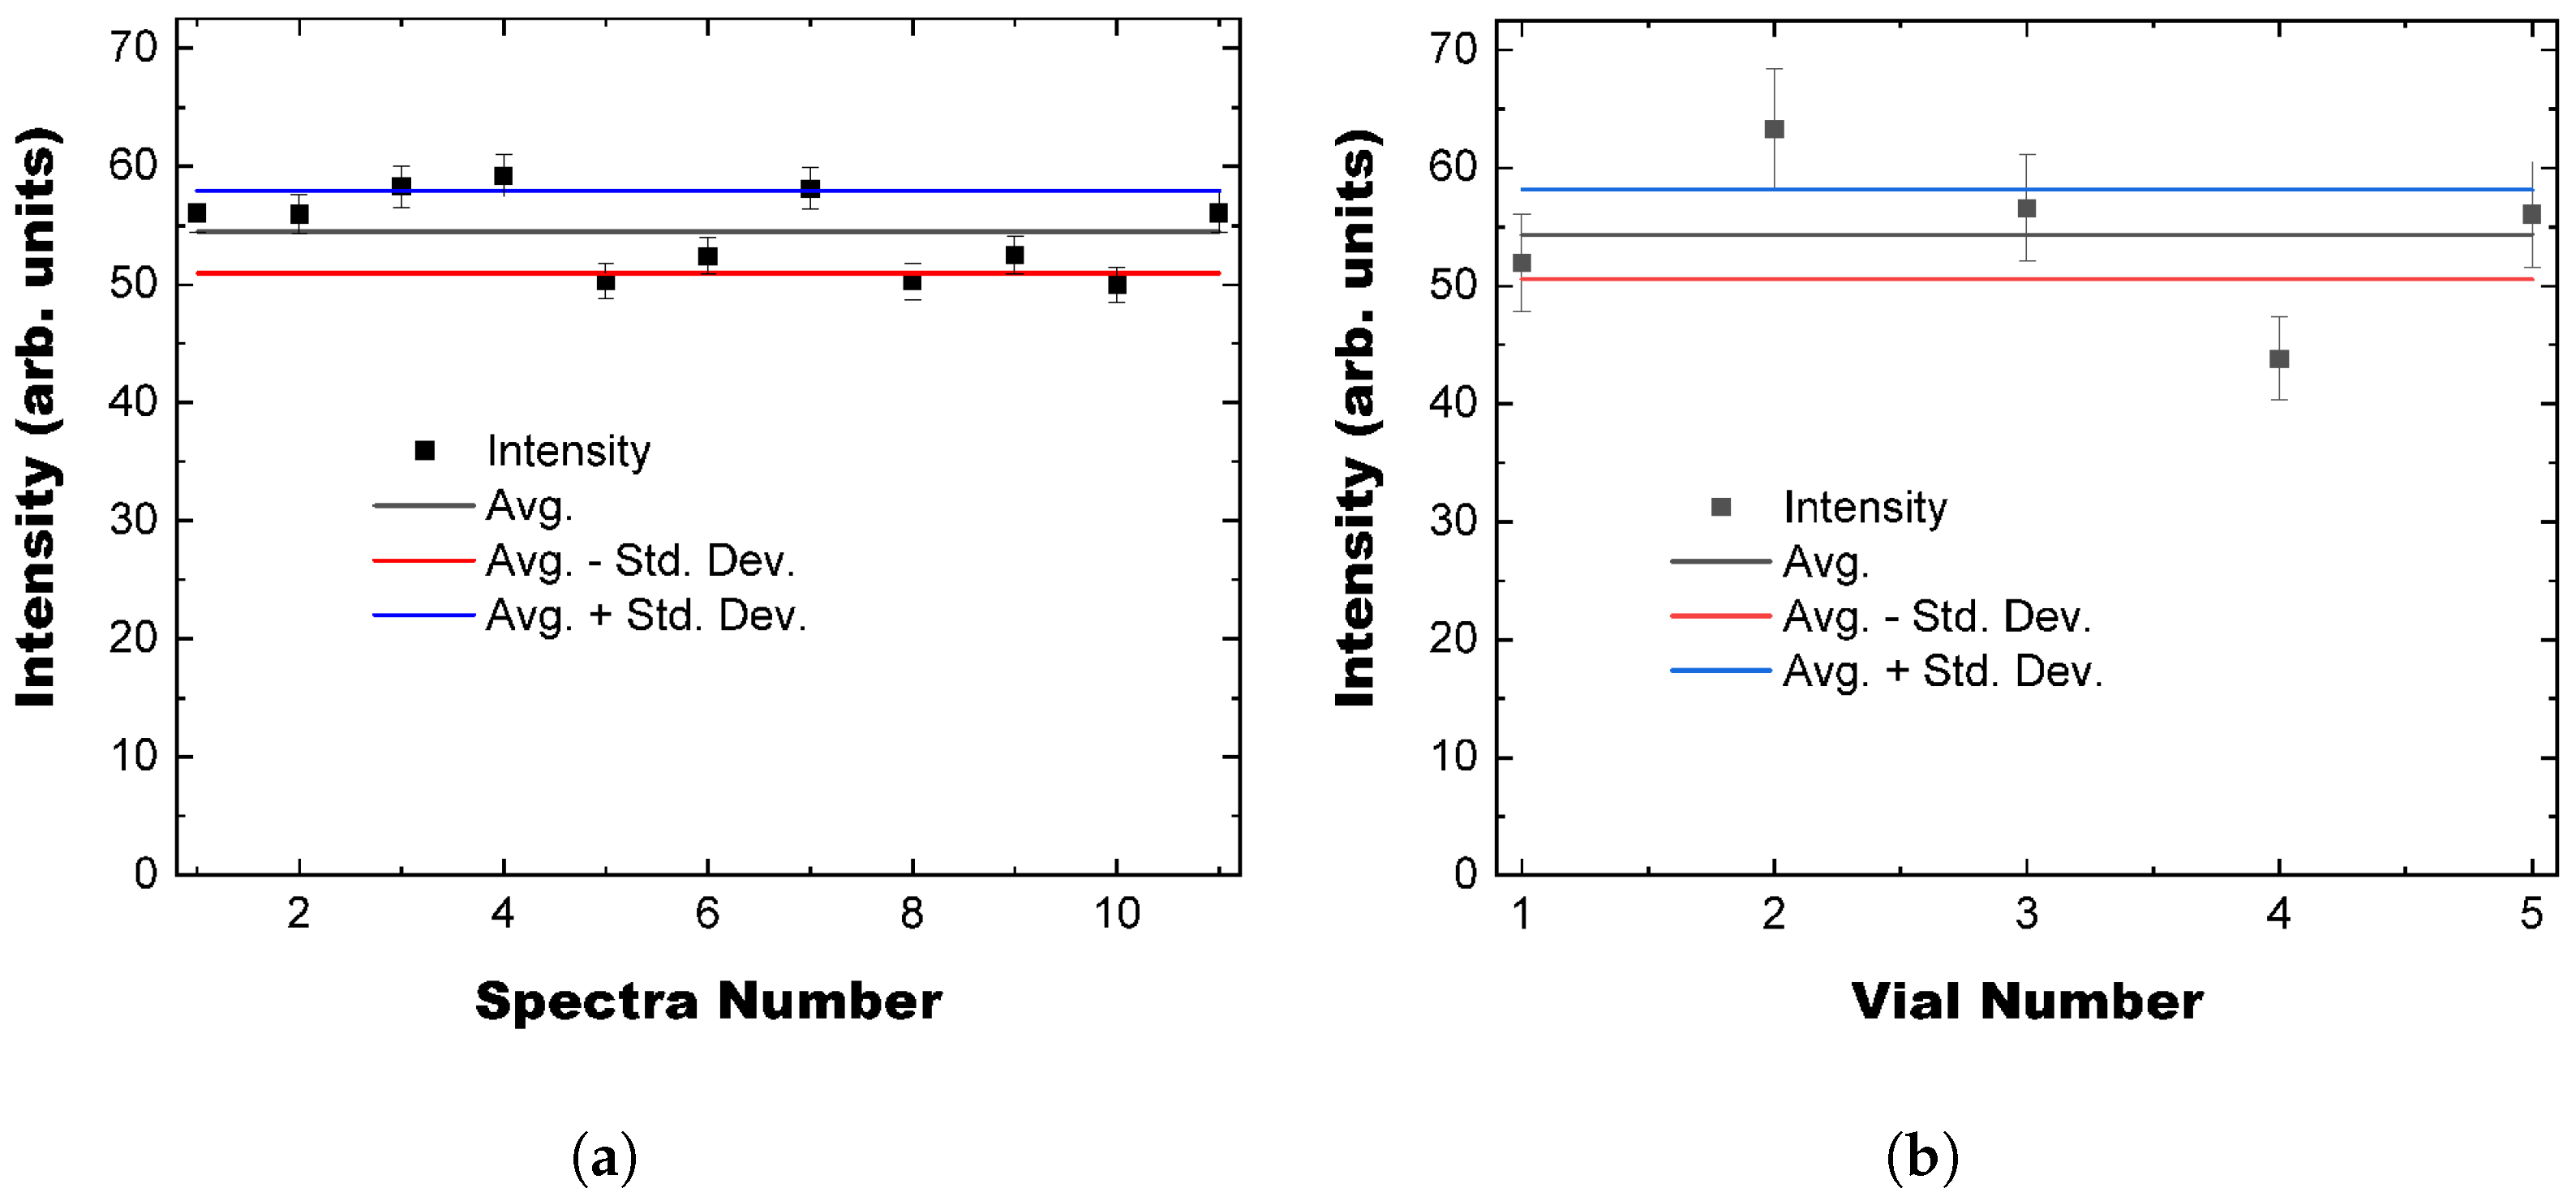
Figure 5.
Spectra of aqueous solution containing Eu(cpboda)(DMF phosphor and phosphate using 280 nm excitation. hypersensitive transition.
Figure 5.
Spectra of aqueous solution containing Eu(cpboda)(DMF phosphor and phosphate using 280 nm excitation. hypersensitive transition.
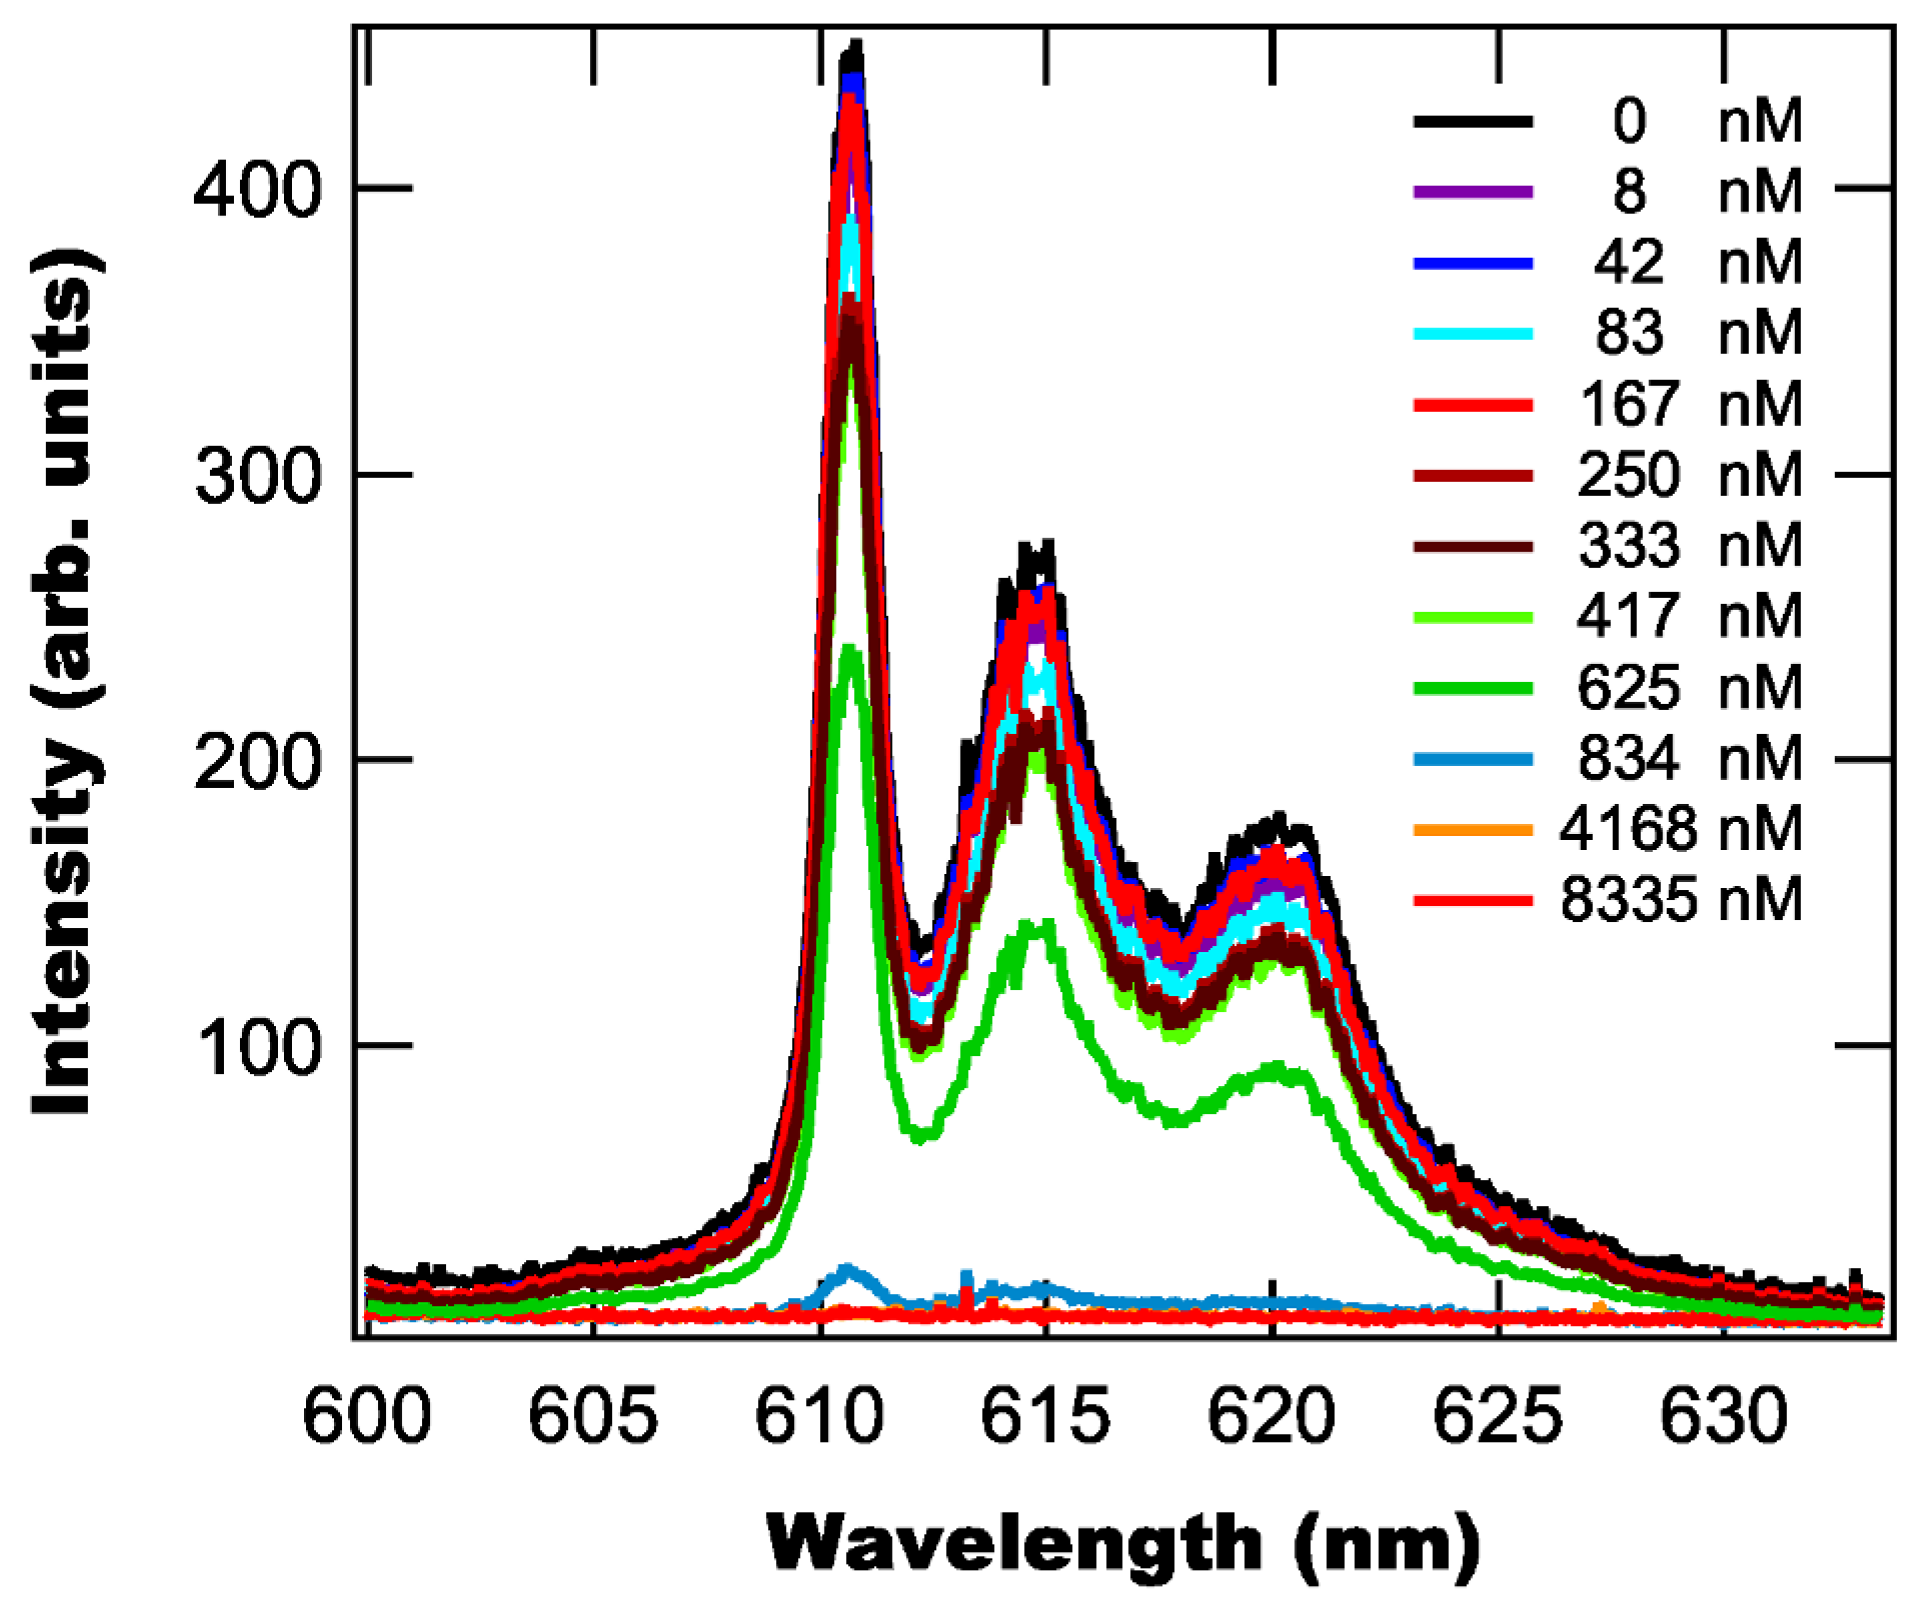
Figure 6.
Peak intensity ratio as a function of concentration with a linear fit to data below 625 nM, but extended to width of graph to show onset of nonlinear behavior. Inset: zoomed in view of linear fit to low concentration data.
Figure 6.
Peak intensity ratio as a function of concentration with a linear fit to data below 625 nM, but extended to width of graph to show onset of nonlinear behavior. Inset: zoomed in view of linear fit to low concentration data.
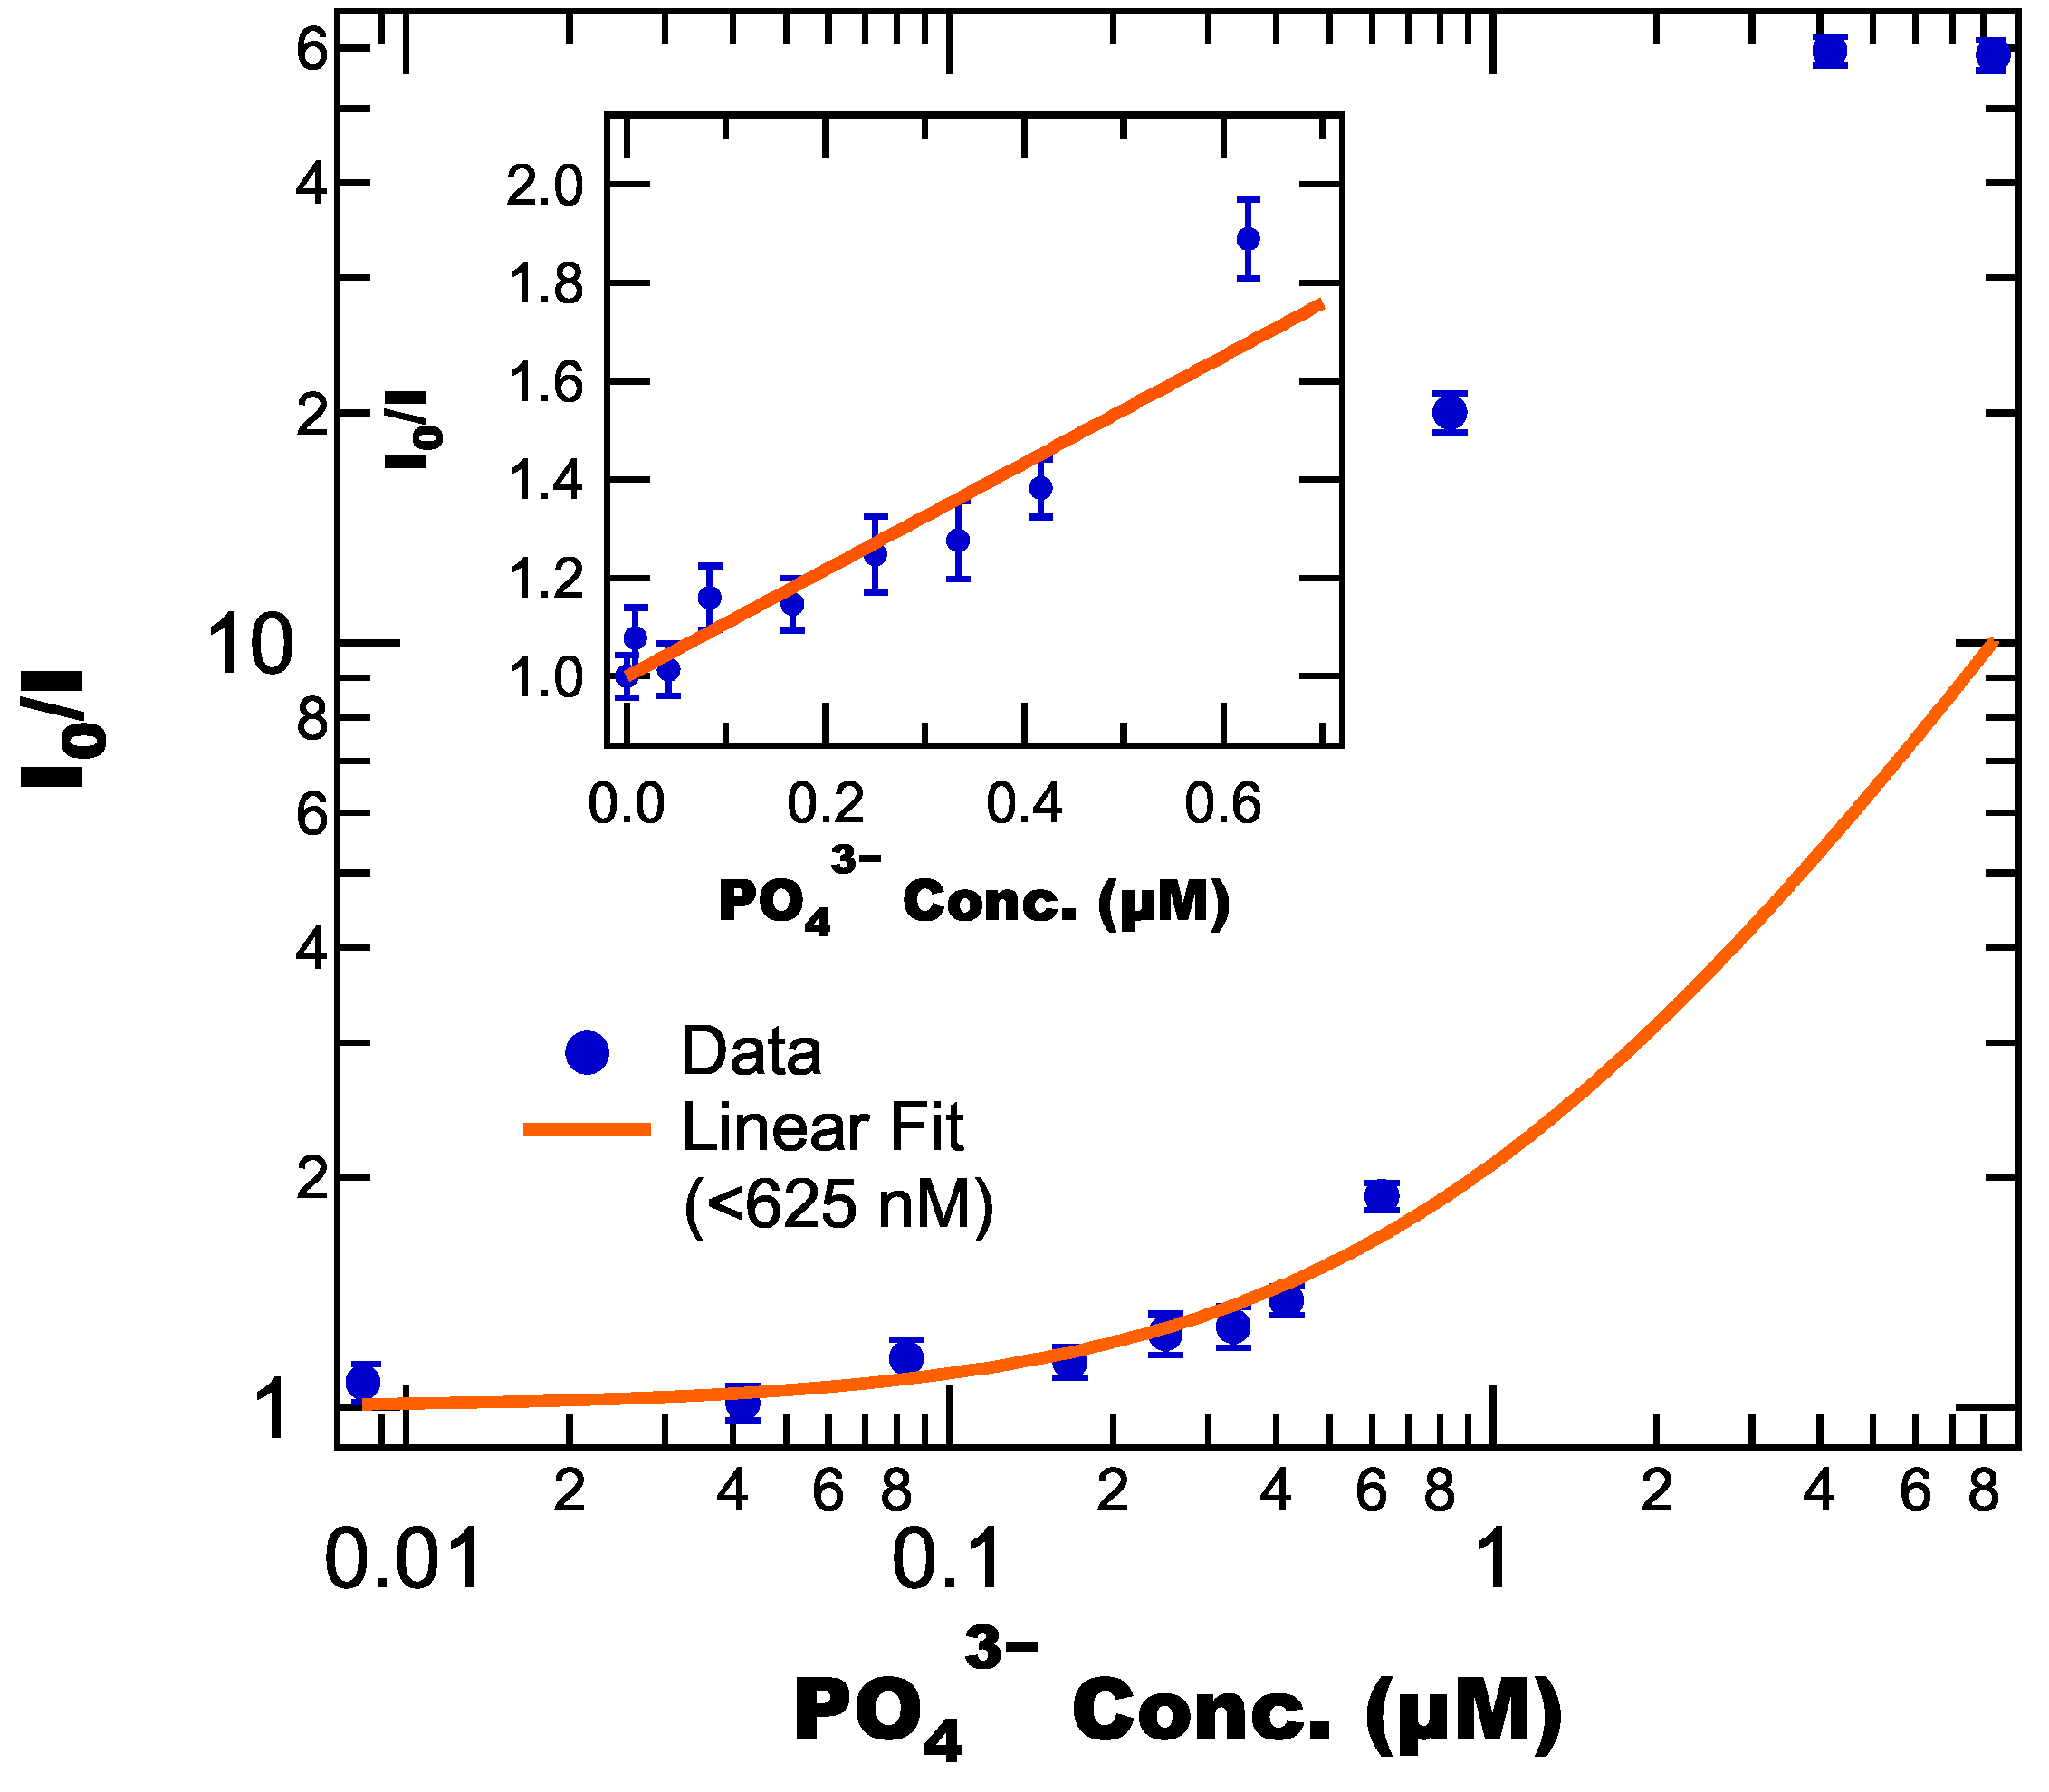
Figure 7.
Schematic of in situ analysis system for fluorescence-based phosphate detection. To collect a sample for testing, the unit will use a series of filters and a pump to collect water and filter out large debris and particulates. The sample is then mixed with the phosphor suspension in a recirculating pump (RP) unit, which loops the sample through the optical beam path multiple times, after which it is dumped into a waste container. Additionally, we include two diagnostics to ensure that the system is operating properly: (1) a beam splitting pick-off with a photodiode to monitor the LED intensity and (2) a reference loop in which the phosphor suspension is mixed with clean water.


Table 1.
Peak locations and transition assignments determined multipeak fitting of excitation and emission spectra.
Table 1.
Peak locations and transition assignments determined multipeak fitting of excitation and emission spectra.
| Transition | Peak Locations | Transition | Peak Locations | ||
|---|---|---|---|---|---|
| (eV) | (nm) | eV | nm | ||
|
2.316 2.338 2.358 | 535.36 530.33 528.82 | 1.761 | 704.12 | ||
| 1.767 | 701.88 | ||||
| 1.771 | 700.34 | ||||
| 1.784 | 694.97 | ||||
| 1.803 | 687.69 | ||||
| 1.811 | 684.53 | ||||
| 2.617 2.670 | 472.80 464.47 | 1.829 | 678.04 | ||
| 1.858 | 667.66 | ||||
| 1.897 | 653.63 | ||||
| 1.909 | 649.56 | ||||
| 2.980 | 416.13 | 2.000 | 620.15 | ||
| 2.026 | 617.53 | ||||
| 2.030 | 616.30 | ||||
| 2.017 | 615.08 | ||||
| 3.094 | 400.74 | 2.094 | 592.04 | ||
| 3.144 | 394.42 | 2.100 | 590.44 | ||
| 3.233 | 383.58 | 2.141 | 579.08 | ||
| 3.291 | 376.74 | ||||
| 3.415 | 363.14 | ||||
Table 2.
Judd-Offelt parameters for Eu(cpboda)(DMF determined using JOES software and the emission spectrum for 355 nm excitation.
Table 2.
Judd-Offelt parameters for Eu(cpboda)(DMF determined using JOES software and the emission spectrum for 355 nm excitation.
| Parameter | Value |
|---|---|
| ( c) | 5.58 |
| ( c) | 3.46 |
| () | 54.0 |
| () | 185 |
| () | 56.3 |
| (ms) | 3.45 |
| 0.25 |
Disclaimer/Publisher’s Note: The statements, opinions and data contained in all publications are solely those of the individual author(s) and contributor(s) and not of MDPI and/or the editor(s). MDPI and/or the editor(s) disclaim responsibility for any injury to people or property resulting from any ideas, methods, instructions or products referred to in the content. |
© 2024 by the authors. Licensee MDPI, Basel, Switzerland. This article is an open access article distributed under the terms and conditions of the Creative Commons Attribution (CC BY) license (https://creativecommons.org/licenses/by/4.0/).
Share and Cite
MDPI and ACS Style
Anderson, B.R.; Gese, N.; Nawani, P.; Eilers, H. Fluorescence-Based Aqueous Phosphate Sensing Using Eu(cpboda)(DMF)2. Photonics 2024, 11, 250. https://doi.org/10.3390/photonics11030250
AMA Style
Anderson BR, Gese N, Nawani P, Eilers H. Fluorescence-Based Aqueous Phosphate Sensing Using Eu(cpboda)(DMF)2. Photonics. 2024; 11(3):250. https://doi.org/10.3390/photonics11030250
Chicago/Turabian StyleAnderson, Benjamin R., Natalie Gese, Pranav Nawani, and Hergen Eilers. 2024. "Fluorescence-Based Aqueous Phosphate Sensing Using Eu(cpboda)(DMF)2" Photonics 11, no. 3: 250. https://doi.org/10.3390/photonics11030250
Note that from the first issue of 2016, this journal uses article numbers instead of page numbers. See further details here.