Narrow Linewidth 510 nm Laser via Single-Pass Frequency-Tripling by Waveguide PPLNs
by
 ,
,
Yanlin Chen
1,2 ,
,
Jing Zhang
1,
Xiaolang Qiu
1,
Suo Wang
1,
Chuanchuan Li
1,
Haiyang Yu
1,* and
Xin Wei
1,2,* 1
Laboratory of Nano Optoelectronics, Institute of Semiconductor, Chinese Academy of Sciences, Beijing 100083, China
2
College of Materials Science and Optoelectronic Technology, University of Chinese Academy of Sciences, Beijing 100049, China
*
Authors to whom correspondence should be addressed.
Photonics 2024, 11(3), 269; https://doi.org/10.3390/photonics11030269
Submission received: 29 February 2024
/
Revised: 13 March 2024
/
Accepted: 15 March 2024
/
Published: 18 March 2024
(This article belongs to the Special Issue Narrow Linewidth Laser Sources and Their Applications)
Abstract
:A single-frequency narrow linewidth green laser at 510 nm is a vital component for the study of Cesium Rydberg atoms. Here, we demonstrate a 510 nm laser based on single-pass second-harmonic generation (SHG) and sum-frequency generation (SFG) via waveguide Periodically Poled Lithium Niobate (PPLN) seeded with a common C-band laser (1530 nm). The final linewidth measured using the delayed self-heterodyne method reaches a narrow linewidth of 4.8 kHz. And, the optical-to-optical conversion efficiency is up to 13.1% and reaches an output power up to 200 mW.
1. Introduction
Narrow linewidth green light lasers are widely used in atomic sensing, atomic cooling, medical diagnostics, and underwater acoustic detection, etc. [1,2,3,4]. Currently, the green lasers are primarily produced by dye lasers and argon ion lasers. And, they could also be produced by solid-state lasers such as Nd: YAG near the 1 µm through second harmonic generation [5]. The laser of wavelength near 510 nm is resonant to the hyperfine transitions of in cesium atoms, which can be used to produce cesium Rydberg atoms. Ultra-narrow linewidth lasers are of great significance in atomic sensing. Meanwhile, it is noteworthy that there is now experimental evidence of the fact that a 510 nm pump source is more efficient than the 532 nm green light pump source currently used in Titanium Sapphire lasers [5]. Lasers operating around 510 nm are concluded in Table 1. It can be seen from the table that GaN based external cavity diode lasers (ECDL) can directly radiate at 510 nm with excellent power performance, but these lasers have a wide linewidth with a few nm [6]. Compared with the ECDL, micro-ring SiN waveguide lasers can achieve an excellent linewidth performance (<100 kHz) [7]. The lack of GaN-based optical amplifiers makes it difficult to obtain both narrow linewidth and high power in direct-radiation 510 nm lasers. With the development of nonlinear optical technology, especially the development of waveguide Periodically Poled Lithium Niobate (PPLN) manufacturing technology, the efficiency of nonlinear optical processes such as SHG and SFG have been greatly improved. This improvement enables us to utilize the more mature narrow linewidth lasers more effectively in the near-infrared band to generate the green light. Qian et al. demonstrated the generation of a 509 nm green light source through bulk PPLN frequency doubling, using a 1018 nm narrow linewidth external cavity laser. They achieved linewidths of less than 50 kHz and obtained a power up to the Watt level, and the SHG conversion efficiency is 20% [8]. Philippe et al. realized the conversion efficiencies up to 36% using SHG and SFG [9]. Hence, using nonlinear optical conversion is easy to obtain the narrow linewidth and high efficiency laser at 510 nm. Lu et al. also reported a kind of self-frequency-doubling (SFD) crystal combing the processes of fundamental production and second harmonic generation, with prospects of high-power applications [10].
In this paper, we present a 200 mW narrow linewidth laser at 510 nm for the study of Cs Rydberg atoms. To achieve this, we have established an ultra-narrow linewidth laser operating in the telecom band (1530 nm) as the seed source. An erbium-doped fiber amplifier is used to amplify the power to 1.5 W. The laser acquired is subsequently transmitted through two waveguide PPLNs for SHG and SFG, resulting in an optical-to-optical conversion efficiency of up to 13.1% using single-pass configuration and final laser linewidth of 4.8 kHz.
2. Methods and Experiments
The schematic diagram of the laser system is shown in Figure 1. The laser system can be divided into three parts: the narrow linewidth fundamental light source, the fiber amplifier, and the fiber coupled cascade waveguide PPLNs.
Firstly, we built a 1530 nm narrow linewidth fundamental light source. The linewidth of the narrow fundamental light source is very important which determines the whole system’s linewidth level. To achieve an ultra-narrow linewidth, the Stimulate Brillouin Scattering (SBS) technology are used to compress the linewidth of the laser [12,13,14,15]. A narrow linewidth semiconductor laser is amplified as the pump light to stimulate Brillouin scattering. The linewidth broadening stem from quantum noise and intensity coupling noise can be eliminated to obtain an ultra-narrow linewidth.
The narrow linewidth fundamental light source is built with three parts as shown in Figure 1. A homemade volume Bragg grating (VBG)-based ECDL is amplified as the pump of the Brillouin fiber loop.
Figure 2 shows the configuration of the VBG-based ECDL. Single-angled-facet (SAF) gain chips are favorable as gain media for external-cavity lasers due to their broadband and intrinsically extremely low facet reflectivity. An anti-reflective (AR) coating is coated on the angled facet to decrease the back reflectivity to approximately 0.01%, and the reflectivity of another facet with high-reflective (HR) is approximately 99%. The external cavity of the ECDL is a VBG with a bandwidth of 0.1 nm and a reflectivity of about 50%.
The linewidth of external cavity laser is
where is the mode photon energy, is the cavity bandwidth, is the power of the mode, is the number of spontaneous photons in the mode which tend to be one above the threshold. The combined reflectivity of the cavity mirrors is , where is the reflectivity of the front facets of the gain chip and is the reflectivity of the external mirror.
The output of the ECDL is 16.4 mW at 150 mA. The SAF gain chip and VBG’s length is about 1 mm and the air area in ECDL is about 7.5 mm. Thus, the theoretical linewidth of the ECDL is about 72 kHz which approaches the measured linewidth of 60.7 kHz.
The Brillouin fiber loop is established with a fiber circulator and a high nonlinear fiber (HNF) of about 10 m as the Brillouin resonance cavity. Since the stimulated Brillouin scattering is sensitive to the polarization state of the laser, a polarization controller is installed in the fiber loop. The output laser linewidth compression formula is modified as [15]
where is the linewidth of the output stokes, is the intrinsic bandwidth of the SBS gain spectrum, ε is a fitting constant, is the photon lifetime, and is the phonon lifetime. represents the linewidth compression limitation with the SBS fiber ring cavity. is the output coupling ratio, and is the intrinsic loss in the ring cavity. Usually, the value of the photon lifetime is much larger than that of the phonon lifetime in the ring cavity. So, the SBS have great potentials to compress the linewidth.
In this work, the threshold power of the SBS pump power is about 100 mW, and the output stokes power can reach 9.7 mW when the output of the first fiber amplifier is about 150 mW. The overall cavity loss is about 3 dB, and the output coupling ratio is 95:5.
The typical value of is about 2 ns. And, calculated from the parameters of the ring cavity, the is about 942 ns. So, the linewidth of SBS output lasers can be narrowed for about 104 times from the Brillouin pump laser.
Then, an Erbium-doped Optical Fiber Amplifier (EDFA) module is used to amplify the power from the output SBS laser. The maximum amplified power is 1.5 W. As shown in Figure 1, the amplified light then passes through the fiber coupled cascade waveguide PPLNs. The PPLN1 is designed for SHG to obtain 765 nm light. Then, the 765 nm light and the residual 1530 nm pass through the PPLN2 designed for SFG to generate 510 nm light. The cascade PPLNs are fabricated by HC Photonics. The maximum nonlinear coefficient (d33) is utilized with the quasi-phase matching (QPM) method of e + e → e.
3. Results and Analysis
3.1. Optical Spectrum
The spectrums of the VBG-based ECDL and SBS output are measured using a optical spectrum analyzer (Yokogawa, AQ6370D, Tokyo, Japan) and are plotted in Figure 3a. The central wavelength of the VBG-based ECDL is 1529.602 nm and the side-mode suppression ratio (SMSR) is about 60 dB. The central wavelength of the SBS output is 1529.674 nm, and the SMSR is about 70 dB. The SBS shift frequency is about 72 pm. The resolution of the spectrum analyzer is 0.02 nm.
The spectrum of the green light is measured using a CCD-array spectrum analyzer with a grating of 600 lines/mm. The resolution of the spectrum analyzer is 0.3 nm in the range of the green light. And, the spectrum plotted in Figure 3b shows the central wavelength of the green light which is 509.6 nm. To measure the linewidth accurately, the delayed self-heterodyne technology has been applied to measure the linewidth in Section 3.2.
3.2. The Linewidth Measurement
The linewidth of the laser obtained using SBS is around a hundredth Hz level. The traditional delayed self-heterodyne laser linewidth measurement method [16] is wildly used in the measurement of narrow linewidth lasers. The configuration of the method is shown in Figure 4. Meanwhile, the length of the time-delay fiber needed to de-coherent a hundredth Hz level narrow linewidth laser is more than 300 km (). Such a long time-delay fiber indicates the existence of a great optical loss and the expansion of the linewidth by the impact of 1/f noise. Therefore, a short-fiber delayed self-heterodyne laser linewidth measurement method is used in this work. The linewidth can be solved using the relationship between the coherent envelopes obtained from the power spectral density (PSD) of the beat signal [17,18,19,20,21].
In this work, the laser’s linewidth is estimated using the following equation [22]:
where 0.204 is the system error constant. f0 is the frequency difference between the minimum point of the first-order and the center frequency, and ΔS is the power difference between the first-order maximum point and the minimum point.
The linewidth of the fundamental light is an important factor that affects the conversion efficiency and determines the linewidth of the frequency-tripled laser. The linewidth of 1530 nm narrow linewidth fundamental light source has been tested using the method above. And, a 20 km time-delay fiber was used. As shown in the Figure 5, Δf0 = 8.89 kHz and ΔS = 10.65 dB, so the linewidth of the seed laser is calculated at about 460 Hz.
The instantaneous frequency fluctuation power spectral density (PSD) and the linewidth for different integration bandwidths of the narrow linewidth fundamental light source are shown in Figure 6. This measurement is conducted using 120° phase difference interferometer technology based on an unbalanced Michelson interferometer [23]. The green line in Figure 6 is the β line, dividing the curve of PSD into two regions which have different effects on the laser’s line shape. The part above the beta-line is the 1/f noise domain, which makes the spectrum tend to form the Gaussian shape; the part below the beta-line is the white noise domain, which make the spectrum tend to form the Lorentz shape. The minimum linewidth of the source can be calculated using πh0, and h0 is the frequency fluctuation PSD value at white noise level, which is shown by the brown dotted line in Figure 6. The h0 is 123 Hz2/Hz, the linewidth of the source is calculated about 400 Hz. The result matches with the linewidth measured using the short-fiber delayed self-heterodyne method.
Next, the linewidth of the output 510 nm light is also tested. After tripling the frequency of the seed laser, the linewidth increases threefold from its original value in ideal conditions. So, the optimal linewidth of the output 510 nm light is about 1.2 kHz. A short-fiber delayed self-heterodyne method is also used to measure the linewidth of the output 510 nm light.
However, during the actual test, the output power of the 510 nm light is not enough. So, the coherent envelope of the beat note signal is submerged under the noise level of the electronic spectrum analyzer [24]. The time-delay fiber is 1 km in this test. The experimentally obtained PSD is plotted with the blue line in Figure 7. We can obtain Δf0 = 204.4 kHz, ΔS = 14.0 dB from the curve, which gives a calculated linewidth of around 4.8 kHz for the output 510 nm light. And, the black line represents the ideal curve calculated by the linewidth and the length of the time-delay fiber. The orange line in Figure 7 shows the noise floor of the ESA. As we can see, the first and the second envelopes fit well; the envelopes away from the central frequency are influenced by the noise of the ESA. The noise does not submerge the first and the second envelop. So, the linewidth we calculated is reliable, as we only use data from the first and second envelop.
The ideal linewidth is 1.2 kHz, but it is eventually widened to 4.8 kHz. So, both the fiber amplifier and nonlinear optical processes can cause the noise that broadens the linewidth broadening. The pump energy fluctuation of a single-frequency fiber laser is an important source of frequency noise, and an analytical expression for the frequency noise fluctuation has been proven [25]. It has been demonstrated that ASE also plays a significant role in increasing the linewidth in fiber amplifiers. Both the SHG and SFG are optical parametric processes, during which the nonlinear medium atom always remains in its original state and there is no phase noise due to spontaneous radiation in the optical parametric process, but mainly the introduction of several ‘technological noises’ leads to an increase in the level of noise. The noise in nonlinear crystal has been analyzed in some works [26,27].
3.3. The Relative Intensity Noise (RIN) Measuremant
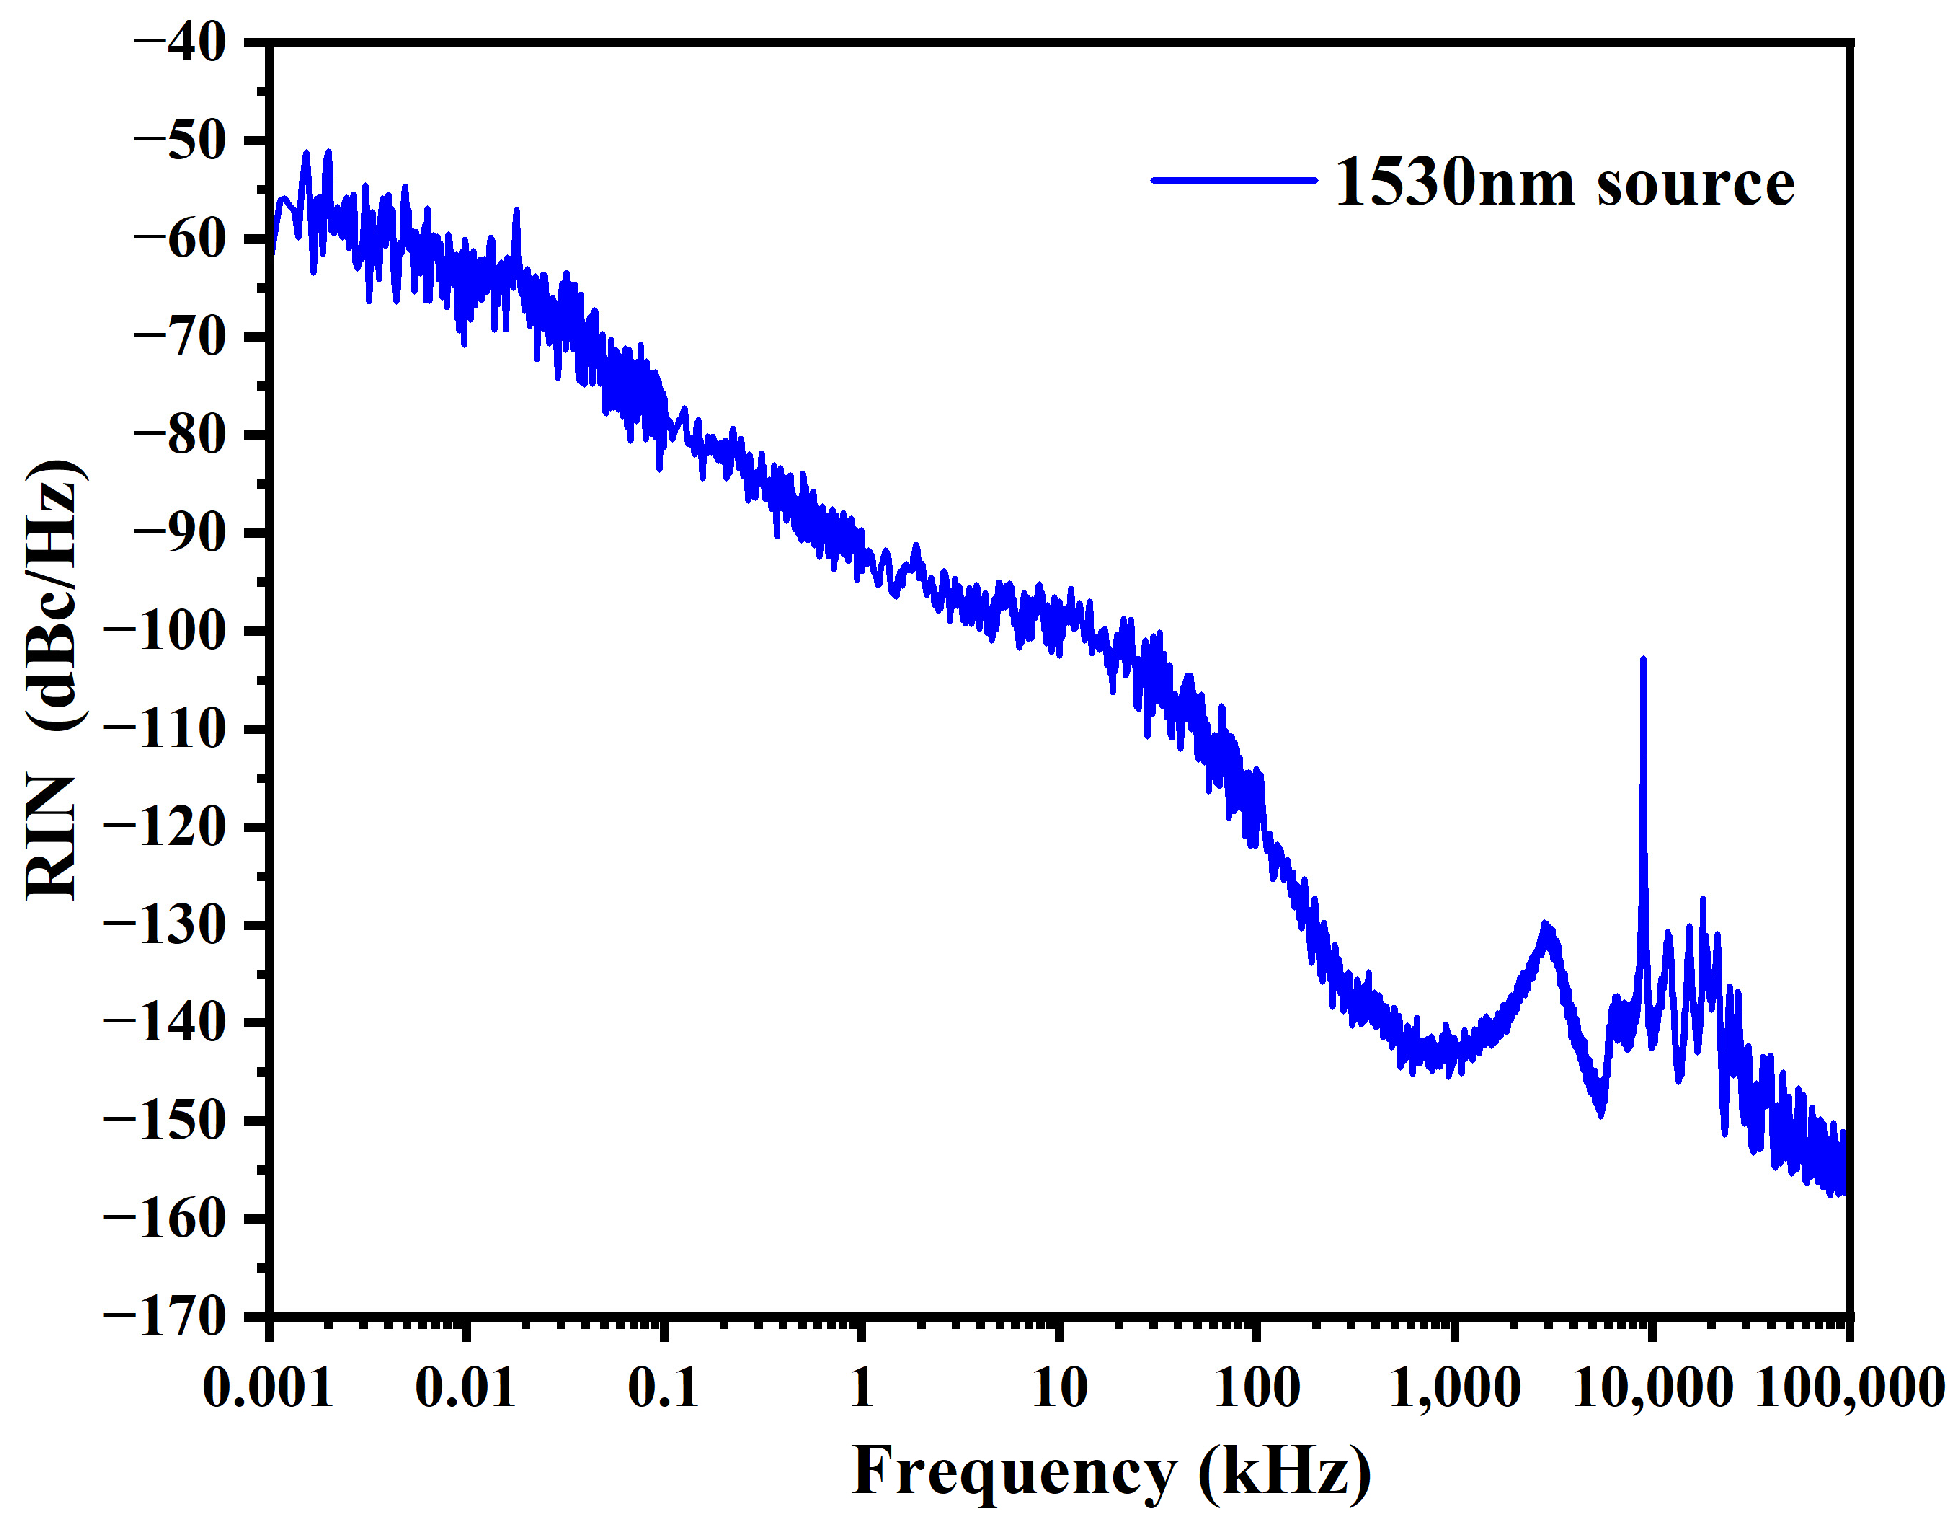
Laser noise is also an important parameter for single-frequency laser. The RIN of the narrow linewidth fundamental light source has been measured and plotted in Figure 8. The measurement is completed by OE4000. The RIN form the range of 1 Hz to 100 MHz has been measured. The curve of the RIN measurement indicated an influence of the 1/f noise in the low-frequency domain. For frequencies at 10 kHz, the RIN is less than −100 dBc/Hz. From 10 kHz to 100 MHz, the RIN decreases from −100 dBc/Hz to −160 dBc/Hz. In the range of more than 1 MHz the white noise is dominant.
3.4. The Nonlinear Optical Conversion
The relationship between the pump power and the 510 nm laser power is shown in Figure 9a. The pump power refers to the 1530 nm light’s power input to the fiber coupled cascade waveguide PPLNs. The 510 nm laser reaches up to 200 mW at maximum pump power of 1.5 W. The conversion efficiency of the SHG and SFG increases linearly, while the pump power increases and the maximum efficiency reaches 13.1%. The relationship between the pump power and the optimal phase matching temperature of SFG is shown in Figure 9b. Due to the heating effect of the pump light on the SFG waveguide, the optimal phase temperature of the SFG waveguide decreases with the increase in the pump power. As the pump power increases, the ratio of the power of the residual 1530 nm light and 765 nm light changes. So, the optimal phase matching temperature of SFG has also changed. The optimal phase-matching temperature of SHG is 48.7 and does not change as the pump power increases.
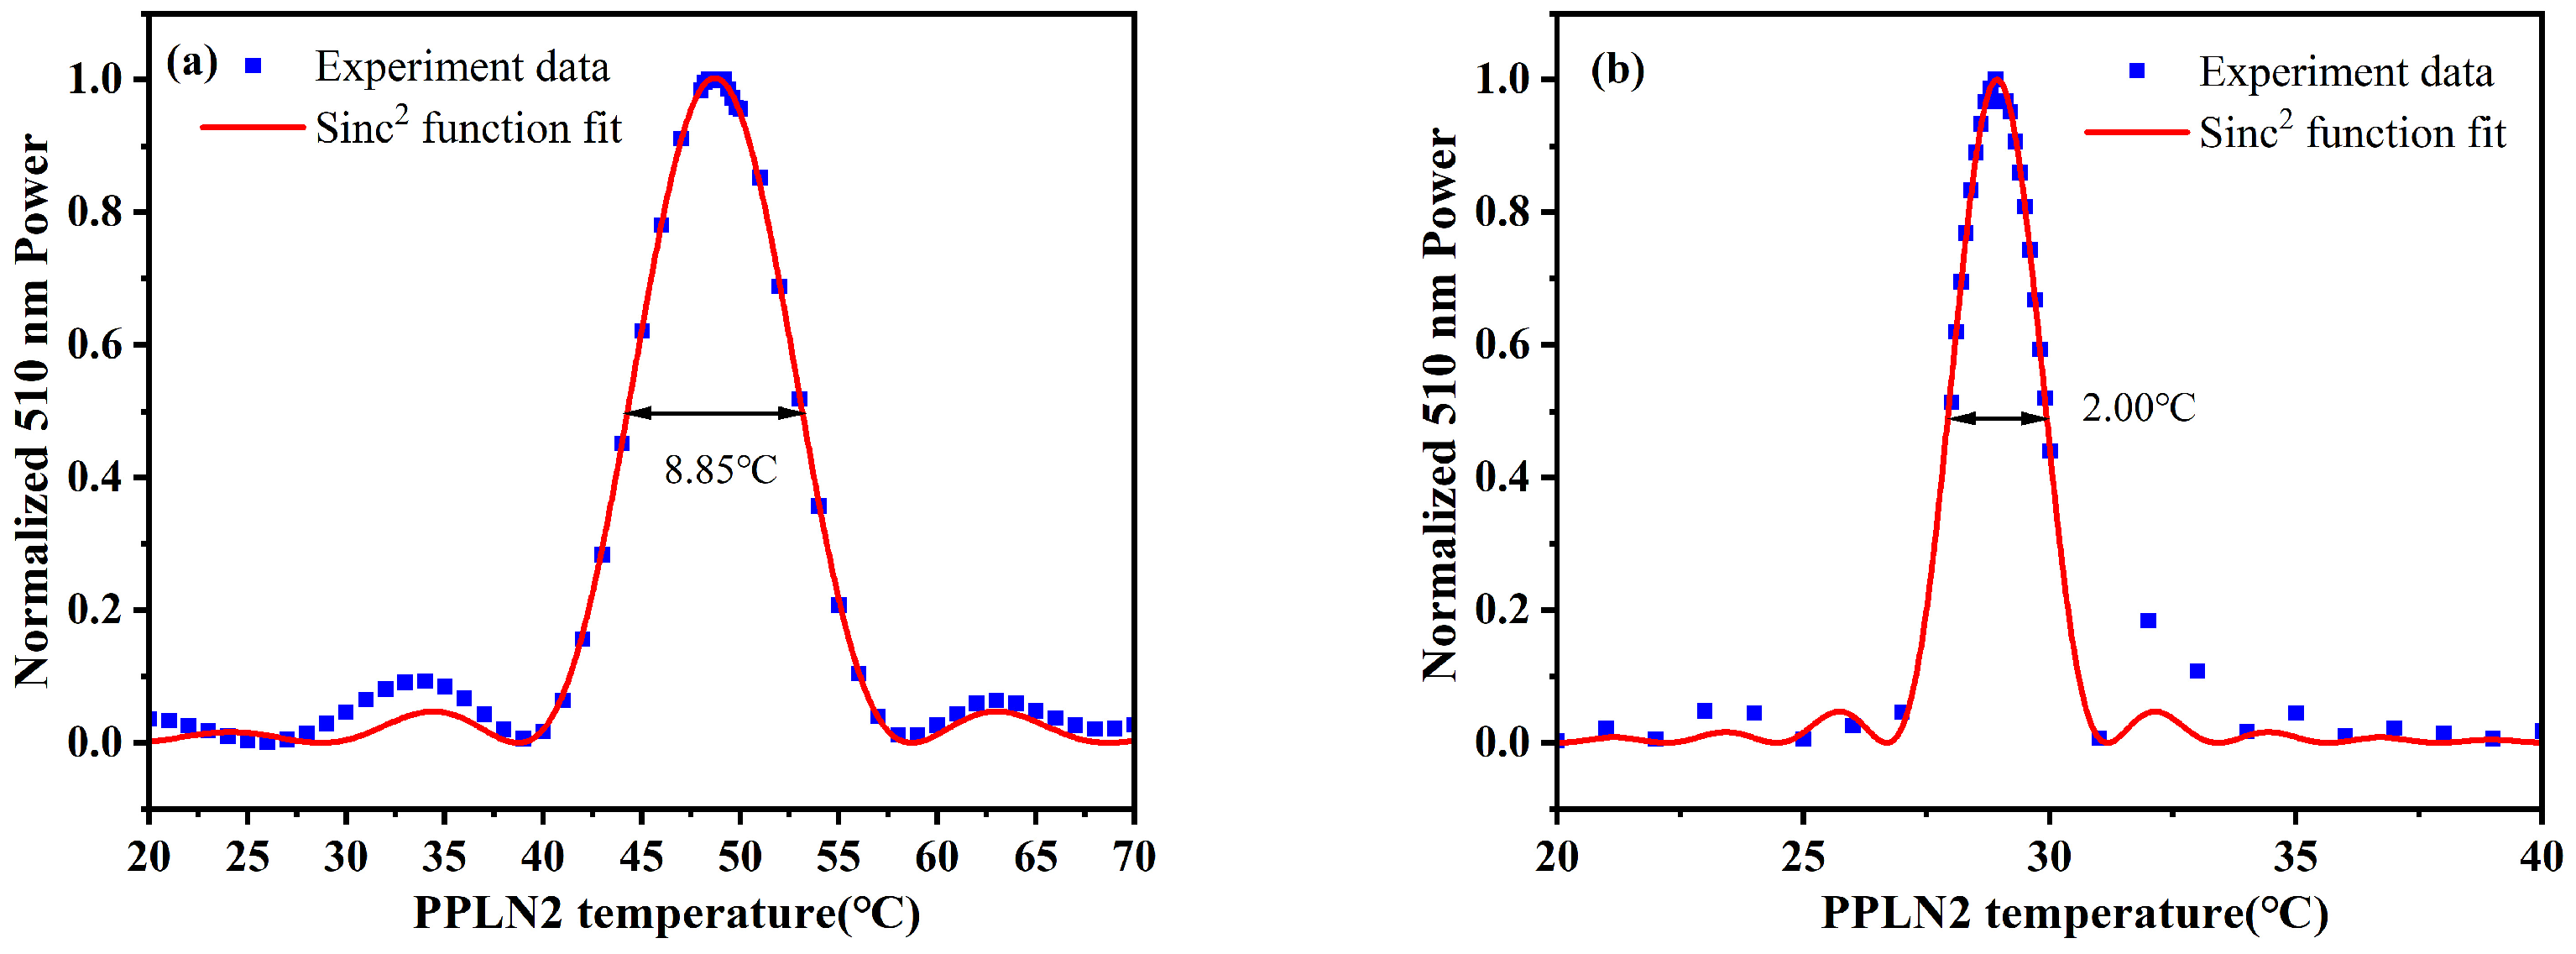
Figure 10 shows the dependence of the generated green power to the temperature fluctuation of both PPLN1 and PPLN2 waveguides. Each curve is fitted with the sinc2 function. As illustrated in Figure 10a, the curve of the Sinc2 fitting has a full width at the half maximum (FWHM) bandwidth of ΔT = 8.85 °C at the optimal SFG phase-matching temperature of 28.6 °C. As illustrated in Figure 10b, the curve of the Sinc2 fitting has a FWHM bandwidth of ΔT = 2.00 °C at the optimal SHG phase-matching temperature of 48.7 °C. The experimental data fit the theoretical sinc2 shape well and show strong symmetry.
In the future, we plan to optimize the temperature-dependence of the nonlinear conversion. As showed in Figure 10, the efficiency of the nonlinear conversion is sensitive to the temperature. To realize the optimal conversion efficiency, rigorous temperature control is necessary. And, the sensitivity also decreases the stability of the laser system. The poled lithium niobates with chirped QPM gratings have potential to solve the problem. Tehranchi et al. have proposed an effective apodization technique to broaden and flatten the wavelength conversion bandwidth by utilizing the QPM step-chirped grating in PPLNs [28]. The efficiency curve can be flattened with the ripples being reduced by less than 0.1 dB, and the band can be broadened to tens of nm. Applying the chirped grating in PPLNs can reduce the demand of temperature control and broaden the wavelength range.
4. Conclusions
We have developed a single-frequency green laser at 510 nm, and its linewidth and noise characteristics are ideal for the study of cesium Rydberg atoms. It is based on a ultra-narrow linewidth and low noise seed source and single-pass cascade waveguide PPLNs. An up to 200 mW 510 nm green laser has been produced and the optical–optical conversion efficiency from 1530 nm reaches 13.1%. And, the laser has an ultra-narrow linewidth of less than 5 kHz.
Author Contributions
Data curation, Y.C. and H.Y.; funding acquisition, J.Z.; investigation, Y.C.; methodology, Y.C.; writing—original draft, Y.C.; writing—review and editing, J.Z., C.L., S.W., H.Y., X.W. and X.Q. All authors have read and agreed to the published version of the manuscript.
Funding
This research was funded by the National Natural Science Foundation of China, grant number 62105323.
Institutional Review Board Statement
Not applicable.
Informed Consent Statement
Not applicable.
Data Availability Statement
Data are contained within the article.
Conflicts of Interest
The authors declare no conflicts of interest.
References
- Anderson, D.A.; Sapiro, R.E.; Gonıfmmode, L.F.; Cardman, R.; Raithel, G. Optical Radio-Frequency Phase Measurement with an Internal-State Rydberg Atom Interferometer. Phys. Rev. Appl. 2022, 17, 044020. [Google Scholar] [CrossRef]
- Li, G.; Zhou, Q.; Xu, G.; Wang, X.; Han, W.; Wang, J.; Zhang, G.; Zhang, Y.; Yuan, Z.; Song, S.; et al. Lidar-Radar for Underwater Target Detection Using a Modulated Sub-Nanosecond Q-Switched Laser. Opt. Laser Technol. 2021, 142, 107234. [Google Scholar] [CrossRef]
- Lee, M.-W.C. Combination 532-nm and 1064-nm Lasers for Noninvasive Skin Rejuvenation and Toning. Arch. Dermatol. 2003, 139, 1265–1276. [Google Scholar] [CrossRef]
- Hanson, F.; Radic, S. High Bandwidth Underwater Optical Communication. Appl. Opt. 2008, 47, 277–283. [Google Scholar] [CrossRef]
- Tawfieq, M.; Jensen, O.B.; Hansen, A.K.; Sumpf, B.; Paschke, K.; Andersen, P.E. Efficient Generation of 509 nm Light by Sum-Frequency Mixing between Two Tapered Diode Lasers. Opt. Commun. 2015, 339, 137–140. [Google Scholar] [CrossRef]
- Chi, M.; Jensen, O.B.; Petersen, P.M. Green High-Power Tunable External-Cavity GaN Diode Laser at 515 nm. Opt. Lett. 2016, 41, 4154–4157. [Google Scholar] [CrossRef] [PubMed]
- Corato-Zanarella, M.; Gil-Molina, A.; Ji, X.; Shin, M.C.; Mohanty, A.; Lipson, M. Widely Tunable and Narrow-Linewidth Chip-Scale Lasers from near-Ultraviolet to near-Infrared Wavelengths. Nat. Photonics 2023, 17, 157–164. [Google Scholar] [CrossRef]
- Qian, J.; Zhang, L.; Jiang, H.; Cui, S.; Zhou, J.; Feng, Y. 2 W Single-Frequency, Low-Noise 509 nm Laser via Single-Pass Frequency Doubling of an ECDL-Seeded Yb Fiber Amplifier. Appl. Opt. 2018, 57, 8733–8737. [Google Scholar] [CrossRef]
- Philippe, C.; Chea, E.; Nishida, Y.; du Burck, F.; Acef, O. Efficient Third Harmonic Generation of a CW-Fibered 1.5 Μm Laser Diode. Appl. Phys. B 2016, 122, 265. [Google Scholar] [CrossRef]
- Lu, D.; Fang, Q.; Yu, X.; Han, X.; Wang, J.; Yu, H.; Zhang, H. Power Scaling of the Self-Frequency-Doubled Quasi-Two-Level Yb:YCOB Laser with a 30% Slope Efficiency. Opt. Lett. 2019, 44, 5157–5160. [Google Scholar] [CrossRef] [PubMed]
- Chen, X.; Xu, Y.; Tsai, C.-C.; Chen, Y.-H.; Chen, N.-K.; Chui, H.-C. An Injection-Locked Green InGaN Diode Laser. Microw. Opt. Technol. Lett. 2023, 65, 1037–1041. [Google Scholar] [CrossRef]
- Huang, S.; Zhu, T.; Yin, G.; Lan, T.; Huang, L.; Li, F.; Bai, Y.; Qu, D.; Huang, X.; Qiu, F. Tens of Hertz Narrow-Linewidth Laser Based on Stimulated Brillouin and Rayleigh Scattering. Opt. Lett. 2017, 42, 5286–5289. [Google Scholar] [CrossRef] [PubMed]
- Chen, M.; Meng, Z.; Liu, H.; Lu, Y.; Hu, X.; Wang, J. 140-Hz Narrow-Linewidth Brillouin/Erbium- Ytterbium Fiber Laser. IEEE Photonics Technol. Lett. 2023, 35, 521–524. [Google Scholar] [CrossRef]
- Debut, A.; Randoux, S.; Zemmouri, J. Experimental and Theoretical Study of Linewidth Narrowing in Brillouin Fiber Ring Lasers. J. Opt. Soc. Am. B 2001, 18, 556–567. [Google Scholar] [CrossRef]
- Debut, A.; Randoux, S.; Zemmouri, J. Linewidth Narrowing in Brillouin Lasers: Theoretical Analysis. Phys. Rev. A 2000, 62, 023803. [Google Scholar] [CrossRef]
- Okada, K.; Hashimoto, K.; Shibata, T.; Nagaki, Y. Novel Method for High Resolution Measurement of Laser Output Spectrum. Electron. Lett. 1980, 16, 630. [Google Scholar] [CrossRef]
- Peng, Y. A Novel Scheme for Hundred-Hertz Linewidth Measurements with the Self-Heterodyne Method. Chin. Phys. Lett. 2013, 30, 084208. [Google Scholar] [CrossRef]
- Bennetts, S.; McDonald, G.D.; Hardman, K.S.; Debs, J.E.; Kuhn, C.C.N.; Close, J.D.; Robins, N.P. External Cavity Diode Lasers with 5 kHz Linewidth and 200 nm Tuning Range at 1.55 μm and Methods for Linewidth Measurement. Opt. Express 2014, 22, 10642–10654. [Google Scholar] [CrossRef]
- Huang, S.; Zhu, T.; Cao, Z.; Liu, M.; Deng, M.; Liu, J.; Li, X. Laser Linewidth Measurement Based on Amplitude Difference Comparison of Coherent Envelope. IEEE Photonics Technol. Lett. 2016, 28, 759–762. [Google Scholar] [CrossRef]
- He, Y.; Hu, S.; Liang, S.; Li, Y. High-Precision Narrow Laser Linewidth Measurement Based on Coherent Envelope Demodulation. Opt. Fiber Technol. 2019, 50, 200–205. [Google Scholar] [CrossRef]
- Bai, Z.; Zhao, Z.; Qi, Y.; Ding, J.; Li, S.; Yan, X.; Wang, Y.; Lu, Z. Narrow-Linewidth Laser Linewidth Measurement Technology. Front. Phys. 2021, 9, 768165. [Google Scholar] [CrossRef]
- Wang, Z.; Ke, C.; Zhong, Y.; Xing, C.; Wang, H.; Yang, K.; Cui, S.; Liu, D. Ultra-Narrow-Linewidth Measurement Utilizing Dual-Parameter Acquisition through a Partially Coherent Light Interference. Opt. Express 2020, 28, 8484–8493. [Google Scholar] [CrossRef]
- Xu, D.; Yang, F.; Chen, D.; Wei, F.; Cai, H.; Fang, Z.; Qu, R. Laser Phase and Frequency Noise Measurement by Michelson Interferometer Composed of a 3 × 3 Optical Fiber Coupler. Opt. Express 2015, 23, 22386–22393. [Google Scholar] [CrossRef]
- Zhao, Z.; Bai, Z.; Jin, D.; Chen, X.; Qi, Y.; Ding, J.; Yan, B.; Wang, Y.; Lu, Z.; Mildren, R.P. The Influence of Noise Floor on the Measurement of Laser Linewidth Using Short-Delay-Length Self-Heterodyne/Homodyne Techniques. Micromachines 2022, 13, 1311. [Google Scholar] [CrossRef]
- Foster, S.B.; Tikhomirov, A.E. Pump-Noise Contribution to Frequency Noise and Linewidth of Distributed-Feedback Fiber Lasers. IEEE J. Quantum Electron. 2010, 46, 734–741. [Google Scholar] [CrossRef]
- Herbers, S.; Dörscher, S.; Benkler, E.; Lisdat, C. Phase Noise of Frequency Doublers in Optical Clock Lasers. Opt. Express 2019, 27, 23262–23273. [Google Scholar] [CrossRef] [PubMed]
- Wang, Y.; Fonseca-Campos, J.; Liang, W.; Xu, C.-Q.; Vargas-Baca, I. Noise Analysis of Second-Harmonic Generation in Undoped and MgO-Doped Periodically Poled Lithium Niobate. Adv. OptoElectron. 2008, 2008, 428971. [Google Scholar] [CrossRef]
- Tehranchi, A.; Kashyap, R. Design of Novel Unapodized and Apodized Step-Chirped Quasi-Phase Matched Gratings for Broadband Frequency Converters Based on Second-Harmonic Generation. J. Light. Technol. 2008, 26, 343–349. [Google Scholar] [CrossRef]
Figure 1.
Schematic diagram of the laser system configuration. C1 (circulator 1), HNF (High Nonlinear Fiber), PC1 (polarization controller 1), OC1(optical coupler 1).
Figure 1.
Schematic diagram of the laser system configuration. C1 (circulator 1), HNF (High Nonlinear Fiber), PC1 (polarization controller 1), OC1(optical coupler 1).

Figure 2.
Configuration of the VBG-based ECDL. FL (focusing lens), VBG (volume Bragg grating), ISO (Faraday isolator), CL (collimating lens).
Figure 2.
Configuration of the VBG-based ECDL. FL (focusing lens), VBG (volume Bragg grating), ISO (Faraday isolator), CL (collimating lens).

Figure 3.
(a) The spectrum of the VBG-based ECDL and the SBS output. (b) The spectrum of the 510 nm laser.
Figure 3.
(a) The spectrum of the VBG-based ECDL and the SBS output. (b) The spectrum of the 510 nm laser.

Figure 4.
Schematic diagram of the delayed self-heterodyne method configuration. Optical Isolator (ISO), coupler 1 (C1), acousto-optic modulators (AOM), coupler 2 (C2), photodetector (PD), electronical spectrum analyzer (ESA).
Figure 4.
Schematic diagram of the delayed self-heterodyne method configuration. Optical Isolator (ISO), coupler 1 (C1), acousto-optic modulators (AOM), coupler 2 (C2), photodetector (PD), electronical spectrum analyzer (ESA).

Figure 5.
Plot of the PSD obtained using short-fiber delayed self-heterodyne laser linewidth measurement method using a 20 km delayed fiber.
Figure 5.
Plot of the PSD obtained using short-fiber delayed self-heterodyne laser linewidth measurement method using a 20 km delayed fiber.

Figure 6.
PSD of instantaneous frequency fluctuation of the narrow linewidth fundamental light source and laser linewidth as a function of frequency.
Figure 6.
PSD of instantaneous frequency fluctuation of the narrow linewidth fundamental light source and laser linewidth as a function of frequency.

Figure 7.
Plots of the experimental and simulated PSD function using a 1 km long time-delay fiber.

Figure 8.
Relative intensity noise spectral of the 1530 nm seed source.

Figure 9.
(a) The blue line indicates the variation of 510 nm power with pump power, and the red line indicates the variation of optical–optical conversion efficiency with pump power. (b) The variation of SFG temperature with pumping power.
Figure 9.
(a) The blue line indicates the variation of 510 nm power with pump power, and the red line indicates the variation of optical–optical conversion efficiency with pump power. (b) The variation of SFG temperature with pumping power.

Figure 10.
(a) Sensitivity of the 510 nm power to the SHG temperature variation. The blue dots indicate the experiment data; the red line indicate the fit of sinc2 function. (b) Sensitivity of the 510 nm power to the SFG temperature variation. The blue dots indicate the experimental data; the red line indicate the fit of sinc2 function.


Table 1.
Lasers around 510 nm.
| Work | Laser Type | Wavelength (Turning Range) | Power | Efficiency | Linewidth |
|---|---|---|---|---|---|
| Qian et al. [8] | SHG | 509 nm (~) | 2 W | 20% | ~40 kHz |
| Philippe et al. [9] | SHG + SFG | 514 nm (~) | 290 mW | 36% | ~ |
| Lu et al. [10] | SFD | 513 nm (~) | 6.2 W | 30% | ~ |
| Chi et al. [6] | ECDL | 515 nm (9.2 nm) | 480 mW | ~ | ~0.5 nm |
| Mateus et al. [7] | micro-ring | 520 nm (6.0 nm) | 10.75 mW | ~ | 26 kHz |
| Chen et al. [11] | injection-lock | 519 nm (~) | 60 mW | ~ | 6.5 MHz |
| Tawfieq et al. [5] | SFG | 509 nm (~) | 1.7 W | 12.1% | ~ |
| This work | SHG + SFG | 510 nm (9 pm) | 200 mW | 13.3% | 4.8 kHz |
Disclaimer/Publisher’s Note: The statements, opinions and data contained in all publications are solely those of the individual author(s) and contributor(s) and not of MDPI and/or the editor(s). MDPI and/or the editor(s) disclaim responsibility for any injury to people or property resulting from any ideas, methods, instructions or products referred to in the content. |
© 2024 by the authors. Licensee MDPI, Basel, Switzerland. This article is an open access article distributed under the terms and conditions of the Creative Commons Attribution (CC BY) license (https://creativecommons.org/licenses/by/4.0/).
Share and Cite
MDPI and ACS Style
Chen, Y.; Zhang, J.; Qiu, X.; Wang, S.; Li, C.; Yu, H.; Wei, X. Narrow Linewidth 510 nm Laser via Single-Pass Frequency-Tripling by Waveguide PPLNs. Photonics 2024, 11, 269. https://doi.org/10.3390/photonics11030269
AMA Style
Chen Y, Zhang J, Qiu X, Wang S, Li C, Yu H, Wei X. Narrow Linewidth 510 nm Laser via Single-Pass Frequency-Tripling by Waveguide PPLNs. Photonics. 2024; 11(3):269. https://doi.org/10.3390/photonics11030269
Chicago/Turabian StyleChen, Yanlin, Jing Zhang, Xiaolang Qiu, Suo Wang, Chuanchuan Li, Haiyang Yu, and Xin Wei. 2024. "Narrow Linewidth 510 nm Laser via Single-Pass Frequency-Tripling by Waveguide PPLNs" Photonics 11, no. 3: 269. https://doi.org/10.3390/photonics11030269
Note that from the first issue of 2016, this journal uses article numbers instead of page numbers. See further details here.