Hybrid Graphene–Silicon Arrayed Waveguide Gratings for On-Chip Signal–Frequency Conversion


Department of Physics and Mathematics, Center for Photonics Sciences, University of Eastern Finland, P.O. Box 111, 80101 Joensuu, Finland
*
Author to whom correspondence should be addressed.
Photonics 2024, 11(4), 302; https://doi.org/10.3390/photonics11040302
Submission received: 24 January 2024
/
Revised: 21 March 2024
/
Accepted: 25 March 2024
/
Published: 26 March 2024
Abstract
:We present the design and simulations of a novel integrated device concept enabling a frequency conversion of a broad signal. The solution is based on a hybrid silicon–graphene photonic chip, which could be used for controlled spectrometry in low-cost devices. The device is based on a silicon-on-insulator (SOI) platform on which an arrayed waveguide grating (AWG) is designed for operation at the center wavelength of = 1800 nm. The AWG is spectrally separating one broad input signal to thirty-two-output channels with a channel spacing of 2.72 nm. The output signals are well separated and uniform with the extinction ratio and the standard deviation of 10.00 dB and 0.04, respectively. The 3 dB channel width is 1.34 nm, which is suitable for sensing applications with significant accuracy. After spacial and spectral separation, each output signal is then converted to one signal at 1480 nm wavelength through a graphene-based saturable absorber scheme. Therefore, the device allows the detection of each separated signal with a simple near-infrared camera on which the outputs are imaged using conventional optics, leading to a classical pixel/wavelength correspondence. Crossed-waveguide couplers are designed to combine the controlling signal at 1480 nm to each channel waveguide of the AWG. The combination of the signals saturates the graphene layer at the output waveguides, allowing the pass of the controlling wavelength. This device can be applied as a spectrometer in environmental sensing and monitoring with high efficiency and low cost.
1. Introduction
Integrated photonic sensors based on arrayed waveguide gratings (AWGs) have gained significant attention in recent years because of their high performances, low footprints, low energy consumption, and low cost. Several AWG-based Raman spectrometers have been reported to determine early-stage tooth decay in humans [1] and monitor glucose non-invasively by integration with PIN photodiodes and a prism coupler [2]. Such integrated components are also applied in spectral domain optical coherence tomography (SD-OCT). For instance, devices with footprints of a few square centimeters have sufficient resolution and depth for biological imaging with a lower signal-to-noise ratio compared to traditional SD-OCT setups [3]. The integration of AWG and microring resonator has been applied in gas sensing applications for measuring the concentration of ethanol vapor, and the system achieves cost-effectiveness and compactness [4]. Moreover, an AWG is designed for fiber Bragg grating (FBGI) sensing systems and achieves high-dynamic-range demodulation with 3 nm channel spacing, which can be applied in structural health monitoring [5].
AWGs have been implemented on several materials and platforms such as polymers [6], silicon nitride (SiN) [7], silicon oxynitride (SiON) [8], titanium dioxide (TiO2) [9], hybrid polymer-SiN [10], and silica (SiO2) [11]. A silicon-on-insulator (SOI) platform is also an interesting platform for AWGs. It is a high-index platform and the fabrication procedures are compatible with a complementary metal–oxide–semiconductor (CMOS) technology [12]. This allows high-density integration of several photonic devices on a single chip. The developments to achieve very compact AWGs on this platform have been reported. A compact 0.36 mm × 0.17 mm size has been demonstrated for optical CWDM applications [13]. Moreover, based on the double channel spacing, an (N + 1) × (N + 1) AWG multiplexer is designed to be more compact compared to a conventional 2 N × 1 [14]. In addition to the footprint of the device, SOI-based AWGs also offer low insertion losses [15], low crosstalk [16,17], low polarization-dependent loss (PDL), and polarization-dependent wavelength shift (PDWS) [18].
The absorption of graphene is noticeable with a wide absorption band ranging from the visible to mid-infrared wavelength range. Due to its gapless energy band diagram, a monolayer of graphene absorbs around 2.3% of normal incident light [19]. However, the integration of graphene with SOI photonic circuits enables the enhancement of light–matter interactions through the evanescent field coupling on the waveguide, which increases the absorption to nearly 100% [20,21]. Saturable absorption (SA) is a nonlinear absorption phenomenon exhibited by graphene, which refers to the absorption dependence on the optical intensities [22]. This phenomenon has been implemented in several optical components. Optical modulators are demonstrated with graphene. A single monolayer of graphene sheet is integrated on a Si waveguide with a thin Al2O3 layer in between [23]. With a similar approach, a graphene layer is coated directly on a Si waveguide, followed by Al2O3 and another graphene layer. This forms double-layer graphene on the top of a Si waveguide [24]. In both cases, the transparency of graphene is controlled by external gating voltages, and the changes in optical transmissions inside the waveguide are observed [25]. Moreover, an optical switch operates all-optically by using the SA of graphene and control light. The graphene film absorbs the weak incident optical signal while the absorption of the graphene reduces due to the increase in the signal intensities. Because of the fast SA responses of graphene, the switch operates in picoseconds [26]. A thermal optical switch has been demonstrated with graphene assistance. The heat is induced by the absorption of graphene at the pump signal of 980 nm and controls the 1550 nm optical signal with a power consumption of only 9.5 mW [27].
In this paper, we present a novel concept of an integrated spectrometer controllable with an external light source nm and operating at a wavelength range of nm centered at nm. These wavelengths usually correspond to the spectral signatures of important molecules used in environmental sensing for the monitoring of atmospheric and water pollutants. Unfortunately, this wavelength range is difficult to reach with conventional detectors without a cooling system. It should be noted that the concept of the integration of the graphene signal conversion on an AWG is novel and can be extended to almost all wavelength ranges, provided that the transparency of the guiding material, in our case silicon, is matched by the gapless absorbing material used as a saturable absorber in the device, which is graphene, here.
2. Concept
Our system is the central part of a spectrometer, i.e., the demultiplexer, which is replacing in integrated optics a prism or a grating in conventional free-space optics. Therefore, we do not consider here the source, which is assumed to be an incoherent light provided by the emission of a molecular system, collected, and injected into the input waveguide of our chip. This signal nm follows an integrated circuit fabricated on an SOI waveguide platform. It is composed of a demultiplexer realized as an arrayed waveguide grating whose output is a set of multiple parallel waveguides. These waveguides are crossed by another one feeding them with an external and independent light pump centered at nm. This light is used to saturate a graphene layer deposited on top of the output waveguide array.
The power of the pump is set so that the graphene layer is just below the saturation point and only small intensities, corresponding to the signal to be analyzed, are sufficient to saturate it. Output waveguides are intended to be imaged on a near-infrared (NIR) camera with a cylindrical lens, which can be, for instance, 3D-printed [28], focusing each waveguide on a separate set of pixels of the camera detector. By saturating the absorption of the graphene layer on top of the waveguides, any given output signal wavelength allows some of the light at to pass through the waveguide, and is detected by the camera as an increased signal of the corresponding measurable wavelength. It results in a gray-scale picture in which the position and signal level correspond to the input signal. Adjusting the pump power allows a tuning of the contrast of the picture and therefore a better detection of weak signals. This concept is illustrated in Figure 1.
3. Design and Simulation of the Silicon Circuit
We thoroughly optimize the geometry of a rib waveguide using a finite element mode solver [29] to obtain strong optical confinement of the quasi-TE mode, whose electric field is oriented along the x-direction (see Figure 2). The waveguide design is performed on an SOI platform (220 nm thick silicon device layer), which is well-known and its properties have been studied and measured by our laboratory for over the past ten years. The refractive indices of Si and SiO2 at = 1800 nm are = 3.4597 and = 1.441, respectively. Note that the dispersion is rather small in this wavelength range and, at first, we neglect it for clarity purposes. The schematic and parameters of the considered waveguide are illustrated in Figure 2a. Results of the optimization led to the following parameters: width W = 4 μm, rib height H = 220 nm, slab height h = 170 nm, and etch depth t = 50 nm. Strong confinement of the fundamental mode can be observed inside the waveguide because of the high refractive index contrast, as shown in Figure 2b.
We perform the design and simulation of the arrayed waveguide grating according to the parameters of the optimized rib waveguide. The designs and simulations are performed using WDM Phasar software [30], based on the beam propagation method (BPM). This method is especially adapted for the design of AWGs on HIC platforms [31,32], and several research groups utilized the WDM Phasar software in SOI-AWG designs [33,34]. It justifies its choice for simulations on the SOI platform with effective index approximation. The effective index approximation is used to simplify the calculations from 3D to 2D. It means the heights of the waveguides are considered through the effective index of an equivalent slab waveguide calculated for each section of the channel waveguide. The 2D calculation consists then of the effective index of the core layer in the middle waveguide and the indices cladding layers on either side. Such an approximation is valid because of the high confinement of the mode inside the Si core of the waveguide. The design of the AWG is based on five main components: an input waveguide, a first free propagation region (FPR1), an array of waveguides, a second free propagation region (FPR2), and output waveguides. The array of waveguides is structured in an arc-straight-arc-straight (ASAS) configuration, with an initial length increment of 7000 μm. The length of each waveguide increases by 7.03 μm until reaching the final waveguide. Moreover, the additional parameters of the considered AWG device are listed in Table 1.
The schematic of the AWG device for controlled spectrometry using a saturable absorber to enable signal conversion is illustrated in Figure 3a and the device footprint is 3 cm in width and 10 cm in length. A broad optical spectrum centered at is launched through the input port and propagates through the device. The AWG operates as a demultiplexer that spectrally and spatially separates the input signal into thirty-two wavelength output channels. The separation (D) between the output channel waveguides of AWG is a key parameter to tune the extinction ratio together with the channel spacing . Figure 4a shows the influence of D on these two parameters. Both parameters increase with D and for D = 10 μm, the = 10.00 dB and = 2.72 nm. The variation in the channel width ( = 1.34 nm) is insignificant and can be neglected. Although at 10 μm, the AWG experiences higher and , the output spectra are deformed. The simulation result of the AWG is depicted in Figure 4b. We can see that the proposed device is capable of operating as a thirty-two wavelength demultiplexer at the center wavelength of nm with a channel spacing of nm. This yields the device to perform with high resolution and a wide detectable wavelength range. The device experiences good separation and uniformity of the output signals with the extinction ratio of dB and standard deviation of = 0.04. The signal bandwidth is nm, making the AWG an ideal spectrometer. Since the AWG is designed for sensing applications, the input of the AWG, provided by the emission of a molecular system, is an incoherent field with no preferential polarization. Therefore, the signal is weak; however, it is sufficient. Furthermore, the spectral shape at each output port is suitable for performing an 1800 nm to 1480 nm wavelength conversion, considering the high extinction ratio between the channels.
The pump wavelength = 1480 nm transmits through the bus waveguide to control the saturable absorption limit in graphene layers coated on the output ports. Crossed-waveguide couplers are integrated with the output waveguides of the AWG to combine the output wavelengths and , depicted in Figure 3b. The coupler consists of the bus waveguide crossing perpendicularly to the output waveguides of the AWG, carrying . Power splitters and combiners are designed by integrating directional couplers with bend waveguides and asymmetric Y-branches, as shown in Figure 3c. The couplers combine a fraction of the power from the bus waveguide to each output waveguide. In addition, the couplers couple the same optical power from the bus waveguide to each output waveguide of the AWG. For example, considering a pump power of 100 μW at nm, ∼3 μW is coupled to each output waveguide. The remaining power in the bus waveguide after the propagation through each coupler can be defined as follows:
where j is the number of the output waveguide from 1 to and , assumed to be ∼100 μW, is the initial power in the bus waveguide. The coupling efficiency of each coupler can therefore be calculated in percentages from:
We can see that increasing j leads to greater coupling efficiencies; for example, %, %, %, %, %, %, %, %, and %. We carried out the simulations of the couplers with COMSOL multiphysics. The variations in the coupling efficiencies of the crossed-waveguide couplers can be achieved by tuning the length of the coupler with the bend radius r = 50 μm and the gap g = 300 nm (see Figure 5a). The parameters of the asymmetric Y-branch such as separation S = 1 μm and length = 50 μm are optimized to obtain low losses and the waveguide width of the crossed-waveguide couplers is tapered to 1 μm for better coupling efficiencies with shorter lengths. The plot of the coupling efficiency as a function of is shown in the inset of Figure 5a. The efficiency rises when the length is increased and drops after reaching the maximum at = 62.50 μm. Figure 5b,c illustrate the intensity distributions of the couplers at 3.10 μm and 31.30 μm where approximately % and % of the intensity of the bus waveguide couples to the first and thirty-first output waveguides. The crosstalk of the waveguide crossing is around 0.03%. However, the bus waveguide is designed to connect directly to the bent waveguide to achieve full coupling efficiency, %, to the last output waveguide.
We present here the concept of a spectrometer with the ability to perform a frequency conversion of a broad signal. The AWG demultiplexes 32-wavelength channels. The optical field at nm is launched simultaneously through the bus waveguide and coupled to the output ports of the AWG. The combined signals saturate the graphene layers at the output waveguide, allowing the spectrometer not only to operate with a standard optical instrument but also to amplify the weak signals obtained from the AWG.
4. Silicon–Graphene Operation for Spectrometry
Graphene exhibits very unique optical properties and the optical conductivity () can be described in terms of intraband () and interband () electronic transitions, [35]. The Kubo model is used to calculate the optical conductivity of graphene [36,37]. The intraband conductivity can be obtained from:
where is the Boltzmann constant, ℏ is reduced Plank constant, T is the temperature, is the Fermi energy, and is the angular frequency. The domination of intraband transitions occurs at low photon energies, whereas at higher optical frequencies, the interband transitions play the main role. The interband conductivity can be expressed as:
where is the characteristic electron energy and the function H is
The conductivity obtained from the Kubo model is the surface conductivity . The volume conductivity, however, can be calculated using [38] where the monolayer thickness of the graphene is 0.07 nm. The complex relative permittivity of graphene can be then defined as:
where is the vacuum permittivity and is the relative permittivity. The linear absorption at = 1480 nm of the graphene-layer-coated silicon rib waveguide is modeled by using COMSOL multiphysics. We apply the parameters T = 300 K, and s to the Kubo formula for calculating the optical conductivity of graphene. The geometry used in the absorption simulations is shown in Figure 6a. In Figure 6b, we vary the waveguide width W to observe light–graphene interactions through the evanescent field. As the waveguide width W increases, we observe a simultaneous increase in optical confinement and a decrease in the attenuation constant . The waveguide width W = 1 μm provides high optical attenuation = 0.078 dB/μm for while still maintaining sufficient optical confinements = 60.50% and = 51.00% for and wavelengths. This choice is crucial since reducing the W also results in decreased for the . The inset of Figure 6b shows the optical mode of the graphene-coated rib waveguide at W = 1 μm. To overcome the birefringence, the waveguide is designed to operate in the fundamental quasi-TE mode in which the electric field is oriented in the x-direction and the highest effective index is obtained with = 0.078 dB/μm. The high attenuation constant leads to a short graphene length , requiring low saturation power. We can see from Figure 6c that the absorptance increases while the transmittance decreases when we extend the length of graphene. The light experiences the full absorption at = 350 μm. In addition, Figure 6d illustrates the absorption of the light at = 350 μm. A graphene-coated rib waveguide can be created by depositing a layer of graphene on the waveguide, which allows for better control (electron beam patterning) of the shape of the graphene pattern. Inhomogeneity in the graphene layer is one of the main concerns; however, this issue can be addressed during the experimental studies in the fabrication process.
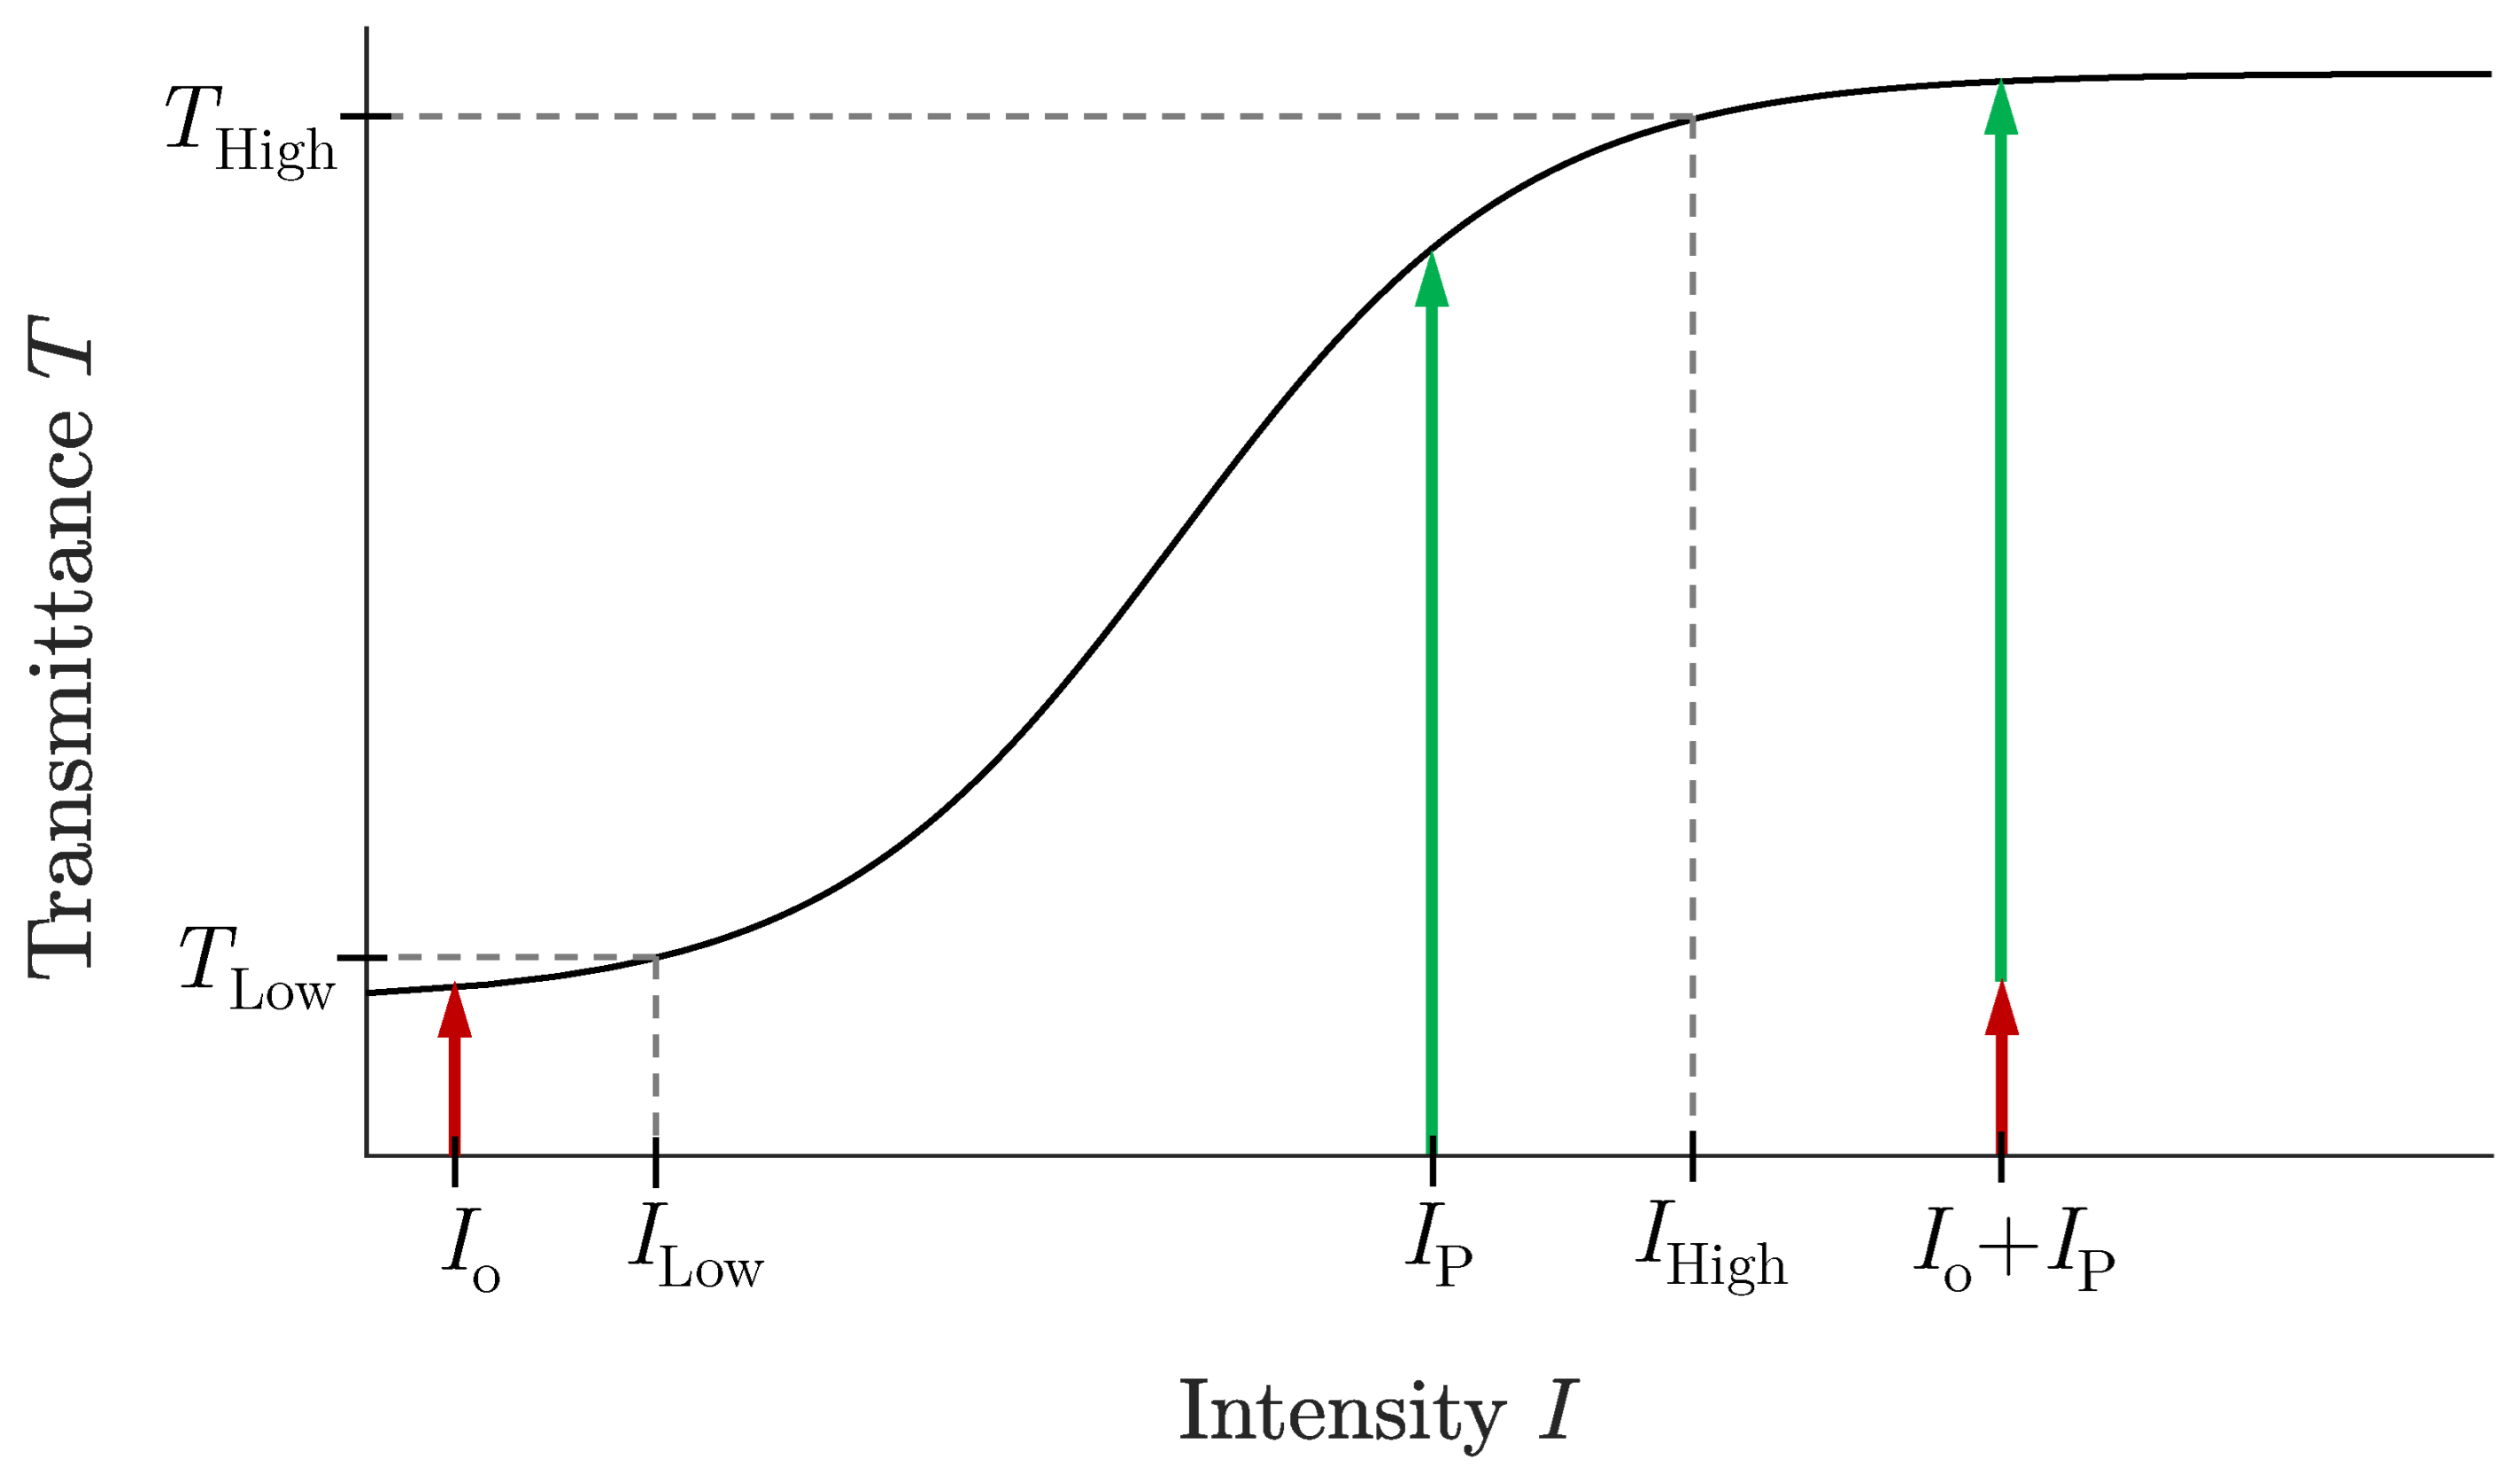
The saturable absorption of a monolayer of graphene depends on the driving intensity I and the absorptance can be defined as:
where and are saturable and nonsaturable absorption, is the saturation intensity [39], and the transmittance is . The saturation intensity varies according to the waveguide structures, graphene length, and the number of top graphene layers. However, the absorptance follows a similar curve obtained from Equation (7). We choose continuous wave lasers with relatively low power for our light sources. Therefore, additional and unwanted nonlinear effects remain weak and negligible, compared to the principal effect of absorption we want. Figure 7 shows the transmittance T of a graphene monolayer as a function of the driving intensity I. is low optical transmittance where most of the light at low intensity is absorbed by graphene. On the other hand, at high optical intensity , the graphene starts to saturate, and more light can pass through . A weak output intensity from AWG demonstrates the graphene absorption. The pump intensity is adjustable and set just below the saturation point. The combination of both output and pump intensities + reaches the graphene saturation limit and passes through the waveguide to the output of the chip. This allows weak optical signals to be detected on a standard NIR camera. Misaki et al. [40] reported the experimental results on the saturable absorption of a monolayer graphene-coated channel waveguide. According to the report, we consider the transmittance only in TE polarization. The value of is approximately 3 × 10⁻⁴ at = −22 dBm (∼6.31 μW) and the graphene layer starts to saturate at = −10 dBm (∼100 μW), which is around 13 × 10−4. The ablation threshold of graphene is about 100 mJ/cm2 [41]. For instance, considering a 1 min exposure would require 1.7 mW to start damaging the graphene layer.
5. Conclusions
We present the design and simulation of an arrayed waveguide grating for signal conversion, which could be applied in portable spectrophotometers. The rib waveguide with width W = 4 μm, rib height H = 220 nm, slab height h = 170 nm, and an etch depth d = 50 nm on an SOI platform is chosen as the basis of the device providing strong optical confinement for the quasi-TE fundamental mode. The AWG is designed with one input channel and broad thirty-two-wavelength band output channels ranging from 1750 nm to 1850 nm centered at nm. The output parameters are a channel spacing = 2.72 nm, an extinction ratio = 10.00 dB, a uniformity = 0.04, and a −3 dB bandwidth = 1.34 nm. The absorption of the graphene layers is saturated by introducing an external driving optical field at the wavelength of nm, which propagates through the bus waveguide, and combines to the demultiplexed wavelength and .
Such a device acts as a wavelength converter for a range of wavelengths that are difficult to detect with conventional instruments. Our solution could be useful in various fields of spectroscopy for the detection of organics, plastics, or gases that have their spectral absorption band in this region of the optical spectrum. It also provides solutions for integrated hyperspectral cameras and LiDARs.
Author Contributions
Conceptualization, M.R.; methodology, J.T.; software, J.T.; validation, M.R. and M.K.; formal analysis, J.T.; investigation, J.T.; resources, M.R. and M.K.; data curation, J.T.; writing—original draft preparation, J.T.; writing—review and editing, M.R. and M.K.; visualization, J.T.; supervision, M.R. and M.K.; project administration, M.R. and M.K.; funding acquisition, M.R. and M.K. All authors have read and agreed to the published version of the manuscript.
Funding
Project IBAIA, funding from the European Union’s Horizon Europe Framework Programme under grant agreement No. 101092723. Research Council of Finland through the flagship on “Photonics research and innovation” (PREIN, 320166).
Data Availability Statement
Data underlying the results presented in this paper are not publicly available at this time but may be obtained from the authors upon reasonable request.
Conflicts of Interest
The authors declare no conflicts of interest.
References
- Ismail, N.; Choo-Smith, L.P.; Wörhoff, K.; Driessen, A.; Baclig, A.; Caspers, P.; Puppels, G.; De Ridder, R.; Pollnau, M. Raman spectroscopy with an integrated arrayed-waveguide grating. Opt. Lett. 2011, 36, 4629–4631. [Google Scholar] [CrossRef] [PubMed]
- Yang, S.; Yeh, Y.C.; Ladasky, J.; Farhoodfar, A.; Schmidt, D. Single chip AWG-based Raman spectroscopy for continuous glucose monitoring. In Proceedings of the Optical Diagnostics and Sensing XVI: Toward Point-of-Care Diagnostics, San Francisco, CA, USA, 13–18 February 2016; SPIE: Bellingham, WA, USA, 2016; Volume 9715, pp. 216–221. [Google Scholar]
- Akca, B.; Chang, L.; Sengo, G.; Wörhoff, K.; Pollnau, M.; de Ridder, R.; Nguyen, V.D.; Kalkman, J.; van Leeuwen, T. Integrated AWG spectrometer for on-chip optical coherence tomography. In Proceedings of the 15th European Conference on Integrated Optics (ECIO), Cambridge, UK, 7–9 April 2010; IEEE Photonics Society: Piscataway, NJ, USA, 2010. [Google Scholar]
- Ybanez, N.; Bogaerts, W.; Hens, Z.; Baets, R. On-chip arrayed waveguide grating interrogated silicon-on-insulator microring resonator-based gas sensor. IEEE Photonics Technol. Lett. 2011, 23, 1505–1507. [Google Scholar]
- Weng, S.; Yuan, P.; Zhuang, W.; Zhang, D.; Luo, F.; Zhu, L. SOI-based multi-channel awg with fiber bragg grating sensing interrogation system. Photonics 2021, 8, 214. [Google Scholar] [CrossRef]
- Kee, J.S.; Poenar, D.P.; Neužil, P.; Yobaş, L.; Chen, Y. Design and fabrication of Poly (dimethylsiloxane) arrayed waveguide grating. Opt. Express 2010, 18, 21732–21742. [Google Scholar] [CrossRef] [PubMed]
- Martens, D.; Subramanian, A.Z.; Pathak, S.; Vanslembrouck, M.; Bienstman, P.; Bogaerts, W.; Baets, R.G. Compact silicon nitride arrayed waveguide gratings for very near-infrared wavelengths. IEEE Photonics Technol. Lett. 2014, 27, 137–140. [Google Scholar] [CrossRef]
- Schauwecker, B.; Przyrembel, G.; Kuhlow, B.; Radehaus, C. Small-size silicon-oxynitride AWG demultiplexer operating around 725 nm. IEEE Photonics Technol. Lett. 2000, 12, 1645–1646. [Google Scholar] [CrossRef]
- Tippinit, J.; Pélisset, S.; Baah, M.; Kuittinen, M.; Roussey, M. Titanium Dioxide AWG for the Visible. In Proceedings of the 2020 Photonics North (PN), Niagara Falls, ON, Canada, 26–28 May 2020; IEEE: Piscataway, NJ, USA, 2020; p. 1. [Google Scholar]
- Nikbakht, H.; van Someren, B.; Hammer, M.; Akca, B.I. Weak optical modes for high-density and low-loss photonic circuits. APL Photonics 2023, 8, 056107. [Google Scholar] [CrossRef]
- Tang, X.; Zheng, Y.; Liu, J.; Duan, J.A. Optimization Method for Center Frequency Accuracy of High-Channel-Count Arrayed Waveguide Grating in Dense Wavelength Division Multiplexing Systems. Photonics 2023, 10, 1178. [Google Scholar] [CrossRef]
- Zou, J.; Sun, F.; Wang, C.; Zhang, M.; Wang, J.; Lang, T.; Wang, X.; Le, Z.; He, J.J. Silicon-based arrayed waveguide gratings for WDM and spectroscopic analysis applications. Opt. Laser Technol. 2022, 147, 107656. [Google Scholar] [CrossRef]
- Zou, J.; Xia, X.; Chen, G.; Lang, T.; He, J.J. Birefringence compensated silicon nanowire arrayed waveguide grating for CWDM optical interconnects. Opt. Lett. 2014, 39, 1834–1837. [Google Scholar] [CrossRef]
- Zou, J.; Ma, X.; Xia, X.; Wang, C.; Zhang, M.; Hu, J.; Wang, X.; He, J.J. Novel wavelength multiplexer using (N + 1) × (N + 1) arrayed waveguide grating and polarization-combiner-rotator on SOI platform. J. Light. Technol. 2021, 39, 2431–2437. [Google Scholar] [CrossRef]
- Pathak, S.; Dumon, P.; Van Thourhout, D.; Bogaerts, W. Comparison of AWGs and echelle gratings for wavelength division multiplexing on silicon-on-insulator. IEEE Photonics J. 2014, 6, 1–9. [Google Scholar] [CrossRef]
- Ye, T.; Fu, Y.; Qiao, L.; Chu, T. Low-crosstalk Si arrayed waveguide grating with parabolic tapers. Opt. Express 2014, 22, 31899–31906. [Google Scholar] [CrossRef] [PubMed]
- Stanton, E.J.; Volet, N.; Bowers, J.E. Silicon arrayed waveguide gratings at 2.0-μm wavelength characterized with an on-chip resonator. Opt. Lett. 2018, 43, 1135–1138. [Google Scholar] [CrossRef] [PubMed]
- Wang, Y.; Bhat, S.; Tessema, N.; Kraemer, R.; Napoli, A.; Delrosso, G.; Calabretta, N. Ultrawide-band Low Polarization Sensitivity 3-μm SOI Arrayed Waveguide Gratings. J. Light. Technol. 2022, 40, 3432–3441. [Google Scholar] [CrossRef]
- Nair, R.R.; Blake, P.; Grigorenko, A.N.; Novoselov, K.S.; Booth, T.J.; Stauber, T.; Peres, N.M.; Geim, A.K. Fine structure constant defines visual transparency of graphene. Science 2008, 320, 1308. [Google Scholar] [CrossRef] [PubMed]
- Wang, J.; Xing, Z.; Chen, X.; Cheng, Z.; Li, X.; Liu, T. Recent progress in waveguide-integrated graphene photonic devices for sensing and communication applications. Front. Phys. 2020, 8, 37. [Google Scholar] [CrossRef]
- Li, H.; Anugrah, Y.; Koester, S.J.; Li, M. Optical absorption in graphene integrated on silicon waveguides. Appl. Phys. Lett. 2012, 101, 111110. [Google Scholar] [CrossRef]
- Marini, A.; Cox, J.; De Abajo, F.G. Theory of graphene saturable absorption. Phys. Rev. B 2017, 95, 125408. [Google Scholar] [CrossRef]
- Liu, M.; Yin, X.; Ulin-Avila, E.; Geng, B.; Zentgraf, T.; Ju, L.; Wang, F.; Zhang, X. A graphene-based broadband optical modulator. Nature 2011, 474, 64–67. [Google Scholar] [CrossRef]
- Liu, M.; Yin, X.; Zhang, X. Double-layer graphene optical modulator. Nano Lett. 2012, 12, 1482–1485. [Google Scholar] [CrossRef] [PubMed]
- Luo, S.; Wang, Y.; Tong, X.; Wang, Z. Graphene-based optical modulators. Nanoscale Res. Lett. 2015, 10, 199. [Google Scholar] [CrossRef] [PubMed]
- Oya, M.; Kishikawa, H.; Goto, N.; Yanagiya, S.i. All-optical switch consisting of two-stage interferometers controlled by using saturable absorption of monolayer graphene. Opt. Express 2012, 20, 27322–27330. [Google Scholar] [CrossRef] [PubMed]
- Yang, Y.; Lv, J.; Lin, B.; Cao, Y.; Yi, Y.; Zhang, D. Graphene-assisted polymer waveguide optically controlled switch using first-order mode. Polymers 2021, 13, 2117. [Google Scholar] [CrossRef] [PubMed]
- Muntaha, S.T.; Hokkanen, A.; Harjanne, M.; Cherchi, M.; Suopajärvi, P.; Karvinen, P.; Pekkarinen, M.; Roussey, M.; Aalto, T. 3D Printed Lenses for Vertical Beam Collimation of Optical Phased Arrays. 3D Print. Addit. Manuf. 2023. ahead of Print. [Google Scholar] [CrossRef]
- Optiwave. OptiMode User’s Reference; Optiwave: Ottawa, ON, Canada, 2013; Volume 3.1. [Google Scholar]
- Optiwave. WDM Phasar Technical Background and Tutorials; Optiwave Systems Inc.: Ottawa, ON, Canada, 2000. [Google Scholar]
- Liu, L.; Dai, D.; Dainese, M.; Wosinski, L.; He, S. Compact arrayed waveguide grating demultiplexers based on amorphous silicon nanowires. In Proceedings of the Nanophotonics, Uncasville, CO, USA, 26–28 April 2006; Optica Publishing Group: Washington, DC, USA, 2006; p. NWB5. [Google Scholar]
- Przyrembel, G.; Kuhlow, B.; Solehmainen, K.; Aalto, T.; Heimala, P. Design and fabrication of arrayed waveguide grating multiplexers on silicon-on-insulator platforms. Opt. Eng. 2007, 46, 094602. [Google Scholar] [CrossRef]
- Cheben, P.; Schmid, J.; Delâge, A.; Densmore, A.; Janz, S.; Lamontagne, B.; Lapointe, J.; Post, E.; Waldron, P.; Xu, D.X. A high-resolution silicon-on-insulator arrayed waveguide grating microspectrometer with sub-micrometer aperture waveguides. Opt. Express 2007, 15, 2299–2306. [Google Scholar] [CrossRef] [PubMed]
- Li, K.; Yuan, P.; Lu, L.; Dong, M.; Zhu, L. PLC-based arrayed waveguide grating design for fiber Bragg grating interrogation system. Nanomaterials 2022, 12, 2938. [Google Scholar] [CrossRef]
- Multiphysics, C. Graphene Metamaterial Perfect Absorber; COMSOL: Stockholm, Sweden, 2022. [Google Scholar]
- Falkovsky, L.A. Optical properties of graphene. J. Phys. Conf. Ser. 2008, 129, 012004. [Google Scholar] [CrossRef]
- Teng, D.; Wang, K.; Li, Z. Graphene-coated nanowire waveguides and their applications. Nanomaterials 2020, 10, 229. [Google Scholar] [CrossRef]
- Deng, S.; Yetisen, A.K.; Jiang, K.; Butt, H. Computational modelling of a graphene Fresnel lens on different substrates. RSC Adv. 2014, 4, 30050–30058. [Google Scholar] [CrossRef]
- Bao, Q.; Zhang, H.; Ni, Z.; Wang, Y.; Polavarapu, L.; Shen, Z.; Xu, Q.H.; Tang, D.; Loh, K.P. Monolayer graphene as a saturable absorber in a mode-locked laser. Nano Res. 2011, 4, 297–307. [Google Scholar] [CrossRef]
- Takahashi, M.; Ueda, W.; Goto, N.; Yanagiya, S. Saturable absorption by vertically inserted or overlaid monolayer graphene in optical waveguide for all-optical switching circuit. IEEE Photonics J. 2013, 5, 6602109. [Google Scholar] [CrossRef]
- Vasquez, A.; Samolis, P.; Zeng, J.; Sander, M.Y. Micro-structuring, ablation, and defect generation in graphene with femtosecond pulses. OSA Contin. 2019, 2, 2925–2934. [Google Scholar] [CrossRef]
Figure 1.
Illustration of the concept of the on-chip spectrometer. The signal is a broad source centered at nm. This large signal feeds an AWG, which splits the signal into different output wavelengths . Each output is coupled to another pump source at nm. On each output waveguide, a graphene layer is deposited to absorb light (pump) to the limit of saturation. When a small additional signal reaches a nearly saturated output, the corresponding graphene layer saturates completely and both pump and signal can pass slightly until reaching the output of the chip. This output is imaged on a standard NIR camera for wavelength-to-pixel detection.
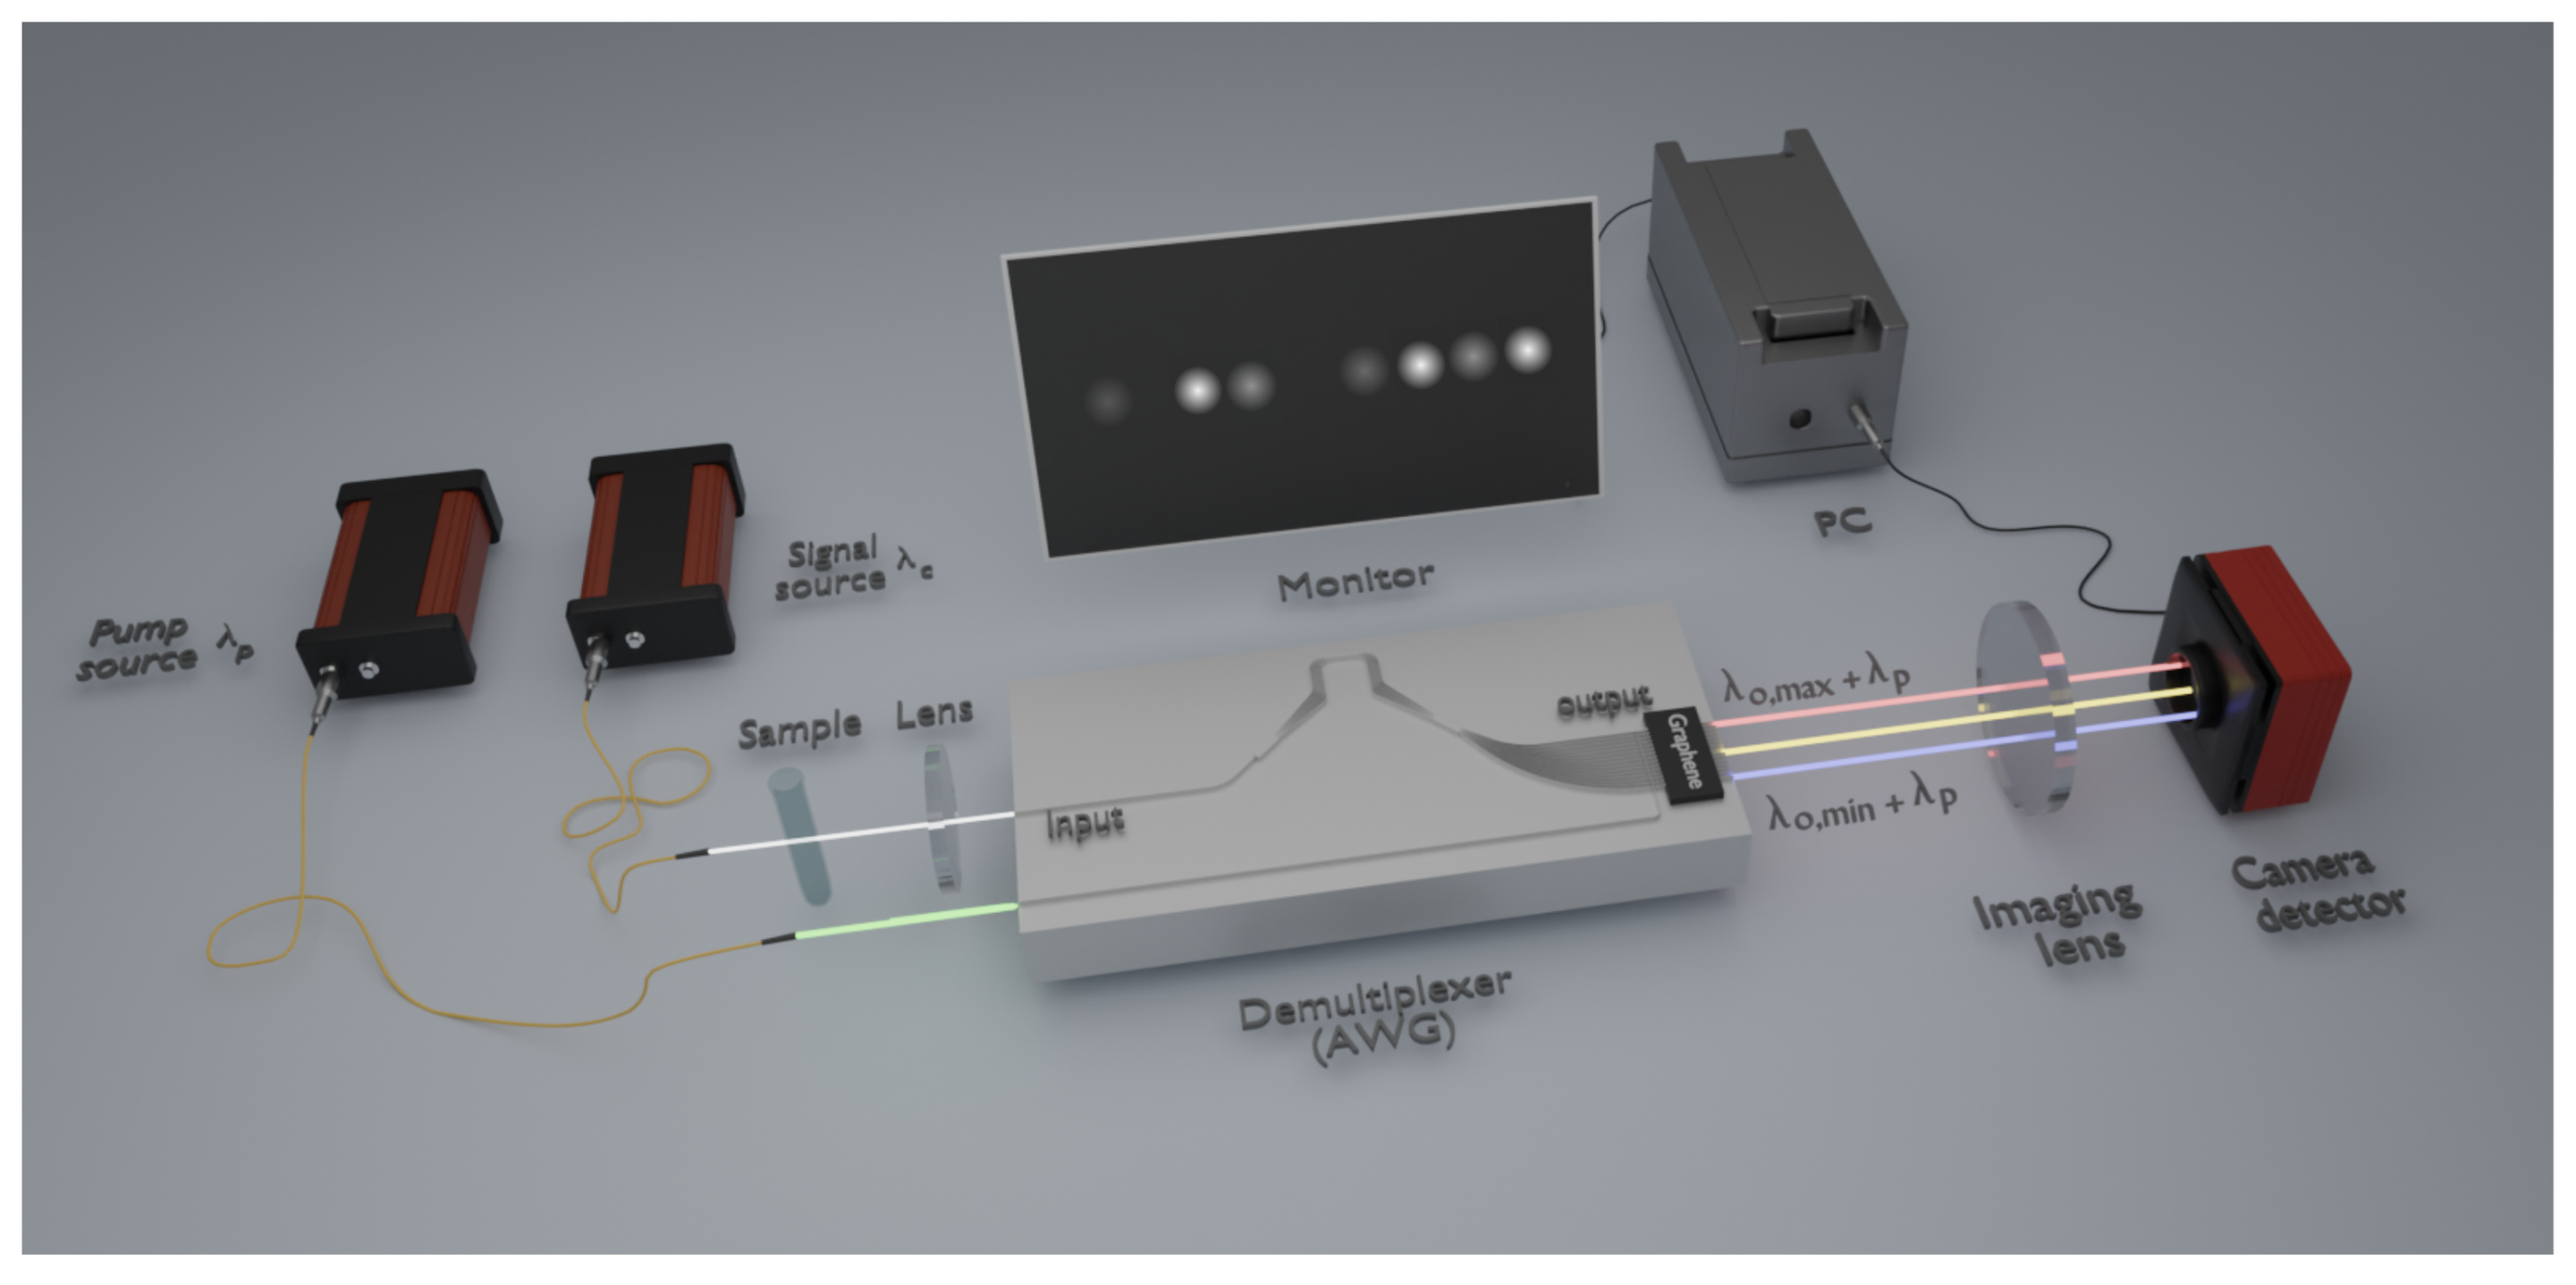
Figure 2.
(a) Schematic of the considered rib waveguide on silicon-on-insulator platform. (b) Intensity distribution of the fundamental quasi-TE mode in the silicon rib waveguide (W = 4 μm, H = 220 nm, h = 170 nm, and t = 50 nm).
Figure 2.
(a) Schematic of the considered rib waveguide on silicon-on-insulator platform. (b) Intensity distribution of the fundamental quasi-TE mode in the silicon rib waveguide (W = 4 μm, H = 220 nm, h = 170 nm, and t = 50 nm).
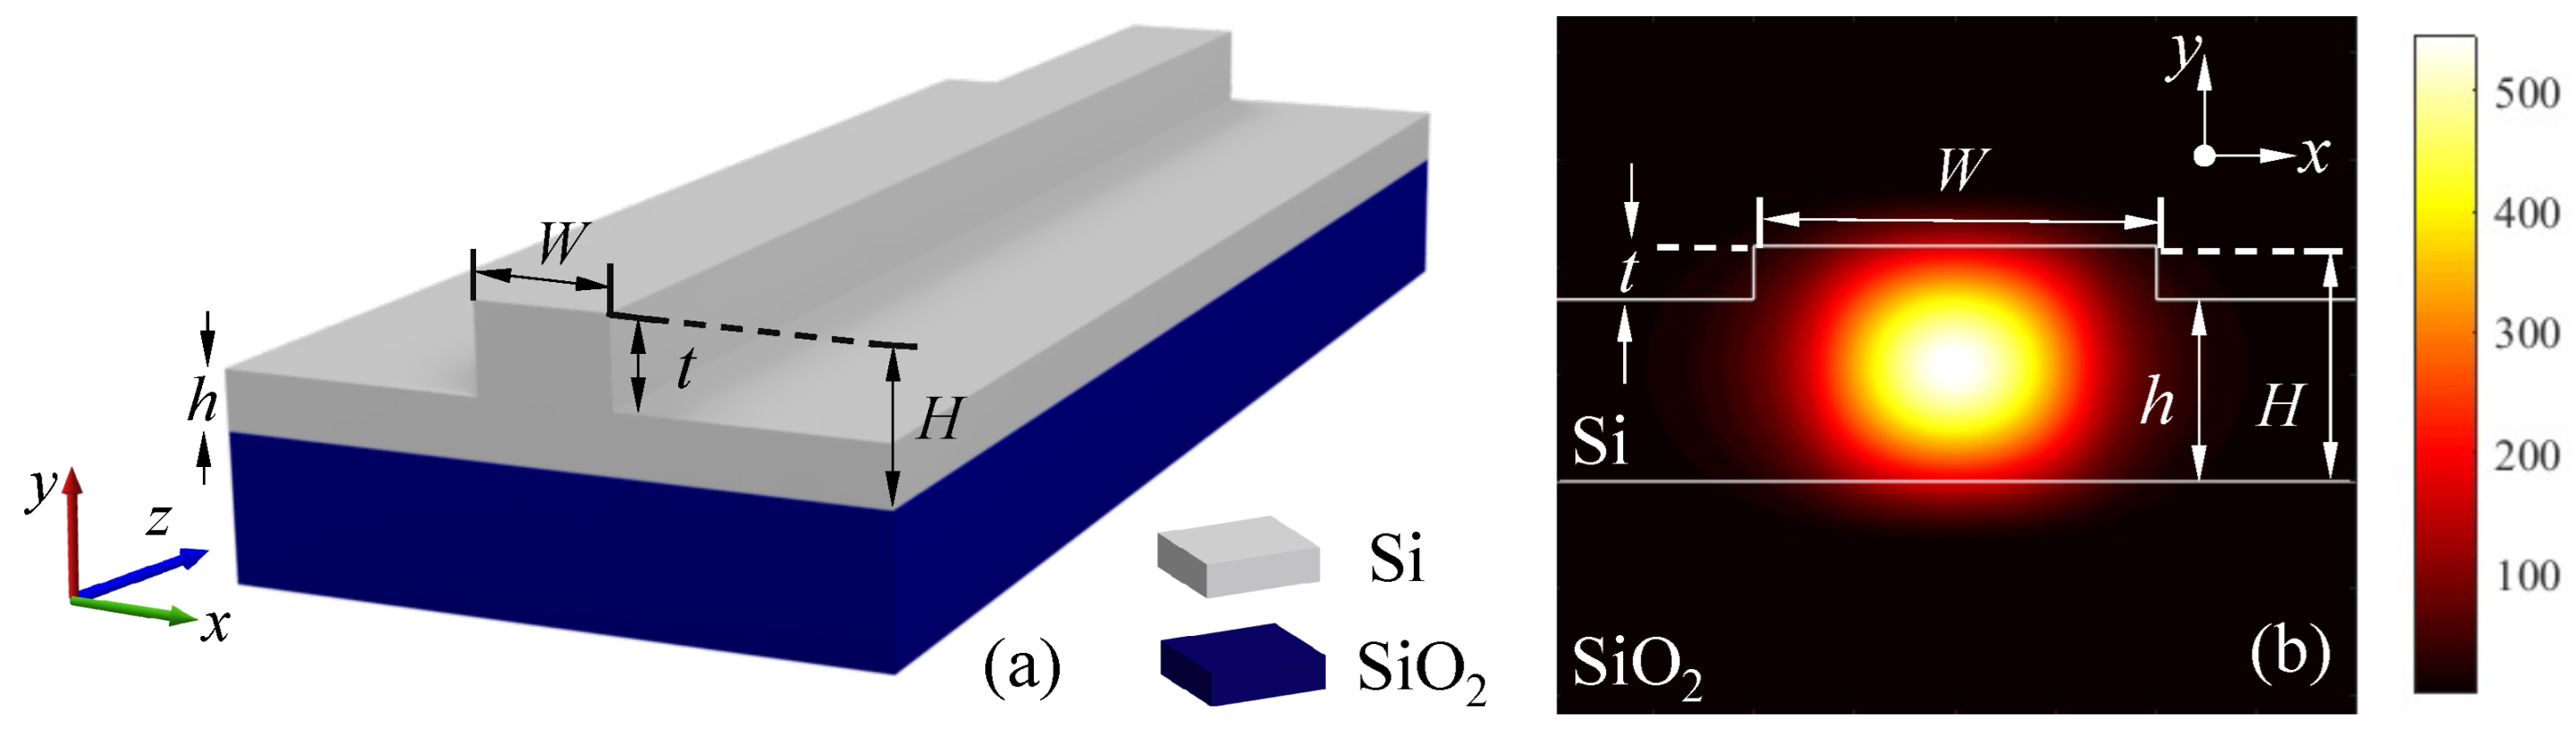
Figure 3.
(a) Schematic of the AWG for controlled spectrometry using signal conversion. (b) Combination of demultiplexed wavelength and the pump wavelength nm to reach saturable absorption limit in graphene layers at the output ports. (c) Schematic of the used crossed-waveguide coupler.
Figure 3.
(a) Schematic of the AWG for controlled spectrometry using signal conversion. (b) Combination of demultiplexed wavelength and the pump wavelength nm to reach saturable absorption limit in graphene layers at the output ports. (c) Schematic of the used crossed-waveguide coupler.
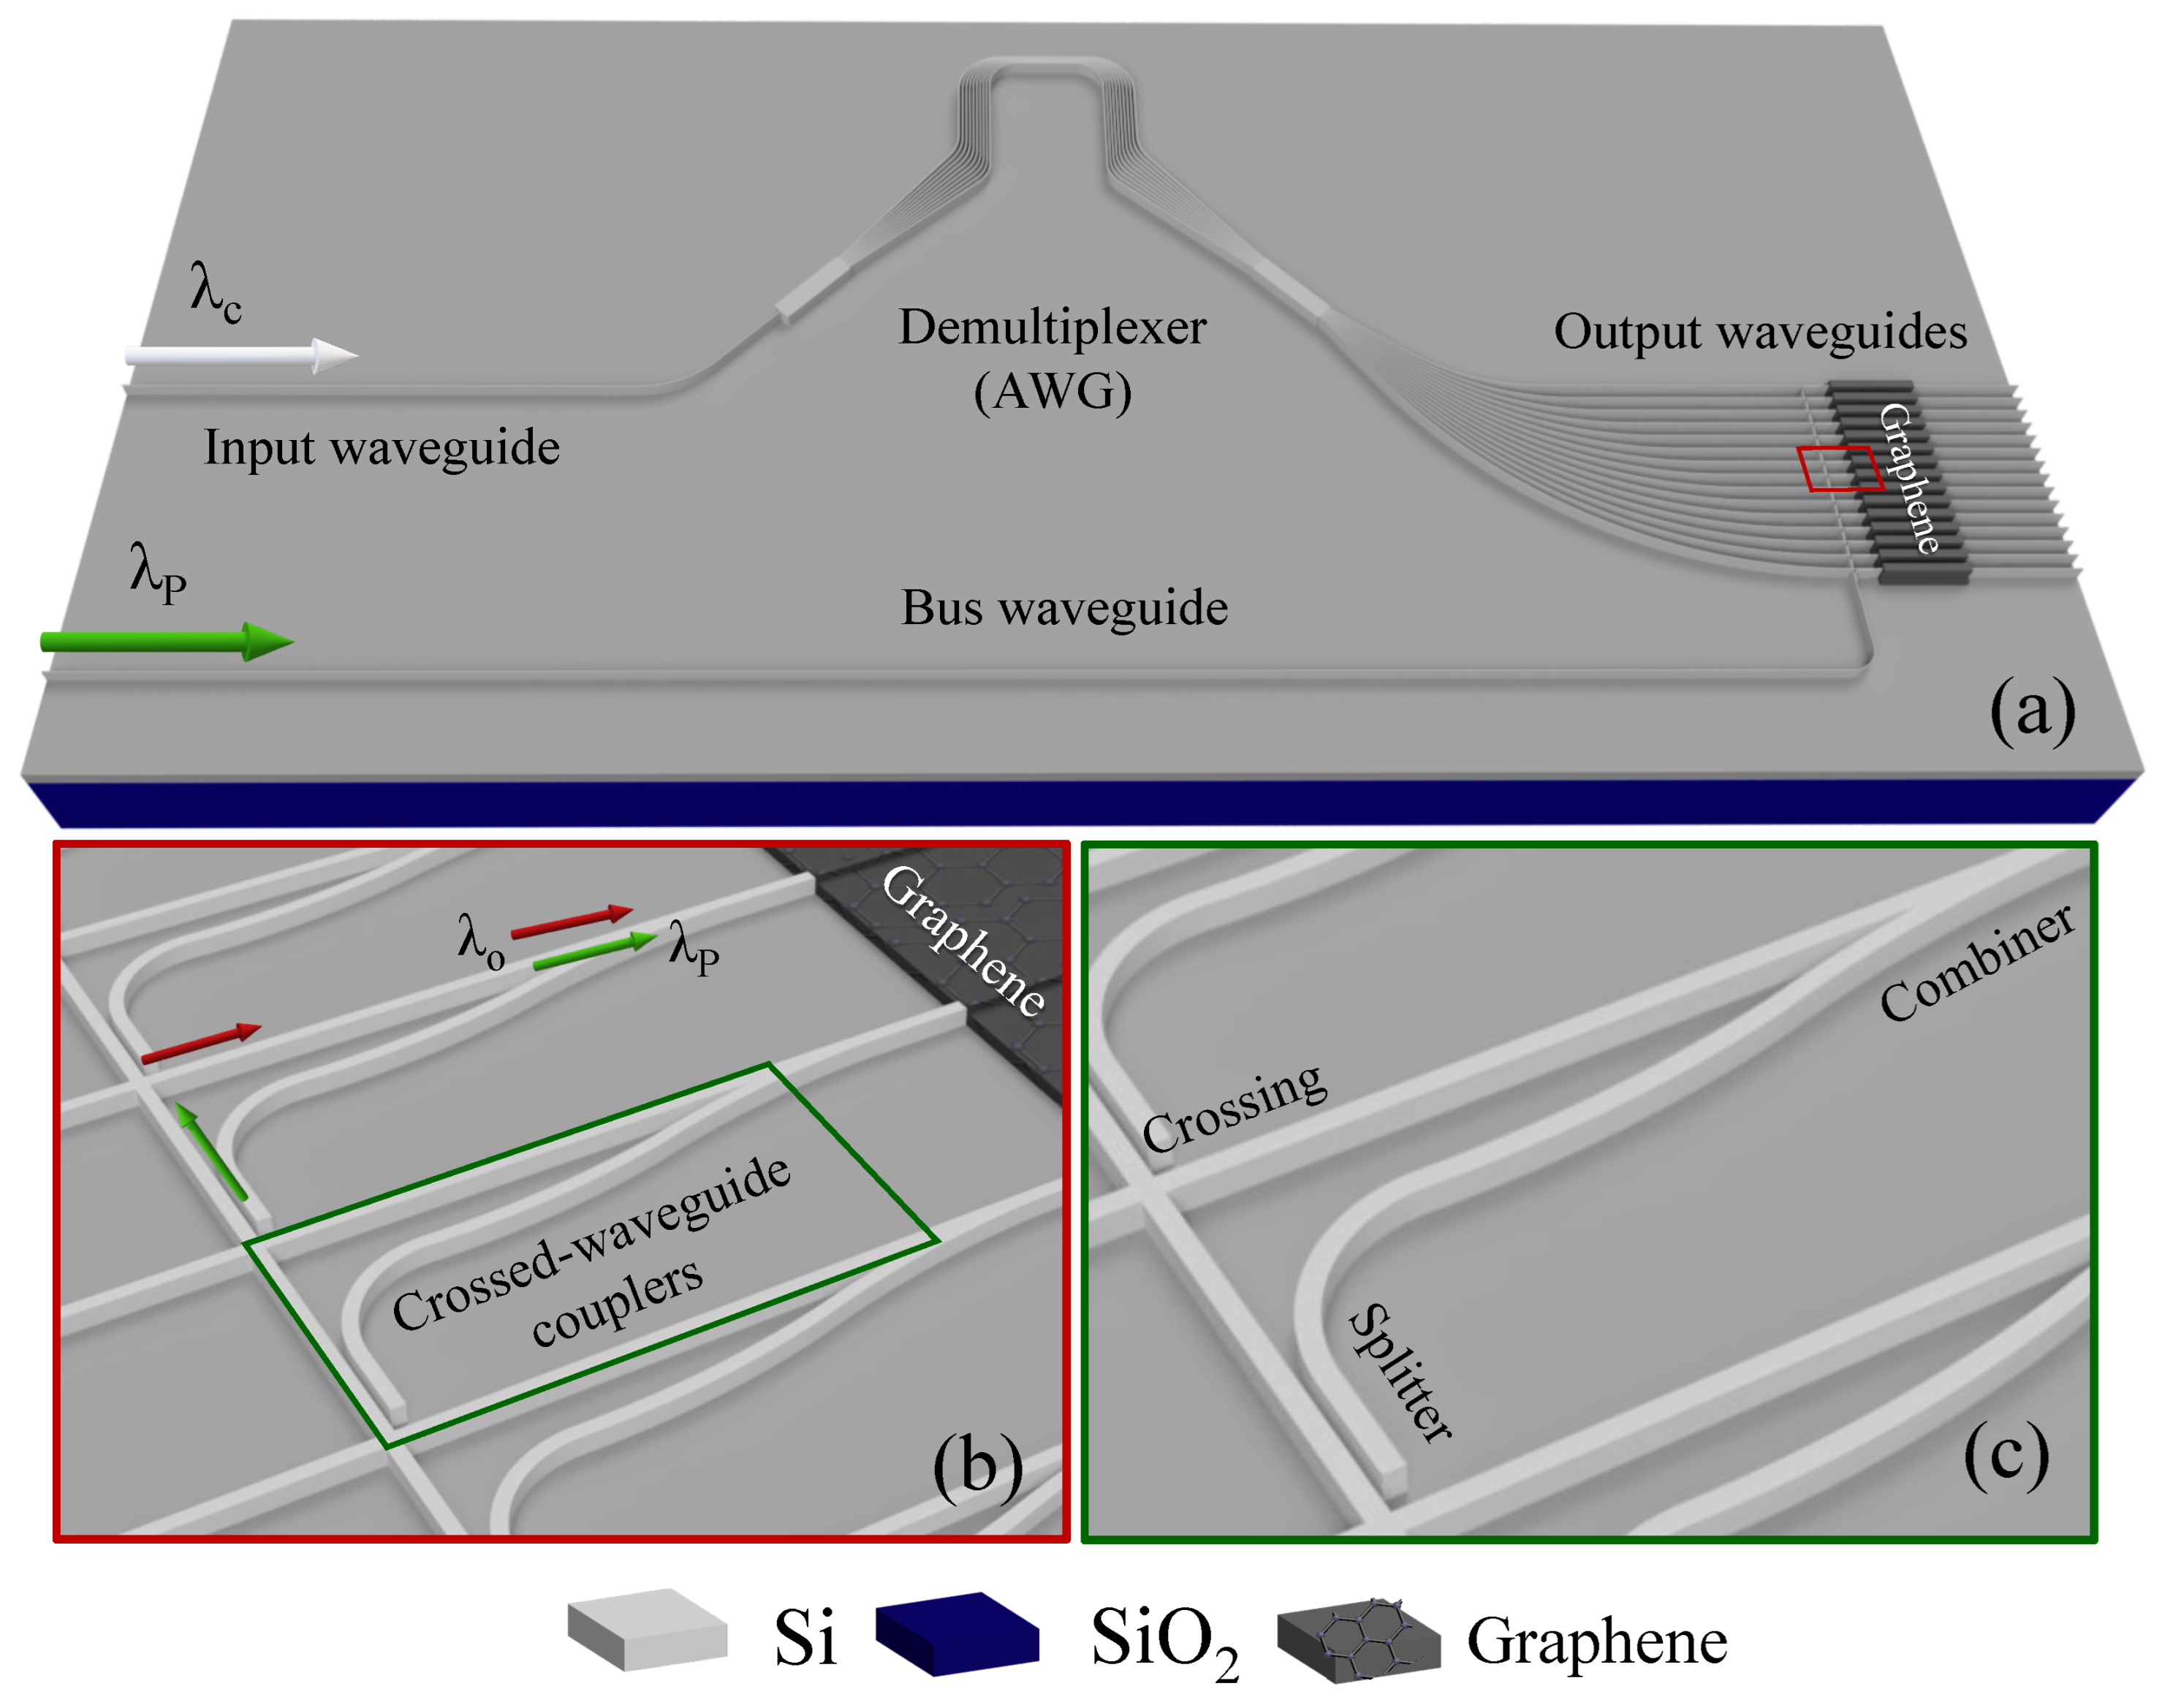
Figure 4.
(a) Influence of the output waveguide separation on the extinction ratio and channel spacing. (b) The simulated output power as a function of demultiplexed wavelengths of the AWG at nm.
Figure 4.
(a) Influence of the output waveguide separation on the extinction ratio and channel spacing. (b) The simulated output power as a function of demultiplexed wavelengths of the AWG at nm.
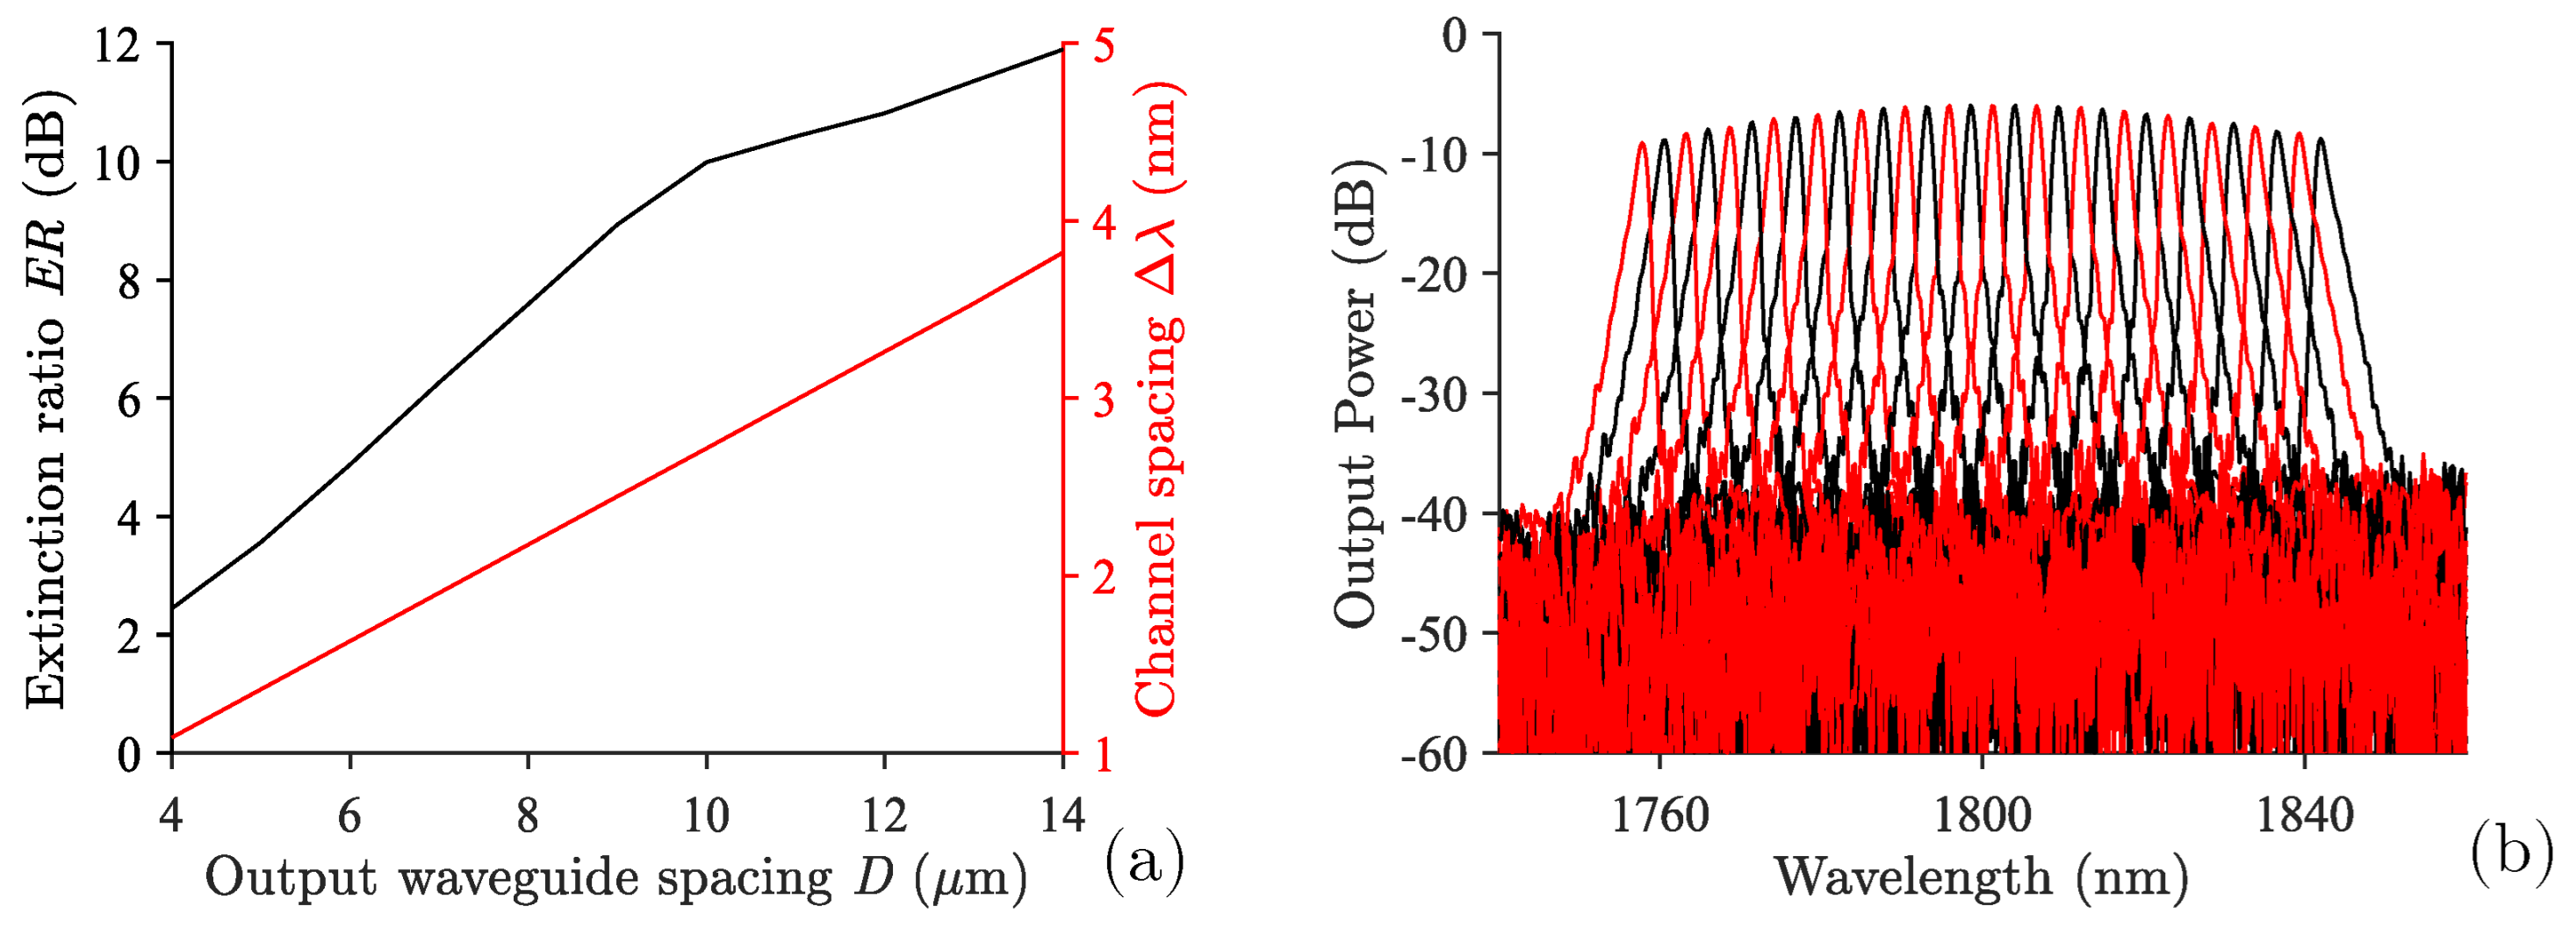
Figure 5.
(a) Parameters of the couplers. Inset: variation of the coupling efficiency with the coupling length . Intensity distribution in the couplers at (b) = 3.13% and (c) = 50.00%.
Figure 5.
(a) Parameters of the couplers. Inset: variation of the coupling efficiency with the coupling length . Intensity distribution in the couplers at (b) = 3.13% and (c) = 50.00%.

Figure 6.
(a) Schematic of a rib waveguide on silicon-on-insulator platform with a monolayer of graphene = 0.07 nm deposited on the top. (b) The dependence of confinement factor and attenuation constant on the different waveguide widths. Inset: optical mode inside the rib waveguide coated with monolayer graphene at W = 1 μm. (c) Variation of transmittance and absorptance as a function of the graphene length. (d) Linear absorption of the waveguide where light is fully absorbed in = 350 μm.
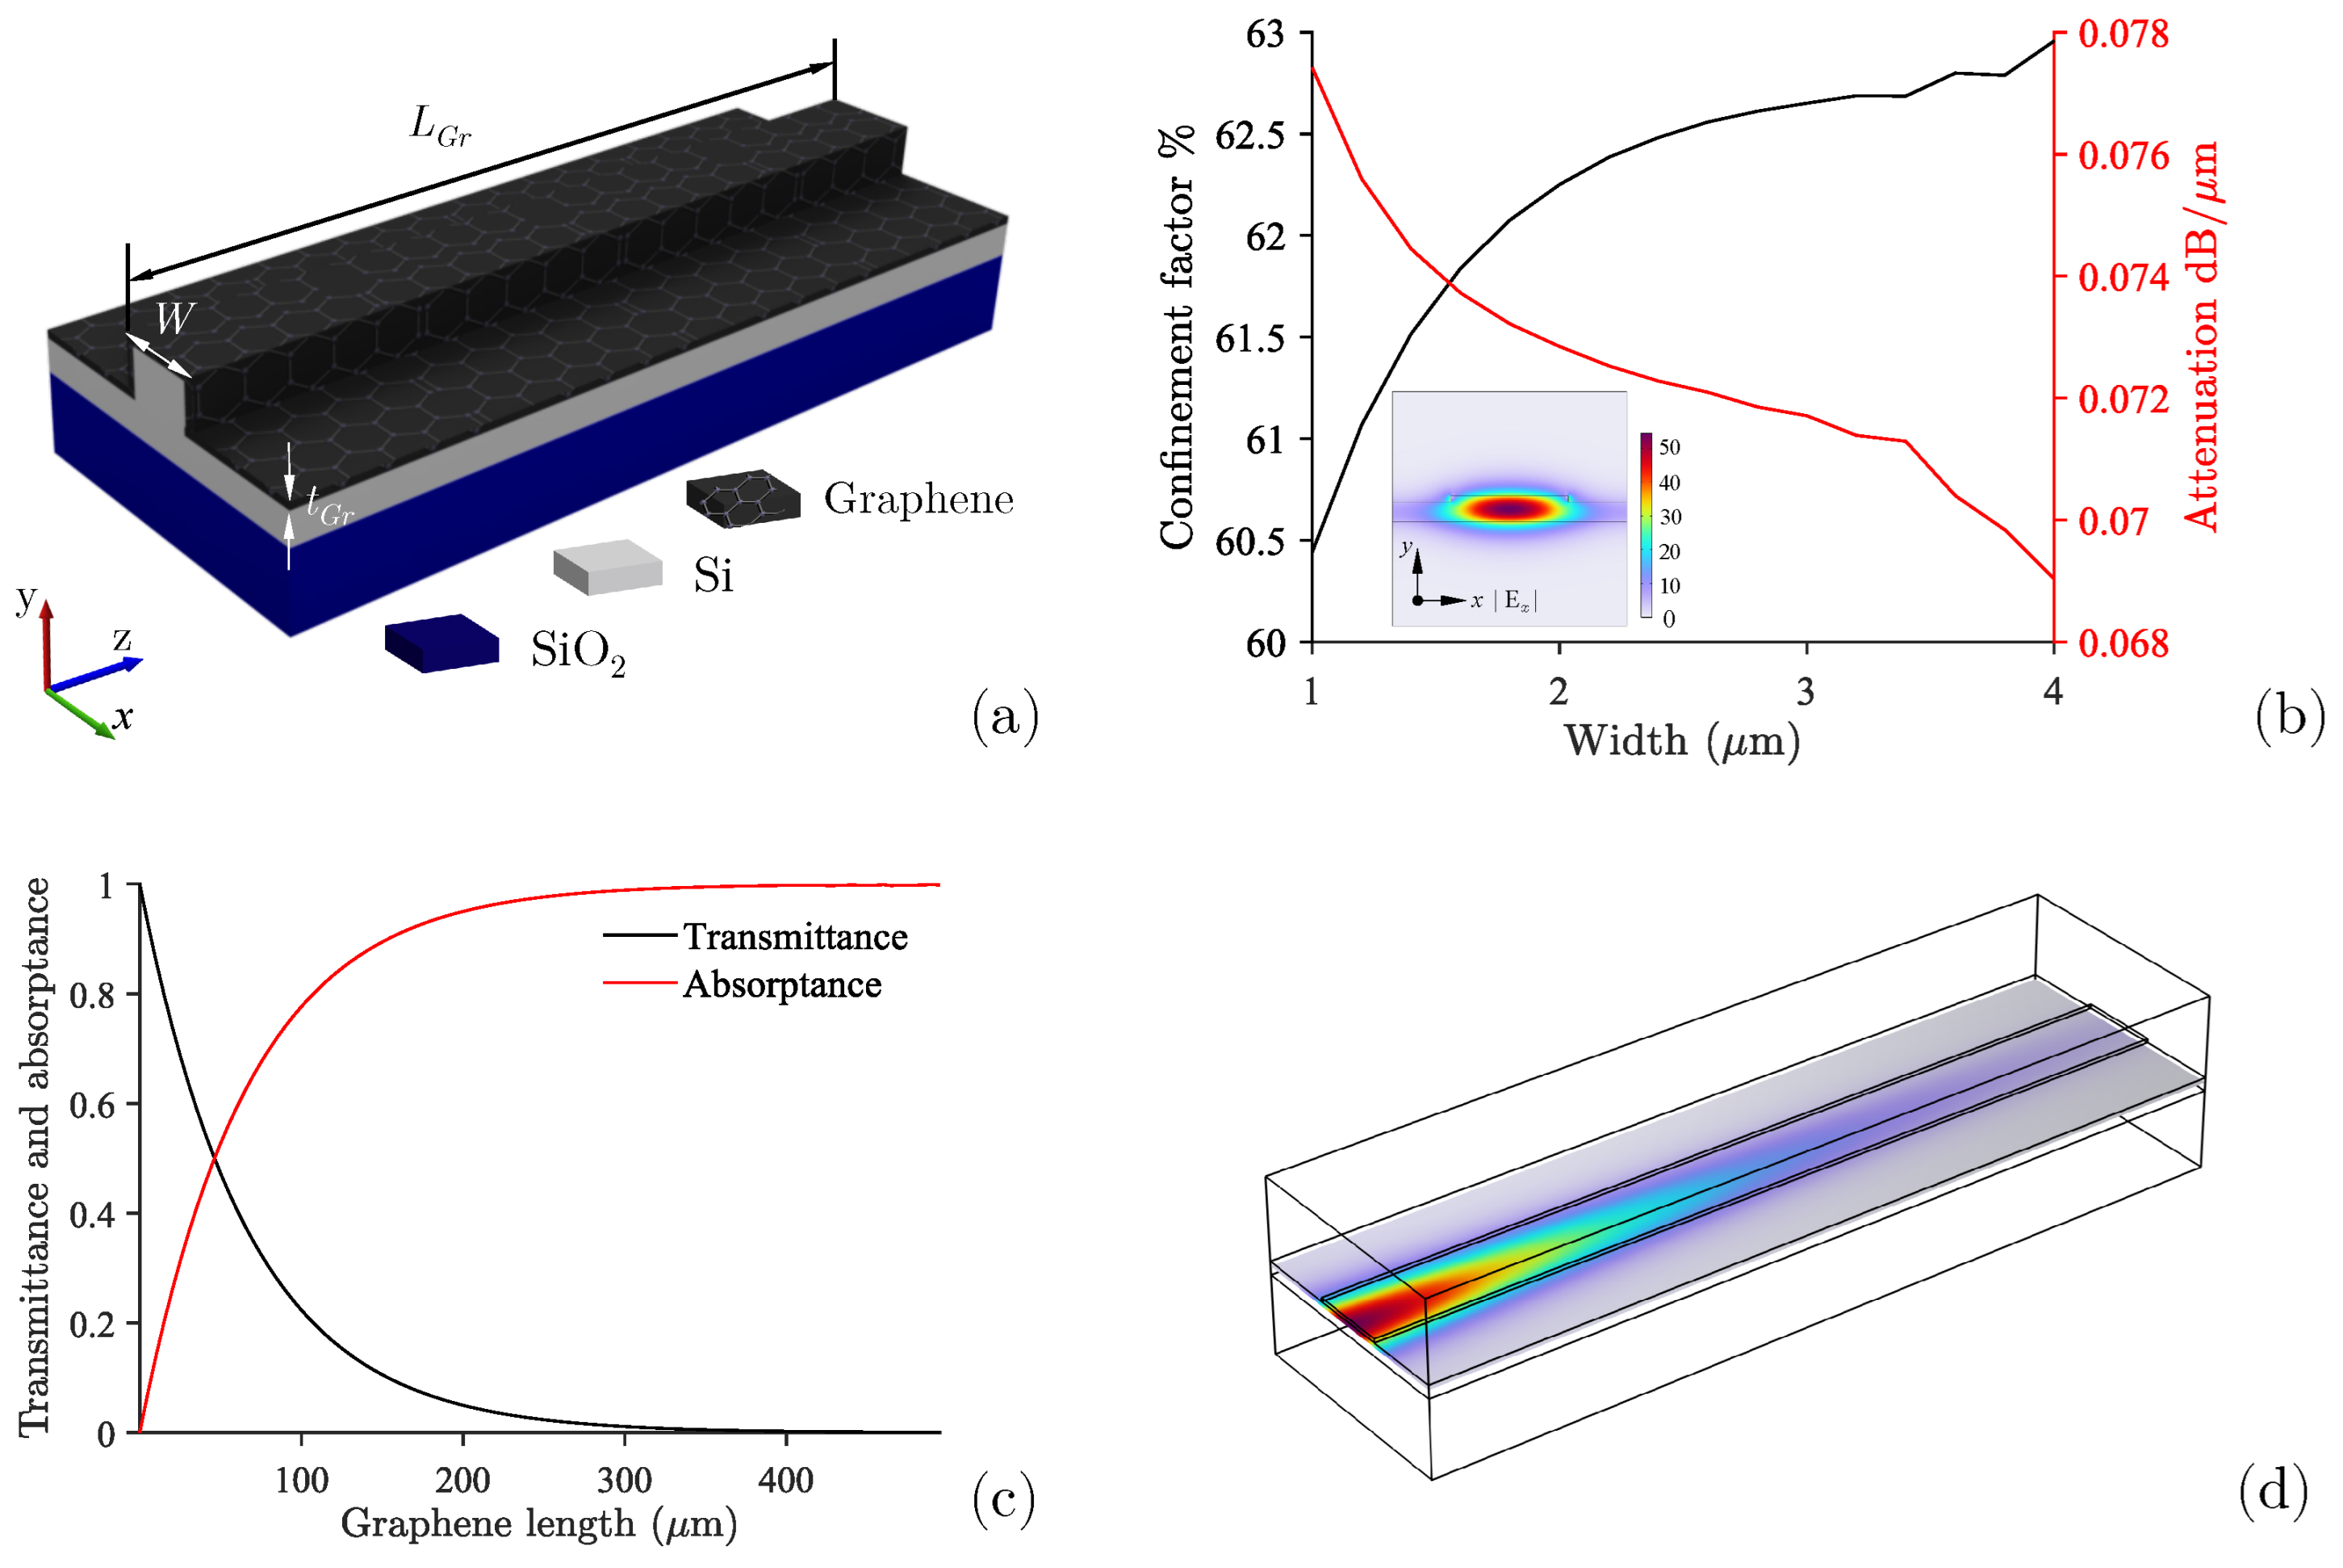
Figure 7.
Saturable absorption of graphene where the optical transmittance T depends on the driving intensity I. A weak optical intensity from AWG is absorbed by the graphene, and the pump intensity is set just below the saturation point. The combined intensities amplify the weak signal and saturate the graphene layer, allowing more light to pass through.

Table 1.
Design parameters for the arrayed waveguide grating.
| Parameter | Notation | Value |
|---|---|---|
| Waveguide effective index | 3.08 | |
| Cladding effective index | 2.84 | |
| Number of array waveguides | N | 180 |
| Number of output waveguides | 32 | |
| Diffraction orders | m | 12 |
| Free spectral range | 150.00 nm | |
| Output waveguide separation | D | 4.00 μm |
| Array waveguide separation | 4.00 μm | |
| Free propagation region length | f | 3780.00 μm |
| Array waveguide length increment | 7.03 μm |
Disclaimer/Publisher’s Note: The statements, opinions and data contained in all publications are solely those of the individual author(s) and contributor(s) and not of MDPI and/or the editor(s). MDPI and/or the editor(s) disclaim responsibility for any injury to people or property resulting from any ideas, methods, instructions or products referred to in the content. |
© 2024 by the authors. Licensee MDPI, Basel, Switzerland. This article is an open access article distributed under the terms and conditions of the Creative Commons Attribution (CC BY) license (https://creativecommons.org/licenses/by/4.0/).
Share and Cite
MDPI and ACS Style
Tippinit, J.; Kuittinen, M.; Roussey, M. Hybrid Graphene–Silicon Arrayed Waveguide Gratings for On-Chip Signal–Frequency Conversion. Photonics 2024, 11, 302. https://doi.org/10.3390/photonics11040302
AMA Style
Tippinit J, Kuittinen M, Roussey M. Hybrid Graphene–Silicon Arrayed Waveguide Gratings for On-Chip Signal–Frequency Conversion. Photonics. 2024; 11(4):302. https://doi.org/10.3390/photonics11040302
Chicago/Turabian StyleTippinit, Janvit, Markku Kuittinen, and Matthieu Roussey. 2024. "Hybrid Graphene–Silicon Arrayed Waveguide Gratings for On-Chip Signal–Frequency Conversion" Photonics 11, no. 4: 302. https://doi.org/10.3390/photonics11040302
Note that from the first issue of 2016, this journal uses article numbers instead of page numbers. See further details here.