Measurement of Group Delay Ripples of Chirped Fiber Bragg Gratings for CPA Lasers, and Their Effect on Performance

1
School of Electronic Information and Electrical Enginering, Chengdu University, Chengdu 130012, China
2
Ultron Photonics, Hangzhou 311200, China
*
Author to whom correspondence should be addressed.
†
These authors contributed equally to this work.
Photonics 2024, 11(4), 333; https://doi.org/10.3390/photonics11040333
Submission received: 21 February 2024
/
Revised: 14 March 2024
/
Accepted: 27 March 2024
/
Published: 2 April 2024
(This article belongs to the Special Issue Ultrafast Laser Science and Advanced Technologies)
Abstract
:The deleterious effect of group delay ripples (GDR) on the performance of a chirped fiber Bragg grating used as a stretcher in a chirped pulse amplification (CPA) laser is analyzed through simulations of CFBGs with various amounts of noise. We show that GDR with a standard deviation of less than one-half the transform-limited pulse duration are required for consistent good performance. We furthermore describe a simple method to measure the group delay response of such CFBGs written in polarization-maintaining fiber, using the beat spectrum of the reflections from the two polarization axes after passing through a polarizer. The method can be used to extract GDR, as well as the phase response of the CFBG, which is used to predict the pulse recompression performance of a CPA laser. The method is theoretically described, and we show that despite limitations on its spatial resolution, it can capture the most deleterious GDR. Experimental measurements of GDR as low as 161 fs in an actual CFBG are demonstrated using our method, indicating a resolution better than 50 fs and very good reproducibility, with pulse recompression performance in agreement with the measurement prediction.
1. Introduction
Chirped fiber Bragg gratings (CFBG) have proven to be invaluable components in fiber optic communication systems [1], as well as in chirped pulse amplification (CPA) laser systems [2,3,4,5,6]; therefore, the accurate measurement of their group velocity dispersion (GVD), and especially their group delay ripples (GDR), is essential for assessing their performance [7,8,9,10,11].
The deleterious effects of GDR for CFBGs in optical communication links have been extensively studied, as well as methods to mitigate them [12,13,14,15,16,17,18,19,20,21,22]. Typically, however, CFBG bandwidths in such systems are around 0.5 nm, and the chirp is around 10 pm/mm. In such cases, GDR less than about 10 ps, or 20% of a bit length, do not cause significant impairment in terms of receiver sensitivity and bit-error rate (BER) [15]. CPA laser systems have different characteristics and requirements. The CFBG bandwidth is typically much larger (10–20 nm), and the performance requirements are the duration of the recompressed pulse after amplification, as well as its quality, typically measured as the Strehl ratio. For pulses of a few hundred fs, it is intuitively apparent that GDR should be smaller than the pulse duration. That represents a GDR about a hundred times smaller (100 fs vs. 10 ps). An early study on the effect of GDR in a CPA system [17] concluded that GDR up to 10 ps did not affect the quality or duration of the pulse, but that study only considered pulses in the picosecond domain. The conclusion was also based on the effect of GDR with a single spectral frequency, whereas GDR are typically more akin to noise. Thus far, there has been no other detailed study on the performance requirements for sub-ps pulses, as well as accurate measurement of GDR.
In this paper, we first analyze the deleterious effect of GDR in the fs regime and determine criteria for acceptable GDR. Knowing the requirements of the GDR, it is also important to have the capability to measure them with enough accuracy. We have recently demonstrated a simple and inexpensive method to measure the dispersion of CFBGs used in CPA laser systems [23] based on a concept that we had demonstrated earlier for CFBGs used in communication systems [24]. We expand here on the theory behind the method and extend it to the measurement of GDR. We show through simulations that even though the method has a spatial resolution limited by the fiber birefringence, the most deleterious source of GDR has spatial frequencies larger than that limit. Finally, we present experimental measurements of GDR using our method that confirm that it has the resolution and reproducibility to provide an accurate assessment of GDR and the overall performance of a given CFBG.
2. The Effect of Group Delay Ripples
We first assess the effect of GDR on the performance of a stretcher/compressor using a CFBG as the stretcher and a pair of gratings as the compressor. GDR originate from noise in the CFBG profile. The noise can either be amplitude noise, or period noise, which can also be seen as phase noise. In Ref. [9], spectral fluctuations of the group delay with a fixed period are directly added to a CFBG response and studied as a function of that period. For actual devices, noise is mostly random with a certain spectrum of spectral frequencies. In other studies, the standard deviation of the group delay noise is used as the metric [24], and we use the same approach here, with GDR being expressed in femtoseconds, as the standard deviation of the group delay across the spectrum of the CFBG. In Section 3, we will use fluctuations of fixed spatial periods to analyze the spatial resolution of our measurement method.
For all our simulations, we used the parameters of the CFBGs that were subsequently measured, which are 92 mm in length, a super-Gaussian spatial profile (exponent of 28) having an FWHM of 83 mm, and linear and quadratic chirp values of −0.1935 nm/mm, and −0.00026 nm/mm2 respectively. A linear taper of the grating strength of 13% across its length was added to obtain a flat reflection and transmission spectrum, as otherwise, the quadratic chirp results in a slanted spectrum. The quadratic chirp is required to match the higher-order dispersion of the grating-pair compressor. The coupling constant was adjusted to give 50% reflectivity, a typical value for practical devices, limited by the amount of coupling by the CFBG into the fiber cladding modes. Actual devices have a further taper introduced during fabrication to account for this cladding mode loss, which we did not include in the simulations. The wavelength step was typically 2 pm or less and the spatial step 0.05 mm or less. Noise could be introduced to either the period or the amplitude, with a filtered white noise generator, to generate GDR patterns similar to those of our actual measurements. The simulation was carried out using the well-known matrix multiplication method and provides the complex reflection spectrum of the CFBG (phase and amplitude). The group delay is calculated as the derivative of the phase with respect to frequency. The square modulus of the amplitude provides the reflectivity.
For a CFBG used as a pulse stretcher in a CPA laser system, the higher-order values of the Taylor-series expansion of the phase of the reflected wave are important to know, as they have to match those of the compressor at the output of the amplifier. The phase is thus expanded as:
where , and . If the curve is fitted around a central frequency with a polynomial of order n, such that , then we find:
The various orders of GVD are obtained by fitting the group delay of the CFBG to a high-order polynomial. Generally, only the first three orders, that is to , are relevant, and higher-order fits do not significantly change their values. GDR is calculated by subtracting the third-order polynomial fit of the group delay from the exact computed group delay. The GDR are quantified as the standard deviation of the group delay across the CFBG spectrum and expressed in femtoseconds.
Pulse recompression is then simulated by summing the phase of the CFBG to that of a grating pair compressor (calculated to all orders). In our case, we consider gratings with 1600 lines/mm. The CFBG reflection spectrum is multiplied by the laser spectrum, which is based on a Yb-based femtosecond laser similar to that used in our measurements, with a bandwidth of 2.3 nm and a sech2 shape. This corresponds to a transform-limited 482 fs pulse. An inverse FFT is applied to the resulting complex spectrum to obtain the recompressed pulse.
The spatial profile of a CFBG can have noise in both the amplitude of the index modulation and its period. Both result in GDR as well as in a noisy transmission spectrum, as seen in Figure 1 [12,17]. Amplitude noise can also give rise to period noise if it is due to a variation in UV exposure along the grating (e.g., due to laser power fluctuations during the writing process), as the period is proportional to the average refractive index, which is proportional to exposure. We found that pure amplitude noise (without the associated average refractive index noise) gives rise to noise in the transmission spectrum but produces insignificant GDR. Therefore, the total period noise, whether caused by amplitude noise or other factors (e.g., UV beam pointing instability, or fiber irregularity) is the most important cause of GDR. Since both amplitude and period noise result in a noisy transmission spectrum, the latter cannot distinguish between the two, and is not a good indicator of device performance, as a very noisy transmission spectrum could very well have very low GDR. Therefore, only the direct measurement of GDR can predict the device’s performance. Thus, for the rest of our analysis, we only consider period noise and the resulting GDR. The period noise is quantified as the standard deviation of the period from its designed value along the CFBG and is expressed in picometers.
For a perfect grating (Figure 1a), there are no GDR, although the standard deviation is not zero due to a slow and small deviation from the ideal group delay. Recompression of a 482 fs pulse (transform-limited from the 2.3 nm laser spectrum), after stretching with the CFBG, yields a 492 fs pulse by optimizing the compressor angle and grating separation. The 10 fs penalty is due to the mismatch in , as we consider a CFBG made with a phase mask having only up to a quadratic chirp (corresponding to the devices we measured). The CFBG has a that is twice that of the compressor, resulting in a slightly broadened pulse. On the other hand, the pulse has a high-quality fit to a sech2 shape with no sidebands. To compute the Strehl ratio in the presence of noise, we use this slightly longer pulse as a reference, giving a ratio of 1.00 for this ideal case. The Strehl ratio for other cases is then computed from the ratio of the peak power to the integrated pulse energy, using the computed ratio of this ideal case as a normalizing factor.
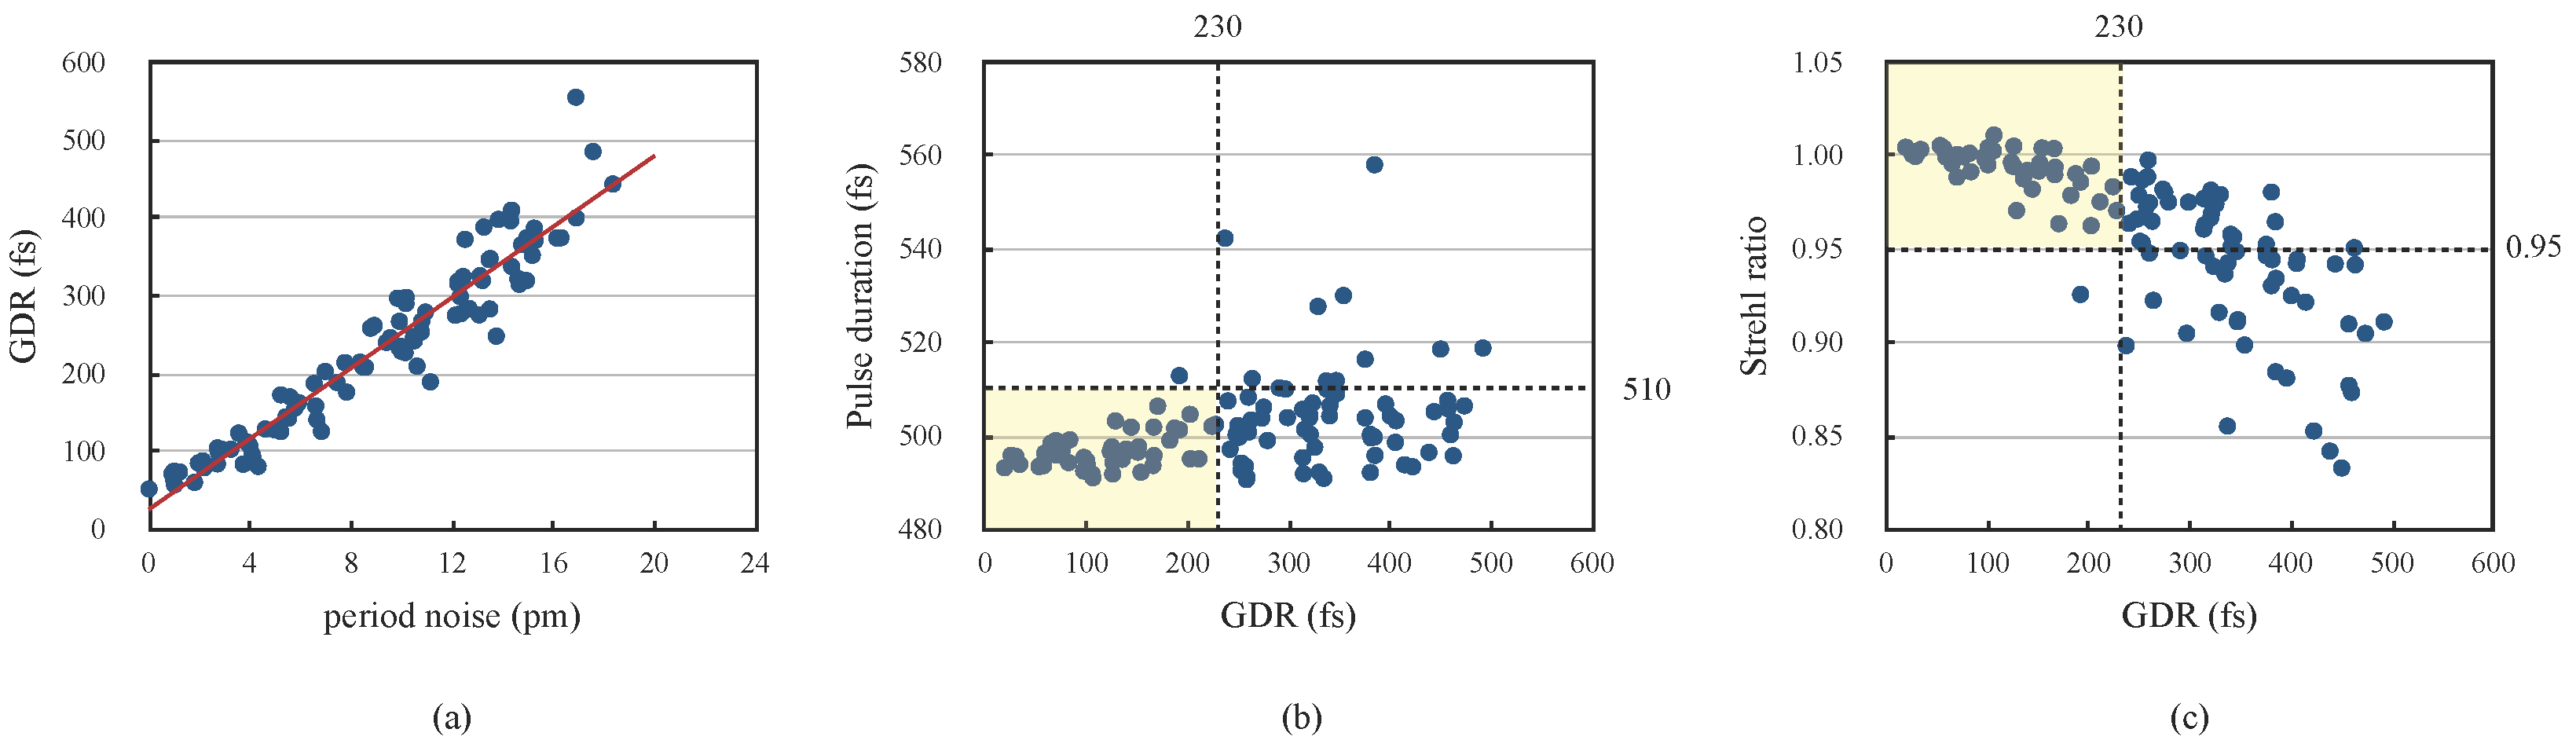
Next, we introduced random noise patterns in the period of simulated gratings, using white noise and a low pass filter to more or less emulate the GDR patterns observed from actual experimental measurements. For standard deviations of period noise ranging from 0 to 17 pm, we simulated over 100 CFBGs. The noise creates both fluctuations in the transmission spectrum and the group delay response and affects the pulse duration and Strehl ratio. Figure 1b,c shows examples with 7.9 and 16.4 pm noise, yielding GDR of 183 and 426 fs, respectively, and pulse durations of 499 fs and 536 fs. The figure also includes GDR and recompressed pulses obtained by simulating the measurement, as discussed in the next section, but they are virtually identical. Figure 2a shows that the GDR is linearly related to the period noise. However, the net effect of the GDR depends on the particular noise pattern. Figure 2b,c shows the pulse duration and Strehl ratio as a function of GDR for all the gratings simulated. It can be seen that the proportion of “good” pulses (pulse duration less than 510 fs, Strehl ratio larger than 0.95) decreases rapidly over a certain value of noise; although, in many cases, the pulse is still “good enough”, depending on the particular acceptable performance target. In the case of the particular CFBG design studied here, a threshold of about 230 fs is estimated above which the yield of good devices becomes too low, as indicated by the shadowed areas in Figure 2. This is about one-half of the ideal pulse duration. However, in many cases, CFBGs with higher GDR are still acceptable. Therefore, while the GDR is a good indicator of average device quality, individual device measurement and simulation of pulse recompression is a better predictor of performance.
This criterion thus points to the necessity to accurately measure such a small amount of GDR. The actual measurement should have a resolution much below that threshold. In the next section, we present the theory of our measurement method and analyze its capability to resolve the most deleterious GDR.
3. Measurement Method: Theory
Group velocity dispersion (GVD), and the associated GDR, are typically measured using a narrow band phase-modulated tunable light source [8,11,25]. The relative phase of the modulation sidebands is retrieved from the beat signal using a fast photodiode and a network analyzer, a method that involves expensive instrumentation. Other methods have been proposed and demonstrated [7,10,26], but although some are presented as “simpler”, they still involve complex and expensive equipment. Nevertheless, commercial instruments are available (e.g., Luna OVA5100 https://lunainc.com/product/ova-5100, accessed on 31 March 2024) that claim a resolution of 100 fs, although none seem available for the 1030 nm wavelength range. Recently, we have presented a simple and inexpensive method to measure the GVD of CFBGs based on measuring the phase shift between the two orthogonal polarization modes of the optical fiber as a function of wavelength [23]. The method was originally used for dispersion compensators used in long-distance fiber optic links [24], in which case the CFBG is typically written in the circular core of the non-polarization-maintaining (PM) fiber. For CPA systems, CFBGs are commonly made in PM fiber. In such cases, the polarization state goes through a large number of rotations along the CFBG, as opposed to a fraction of a cycle in non-PM fiber. However, we showed that our method could be adapted to reconstruct the phase from such a large number of cycles.
Our method uses the fact that orthogonally polarized modes have the same temporal frequency but different spatial frequencies. Measuring the differential phase of these two modes is achieved by first launching circularly polarized light and measuring the reflection through an in-line polarizer [23,24]. Light from a broadband optical source is passed through an in-line polarizer, whose state of polarization is adjusted to circular. An optical spectrum analyzer then measures the light reflected through the same polarizer. Since the phase matching condition for reflection from the CFBG actually involves the difference between the spatial (and not temporal) frequency of the light and that of the grating, each orthogonal mode will be reflected at a slightly different location along the CFBG, which satisfies their respective resonant Bragg condition. For a given chirp, wavelengths within the CFBG spectrum propagate further and further into it so that the state of polarization at the polarizer will go through one spectral cycle for every additional beat length traveled along the CFBG and back. In a polarization-maintaining (PM) fiber, the typical beat length is about 2–3 mm, while the CFBG is typically 100 mm long. Therefore, the reflected spectrum will show multiple cycles of high and low values, the phase of which is directly related to the group delay. This is but an intuitive description. We show below mathematically that the beat spectrum is directly related to the GVD, irrespective of the particular chirp function. For example, it can also measure the GVD of unchirped gratings.
The measurement setup is illustrated in Figure 3. The light from the broadband source (BBS) travels to the CFBG through a coupler (3 dB), followed by a fiber polarizer (POL), and a polarization controller (PC). The fiber used in that part is circular-core, non-PM fiber. The PM fiber pigtail of the CFBG under test is connected either with a fusion splice or a mechanical splice. The reflection retrieved from the other branch of the coupler is sent to the optical spectrum analyzer (OSA). Alternatively, a tunable laser source could be used in conjunction with a photodetector. Tunable lasers are usually already polarized, and in that case, a second PC may be used before the polarizer to ensure maximum transmission through it. The cleaved end (CE) of the pigtail is only used to measure the birefringence of the fiber, as described later, and would otherwise be cleaved at an angle to avoid back reflections.
For light at a given wavelength propagating to the CFBG and being reflected at one point along it, according to its chirp function, each orthogonally polarized mode will undergo a phase shift due to the length of the fiber pigtail to the CFBG and from the group velocity dispersion of the CFBG itself. For the section of unbent, non-PM fiber between the PC and the PM fiber, the phase difference can be kept negligible because of the very low birefringence of the fiber, if care is taken to keep it straight and short (in our case, less than 1 m). If the two orthogonal modes of the PM fiber have effective indices and , then the CFBG reflection spectra for each mode are shifted in frequency by an amount:
where is the average of and , and B is the normalized birefringence. The total phase shift in each axis is then found to be:
where is the phase of the light reflected by the CFBG. The phase difference between the two reflected modes is then:
where , and is the length of the PM fiber pigtail from the connector to the CFBG. The first term on the right is the group delay of the fiber pigtail, while the second term is the group delay due to the CFBG. In Equation (5), we have purposefully distinguished between the birefringence in the fiber pigtail and that within the CFBG to account for the possibility that the two could be different due to the photo-induced birefringence of the writing process. For a flat top 15 nm bandwidth CFBG, and a typical wavelength shift of about 0.25 nm (for ) between the reflection spectra of the two polarized modes, the reflectivity is approximately the same for both polarizations, and the light reflected through the polarizer is given by:
Given that the beat length of a typical PM fiber is of the order of 1–3 mm, and CFBGs can have lengths of 50–150 mm, the reflection spectrum comprises a large number of cycles. The PM fiber pigtail, having a typical length of about one meter, also gives rise to multiple polarization rotations. Therefore, it is difficult to know the absolute value of the phase with precision. However, each cycle corresponds to an additional phase shift, so the curve of can be reconstructed from the beat pattern, albeit without precise knowledge of the absolute value of the phase within some multiple of . On the other hand, the phase difference between two adjacent frequencies separated by can be expressed as:
The first derivative is the group delay at frequency . The second derivative is the group velocity dispersion (GVD). The first frequency point on the edge of the spectrum (for example, corresponding to 3 dB below the peak reflection) can be defined as having a group delay of so that the group delay at that frequency is included in the total delay from the polarizer up to that point. The following frequency point, at is then found to have:
where is the additional group delay between and . One can thus reconstruct recursively:
The value of the group delay at frequency is given by:
This allows the value of to be extracted from the reconstructed group delay curve, using knowledge of both the length of the CFBG and its bandwidth . For a value , and knowing the difference between the final phase and the initial phase , we find:
The difference between and thus represents the photo-induced birefringence from the grating writing process.
The resolution of the measurement is limited by the OSA resolution (20 pm for modern instruments), but mostly by the birefringence of the fiber, which results in an equivalent modulation frequency, as per Equation (3). Since different frequencies are reflected at different spatial positions due to the chirp, fluctuations occurring on a scale smaller than that spatial separation are not well captured. For , the two polarization “sidebands” are spectrally separated by 0.25 nm, and for a chirp of 0.19 nm/cm, the spatial separation between the reflection points of each sideband is 1.3 mm.
In order to assess the performance and effective resolution of our method, we used the computed spectra of the CFBG and simulated the measurement by taking the numerically computed spectrum, shifting the frequency by plus or minus half of the amount of Equation (3), summing the two resulting complex spectral amplitudes, taking the square modulus of their sum and dividing by the average of the squared moduli of the two (equivalent to the measurement normalization using the reflection trace). The resulting beat spectrum was then filtered to simulate the OSA instrumental resolution of 20 pm. The group delay is then extracted using Equation (10), and the phase of the CFBG response is calculated as the integral of the group delay. The phase can, in turn, be used to calculate the recompressed pulse as described above for the computed spectrum.
The numerical reconstruction of the phase of the beat spectrum is performed by first identifying the peaks and troughs. For this, we fit the data around each with a parabola, from which the location of the maximum (or minimum) is extracted. The inverse cosine of the square root is then taken from one maximum to one minimum and from that minimum to the next maximum, adding a factor of each time. The largest error occurs near each peak or trough since the derivative of the inverse cosine goes to infinity. Thus, averaging is performed around those few points to flatten the small spikes that would typically appear, though this has no effect on the final result. From , the group delay of the CFBG is obtained from Equations (9) and (10). Higher orders of dispersion are obtained by fitting the group delay curve with a polynomial of order three or more, though a higher-order fit does not change the results substantially. Fitting the group delay curve with a third-order polynomial and subtracting the exact curve readily gives the GDR. The phase response of the CFBG is calculated as the integral of the group delay. Together with the reflection spectrum, the phase is used to simulate the stretching/recompression of a pulse with a grating-pair compressor, using the typical spectrum of our femtosecond laser (2.3 nm bandwidth, sech2 shape). The compressor grating angle and grating separation are optimized to give the shortest pulse with the highest Strehl ratio. This procedure for extracting the group delay, GDR, and simulating the pulse recompression is the same one used to process our experimental measurements.
As a first assessment, we compared the various orders of dispersion obtained from both the computed spectrum and the simulated measurement. For all CFBGs simulated in the previous section, those values were in agreement within 1%. Moreover, a similar agreement was obtained for GDR and pulse compression, as seen in Figure 1, where both are virtually indistinguishable. Thus, at first sight, it appears that the limited spatial resolution does not affect the results.
To further examine the issue, we introduced single spatial period ripples of 10 pm amplitude, with periods ranging from 0.5 mm to 30 mm. This resulted in periodic oscillations in the reflection/transmission spectrum, as well as in the group delay. The spectral period is directly related to the spatial period via the chirp of the grating, as different positions correspond to different reflected wavelengths. Thus, in our case, for a linear chirp of 0.19 nm/mm, spatial fluctuations with a 1 mm period will result in spectral oscillations with a 0.19 nm period. The GDR was calculated across the 3 dB bandwidth of the spectrum, as well as the recompressed pulse width and Strehl ratio for both the directly computed and the simulated measurement cases. For smaller periods, the amplitude of the GDR obtained from the computed spectrum can be very large and oscillates with the period, though this oscillation disappears for periods larger than about 3 mm. As seen in Figure 4, for short periods, the measurement indeed does not capture the full amplitude of the GDR. The ratio of the GDR of the simulated measurement to that of the computed spectrum only reaches 90% for a period of 6 mm. On the other hand, although the GDR can have amplitudes of 1000 fs peak to peak, they have little effect on the pulse duration and quality below that 6 mm threshold, and the Strehl ratio remains above 0.99. As the period increases, the group delay modulation creates satellite pulses that get stronger and closer to the central peak, as previously discussed in Ref. [9]. This was observed in our pulse compression simulations. It is only when those satellite pulses start to merge with the central pulse that the pulse duration and Strehl ratios degrade, which happens when the oscillations have a spectral period of the order of the pulse spectral bandwidth. In our case, for a 2.3 nm bandwidth, this is about 12 mm. Therefore, even though the birefringence limits the spatial resolution of the GDR measurement, it can still capture the most deleterious regime of GDR. It should also be noted that most effects responsible for fluctuations in the grating period occur on scales longer than that of the laser beam used to write the grating (with the usual scanning beam technique), which is about 1 mm.
4. Measurement
The measurement procedure is the following. The beat spectrum is obtained by first taking the reflection spectrum of the CFBG without the polarizer (POL) and polarization controller (PC) and storing it as a reference trace. Since the BBS is unpolarized, this is an average of the reflection spectra for both polarization axes. The OSA trace is then set as the difference between the measured trace and the reference trace (on a logarithmic scale). Then, the POL and PC are added to the circuit, which results in spectral oscillations (the beat spectrum), and the PC is adjusted for maximum contrast of the beat spectrum (typically more than 10 dB). An example of the beat spectrum is shown in Figure 5b, consisting of 57 peaks over a bandwidth of 15.4 nm.
The calculation of the group delay requires knowledge of the length of PM fiber between the fiber polarizer and the CFBG, which is easily measured to within 5 mm. Such error results in less than 1% uncertainty in the value of dispersion and does not affect the GDR, which is a relative measurement. The other unknown quantity is the birefringence, but this can also be experimentally measured with the following technique. As it can change from one fiber batch to another, it is better to measure it, if not for every device, at least for batches made with the same fiber spool. In order to obtain the value of , the far end of the CFBG pigtail is cleaved at a right angle (CE in Figure 3), so as to generate about 4% reflection, and the spectrum of the light reflected from it is measured over a range of wavelengths outside of the CFBG bandwidth (from 1045 nm to 1065 nm). That spectrum also shows oscillations due to the term in Equation (5), and the birefringence is obtained by measuring the frequency difference between two peaks (or its average over a number of peaks), that corresponds to an integer value of . We then obtain:
where is the round trip delay of the total pigtail of length , as shown in Figure 3. In practice, to obtain an even more accurate value, we used the same phase retrieval method as used for the beat spectrum and performed a quadratic fit, extrapolated to the device center wavelength. We found that for the particular device measured (Coherent PM980 fiber).
Figure 5 shows the reflection, transmission, beat spectrum and reconstructed group delay of an actual CFBG with a total length of 92 mm, and 1 dB bandwidth of 15.4 nm, written in a Coherent PM980 fiber. The broadband source was made in-house using the ASE of a Yb-doped fiber. The spectra were taken with a Yokogawa AQ6370D optical spectrum analyzer using the maximum resolution of 20 pm, thus giving over 10,000 data points over the entire bandwidth. The transmission spectrum shows a typical slant, introduced during fabrication to compensate for the loss of light to cladding modes at shorter wavelengths so that the reflection spectrum itself viewed from the long wavelength side is nearly flat.
The measured values of , and are, respectively, 27.9 ps2, −0.263 ps3, and 0.0064 ps4. To obtain the value of , a knowledge of the length and bandwidth of the CFBG is required. The effective length over given bandwidth limits (e.g., −1 dB) is obtained from the simulation of the grating response, knowing the design of the phase mask used to fabricate it (linear and quadratic chirp). Using this value, the difference between and was found to be about 1 × 10⁻⁵, which is not unexpected for photo-induced birefringence [27,28,29,30]. This difference in B was systematic for all tested CFBGs made in the same fiber and varied for CFBGs made in a different fiber (also with a different sign in one case). Such a difference does not appear in simulated gratings, where we assume and, therefore, cannot be attributed to any imprecision of the data processing algorithm itself. We conclude that it probably truly reflects the photo-induced birefringence from the grating writing process.
Values of the various orders of dispersion were found to be generally the same for all CFBGs fabricated with a given phase mask and match very well with the value expected from the CFBG design, to within 1%. Only the GDR varies due to various small fabrication imperfections from device to device. In the absence of another instrument using the more standard group delay measurement technique, we could not better quantify the absolute error in our own measurement, but the very good fit with the design prediction indicates a precision better than 1%. More important is the the performance of the complete CPA system, including the CFBG stretcher, laser amplifier, and grating pair compressor. In order to match a given grating compressor to a given CFBG in a CPA laser, both the grating separation and grating angle of the compressor are normally experimentally optimized to give the shortest compressed amplified pulse and a 1% adjustment of the compressor dispersion only requires a fine adjustment of those parameters. In practice, there is generally more uncertainty in the residual chirp of the amplified laser pulse before recompression than in the CFBG dispersion itself.
Figure 6 (top graph) shows the GDR of the measured CFBG. The standard deviation in this case is 161 fs. The transmission spectrum itself shows only small ripples, readily indicating a good device quality. Two consecutive measurements are shown, as well as the difference between them (bottom graph). Spectral features narrower than 0.1 nm and ripples less than 50 fs are clearly and reproducibly resolved. The difference between the two measurements does not exceed 100 fs (except for a very narrow spike), and its standard deviation is 29 fs. It must be noted, however, that good care must be taken not to disturb the fiber in any way during the measurement process. Any bend or pressure on the fiber leading to the CFBG, which introduces coupling between the orthogonally polarized modes, is likely to result in an erroneous measurement. Narrow spikes in the reflection spectrum can also introduce some error since the spectrum is assumed to be flat, but those are also indicative of a defective device anyway. Although an accurate estimation of resolution would require more extensive statistical measurements, it appears to be at least as good as 50 fs, as features that small are clearly resolved. This is on par with much more expensive commercial instruments.
The recompressed pulse duration for the CFBG of Figure 5 was predicted to be 499 fs when using the reconstructed noisy phase and reflection spectrum in conjunction with an optimized grating compressor. The device was tested with our in-house (Ultron Photonics) femtosecond CPA laser operating at 50 kHz in conjunction with a grating compressor (1600 lines/mm). The laser spectrum after stretching by the CFBG and multiple amplification stages had the 2.3 nm bandwidth and sech2 shape used in our simulations. The measured recompressed pulse after optimizing the compressor had an autocorrelation width of 700 fs, corresponding to a 500 fs sech2 pulse, which is in agreement with the prediction.
5. Discussion and Conclusions
We have presented a simple measurement method of the group delay and group delay ripples of CFBG used as stretchers in the CPA laser system, together with an analysis of the degradation of the performance due to noise in their chirp profile. The great advantage of our method is that a quick and complete characterization of the CFBG, including reflection, transmission, and dispersion, can be completed simultaneously with a simple measurement setup. Apart from a polarizer and polarization controller, no additional equipment is required. Furthermore, a reconstruction of the phase of the CFBG allows a simulation of the pulse recompression for each individual device.
Our analysis shows that fluctuations in the period of the CFBG are the main source of group delay ripples and that ripples with spectral periods of the order of the laser bandwidth are the most deleterious. The spectral resolution of the GDR using our measurement method is limited by the birefringence of the PM fiber but is more than enough to capture those longer period GDR. We found that the recompressed pulse duration and quality degrade for GDR by more than about one-half of the pulse duration. For sub-ps pulses, this means that a GDR resolution much better than the pulse duration is required. Our measurements show that we can attain a resolution better than 50 fs.
Although the results presented here were obtained with a CFBG written in a PM fiber, the method can also be used in a non-PM fiber, as was shown in [24]. In such a case, the value of B is much smaller, typically less than , and the entire spectrum of the CFBG will typically only show a fraction of one cycle. In [24], the polarization was adjusted so that the reflection was at a minimum at the short wavelength edge of the CFBG spectrum. The value of the normalized reflection could then readily give an accurate value of the phase over the entire spectrum. In such cases, the measurement is no longer limited by the fiber birefringence but by the instrument’s spectral resolution.
In conclusion, the proposed method has been demonstrated to provide a quick, simple and accurate measurement of the GVD parameters of CFBGs written in PM fiber, and the level of group delay ripple is useful for assessing their performance as pulse-stretchers in CPA laser systems.
Author Contributions
F.O. performed the theoretical analysis and wrote the software for data analysis. H.W. performed experimental measurements. All authors have read and agreed to the published version of the manuscript.
Funding
This research was supported by Ultron Photonics and received no other external funding.
Data Availability Statement
Data can be provided upon request.
Conflicts of Interest
The authors declare no conflicts of interest.
Abbreviations
The following abbreviations are used in this manuscript:
| BBS | Broad Band Source |
| BER | Bit Error Rate |
| CFBG | Chirped Fiber Bragg Grating |
| CPA | Chirped Pulse Amplification |
| GDR | Group Delay Ripple |
| GVD | Group Velocity Dispersion |
| OSA | Optical Spectrum Analyzer |
| PC | Polarization Controller |
| PM | Polarization Maintaining |
References
- Ouellette, F. Dispersion cancellation using linearly chirped Bragg grating filters in optical waveguides. Opt. Lett. 1987, 12, 847–849. [Google Scholar] [CrossRef] [PubMed]
- Galvanauskas, A.; Fermann, M.E.; Harter, D.; Sugden, K.; Bennion, I. All fiber femtosecond pulse amplification circuit using chirped Bragg gratings. Appl. Phys. Lett. 1995, 66, 1053–1055. [Google Scholar] [CrossRef]
- Imeshev, G.; Hartl, I.; Fermann, M.E. Chirped pulse amplification with a nonlinearly chirped fiber Bragg grating matched to the Treacy compressor. Opt. Lett. 2004, 29, 679–681. [Google Scholar] [CrossRef] [PubMed]
- Želudevičius, J.; Danilevičius, R.; Regelskis, K. Optimization of pulse compression in a fiber chirped pulse amplification system by adjusting dispersion parameters of a temperature-tuned chirped fiber Bragg grating stretcher. J. Opt. Soc. Am. B 2015, 32, 812–817. [Google Scholar] [CrossRef]
- Wang, M.X.; Li, P.X.; Xu, Y.T.; Zhu, Y.C.; Li, S.; Yao, C.F. An All-Fiberized Chirped Pulse Amplification System Based on Chirped Fiber Bragg Grating Stretcher and Compressor. Chin. Phys. Lett. 2022, 39, 024201. [Google Scholar] [CrossRef]
- Lampen, J.; Tani, F.; Li, P.; Lee, K.F.; Jiang, J.; St. J Russell, P.; Fermann, M.E. Compact Yb fiber few-cycle pulse source based on precision pulse compression and shaping with an adaptive fiber Bragg grating. Opt. Express 2023, 31, 8393–8399. [Google Scholar] [CrossRef] [PubMed]
- Dyer, S.D.; Rochford, K.B.; Rose, A.H. Fast and accurate low-coherence interferometric measurements of fiber Bragg grating dispersion and reflectance. Opt. Express 1999, 5, 262–266. [Google Scholar] [CrossRef]
- Fortenberry, R.; Sorin, W.; Hernday, P. Improvement of group delay measurement accuracy using a two-frequency modulation phase-shift method. IEEE Photonics Technol. Lett. 2003, 15, 736–738. [Google Scholar] [CrossRef]
- Littler, I.C.M.; Fu, L.; Eggleton, B.J. Effect of group delay ripple on picosecond pulse compression schemes. Appl. Opt. 2005, 44, 4702–4711. [Google Scholar] [CrossRef]
- Ahn, T.J.; Park, Y.; Azaña, J. Fast and accurate group delay ripple measurement technique for ultralong chirped fiber Bragg gratings. Opt. Lett. 2007, 32, 2674–2676. [Google Scholar] [CrossRef]
- Santos, M.C.; De Bernardo-Rodi, S.P.; Mitre-Gutierrez, M.A. New Modulation Zero-Shift Method to Characterize Fast Group Delay Ripple of Dispersion-Compensating Fiber Bragg Gratings. IEEE Photonics Technol. Lett. 2007, 19, 1298–1300. [Google Scholar] [CrossRef]
- Ouellette, F. The Effect of Profile Noise on the Spectral Response of Fiber Gratings. In Bragg Gratings, Photosensitivity, and Poling in Glass Fibers and Waveguides: Applications and Fundamentals; Optica Publishing Group: Washington, DC, USA, 1997; p. BMG.13. [Google Scholar] [CrossRef]
- Ennser, K.; Ibsen, M.; Durkin, M.; Zervas, M.; Laming, R. Influence of nonideal chirped fiber grating characteristics on dispersion cancellation. IEEE Photonics Technol. Lett. 1998, 10, 1476–1478. [Google Scholar] [CrossRef]
- Feced, R.; Zervas, M. Effects of random phase and amplitude errors in optical fiber Bragg gratings. J. Light. Technol. 2000, 18, 90–101. [Google Scholar] [CrossRef]
- Jamal, S.; Cartledge, J.C. Variation in the Performance of Multispan 10-Gb/s Systems Due to the Group Delay Ripple of Dispersion Compensating Fiber Bragg Gratings. J. Lightwave Technol. 2002, 20, 28. [Google Scholar] [CrossRef]
- Niemi, T.; Uusimaa, M.; Ludvigsen, H. Limitations of phase-shift method in measuring dense group delay ripple of fiber Bragg gratings. IEEE Photonics Technol. Lett. 2001, 13, 1334–1336. [Google Scholar] [CrossRef]
- Sumetsky, M.; Eggleton, B.J.; de Sterke, C.M. Theory of group delay ripple generated by chirped fiber gratings. Opt. Express 2002, 10, 332–340. [Google Scholar] [CrossRef] [PubMed]
- Lachance, R.L.; Morin, M.; Painchaud, Y. Group delay ripple in fibre Bragg grating tunable dispersion compensators. Electron. Lett. 2002, 38, 1505–1507. [Google Scholar] [CrossRef]
- Yan, L.S.; Luo, T.; Yu, Q.; Xie, Y.; Feng, K.M.; Khosravani, R.; Willner, A. Investigation of performance variations due to the amplitude of group-delay ripple in chirped fiber Bragg gratings. Opt. Fiber Technol. 2006, 12, 238–242. [Google Scholar] [CrossRef]
- Litchinitser, N.; Li, Y.; Sumetsky, M.; Westbrook, P.; Eggleton, B. Tunable Dispersion Compensation Devices: Group Delay Ripple and System Performance. In Proceedings of the Optical Fiber Communication Conference, Atlanta, GA, USA, 23–28 March; Optica Publishing Group: Washington, DC, USA, 2003; p. TuD2. [Google Scholar]
- Eiselt, M.; Clausen, C.; Tkach, R. Performance characterization of components with group delay fluctuations. IEEE Photonics Technol. Lett. 2003, 15, 1076–1078. [Google Scholar] [CrossRef]
- Komukai, T.; Inui, T.; Nakazawa, M. Origin of group delay ripple in chirped fiber Bragg gratings and its effective reduction method. Electron. Commun. Jpn. Part II Electron. 2003, 86, 76–84. [Google Scholar] [CrossRef]
- Ouellette, F.; Yao, F.; Wang, J.; Li, J. A Simple Method to Measure the Group Delay of Chirped Fiber Gratings in Polarization-Maintaining Fiber. In Proceedings of the Optica Advanced Photonics Congress 2022, Maastricht, The Netherlands, 24–28 July 2022; Optica Publishing Group: Washington, DC, USA, 2022; p. BTh3A.3. [Google Scholar] [CrossRef]
- Ouellette, F.; Stepanov, D. A new technique for measuring the group delay of chirped fiber Bragg gratings. In Proceedings of the Optical Fiber Communication Conference, Dallas, TX, USA, 16–21 February 1997; pp. 153–154. [Google Scholar] [CrossRef]
- Ryu, S.; Horiuchi, Y.; Mochizuki, K. Novel chromatic dispersion measurement method over continuous Gigahertz tuning range. J. Light. Technol. 1989, 7, 1177–1180. [Google Scholar] [CrossRef]
- Gifford, D.K.; Soller, B.J.; Wolfe, M.S.; Froggatt, M.E. Optical vector network analyzer for single-scan measurements of loss, group delay, and polarization mode dispersion. Appl. Opt. 2005, 44, 7282–7286. [Google Scholar] [CrossRef] [PubMed]
- Meyer, T.; Nicati, P.A.; Robert, P.A.; Varelas, D.; Limberger, H.G.; Salathé, R. Birefringence writing and erasing in ultra-low-birefringence fibers by polarized ultraviolet side-exposure: Origin and applications. Opt. Rev. 1997, 4, A53. [Google Scholar] [CrossRef]
- Canning, J.; Deyerl, H.J.; Sørensen, H.R.; Kristensen, M. Ultraviolet-induced birefringence in hydrogen-loaded optical fiber. J. Appl. Phys. 2005, 97, 053104. [Google Scholar] [CrossRef]
- Jiang, L.; Zha, D.; Li, L.; Yuan, S.; Dong, X. A Novel Method for Measuring Photo-Induced Birefringence of Photosensitive Fibers. Acta Opt. Sin. 2003, 23, 53–54. [Google Scholar]
- Lu, P.; Mihailov, S.J.; Grobnic, D.; Walker, R.B. Comparison of the Induced Birefringence in Fiber Bragg Gratings Fabricated with Ultrafast-IR and CW-UV Lasers. In Proceedings of the 2006 European Conference on Optical Communications, Cannes, France, 24–28 September 2006; pp. 1–2. [Google Scholar] [CrossRef]
Figure 1.
Simulation of CFBGs with various amounts of period noise: (a) transmission spectrum; (b) group delay ripples; (c) recompressed pulse for 0, 7.9 pm, and 16.4 pm period fluctuation (from top to bottom). The GDR, recompressed pulse duration and Strehl ratios are indicated on each graph. Blue and red curves are for numerically computed and simulated measurements, respectively.

Figure 2.
Simulation of 114 CFBGs: (a) GDR vs. period noise; (b) pulse duration vs. GDR; (c) Strehl ratio vs. GDR. The shadowed areas indicate the acceptable GDR limit for 510 fs duration and 0.95 Strehl ratio.
Figure 2.
Simulation of 114 CFBGs: (a) GDR vs. period noise; (b) pulse duration vs. GDR; (c) Strehl ratio vs. GDR. The shadowed areas indicate the acceptable GDR limit for 510 fs duration and 0.95 Strehl ratio.

Figure 3.
Measurement setup. BBS: broadband source: POL: polarizer; PC: polarization controller; CFBG: chirped fiber Bragg grating; : fiber length between the PC and CFBG; OSA: optical spectrum analyzer; : total pigtail length; CE: cleaved end.
Figure 3.
Measurement setup. BBS: broadband source: POL: polarizer; PC: polarization controller; CFBG: chirped fiber Bragg grating; : fiber length between the PC and CFBG; OSA: optical spectrum analyzer; : total pigtail length; CE: cleaved end.

Figure 4.
(a) GDR vs. ripple period for the computed and simulated measurement cases; (b) ratio of GDR obtained from the simulated measurement to that obtained from the computed spectrum, along with the Strehl ratio vs. the ripple period; (c) pulse duration vs. ripple period.
Figure 4.
(a) GDR vs. ripple period for the computed and simulated measurement cases; (b) ratio of GDR obtained from the simulated measurement to that obtained from the computed spectrum, along with the Strehl ratio vs. the ripple period; (c) pulse duration vs. ripple period.

Figure 5.
(a) Reflection and transmission of the measured CFBG; (b) beat spectrum; (c) reconstructed group delay.
Figure 5.
(a) Reflection and transmission of the measured CFBG; (b) beat spectrum; (c) reconstructed group delay.

Figure 6.
Group delay ripples for two successive measurements (red and blue curves) of the CFBG of Figure 5 (upper curve), and the difference between the two (lower curve). The indicated GDR value of 161 fs was the same for both measurements.
Figure 6.
Group delay ripples for two successive measurements (red and blue curves) of the CFBG of Figure 5 (upper curve), and the difference between the two (lower curve). The indicated GDR value of 161 fs was the same for both measurements.

Disclaimer/Publisher’s Note: The statements, opinions and data contained in all publications are solely those of the individual author(s) and contributor(s) and not of MDPI and/or the editor(s). MDPI and/or the editor(s) disclaim responsibility for any injury to people or property resulting from any ideas, methods, instructions or products referred to in the content. |
© 2024 by the authors. Licensee MDPI, Basel, Switzerland. This article is an open access article distributed under the terms and conditions of the Creative Commons Attribution (CC BY) license (https://creativecommons.org/licenses/by/4.0/).
Share and Cite
MDPI and ACS Style
Ouellette, F.; Wang, H. Measurement of Group Delay Ripples of Chirped Fiber Bragg Gratings for CPA Lasers, and Their Effect on Performance. Photonics 2024, 11, 333. https://doi.org/10.3390/photonics11040333
AMA Style
Ouellette F, Wang H. Measurement of Group Delay Ripples of Chirped Fiber Bragg Gratings for CPA Lasers, and Their Effect on Performance. Photonics. 2024; 11(4):333. https://doi.org/10.3390/photonics11040333
Chicago/Turabian StyleOuellette, François, and Hui Wang. 2024. "Measurement of Group Delay Ripples of Chirped Fiber Bragg Gratings for CPA Lasers, and Their Effect on Performance" Photonics 11, no. 4: 333. https://doi.org/10.3390/photonics11040333
Note that from the first issue of 2016, this journal uses article numbers instead of page numbers. See further details here.