All-Solid-State Post-Compression of Low-Energy Pulses at High Repetition Rate


Laser Research Center, Vilnius University, Saulėtekio Avenue 10, LT-10223 Vilnius, Lithuania
*
Author to whom correspondence should be addressed.
Photonics 2024, 11(4), 386; https://doi.org/10.3390/photonics11040386
Submission received: 22 March 2024
/
Revised: 17 April 2024
/
Accepted: 18 April 2024
/
Published: 19 April 2024
(This article belongs to the Special Issue Advances in Ultrafast Laser Science and Applications)
Abstract
:We demonstrate a proof of principle of a simple all-solid-state post-compression setup for low-energy, high-repetition-rate laser pulses, where spectral broadening was performed using a combination of highly nonlinear bulk materials in a simple single-pass geometry. The 75 fs, 210 nJ pulses from an amplified 76 MHz, 15.7 W Yb:KGW oscillator after sequential spectral broadening in ZnS and YAG samples of 2 mm and 15 mm thickness, respectively, were compressed to 37 fs by means of Gires–Tournois interferometric mirrors. The post-compressed pulses with an average power of 11.47 W demonstrated reasonable spatial-spectral homogeneity of the beam with the spectral overlap parameter and good beam quality with and .
1. Introduction
Extracavity compression, or post-compression, of laser pulses that relies on increasing the spectral bandwidth via self-phase modulation (SPM) in a nonlinear bulk medium and subsequent removal of the frequency modulation by using an appropriate dispersive delay line constitutes a simple and very efficient method for the generation of ultrashort pulses whose spectral bandwidths extend well beyond the gain bandwidths supported by the driving laser sources [1,2]. Among various pulse compression methods developed so far, pulse compression based on SPM-induced spectral broadening in bulk solid-state materials offers the advantages of technical simplicity, low cost and easy implementation to virtually any existing ultrashort pulse laser system [3].
At present, the all-solid-state pulse post-compression technique is widely attracting a renewed practical interest, and to date, has been demonstrated in a variety of setups, unveiling the potential of scalability to very high peak [4,5] and average [6,7,8] powers, as well as achieving huge compression factors [9]. In particular, all-solid-state pulse post-compression has emerged as a very attractive and useful technique to compress the relatively long femtosecond and sub-picosecond pulses delivered by various rapidly developing high-average-power Yb laser sources. Second-order cascading in materials with second-order nonlinearity [10,11], multi-plate [12,13,14] and multi-pass [6,15,16] techniques, as well as multistage [17] and hybrid [18,19] approaches, were recently developed to achieve large compression factors and provide few-optical-cycle pulses. In contrast to conventional single- or few-pass schemes, multi-plate and multi-pass geometries ensure excellent beam quality and uniform spectral distribution across the beam thanks to sequential spectral broadening and careful management of unwanted spatial nonlinear effects, i.e., the onset of self-focusing of the beam and spatial spectrum variations.
These techniques are perfectly suited to compressing the ultrashort pulses from Yb thin-disc oscillators and pulses from amplified Yb laser systems, with energies from several microjoules to several millijoules; see, e.g., [20]. Typically, the SPM-induced spectral broadening of pulses with an energy of several hundreds of nanojoules is usually performed in highly nonlinear fibers [21,22,23]. More recently, spectral broadening and soliton compression of low-energy pulses in materials featuring a second-order nonlinearity was demonstrated as an interesting and feasible alternative [24,25]. However, spectral broadening of such pulses in bulk solid-state materials with pure cubic nonlinearity has received only little attention so far [26]. To this end, high-repetition-rate, low-threshold filamentation and supercontinuum generation was recently demonstrated in narrow-bandgap dielectric materials, such as undoped KGW and YVO4 crystals, owing to their relatively large nonlinear indexes of refraction [27,28]. These findings suggest that bulk solid-state materials that exhibit similar nonlinear properties could be readily employed for SPM-induced spectral broadening and post-compression of low-energy laser pulses, and may operate at very high laser repetition rates.
In this study, we demonstrated a proof of principle of a simple all-solid-state post-compression setup for low-energy (210 nJ), high-repetition-rate (76 MHz) pulses from an amplified Yb:KGW oscillator that was based on sequential spectral broadening in highly nonlinear materials (ZnS, YAG and KGW) and the compression of spectrally broadened pulses using Gires–Tournois interferometric (GTI) mirrors.
2. Materials and Methods
The laser source we used was a commercial 4.3 W average power, 76 MHz repetition rate Yb:KGW oscillator (FLINT, Light Conversion) that provided 90 fs pulses with a central wavelength of 1036 nm. The oscillator pulses were amplified in a home-built pre-chirp-managed (PCMA) rod-type single-pass fiber amplifier, which, after GTI mirror compression, delivered 210 nJ, 75 fs pulses with an average power of 15.7 W and a peak power of 2.5 MW [29]. The long-term output power stability of the entire laser system was 0.53% rms, as measured over 24 h of operation. The experimental setup is depicted in Figure 1. The SPM-induced spectral broadening was performed in a two-stage arrangement that combined sequential propagation of several highly nonlinear materials: ZnS (uncoated, 2 mm thick, cm2/W [30]), KGW (uncoated, 6 mm thick, cm2/W [31]) and YAG (uncoated, 15 mm thick, cm2/W [32]).
In the first stage, the laser beam with a diameter of 1.6 mm (at the intensity level) was focused using the anti-reflection (AR)-coated lens L1 with a focal length of mm onto a 2 mm thick ZnS crystal. The crystal was tilted at a angle with respect to the beam incidence in a compromise of minimizing the reflection losses (the calculated Brewster’s angle was ), and at the same time, keeping the ellipticity of the beam, and thus, the peak intensity at an acceptable level to induce spectral broadening of the pulse [33,34].
In the second stage, the beam was focused with an AR-coated lens L2 ( mm) onto the second nonlinear crystal (2 mm thick ZnS, 6 mm thick KGW or 15 mm thick YAG). Here, ZnS crystal was tilted at the same angle with respect to the beam incidence, while the KGW and YAG crystals were placed at normal incidence due to their small transverse dimensions ( mm2). The position of the lens L2 was found experimentally to achieve the desired dimensions of the beam waist and achieve the SPM-induced spectral broadening in a diverging beam, locating the samples ∼5 mm behind the geometrical focus of the lens. Thereafter, AR-coated lens L3 ( mm) was used to collimate the output beam after the second stage of spectral broadening.
The spectrally broadened pulse was directed to the compression stage, which consisted of a pair of GTI mirrors (with 99.5% reflectivity per bounce), with a group delay dispersion (GDD) of fs2 at a wavelength of 1038 nm (see [29] for the full spectral characteristics of GTI mirrors). A set of AR-coated fused silica slabs of different thicknesses was used for the fine matching of the dispersion compensation.
A small part of the radiation, which was reflected from the 20% beam splitter BS and fused silica wedges W1 and W2, was sent for diagnostics. The beam profile measurements were performed using a -pixel resolution CCD camera (Spiricon SP620U, Ophir Optronics). The spectral measurements were performed with a portable spectrometer (AvaSpec-ULS2048CL-EVO, Avantes), which, for the characterization of the spatial-spectral structure of the beam, was mounted on a motorized translation stage. The temporal characterization of the compressed pulses was performed with the homemade second harmonic generation frequency-resolved optical gating (SHG-FROG) setup, which used a m thick BBO crystal. The FROG traces were retrieved using a standard FROG pulse retrieval algorithm. The power measurements were performed with a thermal power sensor (F80(120)A-CM-17, Ophir Optronics, not shown in Figure 1).
3. Results
The sequential spectral broadening investigated in the present study reminds us to some extent of a minimized and simplified version of multi-plate compression. Figure 2a shows the temporal and spatial characteristics of the pulse after propagation through the first 2 mm thick ZnS crystal. The optimal position of the crystal was found at the geometrical focus of the lens without incurring apparent distortion of the beam shape; see Figure 2a,b, which illustrate the measured profiles of the input and output beams, respectively. Figure 2c,d show the results of the SHG-FROG measurements by presenting the measured and reconstructed spectra and retrieved temporal profile of the pulse, respectively. The retrieved pulse width of 103 fs indicates temporal broadening of the pulse due to large group velocity dispersion of ZnS (385 fs2/mm), while its spectrum corresponded to the transform-limited (TL) duration of ∼50 fs. The measured average power of the output beam was 14.2 W, suggesting 90.5% transmission through the first stage of the spectral broadening.
Although only a relatively small spectral broadening was achieved (see Figure 3a, where it is shown by a black curve), the first stage of spectral broadening in the ZnS crystal had a threefold effect. First, the combined action of the SPM and large material dispersion allowed for regularizing the spectral phase of the pulse since the pulses after the PCMA carried a residual uncompensated (nonlinear) chirp. Second, free space propagation between the spectral broadening stages suppressed small-scale irregularities in the beam due to nonlinear spatial effects. Third, the transverse dimensions of the sample (20 × 20 mm2) allowed for tilting of the crystal close to the Brewster’s angle, thus minimizing the reflection losses. This was important for achieving sufficient intensity in the second stage of spectral broadening and, at the same time, avoiding using a very small diameter for the incident beam, bearing in mind that according to Marburger’s law, the beams with a smaller diameter self-focus and collapse at a shorter distance. In what follows, we fixed the above experimental settings for the first stage of spectral broadening.
In the second stage, the SPM-induced spectral broadening was performed in a diverging beam while locating the samples ∼5 mm behind the geometrical focus of the lens L2. Such a propagation geometry was chosen by taking advantage of the fact that diverging beams are more resistant to self-focusing, thus helping to decouple the nonlinear effects in space and time, or in other words, to achieve spectral broadening, and at the same time, to minimize nonlinear spatial effects. The sample position with respect to the focal plane of the lens was found experimentally by simultaneously monitoring the beam profile and spectrum. The spectra of the laser pulses after each stage of spectral broadening are presented in Figure 3a, while Figure 3b–d show the collimated beam profiles after passing the investigated combinations of nonlinear materials. The broadest pulse spectrum extending from 986 nm to 1100 nm (shown by blue curve) without any apparent distortion of the beam profile was measured using a combination of 2 mm thick ZnS crystal in the first (fixed) stage and 15 mm thick YAG crystal in the second stage (this configuration is further referred to as ZnS + YAG). Such a spectrum, potentially yielding 32 fs TL pulses, was produced within a smooth, distortion-free Gaussian beam profile, as shown in Figure 3b, attesting to no apparent onset of nonlinear spatial effects.
However, the two remaining configurations of nonlinear materials (ZnS + ZnS and ZnS + KGW) produced appreciable spectral broadenings only at the cost of deterioration of the output beam profile. More specifically, the spectrum extending from 990 nm to 1100 nm was measured after the ZnS + ZnS configuration, as shown by the magenta curve. Here, the second 2 mm thick ZnS crystal produced somewhat larger spectral broadening as a result of a smaller beam diameter (note that L2 has a shorter focal length), and thus, a larger input intensity. The zero-phase Fourier transform of such a spectrum yielded a 37 fs TL pulse duration. Although the spectral broadening was smaller compared with the ZnS + YAG case, the beam profile measurement shown in Figure 3c revealed an already distorted beam with a characteristic low-intensity ring, which is a clear signature of nonlinear spatial effects, i.e., self-focusing. The configuration of 2 mm thick ZnS and 6 mm thick KGW crystals (ZnS + KGW) led to similar observations: a slightly narrower spectrum that extended from 994 nm to 1088 nm (red curve) and corresponded to TL pulses of 39 fs and an output beam with even more pronounced ring structure, as illustrated in Figure 3d.
In what follows, we examined the compressibility of spectrally broadened pulses in ZnS + YAG and characterized the overall performance of this particular combination in more detail. The pulse compression was performed using three reflections from the GTI mirrors with an additional passage through the AR-coated 27 mm thick fused silica slab for the fine matching of the GDD. The compression results are presented in Figure 4. The measured SHG-FROG trace is shown in Figure 4a, while Figure 4b shows the reconstructed trace with a retrieval root-mean-square error of 0.13%. Figure 4c compares the measured and reconstructed spectra, showing an excellent agreement of spectral profiles over four orders of magnitude. The retrieved temporal profile of the compressed pulse is presented in Figure 4d, yielding pulse duration of 37 fs, which is close to the TL pulse duration of 32 fs, which was obtained by a zero-phase Fourier transform of the measured spectrum. The satellite post-pulses were likely due to a large GDD imposed by the GTI mirrors (close to the boundary of their specified operation range) and residual third-order dispersion. Nevertheless, we estimated that 85% of the pulse energy was contained in the main peak.
The measured average power at the output of the entire setup was 11.47 W, indicating an energy throughput of 73%. It is important to notice that the overall 27% energy losses were of solely linear character, as introduced by Fresnel reflections in the uncoated ZnS sample (9.5%) and uncoated YAG sample at normal incidence (16.5%), and 1.5% energy losses after three reflections from the GTI mirrors, suggesting the absence of any detectable nonlinear energy losses in the samples due to multiphoton absorption, ionization, etc. Assuming these energy losses, the estimated peak power of the post-compressed pulses was 3.26 MW. Finally, we note that the energy throughput of the overall post-compression setup could be improved significantly just by minimizing the reflection losses using AR-coated samples of nonlinear materials.
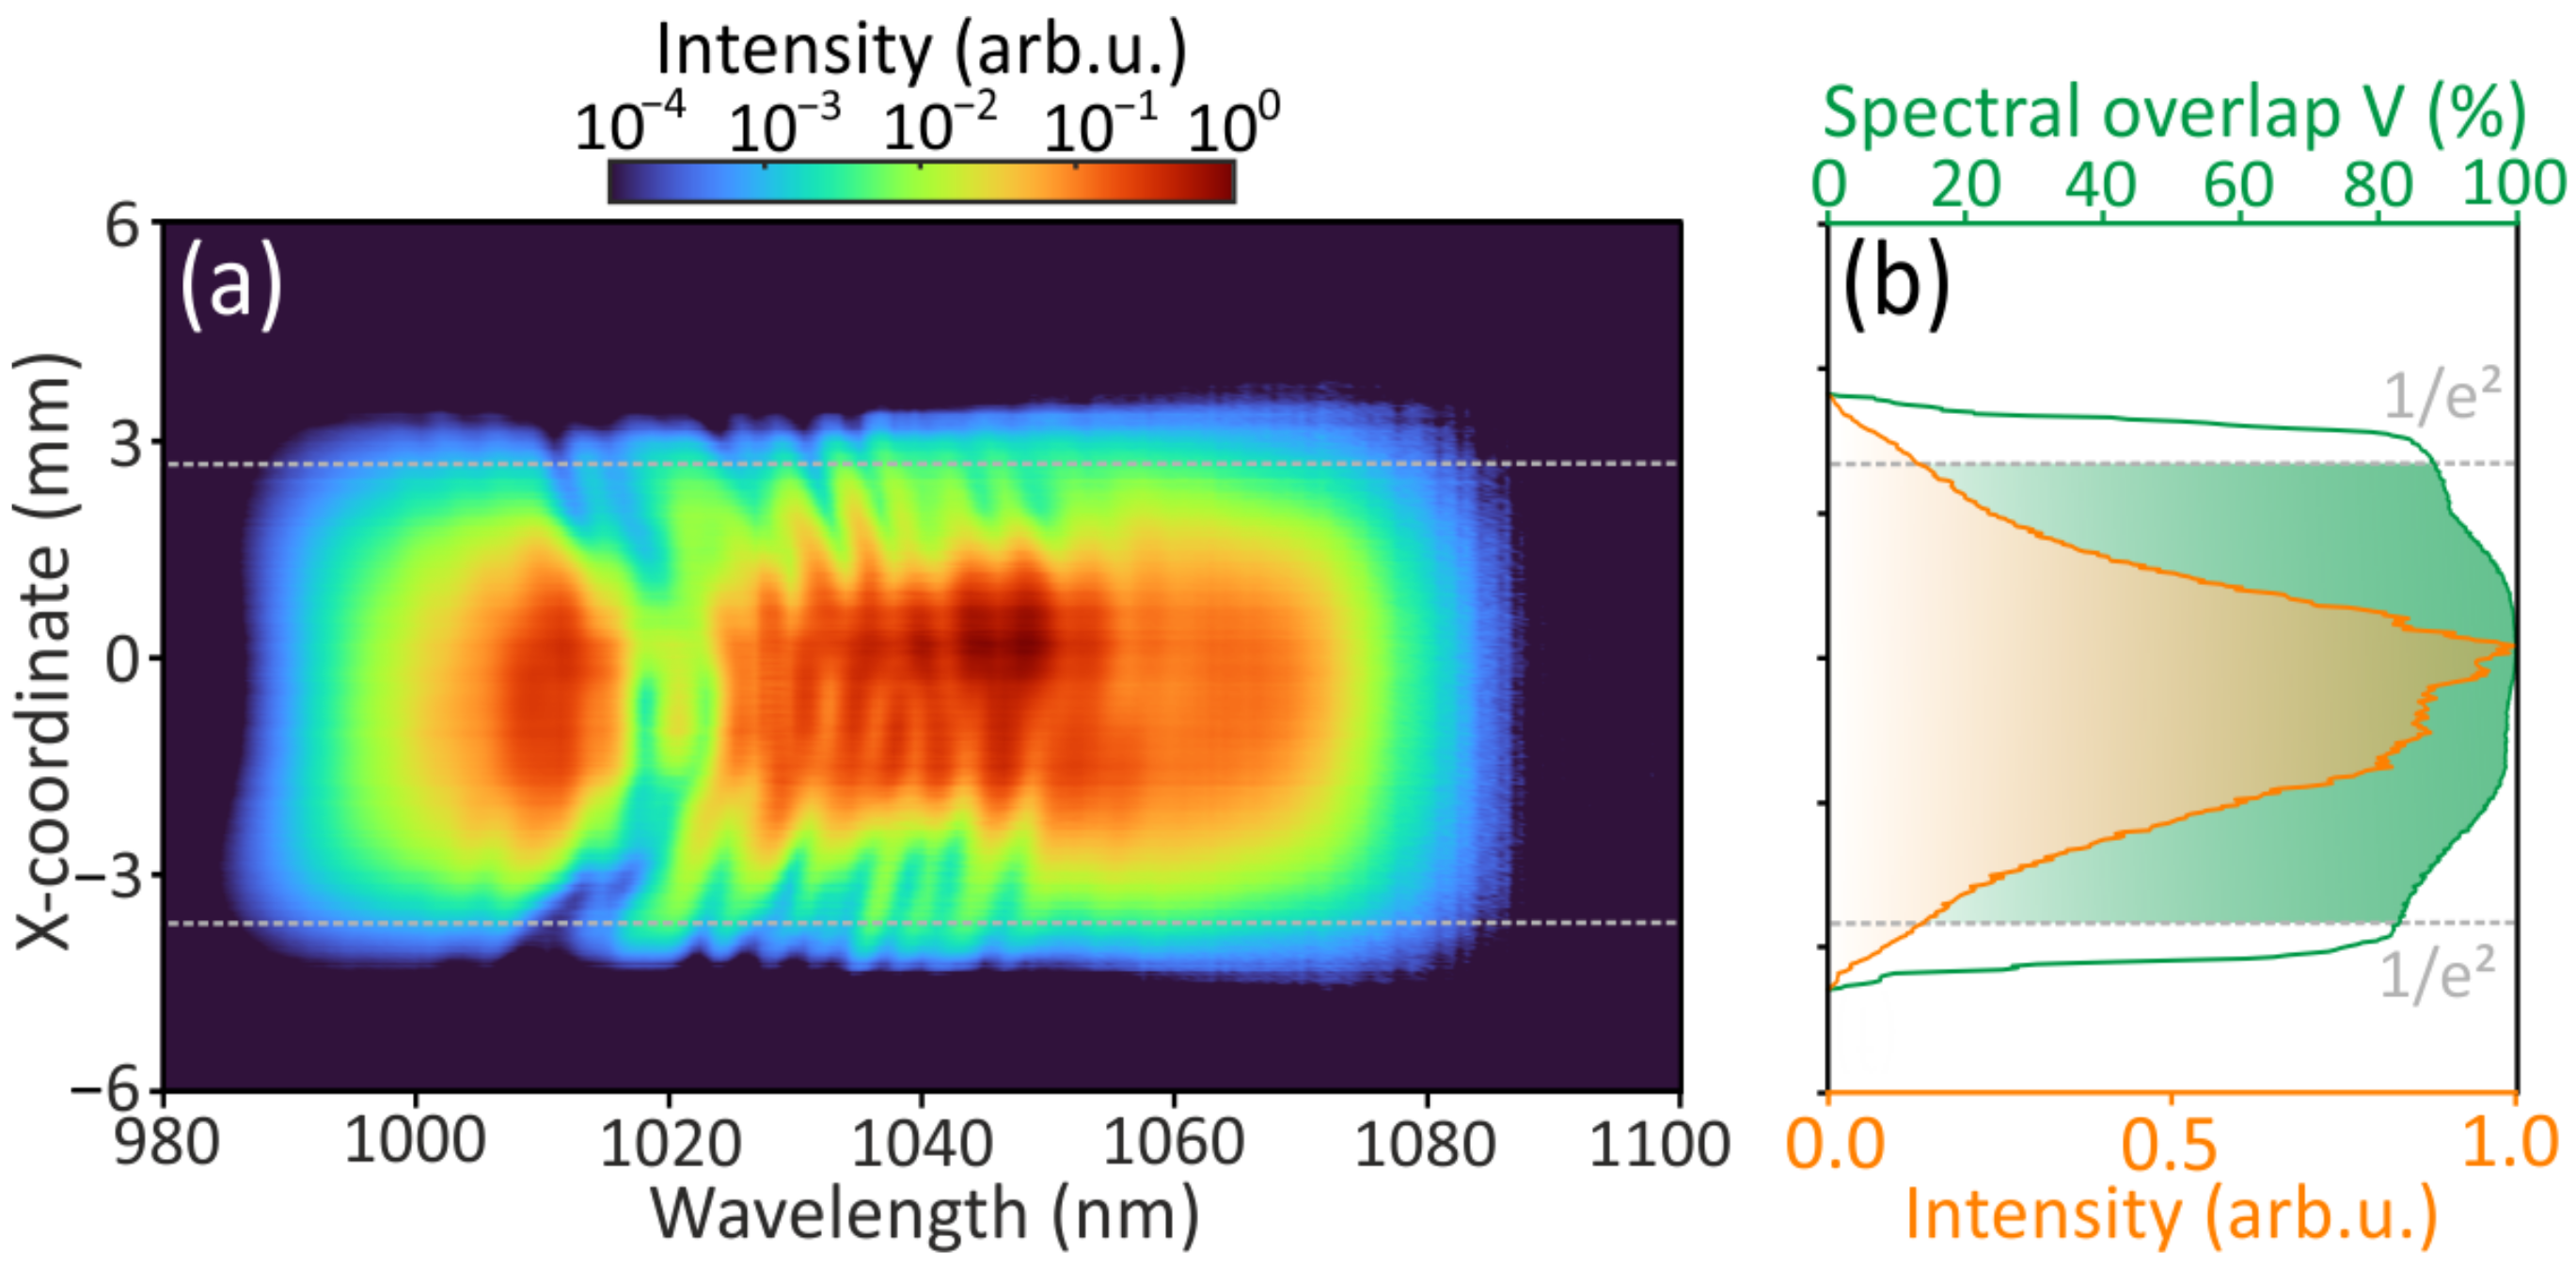
A more detailed characterization of the compressed pulses was carried out by evaluating the spatial-spectral homogeneity of the beam. This is an important characteristic since typically, SPM-induced spectral broadening in a simple single-pass geometry leads to an inhomogeneous distribution of spectral components across the beam profile, and therefore, to different compression factors at the beam center and periphery. The characterization of the spatial-spectral structure of the beam was performed by scanning the spectral content along the x-coordinate with a portable spectrometer mounted on a motorized translation stage. The measured spatial-spectral intensity map of the beam is depicted in Figure 5a, showing an almost constant spectral width across the beam profile, which justifies a homogeneous spectral distribution as a function of the coordinate. For a more precise evaluation, we calculated the spectral overlap parameter V, as defined in [7], which serves as a quantitative measure of spatial-spectral homogeneity of the beam. The result is depicted in Figure 5b, which shows the spectral overlap parameter across a major part of the beam, where dotted grey lines indicate the beam intensity level of . Here, the intensity distribution across the beam (orange curve) was obtained by integrating the spatial-spectral map along the wavelength axis. The estimated energy contained in the beam was was 88.4%, corresponding to 10.14 W of average power.
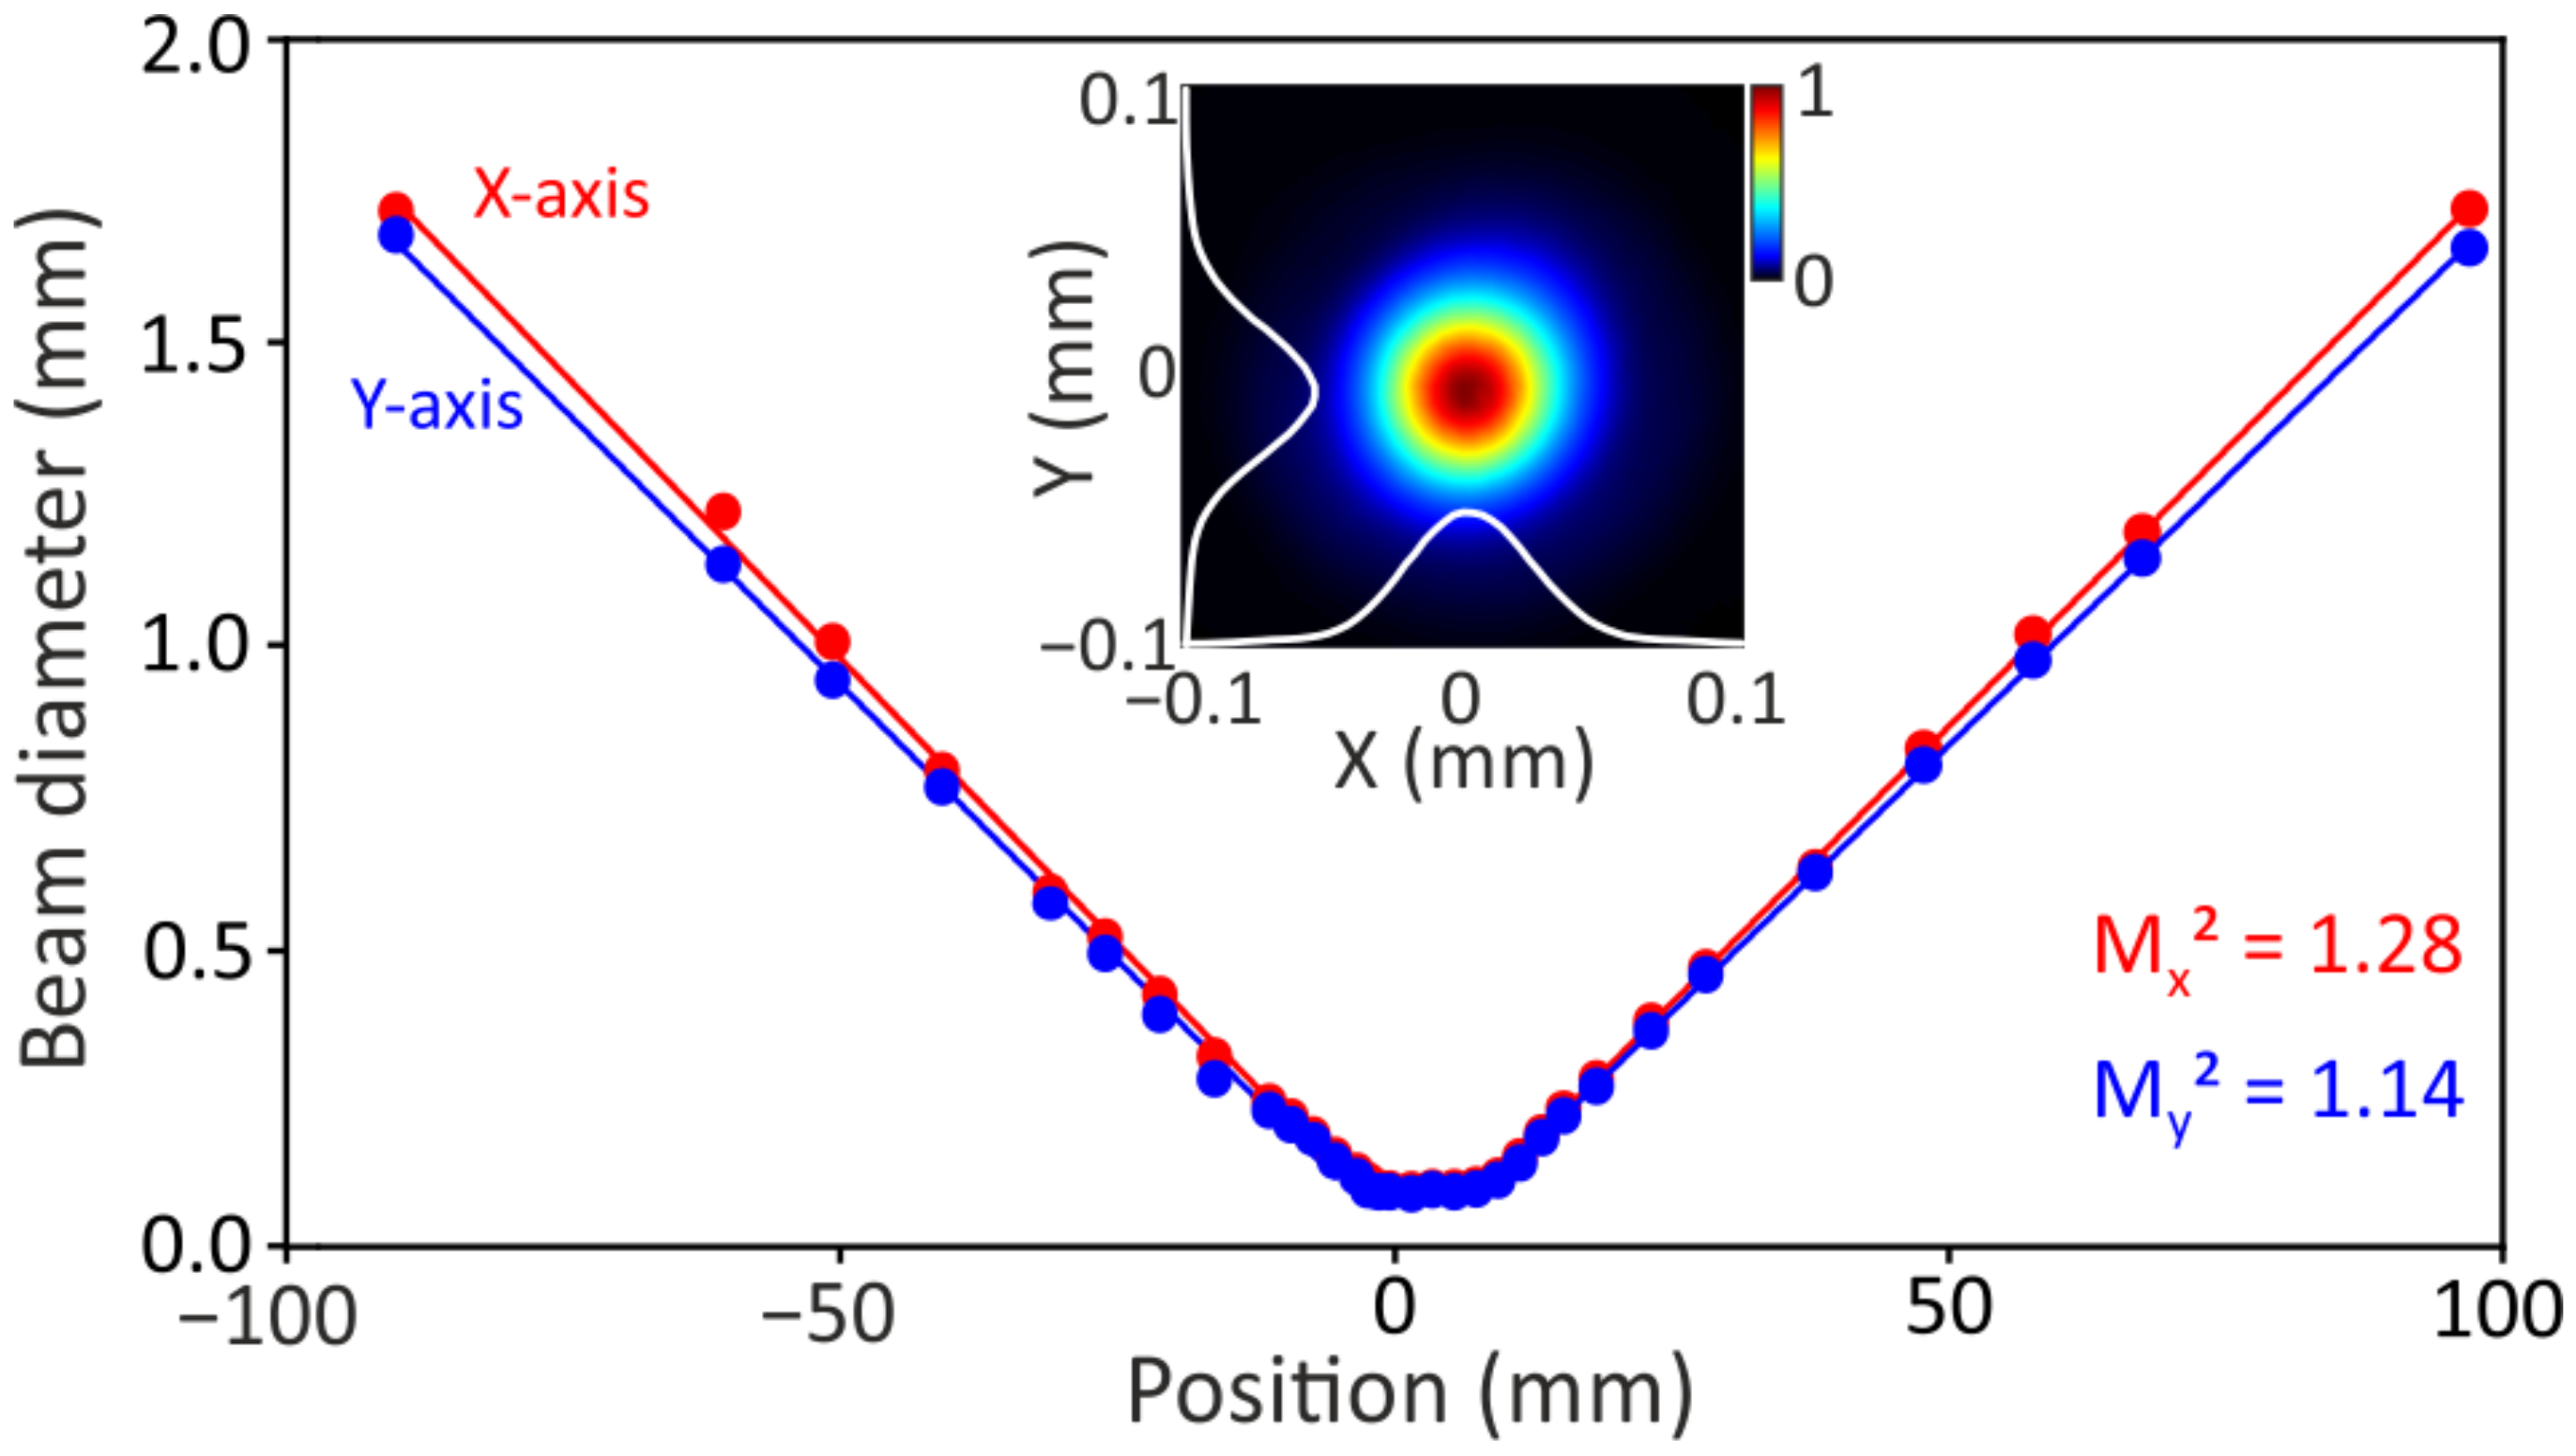
Finally, the spatial beam quality of the post-compressed pulses was investigated by the evaluation of beam propagation factor . In doing so, a focusing lens with mm was used to focus the collimated beam after the compressor. The beam profile was recorded using a high-resolution ( pixel) CMOS camera (SP932U, Ophir Optronics), which was translated along the focal zone. Figure 6 shows the results of the beam quality measurement in the x- and y-coordinates. The inset shows the beam profile recorded at the focal plane (beam waist), where superimposed curves show the central cross-sections along the x- and y-coordinates. The dimensions of the focal spot were m and m, as evaluated at the intensity level, and were close to the calculated spot diameter of an ideal (diffraction-limited) Gaussian beam (m), whereas a slight ellipticity originated from the incident amplified oscillator beam. The divergence angles of the beam in the x- and y-directions ( mrad and mrad) were evaluated from linear fits of the slopes in the far field. The computed and attested to the good spatial quality of the post-compressed pulses, which was only slightly worse than that of an amplified input beam with and [29]. For what concerns the relative intensity noise and beam-pointing fluctuations after the compression setup, these parameters were not measured at the time of manuscript revision.
4. Discussion
The performances of the ZnS + ZnS and ZnS + KGW configurations were characterized as well, although in somewhat less detail. Table 1 presents a brief summary and comparison of the relevant post-compression parameters achieved with the examined combinations of nonlinear materials. The ZnS + ZnS configuration yielded the highest energy throughput of 80% due to the minimized reflection losses, but on the other hand, resulted in the longest pulses after compression (47 fs), which was in part due to improper fine dispersion compensation and a non-uniform spatial profile, and thus, the lowest spatial-spectral homogeneity of the beam. Similar observations applied to the ZnS + KGW configuration, which also provided the lowest transmission due to the highest reflection losses from the uncoated KGW crystal at normal incidence.
These results may seem quite surprising since YAG crystal, despite having the lowest nonlinearity, produced the largest spectral broadening in the second stage, and the entire ZnS + YAG configuration showed the best performance in terms of the beam quality, spectral-spatial homogeneity and compressed pulse duration. In order to explain this fact, we first calculated the critical power for self-focusing, which is expressed as , where is the laser wavelength, and and are the linear and nonlinear refractive indexes. Taking the values of ZnS, KGW and YAG provided in the Section 2, and their linear refractive indexes of 2.29, 2.01 and 1.83, respectively, we obtained MW in ZnS, MW in KGW and MW in YAG. Next, we evaluated the peak power of the pulse entering the second stage of the spectral broadening while taking into account the measured pulse duration and transmission after the first stage of the spectral broadening (2 mm thick ZnS sample) and the reflection from the front face of the nonlinear material. In the case of YAG, the estimated peak power of the incident pulse was 1.69 MW, which is just very slightly above the critical power for self-focusing (). In contrast, similar calculations yielded the incident pulse peak powers of and entering the KGW and ZnS crystals, respectively, attesting that it was more difficult to avoid the onset of self-focusing in these crystals under the present experimental settings. The best result in YAG is in line with the numerical and experimental findings presented in [12], which demonstrated that the optimal condition for single-pass spectral broadening is when the peak power of the input pulse is only slightly above the critical power for self-focusing in a given material and showed that the focusing geometry in the single-pass scheme does not improve the efficiency of the approach. To this end, materials with high nonlinearity, such as KGW, may be suitable for single-pass spectral broadening of unamplified oscillator pulses (see, e.g., [28]) whose peak power is below the critical power for self-focusing in YAG. On the other hand, larger spectral broadening, as well as larger compression factors, could be achieved using multi-pass geometries [12] or exploiting self-defocusing nonlinearities due to second-order cascading via phase-mismatched second-harmonic generation in materials with nonlinearity [11], where the sign and magnitude of an effective nonlinear index of refraction could be suitably tuned by varying the phase mismatch between the interacting waves.
Finally, as the energy losses in the compression setup originated solely due to Fresnel reflections from uncoated nonlinear materials, the relatively low-energy throughput could be notably increased using anti-reflection coated samples. The temporal intensity contrast of the post-compressed pulses could be improved using chirped mirrors with tailored dispersion characteristics for precise dispersion compensation, and third-order dispersion in particular. These relatively simple improvements may lead to larger compression factors and remarkably lower energy losses of the entire setup.
5. Conclusions
We demonstrated a proof of principle of a simple all-solid-state post-compression setup for low-energy laser pulses. The spectral broadening of 75 fs, 210 nJ pulses from an amplified 76 MHz, 15.7 W Yb:KGW oscillator was performed using several combinations of highly nonlinear bulk materials, namely, ZnS, YAG and KGW, in a single-pass geometry. Among the tested configurations, the broadest spectrum without beam deterioration due to the onset of self-focusing was produced by sequential propagation in ZnS and YAG samples of 2 mm and 15 mm thickness, respectively. The spectrally broadened pulses were compressed to 37 fs by means of Gires–Tournois interferometric mirrors, which is close to the estimated Fourier transform limit (32 fs). The spatial-spectral characterization of post-compressed pulses with an average power of 11.47 W attested to the almost uniform spectral distribution across the beam (the spectral overlap parameter ) and good beam quality ().
Our results suggest that spectral broadening in highly nonlinear bulk materials could be a potentially attractive alternative to fiber-based spectral broadening, offering a virtually alignment-insensitive, low-complexity and low-cost all-solid-state arrangement for post-compression of low-energy pulses at very high laser pulse repetition rates.
Author Contributions
Conceptualization, A.D. and G.T.; methodology, V.M., J.B. and G.T.; resources, J.V.; validation, V.M. and J.B.; writing—original draft preparation, V.M. and J.B.; writing—review and editing, A.D.; funding acquisition, A.D. All authors read and agreed to the published version of the manuscript.
Funding
This work received funding from the Research Council of Lithuania (LMTLT), grant S-MIP-22-40.
Institutional Review Board Statement
Not applicable.
Informed Consent Statement
Not applicable.
Data Availability Statement
The original contributions presented in the study are included in the article; further inquiries can be directed to the corresponding author.
Conflicts of Interest
The authors declare no conflicts of interest.
References
- Rolland, C.; Corkum, P.B. Compression of high-power optical pulses. J. Opt. Soc. Am. B 1988, 5, 641–647. [Google Scholar] [CrossRef]
- Mével, E.; Tcherbakoff, O.; Salin, F.; Constant, E. Extracavity compression technique for high-energy femtosecond pulses. J. Opt. Soc. Am. B 2003, 20, 105–108. [Google Scholar] [CrossRef]
- Nagy, T.; Simon, P.; Veisz, L. High-energy few-cycle pulses: Postcompression techniques. Adv. Phys. X 2021, 6, 1845795. [Google Scholar]
- Kim, J.I.; Kim, Y.G.; Yang, J.M.; Yoon, J.W.; Sung, J.H.; Lee, S.K.; Nam, C.H. Sub-10 fs pulse generation by post-compression for peak-power enhancement of a 100-TW Ti:Sapphire laser. Opt. Express 2022, 30, 8734–8741. [Google Scholar] [CrossRef] [PubMed]
- Tóth, S.; Nagymihály, R.S.; Seres, I.; Lehotai, L.; Csontos, J.; Tóth, L.T.; Geetha, P.P.; Somoskoi, T.; Kajla, B.; Abt, D.; et al. Single thin-plate compression of multi-TW laser pulses to 3.9 fs. Opt. Lett. 2023, 48, 57–60. [Google Scholar] [CrossRef] [PubMed]
- Schulte, J.; Sartorius, T.; Weitenberg, J.; Vernaleken, A.; Russbueldt, P. Nonlinear pulse compression in a multi-pass cell. Opt. Lett. 2016, 41, 4511–4514. [Google Scholar] [CrossRef] [PubMed]
- Weitenberg, J.; Vernaleken, A.; Schulte, J.; Ozawa, A.; Sartorius, T.; Pervak, V.; Hoffmann, H.-D.; Udem, T.; Russbüldt, P.; Hänsch, T.W. Multi-pass-cell-based nonlinear pulse compression to 115 fs at 7.5 μJ pulse energy and 300 W average power. Opt. Express 2017, 25, 20502–20510. [Google Scholar] [CrossRef] [PubMed]
- Tsai, C.-L.; Meyer, F.; Omar, A.; Wang, Y.; Liang, A.-Y.; Lu, C.-H.; Hoffmann, M.; Yang, S.-D.; Saraceno, C.J. Efficient nonlinear compression of a mode-locked thin-disk oscillator to 27 fs at 98 W average power. Opt. Lett. 2019, 44, 4115–4118. [Google Scholar] [CrossRef] [PubMed]
- Viotti, A.-L.; Li, C.; Arisholm, G.; Winkelmann, L.; Hartl, I.; Heyl, C.M.; Seidel, M. Few-cycle pulse generation by double-stage hybrid multi-pass multi-plate nonlinear pulse compression. Opt. Lett. 2023, 48, 984–987. [Google Scholar] [CrossRef] [PubMed]
- Moses, J.; Wise, F.W. Soliton compression in quadratic media: High-energy few-cycle pulses with a frequency-doubling crystal. Opt. Lett. 2006, 31, 1881–1883. [Google Scholar] [CrossRef] [PubMed]
- Seidel, M.; Brons, J.; Arisholm, G.; Fritsch, K.; Pervak, V.; Pronin, O. Efficient high-power ultrashort pulse compression in self-defocusing bulk media. Sci. Rep. 2017, 7, 1410. [Google Scholar] [CrossRef]
- Seidel, M.; Arisholm, G.; Brons, J.; Pervak, V.; Pronin, O. All solid-state spectral broadening: An average and peak power scalable method for compression of ultrashort pulses. Opt. Express 2016, 24, 9412–9428. [Google Scholar] [CrossRef] [PubMed]
- Lu, C.-H.; Wu, W.-H.; Kuo, S.-H.; Guo, J.-Y.; Chen, M.-C.; Yang, S.-D.; Kung, A.H. Greater than 50 times compression of 1030 nm Yb:KGW laser pulses to single-cycle duration. Opt. Express 2019, 27, 15638–15648. [Google Scholar] [CrossRef] [PubMed]
- Seo, M.; Tsendsuren, K.; Mitra, S.; Kling, M.; Kim, D. High-contrast, intense single-cycle pulses from an all thin-solid-plate setup. Opt. Lett. 2020, 45, 367–370. [Google Scholar] [CrossRef]
- Hanna, M.; Guichard, F.; Daher, N.; Bournet, Q.; Délen, X.; Georges, P. Nonlinear optics in multipass cells. Laser Photon. Rev. 2021, 15, 2100220. [Google Scholar] [CrossRef]
- Viotti, A.-L.; Seidel, M.; Escoto, E.; Rajhans, S.; Leemans, W.P.; Hartl, I.; Heyl, C.M. Multi-pass cells for post-compression of ultrashort laser pulses. Optica 2022, 9, 197–216. [Google Scholar] [CrossRef]
- Fritsch, K.; Poetzlberger, M.; Pervak, V.; Brons, J.; Pronin, O. All-solid-state multipass spectral broadening to sub-20 fs. Opt. Lett. 2018, 43, 4643–4646. [Google Scholar] [CrossRef]
- Barbiero, G.; Wang, H.; Grassl, M.; Gröbmeyer, S.; Kimbaras, D.; Neuhaus, M.; Pervak, V.; Nubbemeyer, T.; Fattahi, H.; Kling, M.F. Efficient nonlinear compression of a thin-disk oscillator to 8.5 fs at 55 W average power. Opt. Lett. 2021, 46, 5304–5307. [Google Scholar] [CrossRef] [PubMed]
- Seidel, M.; Balla, P.; Li, C.; Arisholm, G.; Winkelmann, L.; Hartl, I.; Heyl, C.M. Factor 30 pulse compression by hybrid multipass multiplate spectral broadening. Ultrafast Sci. 2022, 2022, 9754919. [Google Scholar] [CrossRef]
- Carpeggiani, P.A.; Fan, G.; Tao, Z.; Coccia, G.; Zhang, S.; Fu, Z.; Chen, M.C.; Liu, S.C.; Kung, A.H.; Kaksis, E.; et al. Compact 6-mJ multi-plate pulse compression based on line focusing geometry. In Proceedings of the Laser Applications Conference, Vienna, Austria, 29 September–3 October 2019. Paper JTh3A.50. [Google Scholar]
- Pronin, O.; Seidel, M.; Lücking, F.; Brons, J.; Fedulova, E.; Trubetskov, M.; Pervak, V.; Apolonski, A.; Udem, T.; Krausz, F. High-power multi-megahertz source of waveform-stabilized few-cycle light. Nat. Commun. 2015, 6, 6998. [Google Scholar] [CrossRef] [PubMed]
- Nakamura, T.; Badarla, V.R.; Hashimoto, K.; Schunemann, P.G.; Ideguchi, T. Simple approach to broadband mid-infrared pulse generation with a mode-locked Yb-doped fiber laser. Opt. Lett. 2022, 47, 1790–1793. [Google Scholar] [CrossRef] [PubMed]
- Kang, D.; Otsu, T.; Tani, S.; Kobayashi, Y. Sub-10-fs pulse generation from 10 nJ Yb-fiber laser with cascaded nonlinear pulse compression. Opt. Express 2024, 32, 5214–5219. [Google Scholar] [CrossRef] [PubMed]
- Viotti, A.-L.; Hessmo, B.; Mikaelsson, S.; Guo, C.; Arnold, C.; L’Huillier, A.; Momgaudis, B.; Melninkaitis, A.; Laurell, F.; Pasiskevicius, V. Soliton self-compression and spectral broadening of 1 μm femtosecond pulses in single-domain KTiOPO4. In Proceedings of the Conference on Lasers and Electro-Optics Europe & European Quantum Electronics Conference, Munich, Germany, 23–27 June 2019. Paper cf-4-5. [Google Scholar]
- Krook, C.; Viotti, A.-L.; Hessmo, B.; Laurell, F.; Pasiskevicius, V. Self-compression in single-domain KTP at 1 micron in a normal dispersion regime. In Proceedings of the Conference on Lasers and Electrooptics, San Jose, CA, USA, 15–20 May 2022. Paper SM3O.2. [Google Scholar]
- Zukerstein, M.; Kozák, M.; Trojánek, F.; Malý, P. Simple technique for the compression of nanojoule pulses from few-cycle laser oscillator to 1.7-cycle duration via nonlinear spectral broadening in diamond. Opt. Lett. 2018, 43, 3654–3657. [Google Scholar] [CrossRef] [PubMed]
- Marčiulionytė, V.; Reggui, K.; Tamošauskas, G.; Dubietis, A. KGW and YVO4: Two excellent nonlinear materials for high repetition rate infrared supercontinuum generation. Opt. Express 2023, 31, 20377–20386. [Google Scholar] [CrossRef]
- Marčiulionytė, V.; Banys, J.; Vengelis, J.; Grigutis, R.; Tamošauskas, G.; Dubietis, A. Low-threshold supercontinuum generation in a homogeneous bulk material at 76 MHz pulse repetition rate. Opt. Lett. 2023, 48, 4609–4612. [Google Scholar] [CrossRef] [PubMed]
- Banys, J.; Vengelis, J. Efficient single-pass and double-pass pre-chirp managed Yb-doped rod-type fiber amplifiers using Gires-Tournois interferometric mirrors. Optik 2022, 249, 168185. [Google Scholar] [CrossRef]
- Jansonas, G.; Budriūnas, R.; Vengris, M.; Varanavičius, A. Interferometric measurements of nonlinear refractive index in the infrared spectral range. Opt. Express 2022, 30, 30507–30524. [Google Scholar] [CrossRef] [PubMed]
- Selivanov, A.G.; Denisov, I.A.; Kuleshov, N.V.; Yumashev, K.V. Nonlinear refractive properties of Yb3+-doped KY(WO4)2 and YVO4 laser crystals. Appl. Phys. B 2006, 83, 61–65. [Google Scholar] [CrossRef]
- Kabaciński, P.; Kardaś, T.M.; Stepanenko, Y.; Radzewicz, C. Nonlinear refractive index measurement by SPM-induced phase regression. Opt. Express 2019, 27, 11018–11028. [Google Scholar] [CrossRef] [PubMed]
- Cornolti, F.; Lucchesi, M.; Zambon, B. Elliptic gaussian beam self-focusing in nonlinear media. Opt. Commun. 1990, 75, 129–135. [Google Scholar] [CrossRef]
- Fibich, G.; Ilan, B. Self-focusing of elliptic beams: An example of the failure of the aberrationless approximation. J. Opt. Soc. Am. B 2000, 17, 1749–1758. [Google Scholar] [CrossRef]
Figure 1.
Experimental setup for all-solid-state post-compression of low-energy pulses. L1, L2, focusing lenses; M, beam-steering mirrors; BS, beam splitter; W1, W2, fused silica wedges; L3, collimating lens; GTI mirrors, Gires–Tournois interferometric mirrors for pulse compression; FS slab, fused silica slab for fine dispersion compensation; SHG-FROG, second-harmonic frequency-resolved optical gating for characterization of compressed pulses, SP, spectrometer; CCD, CCD camera.

Figure 2.
Spatial profiles of the (a) input beam measured before the lens L1 and (b) output beam measured after beam collimation. SHG-FROG characterization of the pulse after propagation in the first 2 mm thick ZnS crystal: (c) measured (black solid curve) and retrieved (blue solid curve) spectra, and retrieved spectral phase (red dashed curve); (d) retrieved temporal profile (blue solid curve) and temporal phase (red dashed curve).

Figure 3.
(a) Spectra of the laser pulses after each stage of spectral broadening. The collimated beam profiles after propagation in combinations of (b) ZnS+YAG, (c) ZnS + ZnS and (d) ZnS + KGW.
Figure 3.
(a) Spectra of the laser pulses after each stage of spectral broadening. The collimated beam profiles after propagation in combinations of (b) ZnS+YAG, (c) ZnS + ZnS and (d) ZnS + KGW.

Figure 4.
Characterization of the post-compressed pulses. (a) Measured and (b) retrieved SHG-FROG traces. (c) Measured (black solid curve) and retrieved (blue solid curve) spectra, and retrieved spectral phase (red dashed curve). (d) Retrieved temporal profile (blue solid curve) and temporal phase (red dashed curve). The temporal profiles of TL and input pulses are shown for comparison by grey and black curves, respectively.

Figure 5.
Spatial-spectral characterization of the compressed pulses. (a) Spatial-spectral homogeneity map of the output beam along the x-axis. (b) Spectral overlap parameter V (green curve) and intensity distribution over the beam profile (orange curve). Green shading denotes the area within which the beam intensity is , as indicated by dotted gray lines.

Figure 6.
Beam quality measurement. Solid curves represent a linear fit of the slopes in the far field. The inset shows the beam profile at the beam waist.
Figure 6.
Beam quality measurement. Solid curves represent a linear fit of the slopes in the far field. The inset shows the beam profile at the beam waist.


Table 1.
Relevant post-compression parameters achieved with the examined combinations of nonlinear materials. Pout is the average output power of the post-compressed pulses, T is the energy throughput of the setup, is the duration of the transform-limited pulse, is the measured duration of the post-compressed pulse and Ppeak is the peak power.
| Nonlinear | Pout | T | Ppeak | ||
|---|---|---|---|---|---|
| Material | W | % | fs | fs | MW |
| ZnS + ZnS | 12.53 | 80 | 37 | 47 | 2.67 |
| ZnS + KGW | 10.70 | 68 | 39 | 45 | 2.41 |
| ZnS + YAG | 11.47 | 73 | 32 | 37 | 3.26 |
Disclaimer/Publisher’s Note: The statements, opinions and data contained in all publications are solely those of the individual author(s) and contributor(s) and not of MDPI and/or the editor(s). MDPI and/or the editor(s) disclaim responsibility for any injury to people or property resulting from any ideas, methods, instructions or products referred to in the content. |
© 2024 by the authors. Licensee MDPI, Basel, Switzerland. This article is an open access article distributed under the terms and conditions of the Creative Commons Attribution (CC BY) license (https://creativecommons.org/licenses/by/4.0/).
Share and Cite
MDPI and ACS Style
Marčiulionytė, V.; Banys, J.; Vengelis, J.; Tamošauskas, G.; Dubietis, A. All-Solid-State Post-Compression of Low-Energy Pulses at High Repetition Rate. Photonics 2024, 11, 386. https://doi.org/10.3390/photonics11040386
AMA Style
Marčiulionytė V, Banys J, Vengelis J, Tamošauskas G, Dubietis A. All-Solid-State Post-Compression of Low-Energy Pulses at High Repetition Rate. Photonics. 2024; 11(4):386. https://doi.org/10.3390/photonics11040386
Chicago/Turabian StyleMarčiulionytė, Vaida, Jonas Banys, Julius Vengelis, Gintaras Tamošauskas, and Audrius Dubietis. 2024. "All-Solid-State Post-Compression of Low-Energy Pulses at High Repetition Rate" Photonics 11, no. 4: 386. https://doi.org/10.3390/photonics11040386
Note that from the first issue of 2016, this journal uses article numbers instead of page numbers. See further details here.