Article

Quantum Path Interference and Multiple Electron Scattering in Soft X-Ray High-Order Harmonic Generation

1
Institute of Atomic and Subatomic Physics, Vienna University of Technology, Stadionallee 2, 1020 Vienna, Austria
2
Institute of Optics and Quantum Electronics, Abbe Center of Photonics, Friedrich Schiller University, Max Wien Platz 1, 07743 Jena, Germany
3
Helmholtz Institute Jena, Fröbelstieg 3, 07743 Jena, Germany
4
Institut für Laser- und Plasmaphysik, Universität Düsseldorf, Universitätsstr. 1, 40225 Düsseldorf, Germany
5
GSI Helmholtz Centre for Heavy Ion Research, Planckstrasse 1, 64291 Darmstadt, Germany
*
Author to whom correspondence should be addressed.
Photonics 2015, 2(1), 104-123; https://doi.org/10.3390/photonics2010104
Submission received: 10 December 2014 / Accepted: 13 January 2015 / Published: 23 January 2015
(This article belongs to the Special Issue Extreme UV Lasers: Technologies and Applications)

Abstract

:
High-order harmonic generation is an important mechanism to generate coherent radiation in the few–100-eV spectral range with ultrashort laser pulses. Moreover, a closer inspection of the measured spectra provides unique information about the underlying physics and allows deriving guidelines for improvements. The long-range modulation of the spectral envelope is linked to phase matching, and we will show how to improve it with a double-pulse excitation scheme. Additionally, the spectrum contains only every fourth harmonic, which can be well explained by the quantum interference of multiple scattered electrons, and two dominant electron trajectories were selected by X-ray parametric interaction.

1. Introduction

Compact, laboratory X-ray sources are important tools for spectroscopy. High harmonic generation (HHG) is a promising method to generate coherent radiation in the extreme ultraviolet (XUV) and soft X-ray spectral range by up-converting the frequency of intense laser pulses into its harmonics. The spectral range of 10–70 eV is very well suited to measure the dynamics of bounded wave packets in atoms [1,2,3], whereas radiation in the spectral range around 100 eV is widely used for the generation of isolated attosecond pulses [4,5]. Radiation in the range between 270 eV and 540 eV, in the so-called water window between the carbon and oxygen K-edge, is of great interest for studying organic molecules [6,7,8] in their natural environment and, so, is a subject of research for many groups [9,10,11,12,13]. HHG with nearly continuous spectra up to a few keV has been demonstrated [14,15,16,17] and applied for studying the dynamics of solids [7,8].
The theory describes the generation of high-order harmonics from a single atom in three steps [18]: In a strong laser field, electrons are released from atoms or molecules by tunnel ionization and subsequently accelerated. After collecting energy from the laser field, the electrons re-collide with the ion, recombine and emit their excess energy as X-ray photons. The short wavelength radiation can be emitted in every optical half-cycle (OHC), resulting in a spectrum of odd (2i + 1) harmonics. Under well-defined initial conditions, the acceleration takes a time of approximately three-quarters of an optical cycle. According to theoretical prediction, taking into account the strong displacement of the accelerated electrons by the magnetic field of the laser pulse in the direction of the propagation at high intensities [19], only electrons accelerated longer than one optical cycle can emit harmonics up to the hard X-ray regime. Further, HHG is a coherent process, so the macroscopic build-up of the signal is the fastest, if the emission of all atoms is in phase [20], i.e., the HHG is phase-matched. Recently, it has been theoretically predicted that perfect phase matching cannot be realized for photon energies above ~200 eV using intense pulses from a Ti:sapphire laser system (center wavelength of ~800 nm) and helium as a nonlinear medium, which is otherwise the best suited gas for generating short wavelength radiation [21].
In the first part of this contribution, we present a set of detailed experimental studies of the phase matching conditions for the generation of high harmonics in the 0.2–1 keV spectral range using ultrashort pulses of Ti:sapphire laser systems. For this study, the observed modulation in the spectral envelope allows us to derive detailed information about the phase-matching conditions. In addition, we present a double-pulse scheme to improve the phase matching conditions and the conversion efficiency, as well. Furthermore, we show that using few-cycle laser pulse, even as short as 6 fs, harmonics up to 3 keV photon energies can be generated efficiently and with improved phase matching.
In the second part of this paper, we report on the experimental results with a high harmonic line structure containing only every fourth (4i + 1) harmonic in the few–100-eV spectral range. Our electron trajectory analysis suggests that multiple scattered electrons returning after about two optical cycles produce soft X-ray radiation in the spectral range above 200 eV up to a few keV. When the conditions for X-ray parametric amplification (XPA) [22] are fulfilled, the harmonics can be efficiently generated, and the quantum-path interference of two dominating trajectories explains the uncommon harmonic line structure very well.

2. Retrieving Phase-Matching Conditions from Spectral Modulation

Measured high harmonic spectra in the few–100-eV to few-keV photon energy range exhibit a periodic modulation of the amplitude with a rather long period, which depends on the exact experimental conditions. In this section, we show that the periodic modulation is the consequence of the non-phase-matched generation of the high-order harmonics. We present results from three different experiments and provide insight into the different parameters determining phase matching.

2.1. Theoretical Background

Phase matching of HHG can be studied by inspecting the propagation equation of the q-th harmonics in a gas medium [23]:
d E q ( z ) d z = a q n 0 e i Δ k q z + 1 2 ( σ e q n 1 σ a q n 0 ) E q ( z )
where the first term describes the HHG signal, which is proportional to the ground state atomic density n 0 ; the phase mismatch is considered by Δkq; the dipole response and other laser parameters are included in the factor aq. In Equation (1), the possibility of the parametric amplification contribution [22,24,25,26] and the absorption are also considered by the second term, which describes the amplification with stimulated emission cross-section σeq and “excited” atomic density n 1 and the absorption with the cross-section of σaq, Solving Equation (1), we get the electric field of the q-th harmonic at the output of the gas medium with length L:
E q ( L ) = a q n 0 L e 1 2 g q 0 e i ϕ q 0 1 2 g q 0 i ϕ q 0
where g q 0 = ( σ e q n 1 σ a q n 0 ) L and ϕ q 0 = Δ k q L . From Equation (2), the intensity at the output can be easily obtained:
I q ( L ) = | E q ( L ) | 2 = ( a q n 0 L ) 2 e g q 0 2 e 1 2 g q 0 cos ϕ q 0 + 1 1 4 g q 0 2 + ϕ q 0 2
A closer inspection of Equation (3) reveals two possible shapes of the high harmonic spectra: In the experiments to be presented, we used helium as the nonlinear medium. Helium has a negligible index of refraction, so the phase mismatch is mainly determined by the free electron density ne:
ϕ q 0 = q e 2 n e L 2 ε 0 c m e ω 1 : = 2 π q 0 q
Here, ω 1 is the angular frequency of the driver laser. As Equation (4) shows, the phase mismatch ϕ q 0 is proportional to the harmonic order q; consequently, according to the cosine term of Equation (3), the harmonic spectrum is modulated with period q 0 , which is inversely proportional to the free electron density and, consequently, to the gas pressure, and it reads:
q 0 = 4 π ε 0 c m e ω 1 e 2 n e L
(i) The periodic modulation of the HHG spectrum has the highest depth when the gain is small g q 0 0 ( e g q 0 1 ), and Equation (3) can then be rewritten:
I q ( L ) ( a q n 0 L ) 2 sin 2 ( π q 0 q ) ( π q 0 q ) 2
(ii) Contrarily, when the gain is large g q 0 > 2 , the second and the third terms in the nominator of Equation (3) are small, and the equation can be approximated as:
I q ( L ) ( a q n 0 L ) 2 e g q 0 1 4 g q 0 2 + ϕ q 0 2 ( 1 V cos ϕ q 0 )
describing a modulated spectrum with V = 2 / e 1 2 g q 0 < 1 modulation amplitude. The abovementioned features will be demonstrated experimentally in the next subsections.

2.2. Experiment 1: Pressure Dependence of the Spectral Modulation

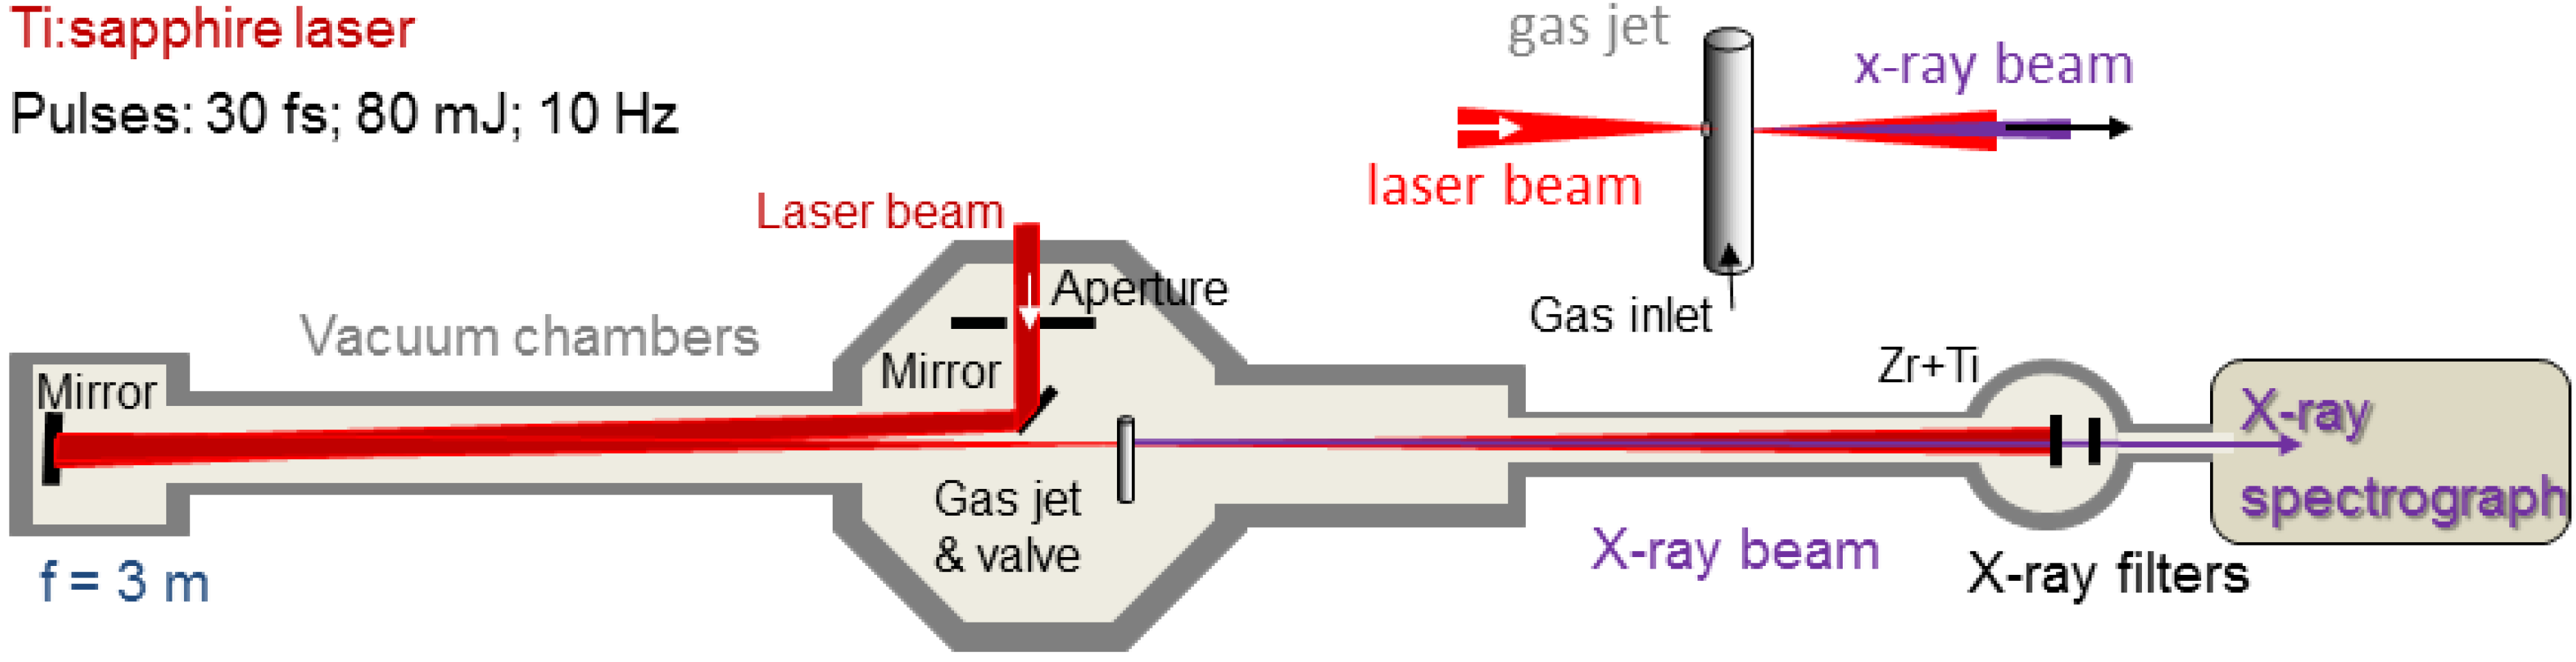
High harmonic spectra have been measured, with the JETI (Jena Ti:sapphire) laser system delivering 30 fs-long pulses with a repetition rate of 10 Hz. The further experimental setup can be seen in Figure 1. The pulse energy in the experiment was reduced with an adjustable iris down to 80 mJ. The beam was loosely focused with a spherical mirror (f = 3 m), resulting in an on-axis peak intensity of ~5 × 10¹⁵ W/cm² in the focus.
Figure 1. Experimental setup with the 10-Hz Ti:sapphire laser system. For the details, see the text.
Photonics 02 00104 g001
The HHG source (gas jet, inset of Figure 1) was a Ni-tube with a 1-mm diameter, and it was backed with helium gas in a pressure range between 0.1 and 1.2 bar. To reduce the gas load and the reabsorption of the generated soft X-ray harmonics in the background gas of the experimental vacuum chamber, the gas jet was operated through a pulsed valve synchronized to the laser. After blocking the fundamental laser light with 200 nm-thick Al and 100 nm-thick Ti foils, the generated soft X-ray spectra were measured with a scanning monochromator (McPherson 248/310G) equipped with a photomultiplier (Channeltron 4751G) and a 1200-grooves/mm grating. The photomultiplier is SiO2-coated, having a work function of ~10 eV, which means that it is not sensitive to light with a wavelength longer than ~120 nm. Therefore, it is only able to detect signals above the seventh harmonics of Ti:sapphire laser pulses, i.e., it is completely blind at the fundamental wavelength. The photomultiplier was operated with supply voltage of −2.5 kV (SRS PS350) and read out with a lock-in amplifier (Signal Recovery 5209). With this setup, we recorded the signal over a broad spectral range from 0.2–2 keV.
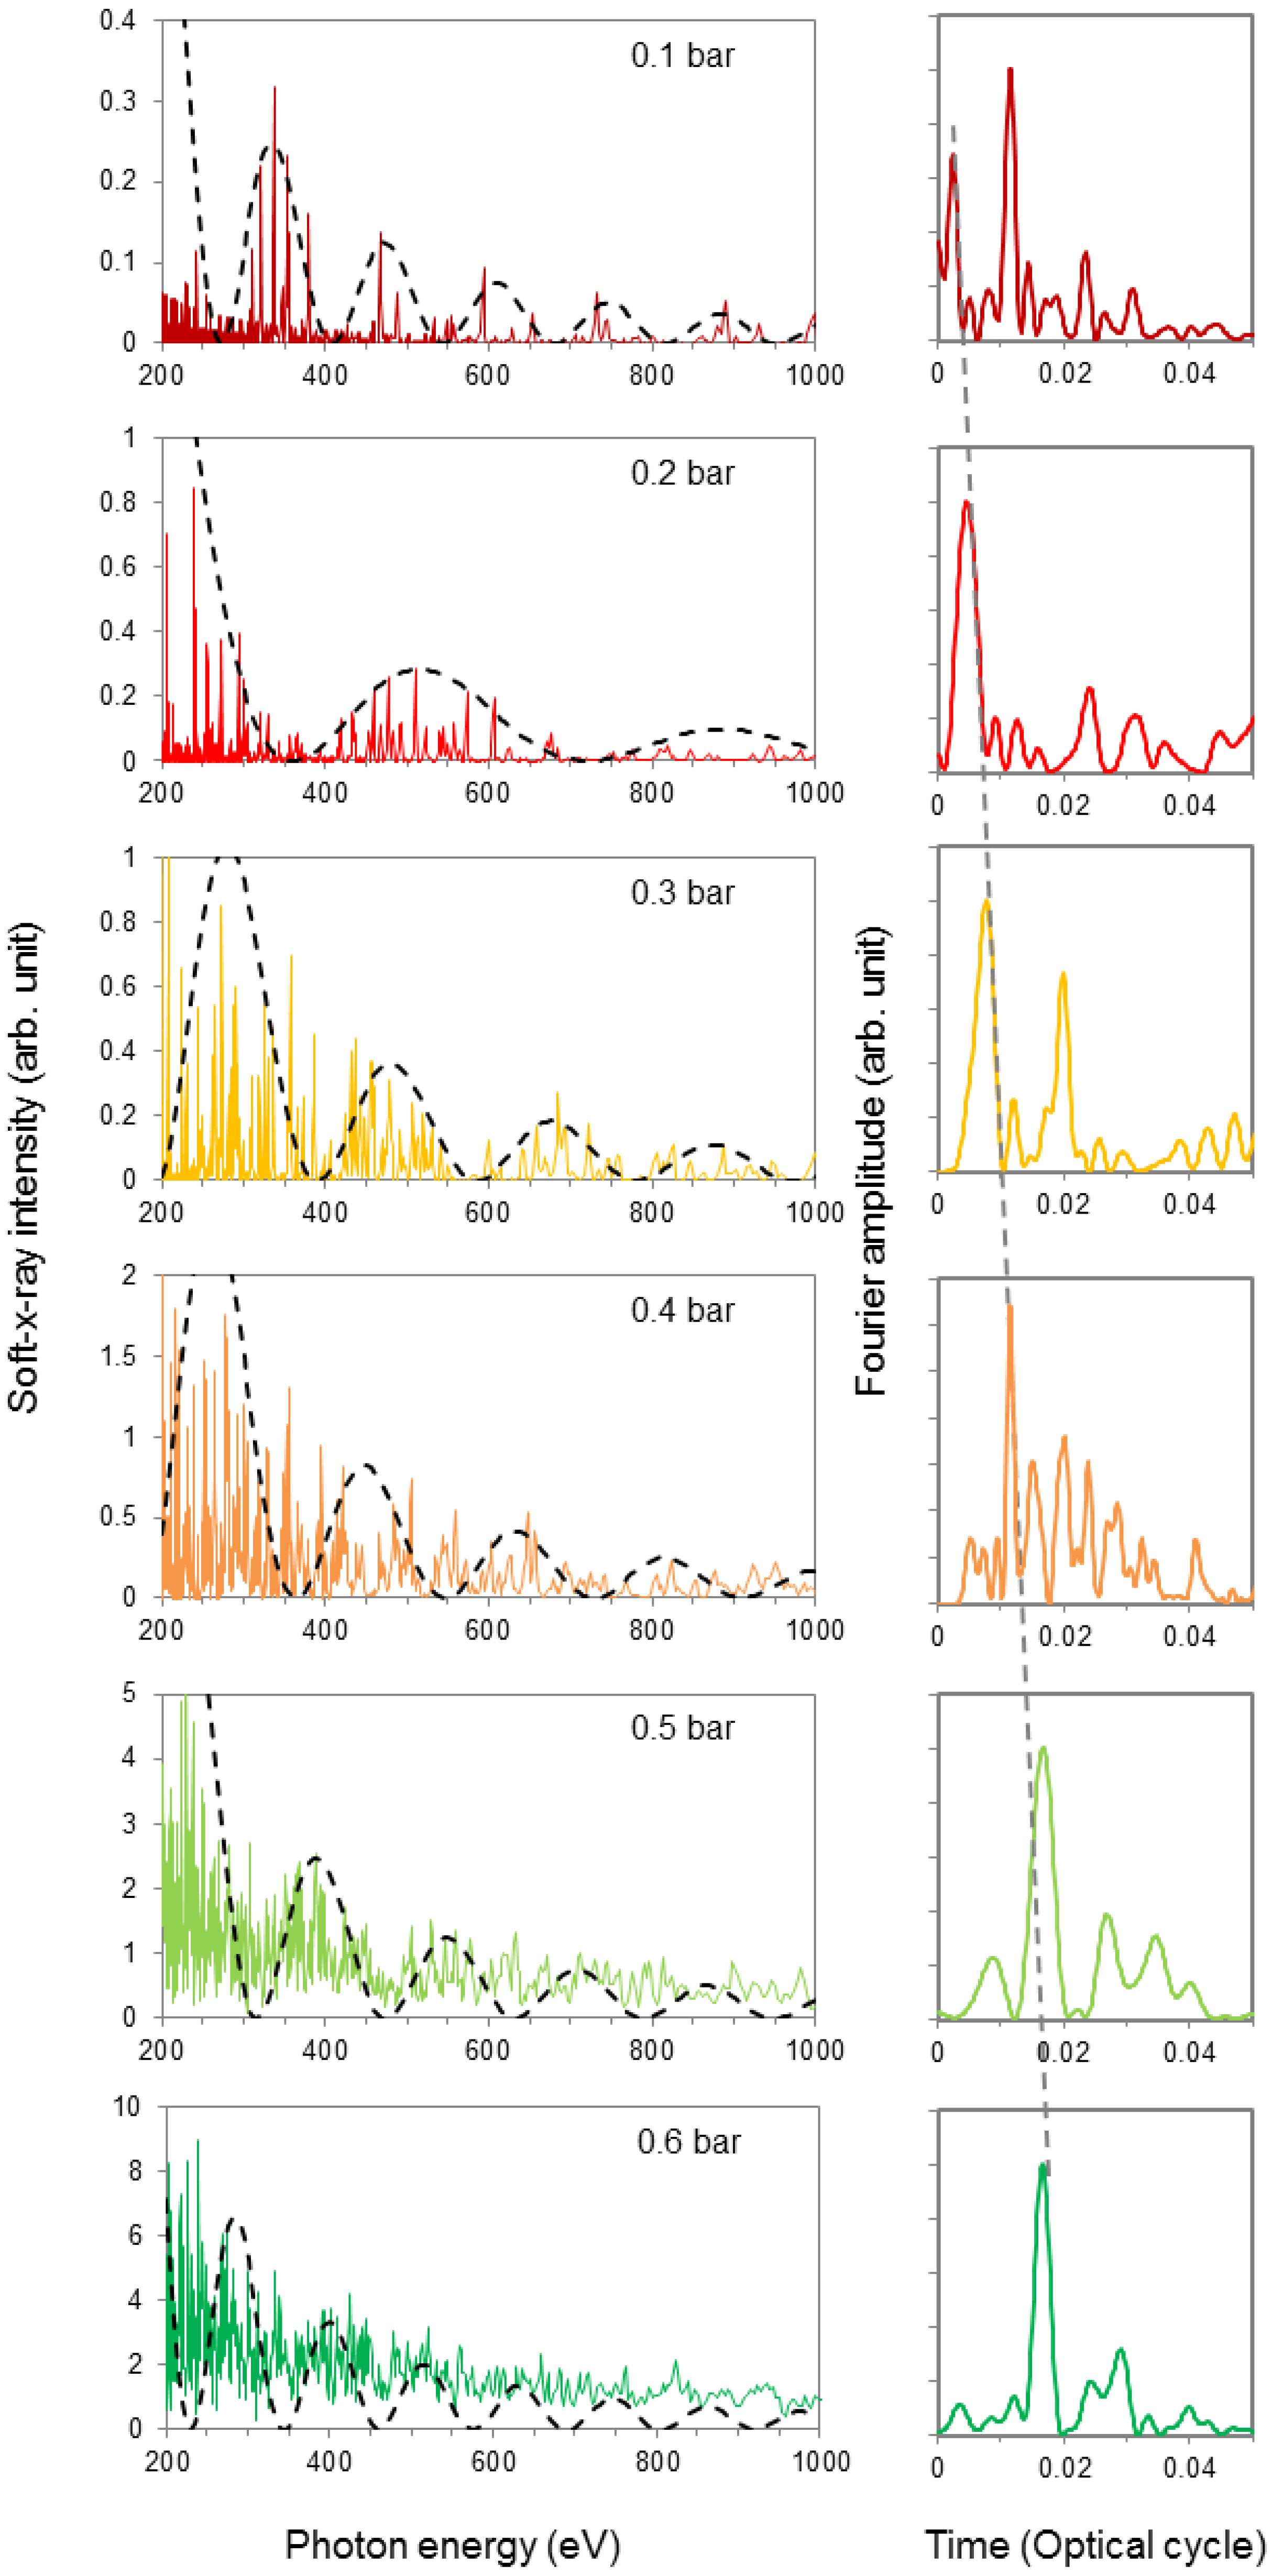
With the above-described setup, a series of soft X-ray spectra were measured for different He gas pressures, as summarized in Figure 2. Every spectrum exhibits a periodic modulation of its spectral envelope, the amplitude of which becomes smaller for higher photon energy. The period of the modulation depends on the pressure and is strictly periodic if it is plotted as a function of the photon energy. This modulation should not be confused with the EXAFS (extended absorption fine structure), which also modulates the X-ray spectrum. However, that modulation is not periodic, if the spectrum is plotted as the function of the photon energy (hv). The EXAFS modulation starts at the energy of an absorption edge (Eedge) and is periodic if the x-axis is rescaled by h ν E e d g e [7,15,27]. Furthermore, the EXAFS modulation is only governed by the absorbing material and is completely independent of the experimental parameters, such as pressure, laser intensity, etc., determining the emission characteristics of the X-ray source, as shown in 
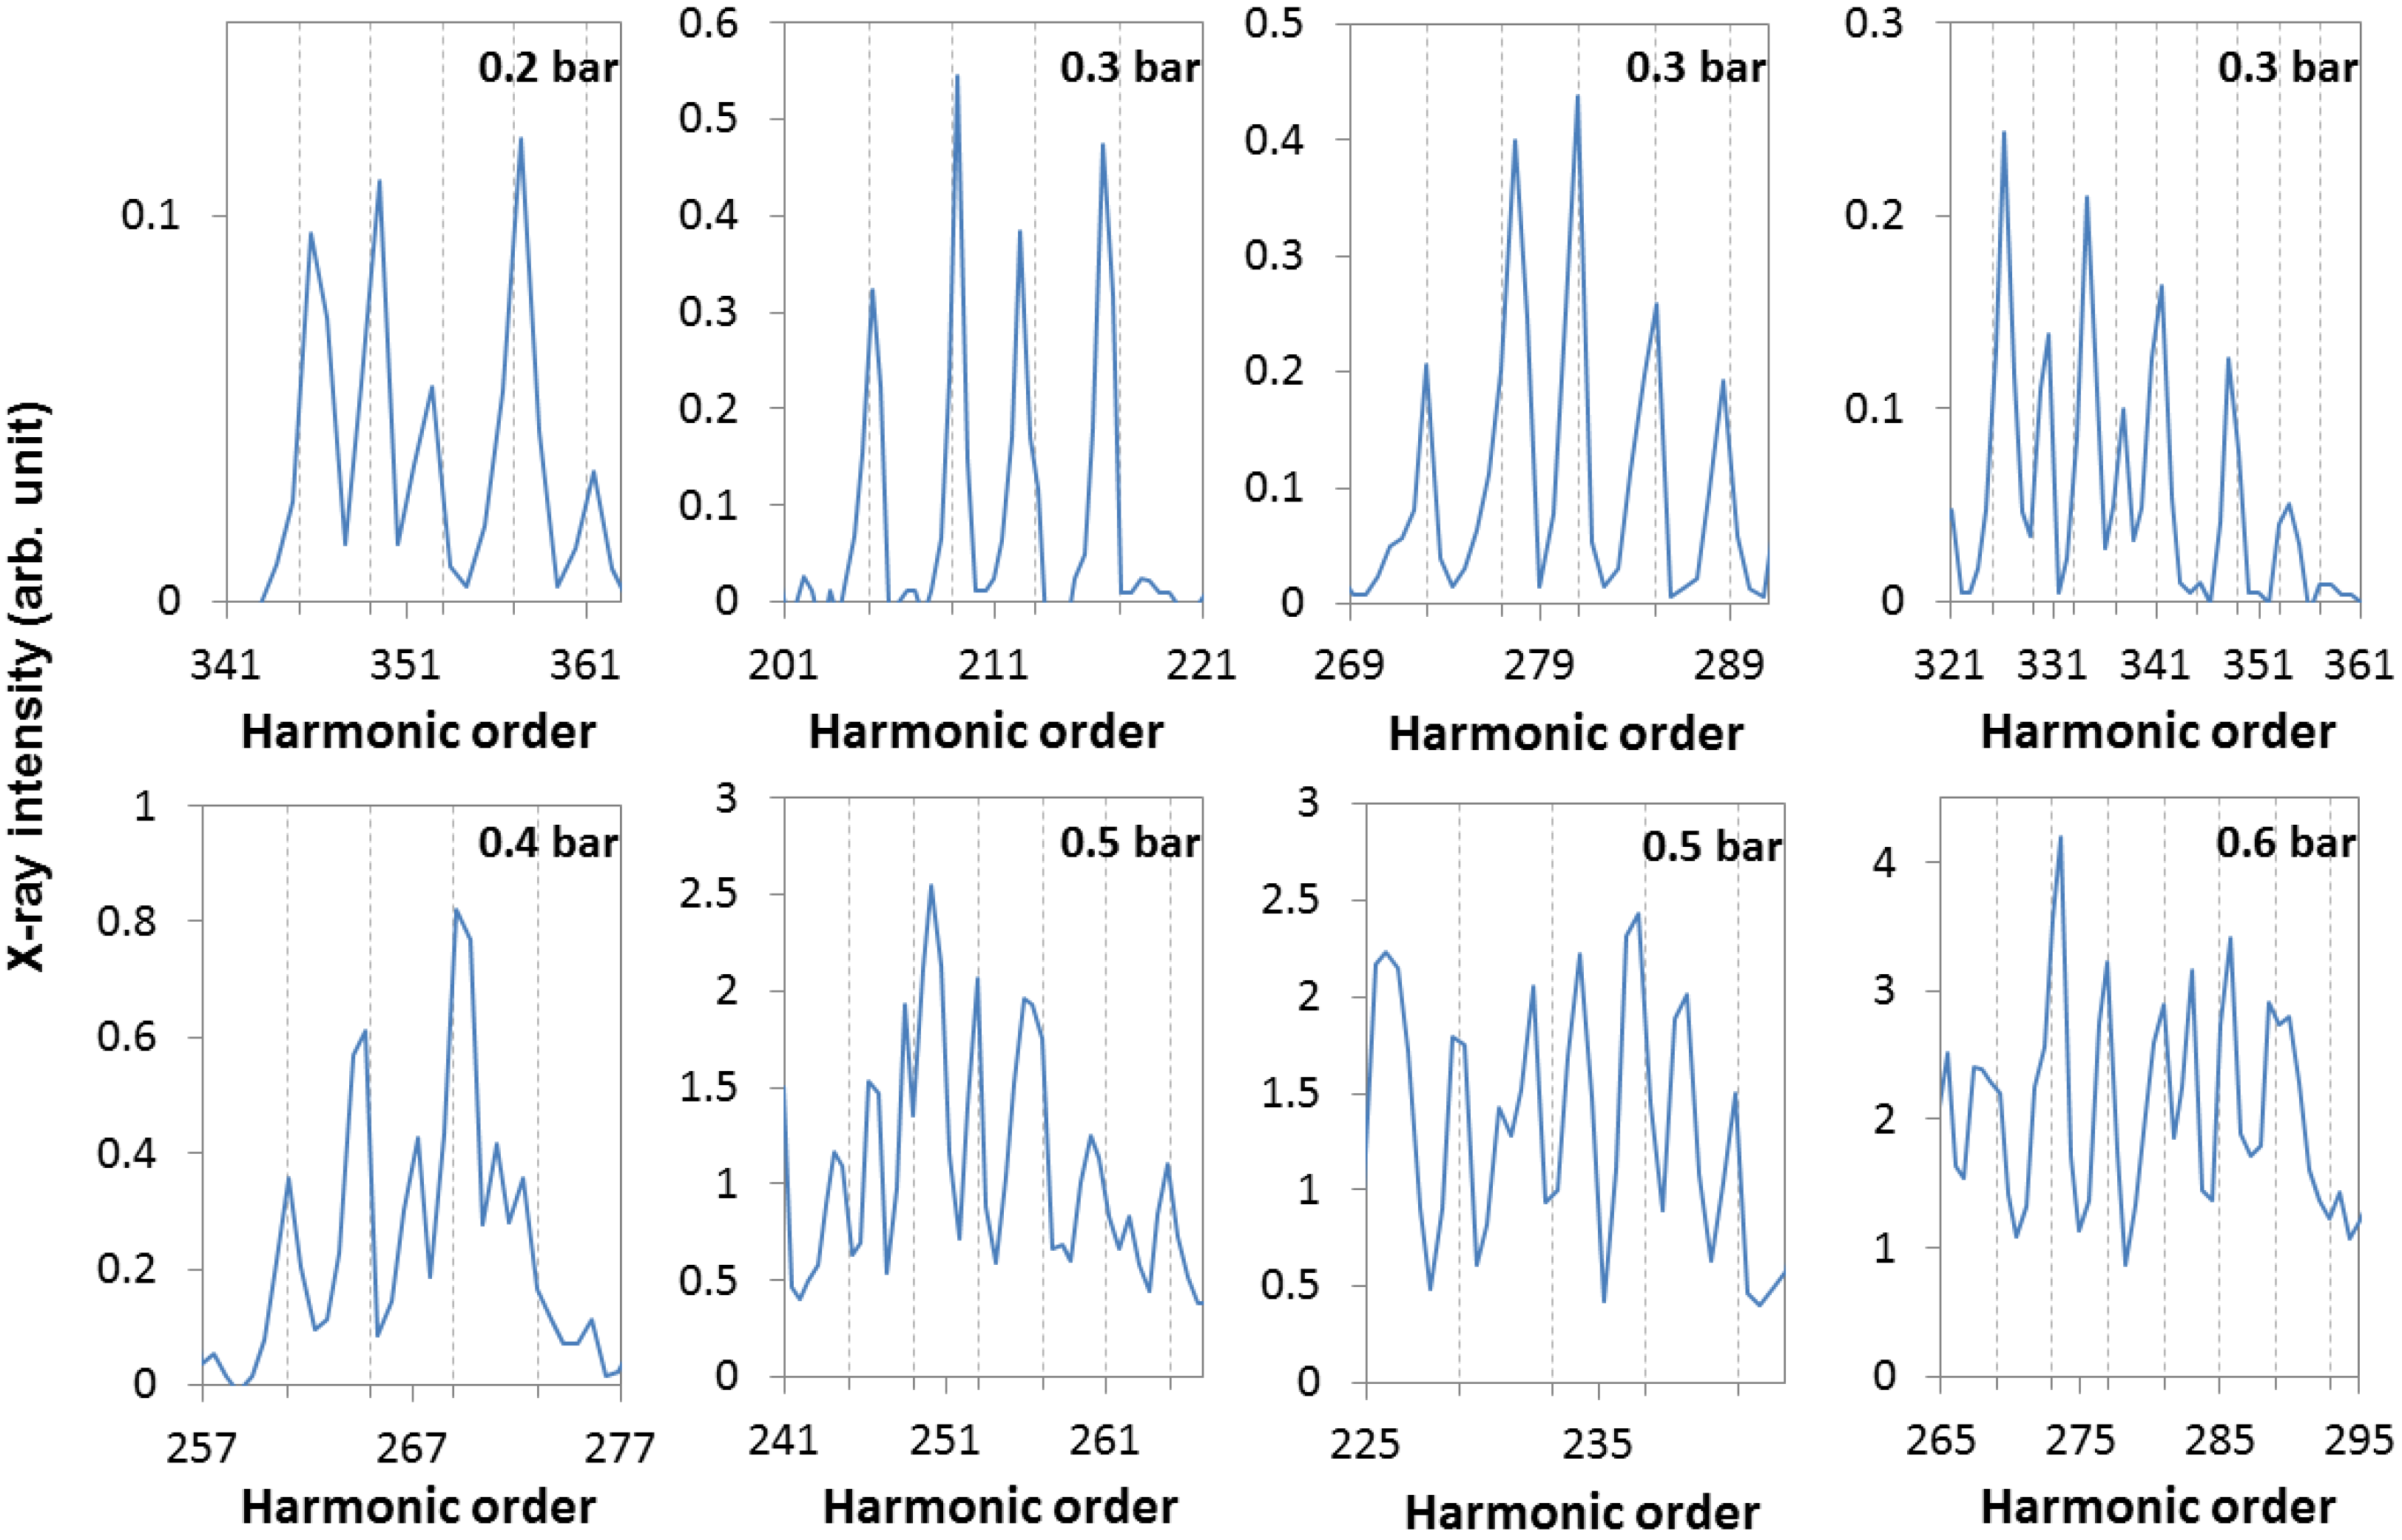
Figure 2. The modulation of the spectra in Figure 2 can be easily recognized at lower gas pressures from 0.1 bar to 0.3 bar, where the gain g 0 , which is proportional to the pressure, is small. This regime is well described by Equation (6), and this equation was used to fit the modulated envelope (dashed curves). This slow modulation is attributed to the constructive and destructive interference of the generated harmonics at different longitudinal positions of the gas medium, and it is the consequence of a phase mismatch between the driving laser pulse and the generated harmonics. The observed nearly 100% modulation depth caused by phase-matching provides evidence that the measured spectra are built up from coherent radiation in the full measured spectral range. By increasing the gas pressure, starting from 0.4 bar, the visibility and depth of the modulation of the measured spectra decreases, and Equation (6) no longer correctly describes the observed envelope. The role of the parametric gain can be further observed by the fast increase of the high harmonic signal, as indicated by the scaling of the vertical axes of the spectra. We observe a doubling of the signal by increasing the pressure in 0.1-bar steps between 0.3 and 0.6 bar. Upon a further increase of the pressure, the harmonic signal saturates.
To make a quantitative statement about the modulation of the spectral envelope, we have rescaled the measured spectra as a function of the harmonic order and calculated the Fourier transform without expecting any phase; just to examine periodic features in the spectra. The Fourier transform signals are plotted in Figure 2 next to their spectra in the right column. In every Fourier transform curve, the first peaks are clearly resolved. Their positions (~ q 0 1 ) increase linearly with the pressure (~free electron density), as predicted by Equation (5) and marked by the grey dashed line in Figure 2. Above a 0.7-bar backing pressure, the signal saturates, and the low visibility of the modulation makes the Fourier transforms much noisier and less reliable.
Figure 2. (Left) The high harmonics generation (HHG) spectra in the range of 0.2–1 keV have been recorded for different He backing pressures. The dashed curves are the fitted spectral envelopes calculated from Equation (6). (Right) Fourier transform of the recorded spectrum. The grey dashed line shows the linear shift of the first peak of the Fourier-transformed signal with gas pressure.
Photonics 02 00104 g002

2.3. Experiment 2: Improved Phase Matching with Few-Cycle Laser Pulse

The previous measurement was performed with of a Ti:sapphire laser system delivering 30 fs-long pulses, which are multi-cycle pulses consisting of about eleven optical cycles. The precise phase matching conditions for HHG are somewhat different for every optical cycle, so we cannot expect a narrow, noiseless peak after the Fourier transform of the measured spectra. We shows in this section that approximately five-times shorter laser pulses consisting of only a few cycles allow a better phase matching and the generation of radiation up to the few-keV photon energy range.
For these experiments, we used a table-top Ti:sapphire laser system [28,29,30,
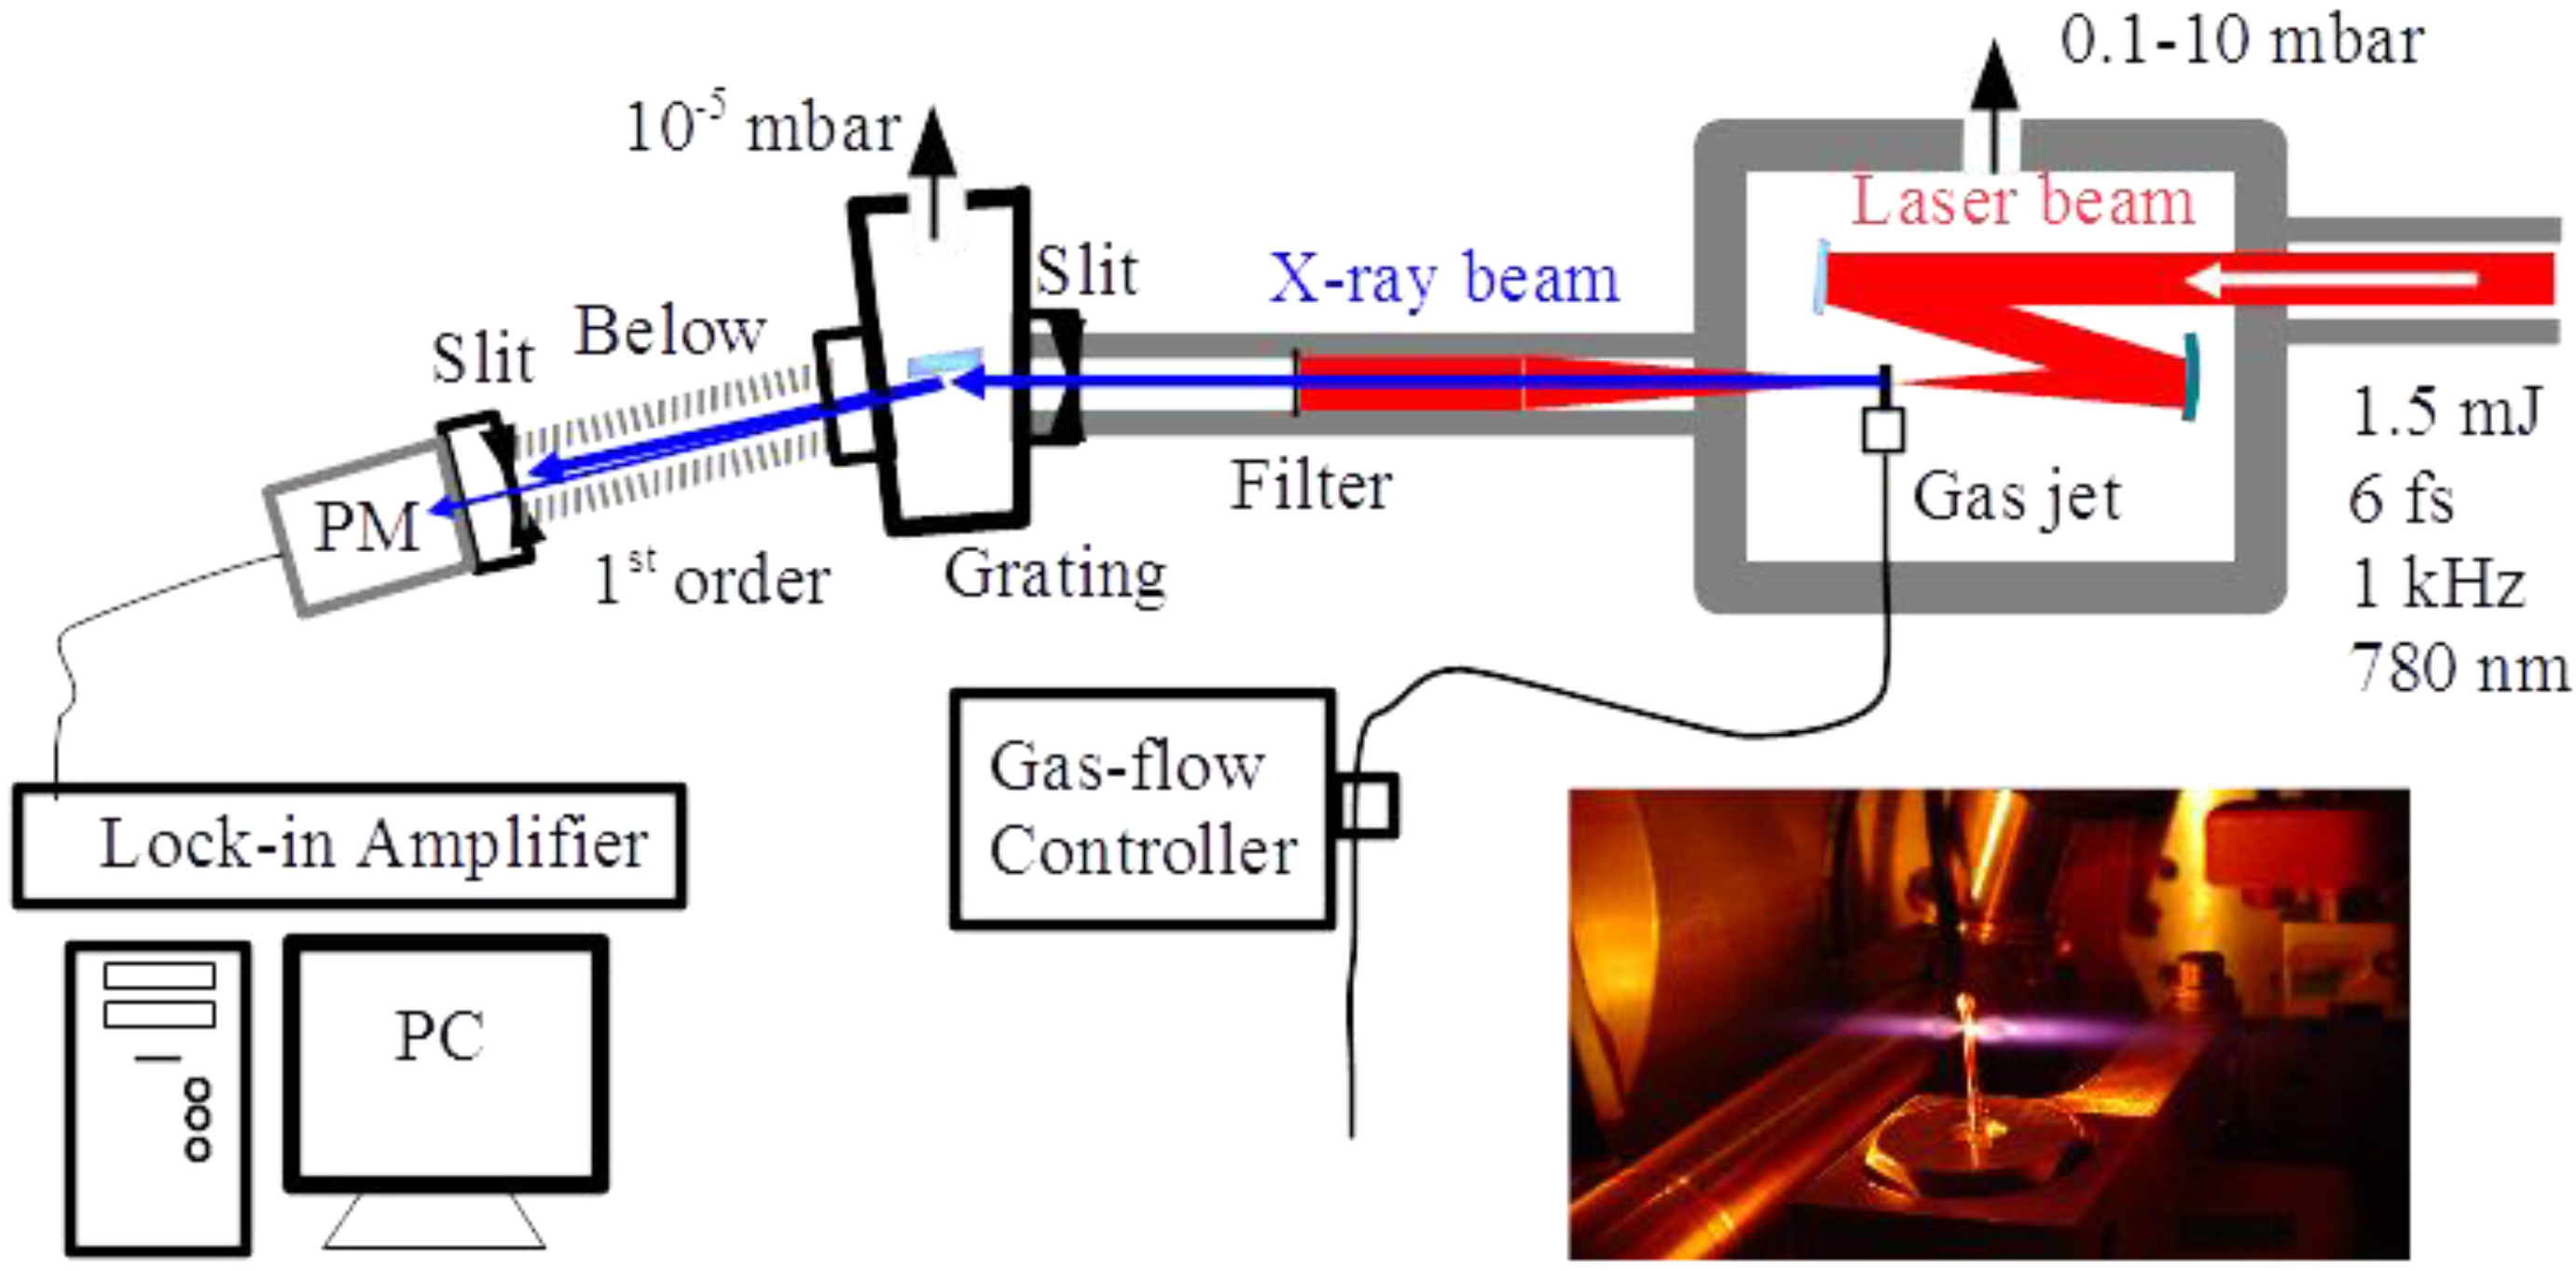
31] with a 1-kHz repetition rate. The laser system delivered 15 fs-long pulses with 3 mJ of pulse energy. For further pulse shortening, part of the laser pulses (about 2 mJ) were spectrally broadened in a filament in Ar and subsequently compressed to obtain 6 fs-long pulses with a pulse energy of 1.5 mJ. These pulses comprise only two optical cycles and are very well suited for the envisaged experiments. The compressed laser pulses were focused into a 0.4 mm-long helium gas jet. The laser intensity in the gas was ~2 × 10¹⁶ W/cm², supporting the generation of keV soft X-ray harmonics. The X-ray spectrum was measured similarly as in the previous experiment (Section 2.2), with a scanning spectrometer (248/310G, McPherson) equipped with a 1200-lines/mm grating and a photomultiplier (Channeltron 4715G, Kore Technology), as displayed in Figure 3. The photomultiplier was sensitive to wavelengths below ~120 nm. For these measurements, we used a 100 nm-thick Cu foil for vacuum separation between the source chamber and the spectrograph and to suppress harmonics below 100 eV.
Figure 3. Experimental setup with the 1-kHz Ti:sapphire laser system with a picture of the He gas jet. PM, photomultiplier. For the details, see the text.
Photonics 02 00104 g003
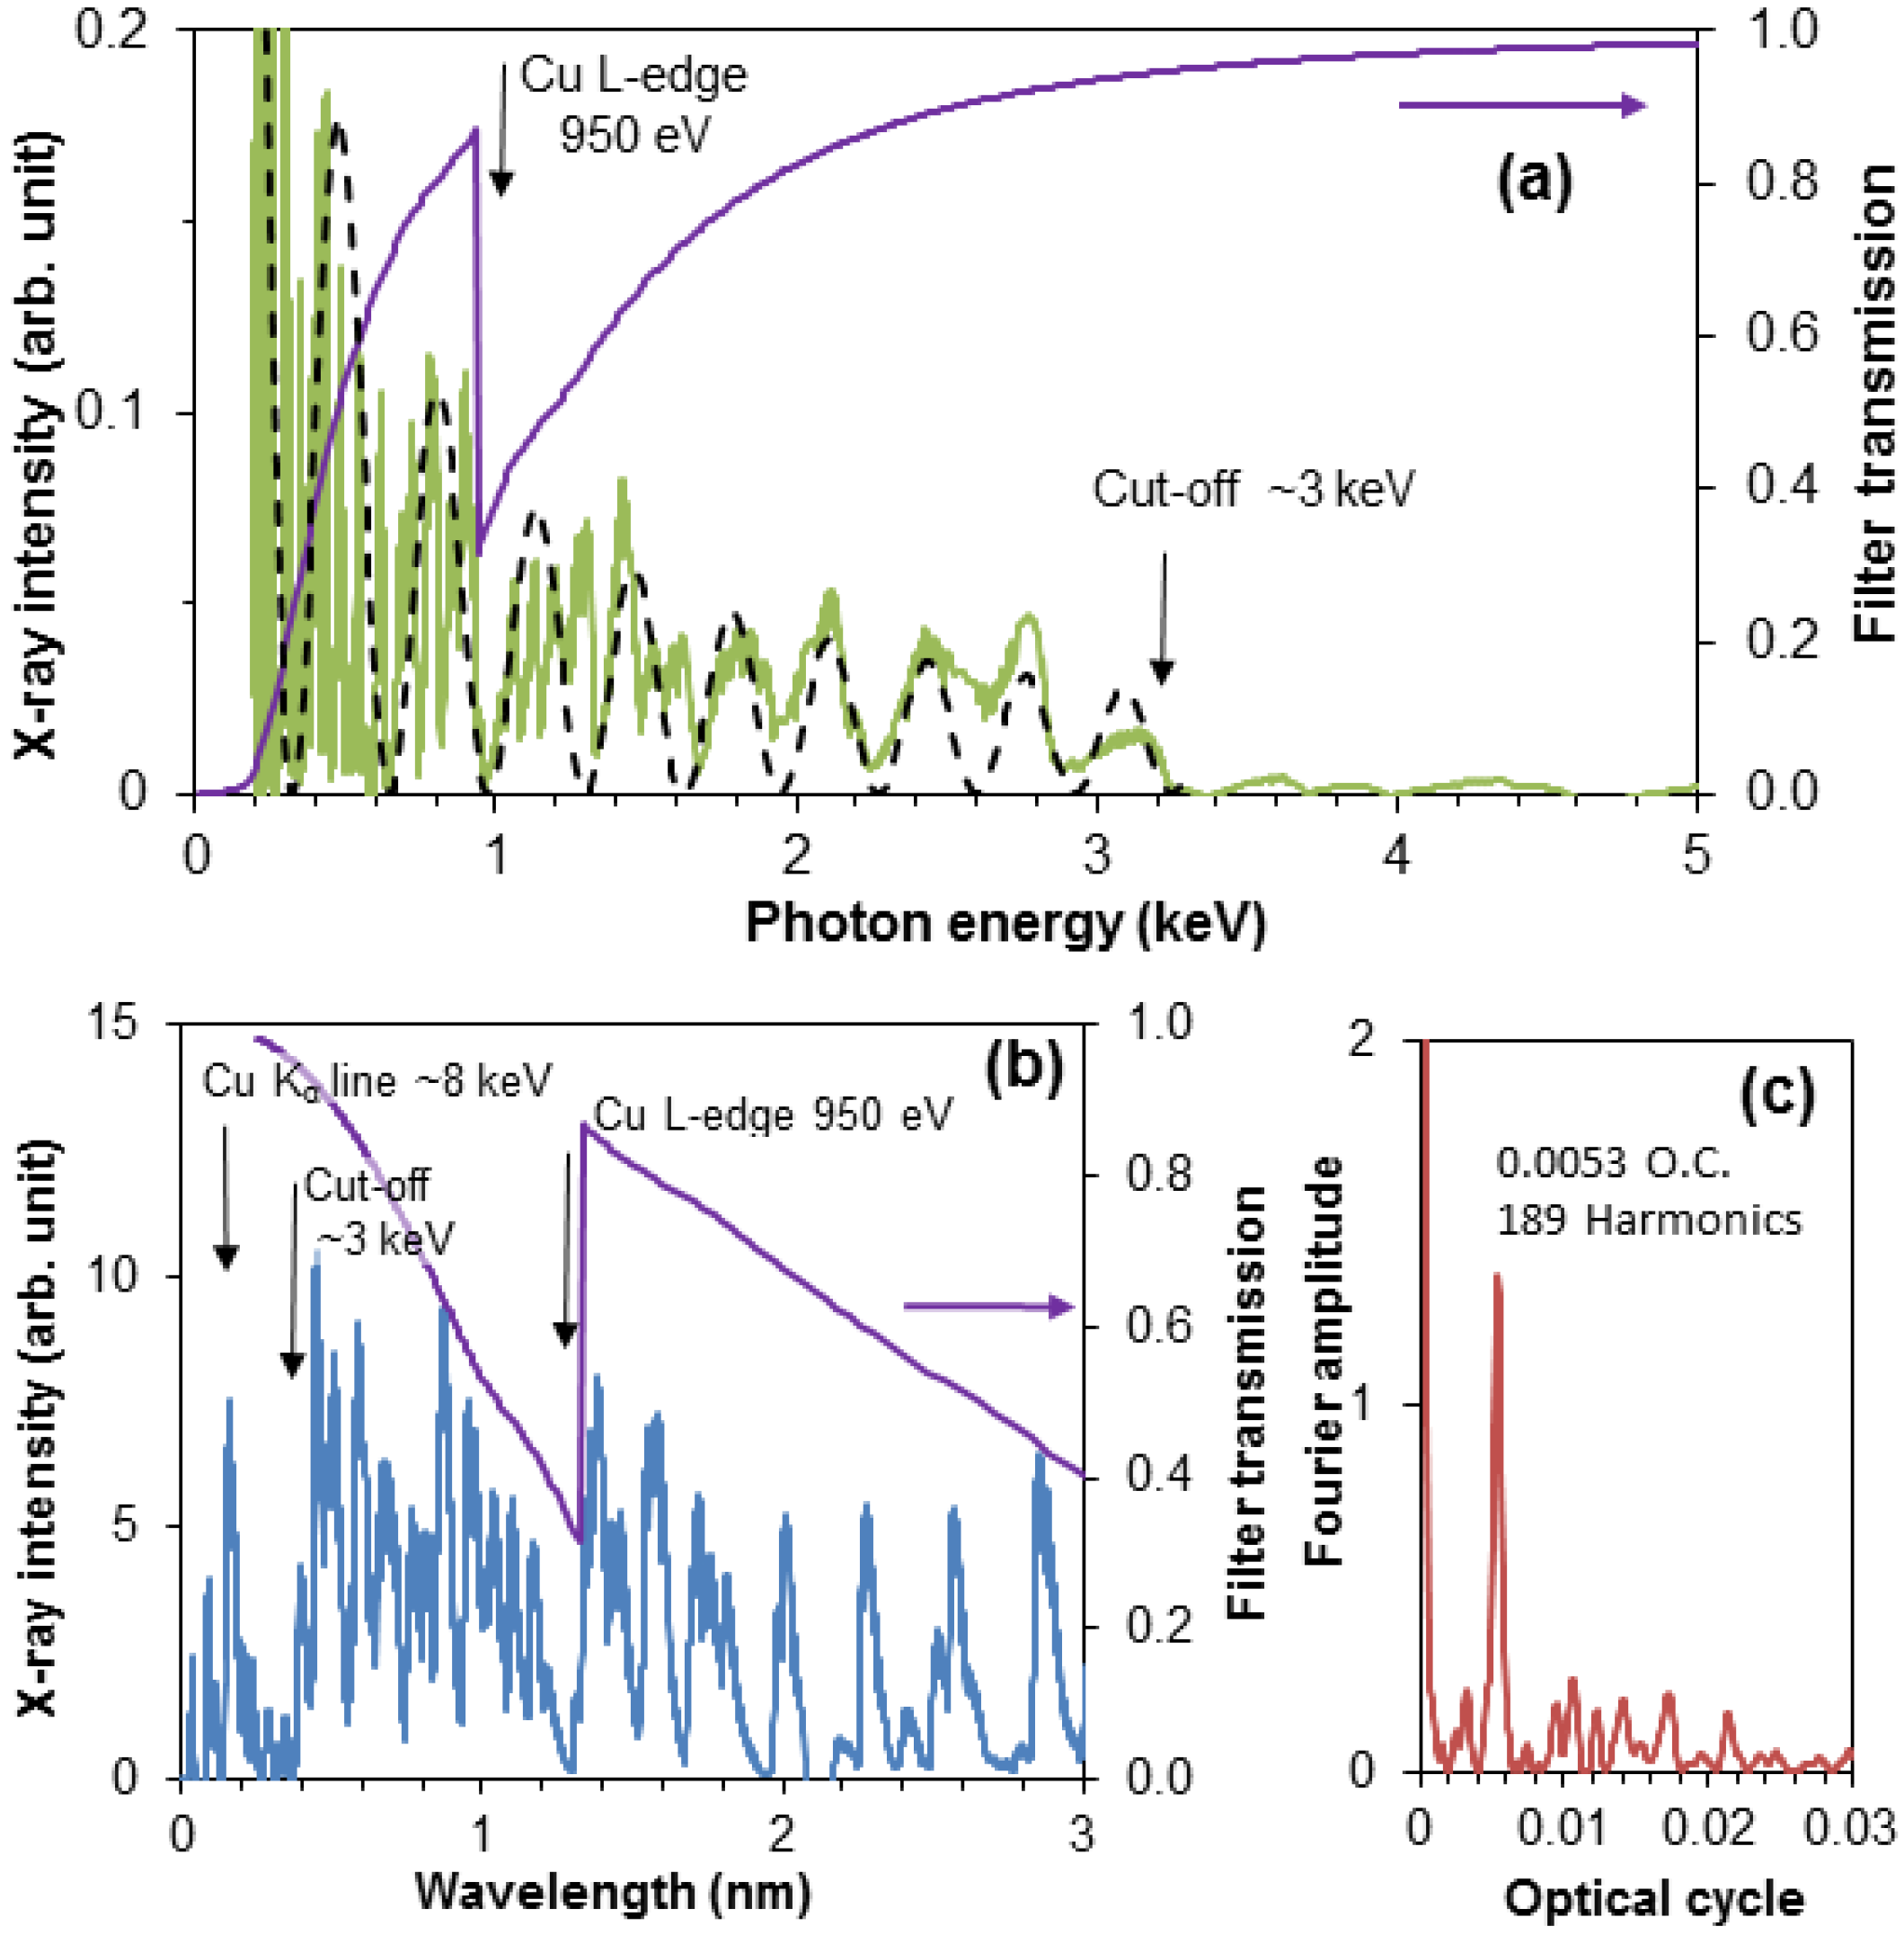
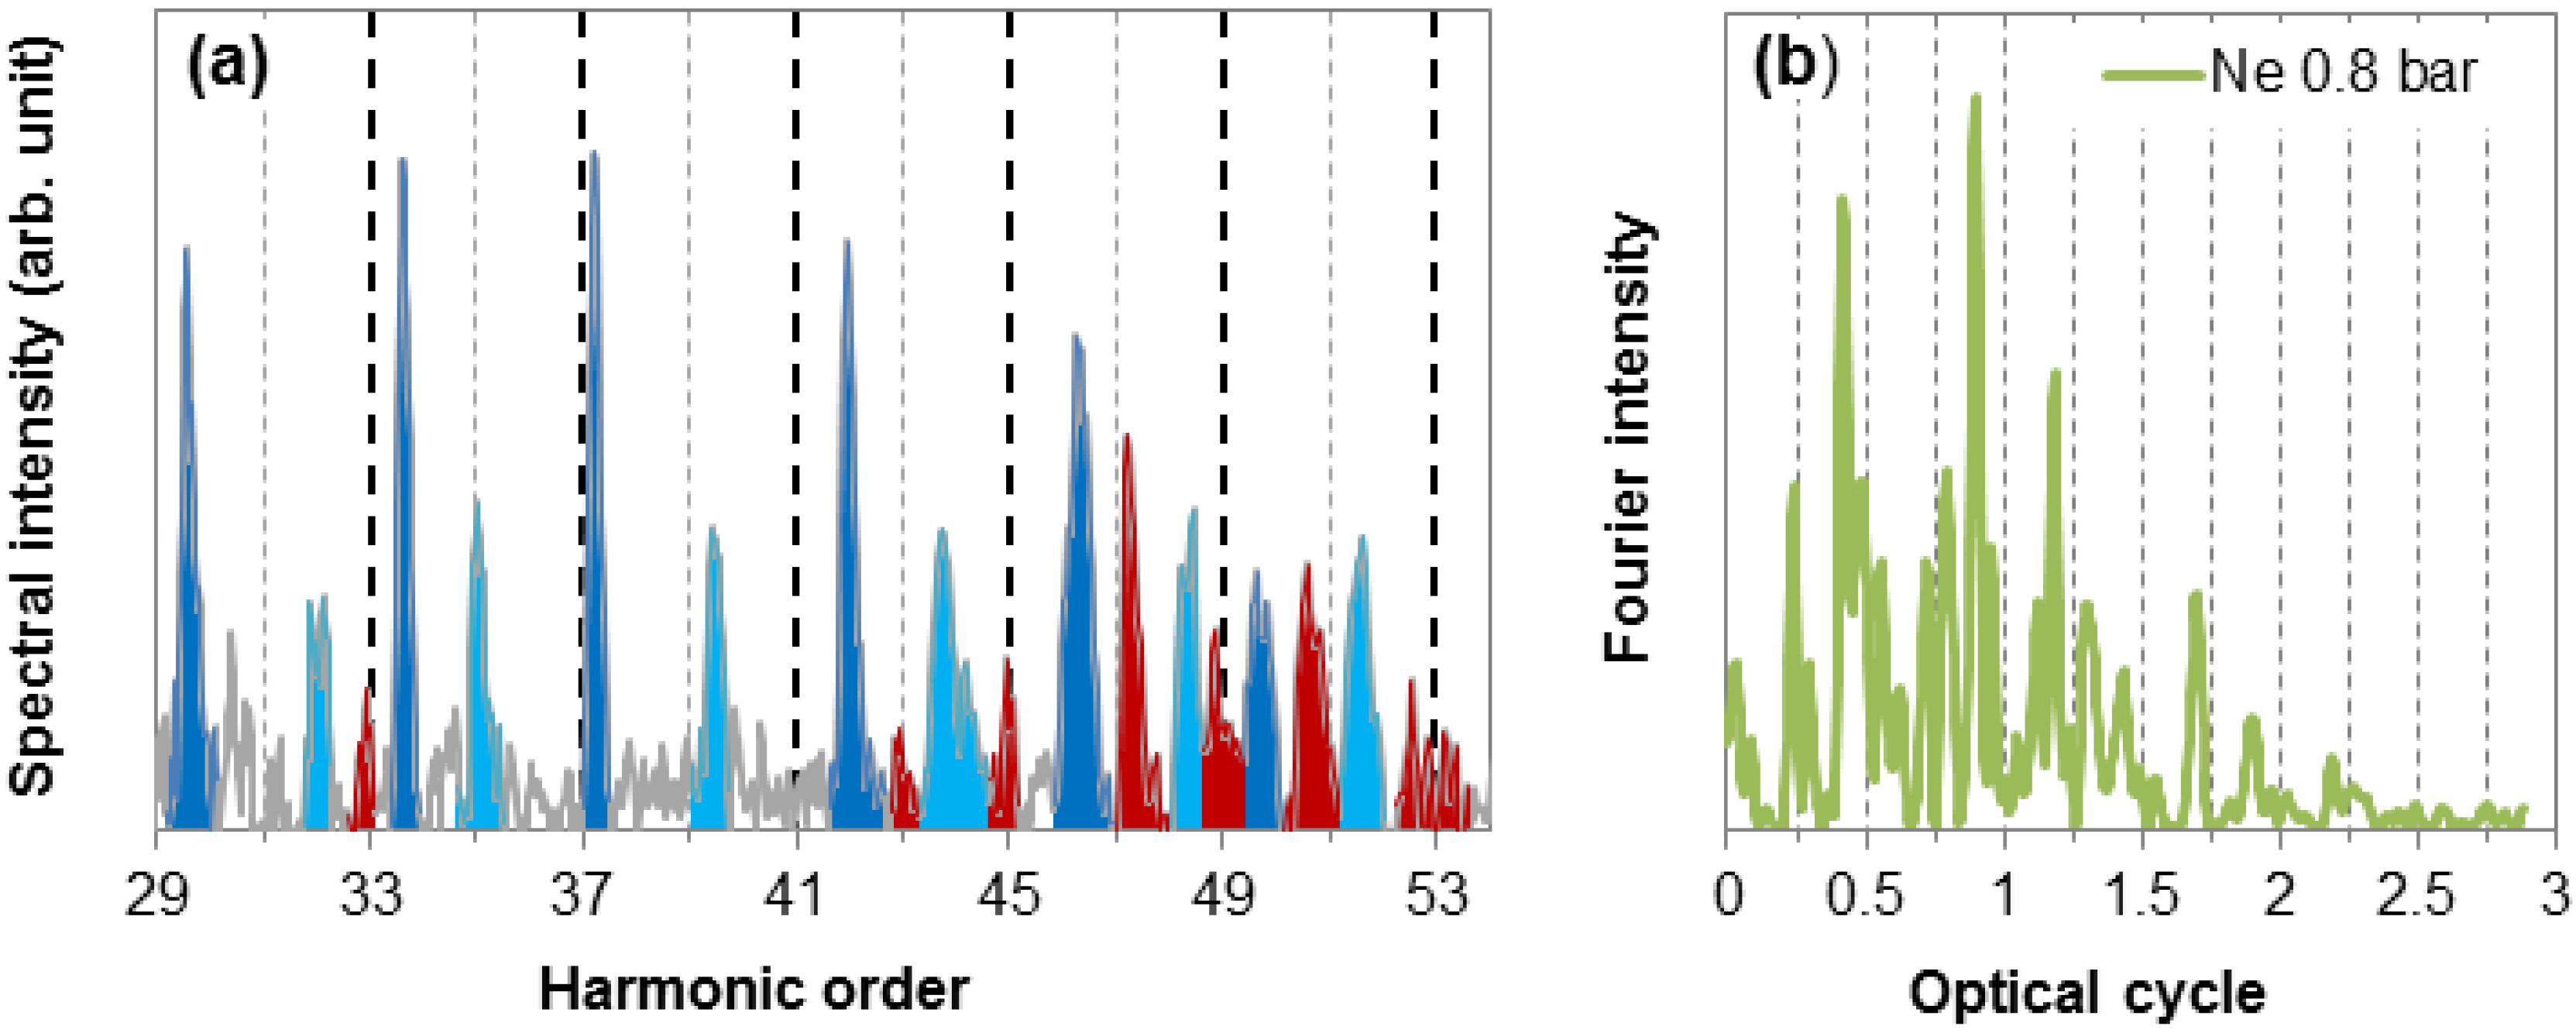
A typical measured spectrum is shown in Figure 4a. The spectrum (green line) exhibits a sharp high harmonic cut-off at ~3 keV of photon energy and the L absorption edge of the 100 nm-thick Cu filter at 950 eV is also well visible. The short wavelength part of the spectrum below 3 nm (~400 eV) is highlighted in Figure 4b. Beyond the Cu L-edge and the harmonic cut-off, one can recognize the Kα emission line of Cu at ~8 keV excited by the laser-accelerated electrons from the He gas. This emission line was not well resolved, because of the resolution limit (~0.02 nm) of the spectrograph.
Figure 4. (a) The measured high-order harmonic spectrum (green line) extends up to 3 keV. The transmission of the 100 nm-thick Cu foil is also shown (purple line). The spectral modulation has a nearly constant period of 325 eV, indicated by the black dashed line. (b) Beyond the L absorption edge of the Cu filter and the harmonic cut-off at ~3 keV, the Kα emission line of the Cu foil at ~8 keV is also visible. (c) The spectral modulation is caused by the non-perfect phase-matched generation of high-order harmonics, as proven by the appearance of the well-defined peak in its Fourier transform.
Photonics 02 00104 g004
Beyond the well-resolved edges, the measured spectrum shows the expected strong modulation, which is the consequence of the non-phase-matched generation of the harmonics (see Equation (6)). For resolving this feature, the spectrum has been rescaled in harmonic order and Fourier transformed in the spectral range between 0.1 keV and 3 keV. In the Fourier-transformed signal (Figure 4c), a very clear and well-distinguishable peak can be recognized at 5.3 × 10⁻³ optical cycles, which corresponds to a uniform modulation of the spectral envelope with a period of 189 harmonic orders or 325 eV. According to Equation (5), this spectral modulation corresponds to a free electron density of 8.4 × 10²¹ m−3. This spectrum was generated under similar phase matching conditions as the spectrum at 0.2 bar in the previous section (Figure 2), but the about four-times lower laser intensity of the longer pulses earlier was not sufficient for generating harmonics at such high photon energies. The high visibility of the spectral modulation in the full spectral range and the well-defined cut-off prove that the full spectrum originates from coherent soft X-rays. In Section 3.3, we will return to this measurement and will explain how this spectral range can be reached by a few-cycle laser pulse.

2.4. Experiment 3: Improving Phase Matching with a Double-Pulse Excitation Scheme

In the previous section, the generation of high-order harmonics up to a 3-keV photon energy was demonstrated. HHG at even higher photon energies can be obtained in principle, by simply increasing the laser intensity, which shifts the cut-off energy by the same factor. However, several difficulties arise at the increased laser intensity. At lower intensities, mainly below 1 × 10¹⁶ W/cm², the harmonics are generated from He atoms near the center of the laser pulse, and the harmonic spectrum can extend up to 2 keV. If the laser intensity is further increased, the He atoms are completely ionized in the first part of the pulse, and consequently, the harmonics are generated always at the same intensity shifted to the leading edge of the laser pulse, resulting in no extension of the cut-off energy. At the center of the laser pulse, however, He is further ionized, and the harmonics are generated from He+ ions, which have a higher (54.4 eV) ionization potential than He (24.6 eV), allowing one to extend the cut-off up to 12 keV, according to the simple theory outlined at the beginning. Generating harmonics from one- or two-times ionized atoms is widely studied [32,33,34,35], and from, e.g., multiple charged Ar harmonics up to 500 eV [35] have been demonstrated. A serious drawback of the generation of high-order harmonics from multiple ionized atoms is the free electron background, which defeats the phase matching and restricts the conversion efficiency to low values. However, getting rid of the free electrons from the path of the laser in a capillary discharge setup has been successfully demonstrated [32]. Further, the elimination of the free electron background in cavitated plasma produced by a laser pulse with relativistic intensity has been predicted [36]. In this section, we describe a double-pulse method [37] to form an electron-free ion channel and to study the improved phase matching conditions from inspecting the modulated envelope of the harmonic radiation generated in the formed channel.
In this experiment, we used the same Ti:sapphire laser system as described in the previous section [29], delivering 15 fs-long pulses with 3 mJ of energy at a 1-kHz repetition rate. The acousto-optic programmable dispersive filter (AOPDF, DAZZLER, Fastlite) in the laser system was set to generate double pulses with a variable delay and identical pulse energies of 0.75 mJ. The overall laser pulse energy was reduced to avoid the degradation of the pulse structure due to strong saturation in the amplifier. The pulses were focused into a He gas jet by a highly reflecting spherical mirror with a focal length of 200 mm. The setup was similar as presented in Figure 3. The interaction length in the gas jet was 0.4 mm, which is much shorter than the confocal parameter of 2.3 mm of the laser beam, it being necessary to avoid self-channeling. The on-axis peak intensity was about 1 × 10¹⁶ W/cm² for both pulses. From these parameters, the estimated on-axis high harmonic cut-off energy was 1.9 keV. The generated harmonic signal was once again measured with a scanning X-ray spectrograph (248/310G, McPherson) equipped with a platinum-coated grating of 300 lines/mm, and the X-ray photons were detected with a photomultiplier (Channeltron® 4715G, Kore Technology). The gas backing pressure was set to 250 mbar, and the gas jet was moved approximately 1 mm after the focus. This position allows the exploitation of further phase matching contributions [10,20] and the enhancement effect of X-ray parametric amplification [22]. The lower order harmonics and the residual laser light are blocked with a 100 nm-thick Ti foil. With this setup, we recorded the X-ray spectra for double-pulse excitation by setting the pulse distance from zero to 300 fs, which was the limit of the AOPDF.
The intensity of the laser pre-pulse was chosen to fully ionize the gas. During the pre-pulse, the electrons were trapped in the vicinity of the ions and released after the pulse passed. The electrons leaving the atom have a ten-times higher perpendicular momentum compared to the longitudinal one. Therefore, after the laser pulse has passed, we have an almost electron-free ion channel. The second laser pulse, launched into the channel after a suitable delay time, then generates high-order harmonics from He+ ions with high efficiency due to the improved phase matching condition.
To determine the optimum delay time, we recorded the generated soft X-ray spectra as a function of the delay between the pre- and main pulse, respectively. The periodic structure of the high energy part of the spectra with uniform periodicity gives direct information about the phase matching conditions, as was described in Section 2.1. 
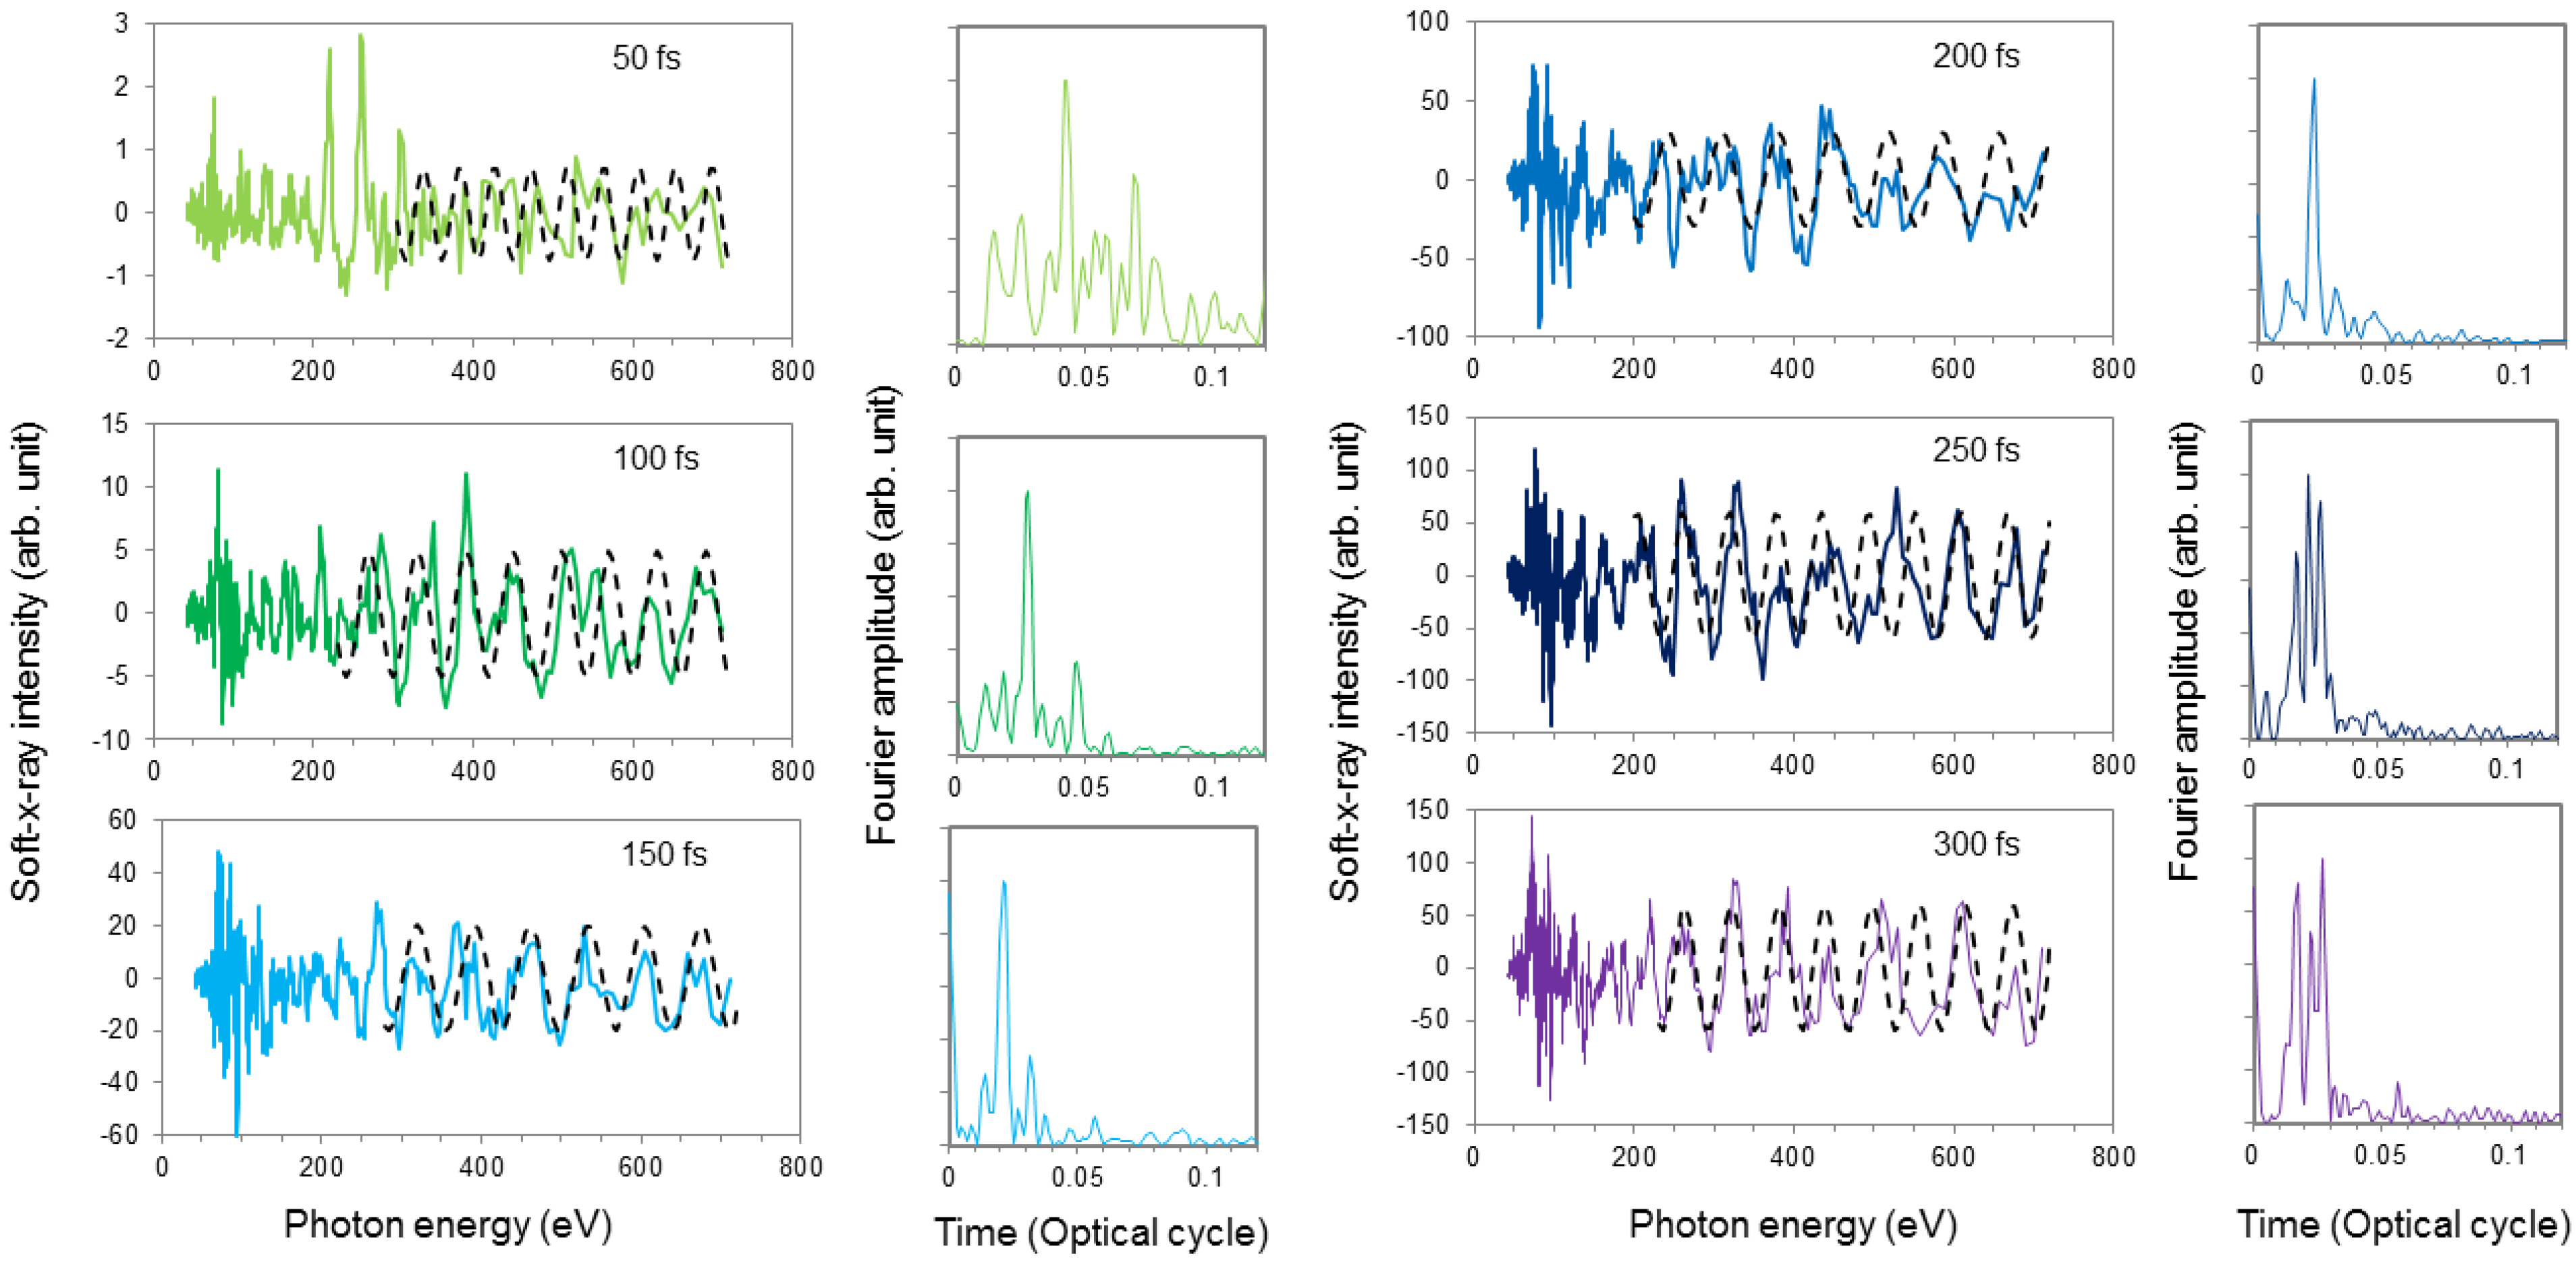
Figure 5 shows the periodic structures after subtracting the slowly varying part from the spectra and multiplying it with ω³ to obtain a nearly constant amplitude. Phase matching is almost completely missing for a delay of 50 fs, which can be seen by the position of the peak (4.2 × 10⁻² optical cycle) of the Fourier transform of the spectrum in the figure right of the corresponding spectrum. From the following spectra, we can conclude that the ion channel starts to build up at a delay of 100 fs, indicated by a well-visible periodic modulation in the 200–700 eV range. This implies that phase matching is improved, once again indicated in the Fourier transform by a more pronounced and narrower peak at fewer than 2.7 × 10⁻² optical cycles. The best phase matching was reached at a time delay of about 200 fs (Fourier peak at 2.2 × 10⁻² optical cycle). For longer delays, the shape of the peak in the Fourier transforms starts to degrade.
Figure 5. The measured periodic modulation in the high harmonic spectra for different delays between the two excitation pulses, providing information about the phase matching. The modulation period can be quantized by calculating the Fourier transform (even columns) of the spectra. The longest phase matching length, i.e., the shortest modulation period, was obtained for a delay of 150–250 fs.
Photonics 02 00104 g005
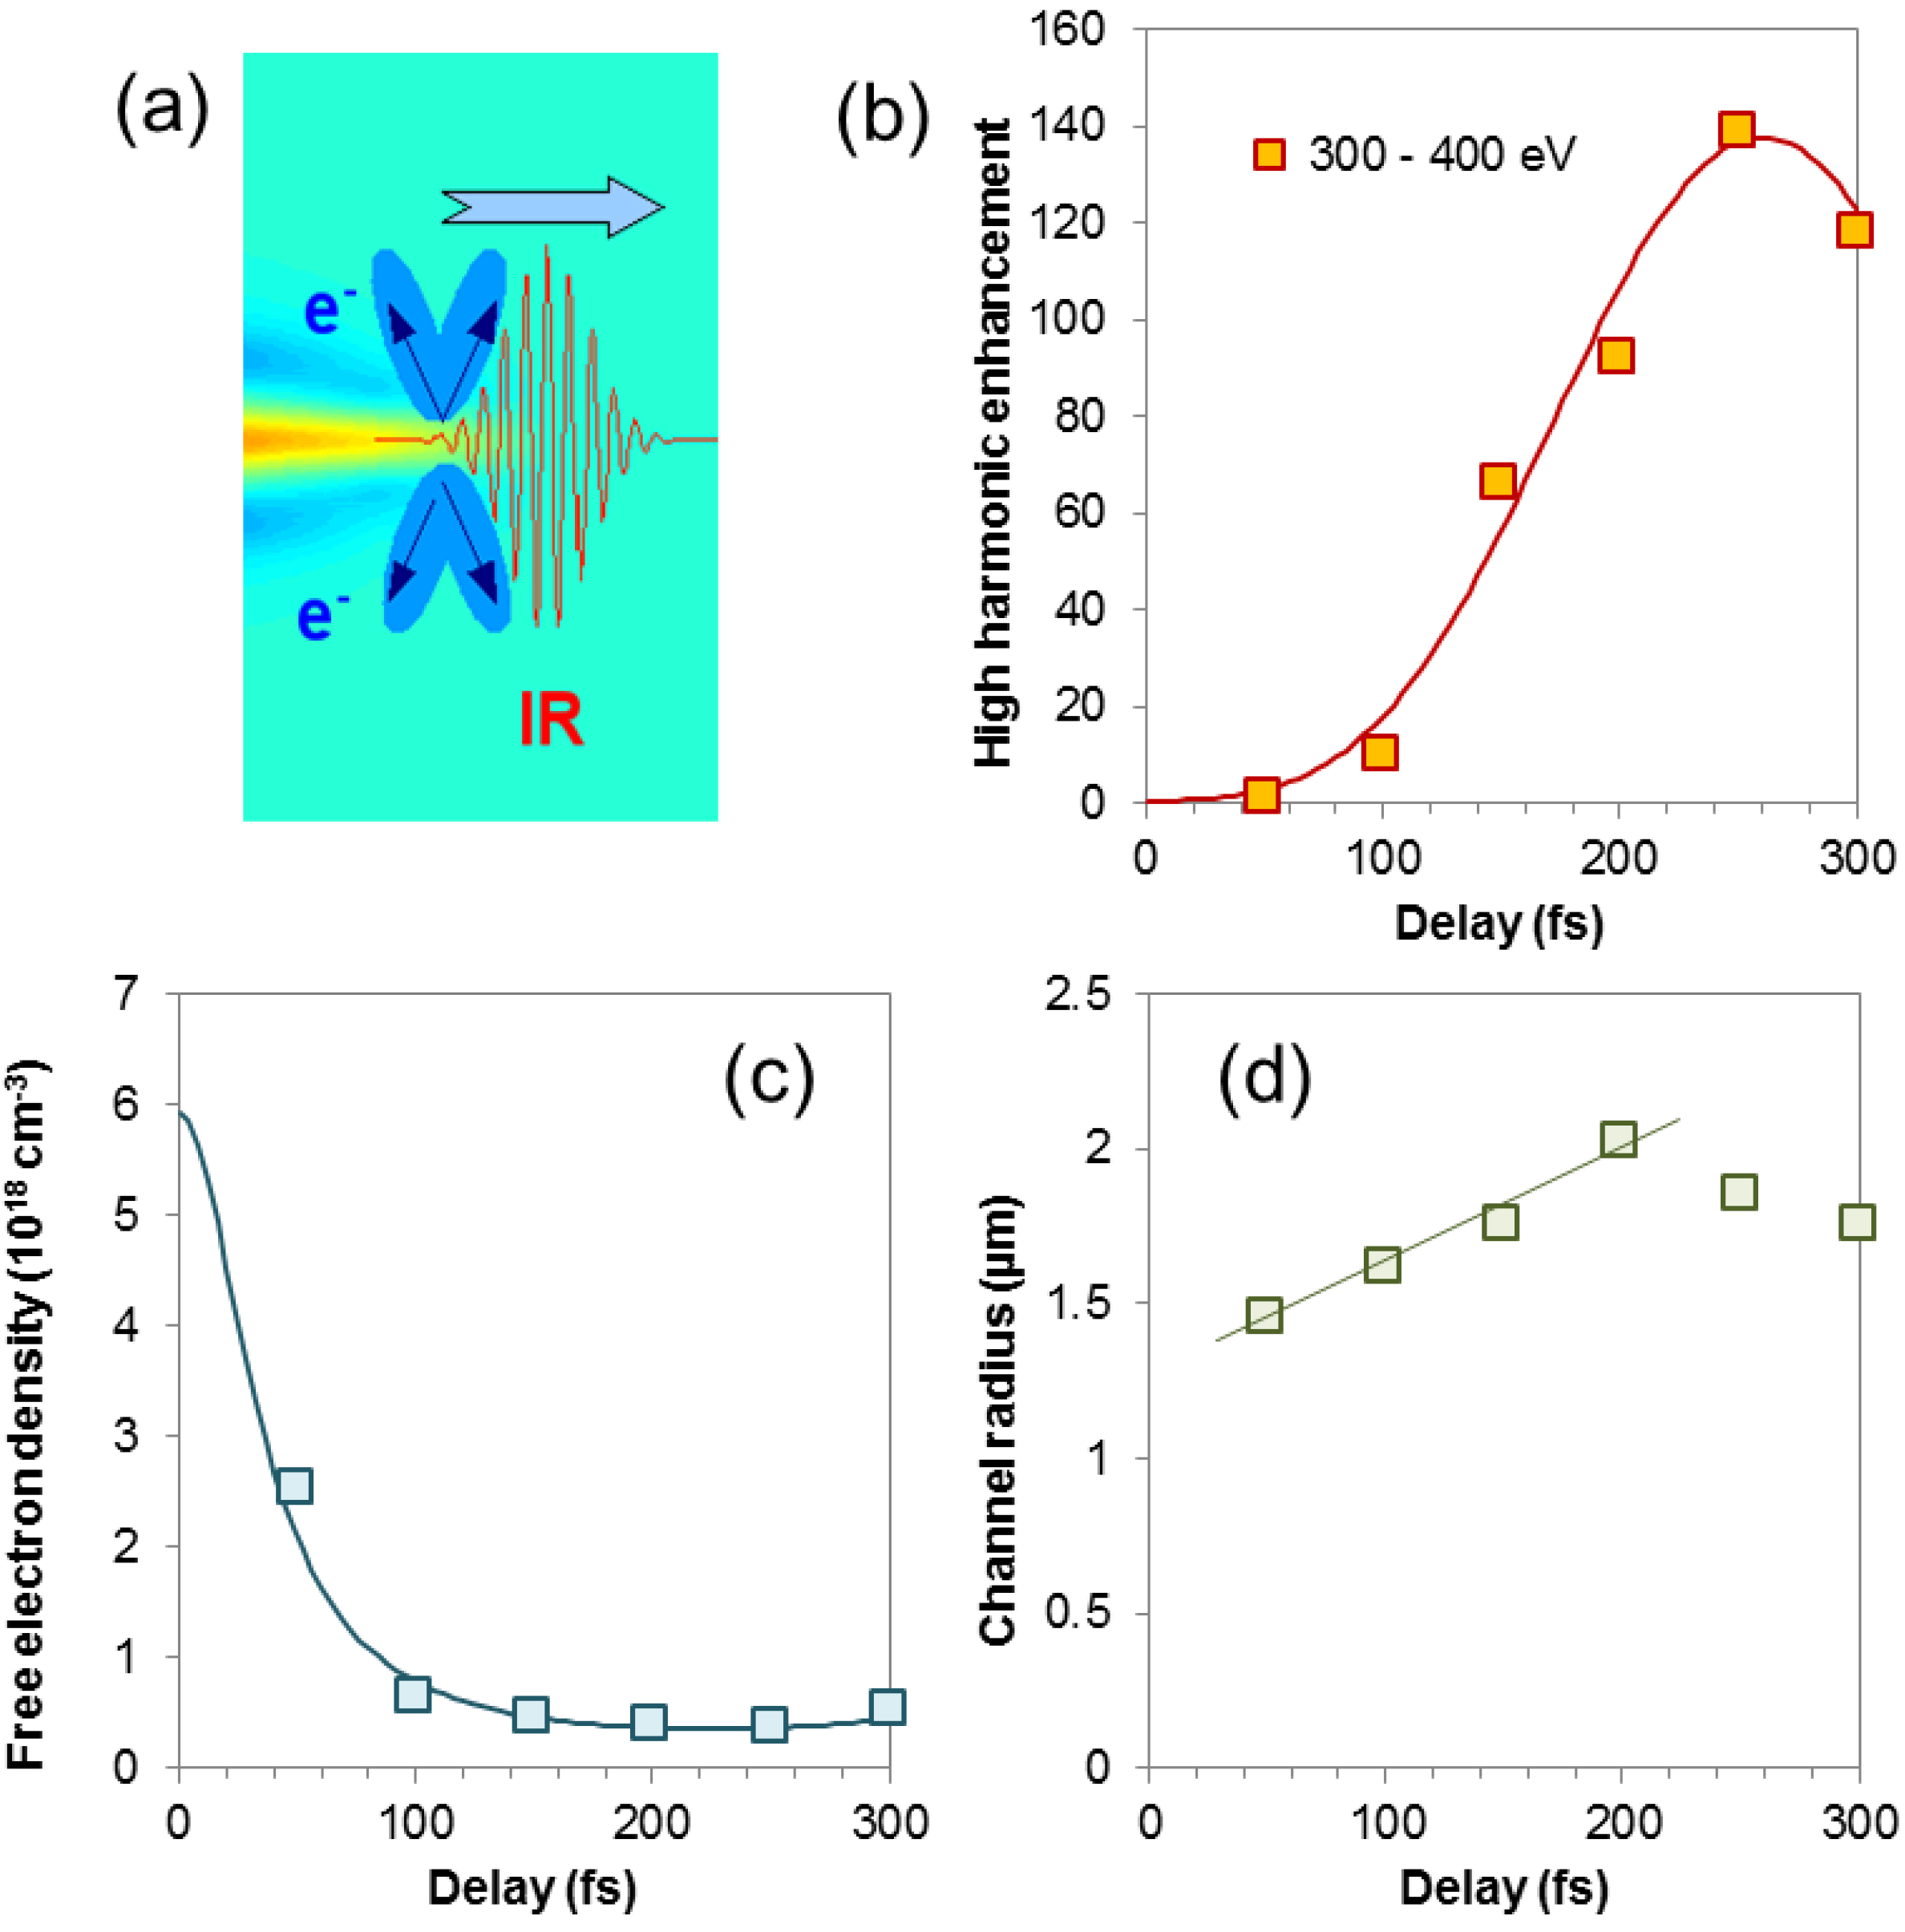
The effect of phase matching can be also seen in Figure 6b. The harmonics signal is integrated in the range of 300–400 eV and plotted as a function of the time delay. Once again, the curve shows a well-pronounced maximum at around 250 fs in agreement with the results displayed in Figure 5. Our result can be well explained in the following way: Better phase matching is the consequence of the reduced free electron density at the position of high harmonic generation. Higher order harmonics are generated closer to the optical axis, because the beam waist of the harmonic beam is inversely proportional to the square-root of the harmonic order: w q 0 = w 10 / q , where w 10 is the beam waist of the driving laser beam. At a delay of around 100 fs, the periodic modulation of the HHG spectrum starts at around 300 eV, which means that only a small area near the optical axis is free of electrons. For a delay of 250 fs, the periodic modulation already starts at about 100 eV, indicating that the radius of the electron-free ion channel increased, corresponding also to the optimum condition for HHG. Figure 6 shows the most important parameters of the ion channel. Using Equation (5), the on-axis free electron densities at different time delays were calculated. These decrease by about one order of magnitude within the first 100 fs (see Figure 6c). Consequently, the harmonic intensity, generated in the channel, should increase by about two-orders of magnitude, which is in very good agreement with the measured numbers (Figure 6b). After a very rapid formation of the channel within the first 50 fs, the radius of the ion channel (Figure 6d) increases slowly up to a delay of 200 fs, yielding a more or less constant electron speed of about 3.8 × 10⁶ m/s in this range.
Figure 6. (a) An electron-free ion channel is formed by an intense ionizing laser pulse. (b) The delayed second pulse efficiently generates HHG from the ions, and the near-axis HHG signal as a function of the delay has been measured. From the measured spectra, we can estimate (c) the free electron density and (d) the channel radius as a function of the delay between the two pulses.
Photonics 02 00104 g006

3. HHG from Multiply Scattered Electrons

In the three-step theory of high harmonic generation, tunnel-ionized electrons are accelerated by the laser field. After about three quarters of an optical cycle, the electron returns to the ion and can recombine. In this case, the excess kinetic energy is emitted as a photon with energy in the extreme ultraviolet spectral range. Ionization and, consequently, recombination happens in every optical half-cycle, resulting in a spectrum consisting of the odd (2i + 1) harmonic of the generated laser frequency. In this section, we report on the HHG experiments showing unexpected harmonic spectra, namely they contain only every fourth (4i + 1) harmonic. We attribute this behavior to the quantum path interference of the harmonic spectra generated by multiple scattered electrons. The results suggest that electrons returning after about two optical cycles provide substantial contributions to the soft X-ray radiation in a spectral range between 200 eV and 1 keV if the conditions for X-ray parametric amplification (XPA) are fulfilled.

3.1. Unusual High Harmonic Line Structure in the 0.2–1 keV Spectral Range

We return to the experimental setup described in detail in Section 2.2 and shown in Figure 1. The 30 fs-long 80-mJ energy pulses of the JETI 10-Hz Ti:sapphire laser system were focused into a helium jet with an on-axis peak intensity of ~5 × 10¹⁵ W/cm². With this setup, we recorded HHG spectra for different gas densities in the jet with a scanning spectrometer (McPherson 248/310G) equipped with a Channeltron 4751G photomultiplier and a 1,200-L/mm grating. The low order harmonics were blocked with a combination of a 200 nm-thick Al and a 100 nm-thick Ti foil. Typical spectra are shown in Figure 2. Beyond the slow modulation of the spectral envelope, as discussed in Section 2.2, there is a fast modulation of the harmonic signal, shown in detail in Figure 7.
Figure 7. The recorded high harmonic spectra for different backing pressure settings exhibit an unexpected harmonic line structure. Only every fourth harmonic line (positions indicated by grey dashed lines) appears in the spectra instead of the expected all odd harmonics.
Photonics 02 00104 g007
The recorded spectra in some selected spectral ranges show an unexpected behavior: Contrary to the expected appearance of all odd (2i + 1) harmonics, only every fourth harmonic (4i + 1) is present. This feature is very obvious at low (0.2 and 0.3 bar) backing pressure, where harmonic lines are well separated and have a high contrast. Above 0.4 bar, the contrast is reduced, and the missing (4i + 3) lines start to appear. At even higher backing pressure (above 0.7 bar), the measured harmonic signal saturates, and the harmonic line structure becomes hardly recognizable. In the next chapter, we will present a detailed discussion about the origin of the observed behavior.

3.2. Multiple Scattered Electron Trajectories and the Effect of the Impact Parameter of XPA

In this section, we examine the quantum path interference of two dominant electron trajectories, which can explain the spectra, as shown in Figure 7. Our model [22,24] is based on the traditional three-step model for high-order harmonic generation [18]. Atoms are mainly ionized in a strong laser field near the maximums of the electric field, which can happen in every optical half cycle (OHC). In addition to the model described in [18], in our present calculation, the trajectory of the freed electron is governed by the electric and the magnetic fields of the laser beam and the Coulomb potential of the ion [22,24]. Only if the electron is ionized in a certain limited temporal window, it will return to the ion. If at the instance of return, the distance of the electron from the ion (impact parameter) is fairly large, it cannot recombine. It will be elastically scattered and further accelerated in the laser field. After several returns and scatterings, the distance of the electron from the ion can be suitably small, and now, the electron can recombine and emit its excess kinetic energy as an X-ray photon. If, at the time of recombination, the distance of the electron from the ion and its energy obey the following resonance condition in [22] as Equation (3):
ω r e 4 π ε 0 m e b 3
stimulated emission of the X-ray photon by parametric interaction can take place. Here, ω r is the resonance frequency and b is the impact parameter. In the following, we present two scenarios assuming that: (i) the electron recombines after the first return; and (ii) the electron recombines after several scatterings.
(i) At moderate laser intensities, at about 5 × 10¹⁴ W/cm², the kinetic energy of the electron is sufficient for HHG in the spectral range below ~120 eV. In this range, high-order harmonics are generated, if the released electron returns to the atom for the first time, which happens about three quarters of an optical cycle after ionization. In Figure 8a, we present the corresponding electron trajectories for electrons released six or seven OHC before the intensity maximum of the 30 fs-long laser pulse, respectively. If the electron does not recombine with the ion at the first re-collision, it moves further away from the ion and never returns, which is caused by the strong perturbation of the Coulomb potential. This can be clearly seen in Figure 8b, where the distance of the electron from the ion is shown for the same temporal windows as in Figure 8a. In Figure 8c, we present the calculated recombination energy of the electron for both electron trajectories. The quoted energy is proportional to the energy of the emitted photon, if the electron recombines with the ion at the given place. The figures show also that the electron returns only once, implying two possible returns in every optical cycle and the well-known generation of odd (2i + 1) harmonics. Additionally, the electron gets close to the ion with suitable energy and distance at the same time for the parametric resonance (crossing the orange dashed line in Figure 8c), making stimulated emission and parametric amplification feasible at around 100 eV of photon energy.
Figure 8. The electron trajectory calculation shows different features (ac) at moderate 5 × 10¹⁴ W/cm² and (df) at high 5 × 10¹⁵ W/cm² laser intensities in helium ionized by a 30 fs-long laser pulse. The laser is polarized along the x-direction and propagates along the z-axis. (a,d) The electron is ionized six or seven optical half-cycles (OHCs) before the intensity maximum and follows a certain trajectory in the x-z space. After ionization, the electron is pulled away by the distance r and can return after a time, as shown in (b,e). Together with the recombination energy of the electron (Wrec), the resonance energies for X-ray parametric amplification (XPA) are also plotted with an orange dashed line in (c,f) calculated by Equation (8).
Photonics 02 00104 g008
(ii) For a ten-times higher laser intensity (above 5 × 10¹⁵ W/cm²) at the first return to the ion, the electron is rather far away (z ≈ 0.3 nm, in Figure 8d) and the recombination probability is very low. With a much higher probability, the electron is accelerated further and has the chance to recombine about one or more optical cycles later. Examples for stable multiple scattered electron trajectories are plotted in Figure 8d assuming ionization of six and seven OHCs before the intensity maximum of the laser pulse. The corresponding release times of the electrons were 64 as and 62 as after the maximum of the electric field, respectively. The re-collision distances of these trajectories are suitably small at the third return after a flight time of about a 15/8 optical cycle. The distance of the electron from the ion is also calculated for this pair of trajectories together with two other trajectories with a slightly different release time of 67 as and 71 as, respectively, which are plotted as dashed lines in Figure 8e. Electrons following these trajectories re-collide at the fourth return, about a 17/8 optical cycle after their release. As can be seen in Figure 8e, four possible electron trajectories exist in every optical cycle, which are linked to an impact parameter suitably small to fulfil the resonance condition (crossing the orange line in Figure 8f) for XPA in the few–100 eV regime. Consequently, the generated spectrum consists only of every second odd harmonics (4i + 1), in contradiction to the conventional high harmonic spectrum. This interference of the harmonic spectra caused by multiply-scattered electrons explains the unusual harmonic line structure presented in Figure 7 very well. Further evidence for our model will be provided by an additional experiment described in Section 3.4.

3.3. Multiple Scattered Electron as a Source of Multi-keV HHG

In the previous section, we proved that multiple scattered electrons can produce high-order harmonics and even suitable conditions for XPA in the few–100-eV spectral range. In this section, we present calculations to show multiple scattered electrons also supporting HHG in the few-keV spectral range. The calculation follows the experimental condition described in Section 2.3: the duration of the laser pulse was 6 fs, and the peak intensity was chosen to 2.5 × 10¹⁶ W/cm². Figure 9a shows two calculated electron trajectories when the electrons were released at the leading edge of the laser pulse, four and five OHCs before the intensity maximum and 141 as and 0 as before the electric filed maximum of the corresponding OHC, respectively. For such a short pulse, the amplitude of the electric field changes significantly from one optical cycle to the next. The trajectory of the earlier ionized electron (green line in Figure 9) shows a re-collision at the first return (Figure 9b) and fulfils the resonance condition for XPA just above 100 eV; see Figure 9c. The other trajectory (blue) for the electron released one OHC later shows multiple scattering. The numbers of returns are labelled in Figure 9b,c. The energy and distance of the electron suitable for XPA at the third return at ~3 keV of photon energy and can explain very the well the observed high energy cut-off in the experiment summarized in Figure 4.
Figure 9. (a) Electron trajectories for a 6 fs-long laser pulse with a 2.5 × 10¹⁶ W/cm² peak intensity. (b) Temporal evolution of the distance of the electron from the ion. The red dashed line is the electric field of the laser pulse. (c) Recombination energy of the electron during its flight for the two possible trajectories.
Photonics 02 00104 g009

3.4. Experiment 4: Unusual High Harmonic Line Structure in Ne

The measurement was performed with the PHELIX (Petawatt Hoch- Energie Laser für SchwerIoneneXperimente) laser system at the GSI Helmholtz Centre for Heavy Ion Research. The preamplifier of the petawatt-scale Nd:glass laser system delivered 400 fs-long pulses with an energy of 370 mJ at a 10-Hz repetition rate. The pulses were focused into a neon gas jet. The emitted high-order harmonics spectra were measured with an imaging spectrograph consisting of a flat-field grating (1200 L/mm from Hitachi) and a cooled X-ray CCD camera (Andor DX420) after suppression of the laser light with two 200 nm-thick Al foils. The peak intensity in the gas was ~1 × 10¹⁵ W/cm², which is too high for supporting electron trajectories with an impact parameter suitable for giving parametric resonance in the examined spectral range at the first recollision. However, this intensity is in a range sufficient to generate harmonics by multiply-scattered electrons under resonance conditions. The rather long pulse results in narrow and, consequently, well-distinguishable harmonic lines, as shown in Figure 10. While the spectrum contains every odd harmonic, three different sets of harmonic lines can be recognized. (1) Intense harmonic lines are at the positions of the (4i + 1) harmonics with some blue shift. The positions of the (4i + 1) harmonics are marked with thick dashed lines. (2) The harmonic lines at the positions of (4i + 3) are weak (marked with thin grey dashed lines). (3) The conventional harmonic lines are marked with red for their expected position.
Figure 10. (a) Using 400 fs-long laser pulses with a peak intensity of ~1 × 10¹⁵ W/cm², we observed harmonic lines from neon explained by multiply re-scattered electrons. The harmonics orders (4i + 1) and (4i + 3) are marked by thick and thin black dashed lines, respectively. (b) Fourier transform of the measured spectrum.
Photonics 02 00104 g010
According to the earlier presented electron trajectory analysis, we can interpret the measured spectrum in the following way. The strong and weak lines can be explained very well by the quantum path interference of multiple scattered electron trajectories, and the corresponding harmonics (marked in blue) were generated in the high intensity part of the laser pulse and are not exactly at their expected position. The observed blue shift is the consequence of the non-linear interaction of the laser pulse in the gas medium. Contrarily, the standard harmonic lines ((2i + 1); marked with red) are generated at the low intensity leading part of the laser pulse, and so, they do not show a blue-shift, because of the lower intensity. The Fourier transform of the spectrum is plotted in Figure 10b. It exhibits distinct peaks at two main positions of a quarter and half optical cycle and their odd (three and five) multiples up to 2.25 optical cycles with some shift as a consequence of the blue shift in the harmonic spectrum. The Fourier components of the three quarter and one and half optical cycle are missing. The line at half an optical cycle corresponds to the common odd (2i + 1) harmonics, while the line at one quarter of an optical cycle fits very well with the uncommon (4i + 1) harmonic line structure.

4. Conclusions

We investigated phase matching in the macroscopic build-up of high harmonics in the 0.2–3-keV spectral range with laser intensity and laser pulses in a wide parameter range. From the modulation of the measured spectral envelope, we were able to determine the phase matching conditions and the free electron density in the nonlinear medium. Using a double-pulse excitation scheme with multi-cycle laser pulses, we created an electron-free channel in the gas, which improved the phase matching conditions and the conversion efficiency by about two orders of magnitude. Furthermore, we demonstrated that a few-cycle laser pulse as short as 6 fs is suitable to efficiently generate harmonics up to 3 keV with improved phase matching.
By performing an electron trajectory analysis, we found that in the few–100-eV and few-keV photon energy range, the harmonics were generated via multiply-scattered electrons. Furthermore, we found that the impact of these electron trajectories can be observed in the high harmonic spectra, producing spectra of only every fourth (4i + 1) harmonic in the few–100-eV spectral range. If the conditions for X-ray parametric amplification were fulfilled, the harmonics were efficiently generated, and the quantum-path interference of two dominating trajectories provided the uncommon harmonic line structure. These results together with the examination of the temporal dynamics of the generation process [38] help us to better understand high-order harmonic generation and X-ray parametric amplification at high laser intensities, as well as providing guidelines to extend the generated spectrum to higher photon energies at increased efficiency or to realize efficient, ultrahigh repetition rate [39], high harmonic sources.

Acknowledgments

This study has been sponsored by the DFG Grant TR18 P12, SE 1911/1-1, TMBWK (Thüringer Ministerium für Bildung, Wissenschaft und Kultur) Grant B 715-08008 and the European Fund for Regional Development (EFRE), the EC’s 7th Framework Program (Grant 284464, Laserlab Europe HIJ-FSU0019152). E.S. acknowledges support from the FSU (Friedrich-Schiller-Universität) grant “ProChance 2009 A1”. The authors acknowledge the support and contribution of the JETI and PHELIX laser team.

Author Contributions

J.S., E.S., T.K. and C.S. designed the experiments and wrote the manuscript; J.S., E.S., B.L. and B.A. conducted the X-ray experiments; J.S. developed the theory. All authors analysed the data and contributed to the completion of the manuscript.

Conflict of Interest

The authors declare no conflict of interest.

References

  1. Swoboda, M.; Fordell, T.; Klunder, K.; Dahlstrom, J.M.; Miranda, M.; Buth, C.; Schafer, K.J.; Mauritsson, J.; L’Huillier, A.; Gisselbrecht, M. Phase Measurement of Resonant Two-Photon Ionization in Helium. Phys. Rev. Lett. 2010, 104, 103003. [Google Scholar] [CrossRef] [PubMed]
  2. Loh, Z.-H.; Leone, S.R. Capturing Ultrafast Quantum Dynamics with Femtosecond and Attosecond X-ray Core-Level Absorption Spectroscopy. J. Phys. Chem. Lett. 2013, 4, 292–302. [Google Scholar] [CrossRef]
  3. Chen, S.; Bell, M.J.; Beck, A.R.; Mashiko, H.; Wu, M.; Pfeiffer, A.N.; Gaarde, M.B.; Neumark, D.M.; Leone, S.R.; Schafer, K.J. Light-induced states in attosecond transient absorption spectra of laser-dressed helium. Phys. Rev. A 2012, 86, 063408. [Google Scholar] [CrossRef]
  4. Hentschel, M.; Kienberger, R.; Spielmann, C.; Reider, G.A.; Milosevic, N.; Brabec, T.; Corkum, P.; Heinzmann, U.; Drescher, M.; Krausz, F. Attosecond metrology. Nature 2001, 414, 509–513. [Google Scholar] [CrossRef] [PubMed]
  5. Paul, P.M.; Toma, E.S.; Breger, P.; Mullot, G.; Auge, F.; Balcou, Ph.; Muller, H.G.; Agostini, P. Observation of a Train of Attosecond Pulses from High Harmonic Generation. Science 2001, 292, 1689–1692. [Google Scholar] [CrossRef] [PubMed]
  6. Ade, H.; Stoll, H. Near-edge X-ray absorption fine-structure microscopy of organic and magnetic materials. Nat. Mater. 2009, 8, 281–290. [Google Scholar] [CrossRef] [PubMed]
  7. Seres, E.; Seres, J.; Spielmann, C. Time resolved spectroscopy with femtosecond soft X-ray pulses. Appl. Phys. A 2009, 96, 43–50. [Google Scholar] [CrossRef]
  8. Seres, E.; Spielmann, C. Time-resolved optical pump X-ray absorption probe spectroscopy in the range up to 1 keV with 20 fs resolution. J. Mod. Opt. 2008, 55, 2643–2651. [Google Scholar] [CrossRef]
  9. Seres, E.; Seres, J.; Krausz, F.; Spielmann, C. Generation of Coherent Soft X-ray Radiation Extending Far Beyond the Titanium L Edge. Phys. Rev. Lett. 2004, 92, 163002. [Google Scholar] [CrossRef] [PubMed]
  10. Takahashi, E.J.; Kanai, T.; Ishikawa, K.L.; Nabekawa, Y.; Midorikawa, K. Coherent Water Window X-Ray by Phase-Matched High-Order Harmonic Generation in Neutral Media. Phys. Rev. Lett. 2008, 101, 253901. [Google Scholar] [CrossRef] [PubMed]
  11. Xiong, H.; Xu, H.; Fu, Y.; Yao, J.; Zeng, B.; Chu, W.; Cheng, Y.; Xu, Z.; Takahashi, E.J.; Midorikawa, K.; et al. Generation of a coherent x ray in the water window region at 1 kHz repetition rate using a mid-infrared pump source. Opt. Lett. 2009, 34, 1747–1749. [Google Scholar] [CrossRef]
  12. Ishii, N.; Kaneshima, K.; Kitano, K.; Kanai, T.; Watanabe, S.; Itatani, J. Carrier-envelope phase-dependent high harmonic generation in the water window using few-cycle infrared pulses. Nat. Commun. 2014, 5, 3331. [Google Scholar] [PubMed]
  13. Cousin, S.L.; Silva, F.; Teichmann, S.; Hemmer, M.; Buades, B.; Biegert, J. High-flux table-top soft X-ray source driven by sub-2-cycle, CEP stable, 1.85-μm 1-kHz pulses for carbon K-edge spectroscopy. Opt. Lett. 2014, 39, 5383–5386. [Google Scholar] [CrossRef]
  14. Seres, J.; Seres, E.; Verhoef, A.J.; Tempea, G.; Streli, C.; Wobrauschek, P.; Yakovlev, V.; Scrinzi, A.; Spielmann, C.; Krausz, F. Laser technology: Source of coherent kiloelectronvolt X-rays. Nature 2005, 433, 596. [Google Scholar] [CrossRef] [PubMed]
  15. Seres, E.; Seres, J.; Spielmann, C. X-ray absorption spectroscopy in the keV range with laser generated high harmonic radiation. Appl. Phys. Lett. 2006, 89, 181919. [Google Scholar] [CrossRef]
  16. Popmintchev, T.; Chen, M.-C.; Popmintchev, D.; Arpin, P.; Brown, S.; Ališauskas, S.; Andriukaitis, G.; Balčiunas, T.; Mücke, O.D.; Pugzlys, A.; et al. Bright Coherent Ultrahigh Harmonics in the keV X-ray Regime from Mid-Infrared Femtosecond Lasers. Science 2012, 336, 1287–1291. [Google Scholar] [CrossRef]
  17. Seres, J.; Seres, E.; Landgraf, B.; Ecker, B.; Aurand, B.; Kuehl, T.; Spielmann, C. High-harmonic generation and parametric amplification in the soft X-rays from extended electron trajectories. Sci. Rep. 2014, 4, 4234. [Google Scholar] [PubMed]
  18. Lewenstein, M.; Balcou, P.; Ivanov, M.Y.; L’Huillier, A.; Corkum, P.B. Theory of high-harmonic generation by low-frequency laser fields. Phys. Rev. A 1994, 49, 2117–2132. [Google Scholar] [CrossRef] [PubMed]
  19. Hatsagortsyan, K.Z.; Klaiber, M.; Müller, C.; Kohler, M.C.; Keitel, C.H. Laser-driven relativistic recollisions. J. Opt. Soc. Am. B 2008, 25, B92–B103. [Google Scholar] [CrossRef]
  20. L’Huilier, A.; Schafer, K.J.; Kulander, K.C. High-Order Harmonic Generation in Xe at 1064 nm: The Role of Phase Matching. Phys. Rev. Lett. 1991, 61, 2200–2203. [Google Scholar] [CrossRef]
  21. Popmintchev, T.; Chen, M.-C.; Bahabad, A.; Gerrity, M.; Sidorenko, P.; Cohen, O.; Christov, I.P.; Murnane, M.M.; Kapteyn, H.C. Phase matching of high harmonic generation in the soft and hard X-ray regions of the spectrum. Proc. Nat. Acad. Sci. USA 2009, 106, 10516–10521. [Google Scholar] [CrossRef] [PubMed]
  22. Seres, J.; Seres, E.; Hochhaus, D.; Ecker, B.; Zimmer, D.; Bagnoud, V.; Kuehl, T.; Spielmann, C. Laser-driven amplification of soft X-rays by parametric stimulated emission in neutral gases. Nat. Phys. 2010, 6, 455–461. [Google Scholar] [CrossRef]
  23. Hammond, T.J.; Mills, A.K.; Jones, D.J. Near-threshold harmonics from a femtosecond enhancement cavity-based EUV source: Effects of multiple quantum pathways on spatial profile and yield. Opt. Express 2011, 19, 24871–24883. [Google Scholar] [CrossRef] [PubMed]
  24. Seres, J.; Seres, E.; Spielmann, C. Classical model of strong-field parametric amplification of soft X-rays. Phys. Rev. A 2012, 86, 013822. [Google Scholar] [CrossRef]
  25. Aurand, B.; Seres, J.; Bagnoud, V.; Ecker, B.; Hochhaus, D.C.; Neumayer, P.; Seres, E.; Spielmann, C.; Zielbauer, B.; Zimmer, D.; et al. Laser driven X-ray parametric amplification in neutral gases—A new brilliant light source in the XUV. Nucl. Inst. Meth. A 2011, 653, 130–133. [Google Scholar] [CrossRef]
  26. Serrat, C. Coherent Extreme Ultraviolet Light Amplification by Strong-Field-Enhanced forward Scattering. Phys. Rev. Lett. 2013, 111, 133902. [Google Scholar] [CrossRef] [PubMed]
  27. Lee, P.A.; Citrin, P.H.; Eisenberger, P.; Kincaid, B.M. Extended X-ray absorption fine structure—Its strengths and limitations as a structural tool. Rev. Mod. Phys. 1981, 53, 769–806. [Google Scholar] [CrossRef]
  28. Seres, E.; Herzog, R.; Seres, J.; Kaplan, D.; Spielmann, C. Generation of intense 8 fs laser pulses. Opt. Express 2003, 11, 240–247. [Google Scholar] [CrossRef] [PubMed]
  29. Seres, J.; Muller, A.; Seres, E.; Herzog, R.; Kaplan, D.; Spielmann, C.; Krausz, F. Sub-10-fs, terawatt-scale Ti:sapphire laser system. Opt. Lett. 2003, 28, 1832–1834. [Google Scholar] [CrossRef] [PubMed]
  30. Seres, J.; Wobrauschek, P.; Streli, C.; Yakovlev, V.S.; Seres, E.; Krausz, F.; Spielmann, C. Generation of coherent keV X-rays with intense femtosecond laser pulses. New J. Phys. 2006, 8, 251. [Google Scholar] [CrossRef]
  31. Verhoef, A.J.; Seres, J.; Schmid, K.; Nomura, Y.; Tempea, G.; Veisz, L.; Krausz, F. Compression of the pulses of a Ti:sapphire laser system to 5 femtoseconds at 0.2 terawatt level. Appl. Phys. B 2006, 82, 513–517. [Google Scholar] [CrossRef]
  32. Reagan, B.A.; Popmintchev, T.; Grisham, M.E.; Gaudiosi, D.M.; Berrill, M.; Cohen, O.; Walker, B.C.; Murnane, M.M.; Rocca, J.J.; Kapteyn, H.C. Enhanced high-order harmonic generation from Xe, Kr, and Ar in a capillary discharge. Phys. Rev. A 2007, 76, 013816. [Google Scholar] [CrossRef]
  33. Zepf, M.; Dromey, B.; Landreman, M.; Foster, P.; Hooker, S.M. Bright Quasi-Phase-Matched Soft X-ray Harmonic Radiation from Argon Ions. Phys. Rev. Lett. 2007, 99, 143901. [Google Scholar] [CrossRef] [PubMed]
  34. Ganeev, R.A. High-order harmonic generation in a laser plasma: A review of recent achievements. J. Phys. B 2007, 40, R213–R253. [Google Scholar] [CrossRef]
  35. Arpin, P.; Popmintchev, V.; Wagner, N.L.; Lytle, A.L.; Cohen, O.; Kapteyn, H.C.; Murnane, M.M. Enhanced High Harmonic Generation from Multiply Ionized Argon above 500 eV through Laser Pulse Self-Compression. Phys. Rev. Lett. 2009, 103, 143901. [Google Scholar] [CrossRef] [PubMed]
  36. Schroeder, C.B.; Esarey, E.; Comier-Michel, E.; Leemans, W.P. High-harmonic generation in cavitated plasmas. Phys. Plasmas 2008, 15, 056704. [Google Scholar] [CrossRef]
  37. Seres, J.; Seres, E.; Spielmann, C. Monitoring the He+ ion channel formation by high-order harmonic generation. Opt. Express 2009, 17, 1493–1501. [Google Scholar] [CrossRef] [PubMed]
  38. Seres, J.; Seres, E.; Landgraf, B.; Ecker, B.; Aurand, B.; Hoffmann, A.; Winkler, G.; Namba, S.; Kuehl, T.; Spielmann, C. Parametric amplification of attosecond pulse trains at 11 nm. Sci. Rep. 2014, 4, 4254. [Google Scholar] [PubMed]
  39. Seres, E.; Seres, J.; Spielmann, C. Extreme ultraviolet light source based on intracavity high harmonic generation in a mode locked Ti:sapphire oscillator with 9.4 MHz repetition rate. Opt. Express 2012, 20, 6185–6190. [Google Scholar] [CrossRef] [PubMed]

