Article

Extreme Ultraviolet Stokesmeter for Pulsed Magneto-Optics

1
EMPA, Materials Science and Technology, Überlandstrasse 129, Dübendorf CH-8600, Switzerland
2
Laboratory for Micro- and Nanotechnology, Paul Scherrer Institute, Villigen PSI CH-5232, Switzerland
3
Institut für Angewandte Physik, University of Bern, Sidlerstrasse 5, CH-3012 Bern, Switzerland
*
Author to whom correspondence should be addressed.
Photonics 2015, 2(1), 241-255; https://doi.org/10.3390/photonics2010241
Submission received: 9 January 2015 / Revised: 7 February 2015 / Accepted: 9 February 2015 / Published: 16 February 2015
(This article belongs to the Special Issue Extreme UV Lasers: Technologies and Applications)

Abstract

:
Several applications in material science and magnetic holography using extreme ultraviolet (EUV) radiation require the measurement of the degree and state of polarization. In this work, an instrument to measure simultaneously both parameters from EUV pulses is presented. The instrument determines the Stokes parameters after a reflection on an array of multilayer mirrors at the Brewster angle. The Stokesmeter was tested at Swiss Light Source at different EUV wavelengths. The experimental Stokes patterns of the source were compared with the simulated pattern.

1. Introduction

The specifications of an extreme ultraviolet (EUV) source, such as the coherence, the etendue or the photon energy, discriminate the kind of spectroscopy that could be realized. Multi-spectroscopy is emerging as an enabling tool for nano-structured materials [1], where, by using short-wavelength sources, new cutting-edge applications are made possible. Some of these require information about the polarization properties. Linear polarization emphasizes the anisotropic absorption and the orientations of chemical bonds, while the atomic structural information is obtained from circular or unpolarized radiation [2].
For instance, magnetic dichroism uses circularly-polarized radiation to study the angular momentum in ferromagnetic materials (Fe, Ni, Co) [3]. The magneto-optics Kerr effect (MOKE) has been realized using visible light for describing the polarization cases [4,5,6]. The technique resolves the changes in the electric field rotation and ellipticity for a probe pulse and allows inferring for the actual average magnetization of the sample. The implementation of EUV radiation allows obtaining a stronger magneto-optics effect measured through the scattering cross-section of the beam, a higher magnetic contrast at the absorption edges and a relatively short penetration depth [7,8]. X-ray magnetic circular dichroism (XMCD) consists of obtaining spectral information about of the spin and the orbital magnetic momentum. X-rays are used to excite the atoms of the studied material in order to absorb a photon and give rise to the transition to an unoccupied higher energy level state; e.g., in CoPd, the excitation of the 2d state to the 3d state is induced using circular polarized radiation. When the studied material is antiferromagnetic, the dependency of the magnetization and the scattering amplitude of the spectroscopy increases quadratically. For these cases, the technique is called X-ray magnetic linear dichroism (XMLD) spectroscopy and uses linear polarized radiation [9,10].
Another interesting application is EUV magnetic holography, a lensless imaging technique whose main advantage is that it can overcome the diffraction limit of both the optical and electron microscope [2]. In this technique, the object is illuminated with coherent light, and in the case of magnetic samples, e.g., Co/Pd or Co/Pt multilayers, the radiation must be also polarized. The scattered light from the object interferes with a reference wave and produces a pattern. In order to reconstruct the image of the sample, the amplitude and the phase of the scattered wave are needed. The amplitude is proportional to the magnetic properties of the sample material, and the phase is collected through iterative mathematical algorithms [11,12]. Although, normally, circular polarized light is used for retrieving the magnetic domain pattern by using the XMCD technique mentioned above, in recent years, some investigations have been based on linear polarized radiation [13,14].
Polarimeters have been used in the past to determine the polarization [15,16,17,18]. They operate using two optical elements: (i) a transmission polarizer or retarder; and (ii) a reflection analyzer. Si/Mo and Cd/Sc multilayers of a few nanometers in thickness and approximately 200 layers have been described as the former [19]. They are used as quarter wave-plates to add a phase-shift between the components p and s of the electrical field vector. As a reflection analyzer, several laboratories have used a Rabinovitch detector, which consists of a reflecting material, normally a multilayer mirror, at the Brewster angle of incidence with two or more orientations of the reflector with respect to the optical axis [15,20]. Commonly, the polarizer and the detector are rotatable in order to increase the accuracy of the measurements [19].
Ellipsometry has been demonstrated to be a successful technique for the investigation of dielectric properties in visible and vacuum ultraviolet (VUV). For such proposes, the analyzer detects the differences in the R p and R s reflection components produced by the investigated sample. The technique works by scanning the polarization using, for instance, a rotating analyzer [21]. Recently, Mo/Si multilayers have been also used for ellipsometry, in the ultraviolet range, as analyzers by setting the Bragg angle close to the Brewster angle [22].
The main limitation in these techniques is that they quantify the polarization in steps, i.e., one single component per shot. In this sense, the Stokesmeter has a significant advantage, since it measures simultaneously all four Stokes parameters in the EUV range from a single shot. In the case of shot-by-shot polarization variation, e.g., plasma-driven X-ray lasers, it is necessary to characterize all Stokes components simultaneously.
The aim of this work is to present a measurement technique to address the requirement for simultaneous Stokes parameter measurement in the EUV. The paper is organized as follows: in Section 2.1, we deal with the theoretical background on polarization and the Stokes matrix, then a detailed description of the instrument is given in Section 2.2, and Section 3 shows the experimental calibration results obtained with synchrotron radiation.

2. Materials and Methods

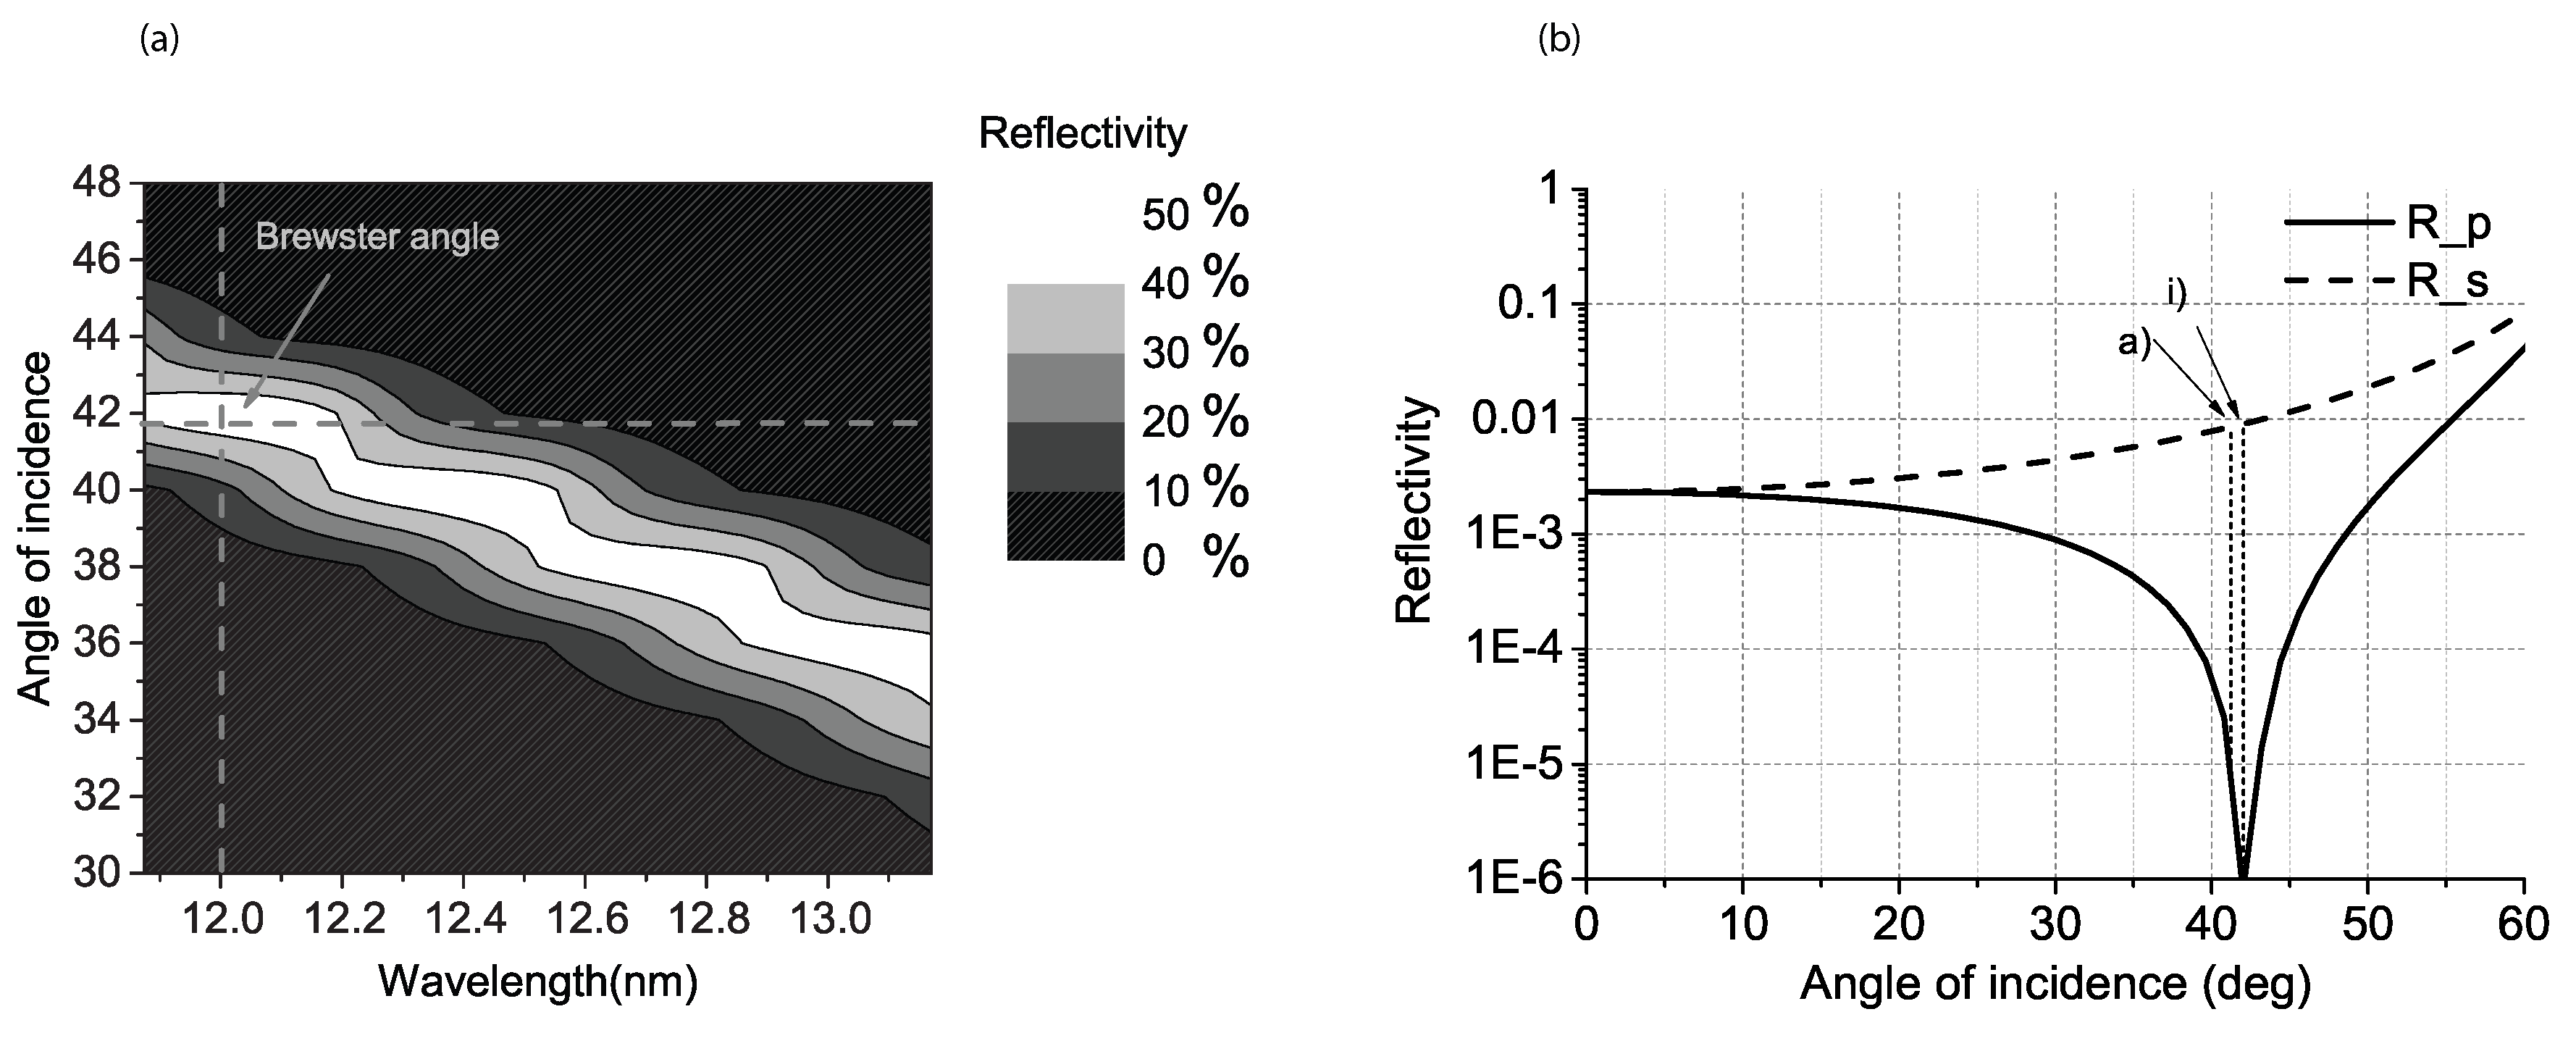
2.1. Theoretical Background

The information of the state (linear or circular) and the degree (ratio between principal axes) of polarization is given by the Stokes vector and its four parameters, I, Q, U and V, defined as follows:
I Q U V = E x 2 + E y 2 E x 2 E y 2 2 E x E y · c o s ( δ ) 2 I m ( E x 2 E y 2 * )
where E x , y is the electric field component, x or y. In such cases of coordinates, δ is defined as atan( E x E y π 4 ) . The four Stokes parameters quantify the polarization state and the orientation of the pulse polarization. The latter is an advantage in comparison with Jones matrices [23], which does not deal with partial polarization.

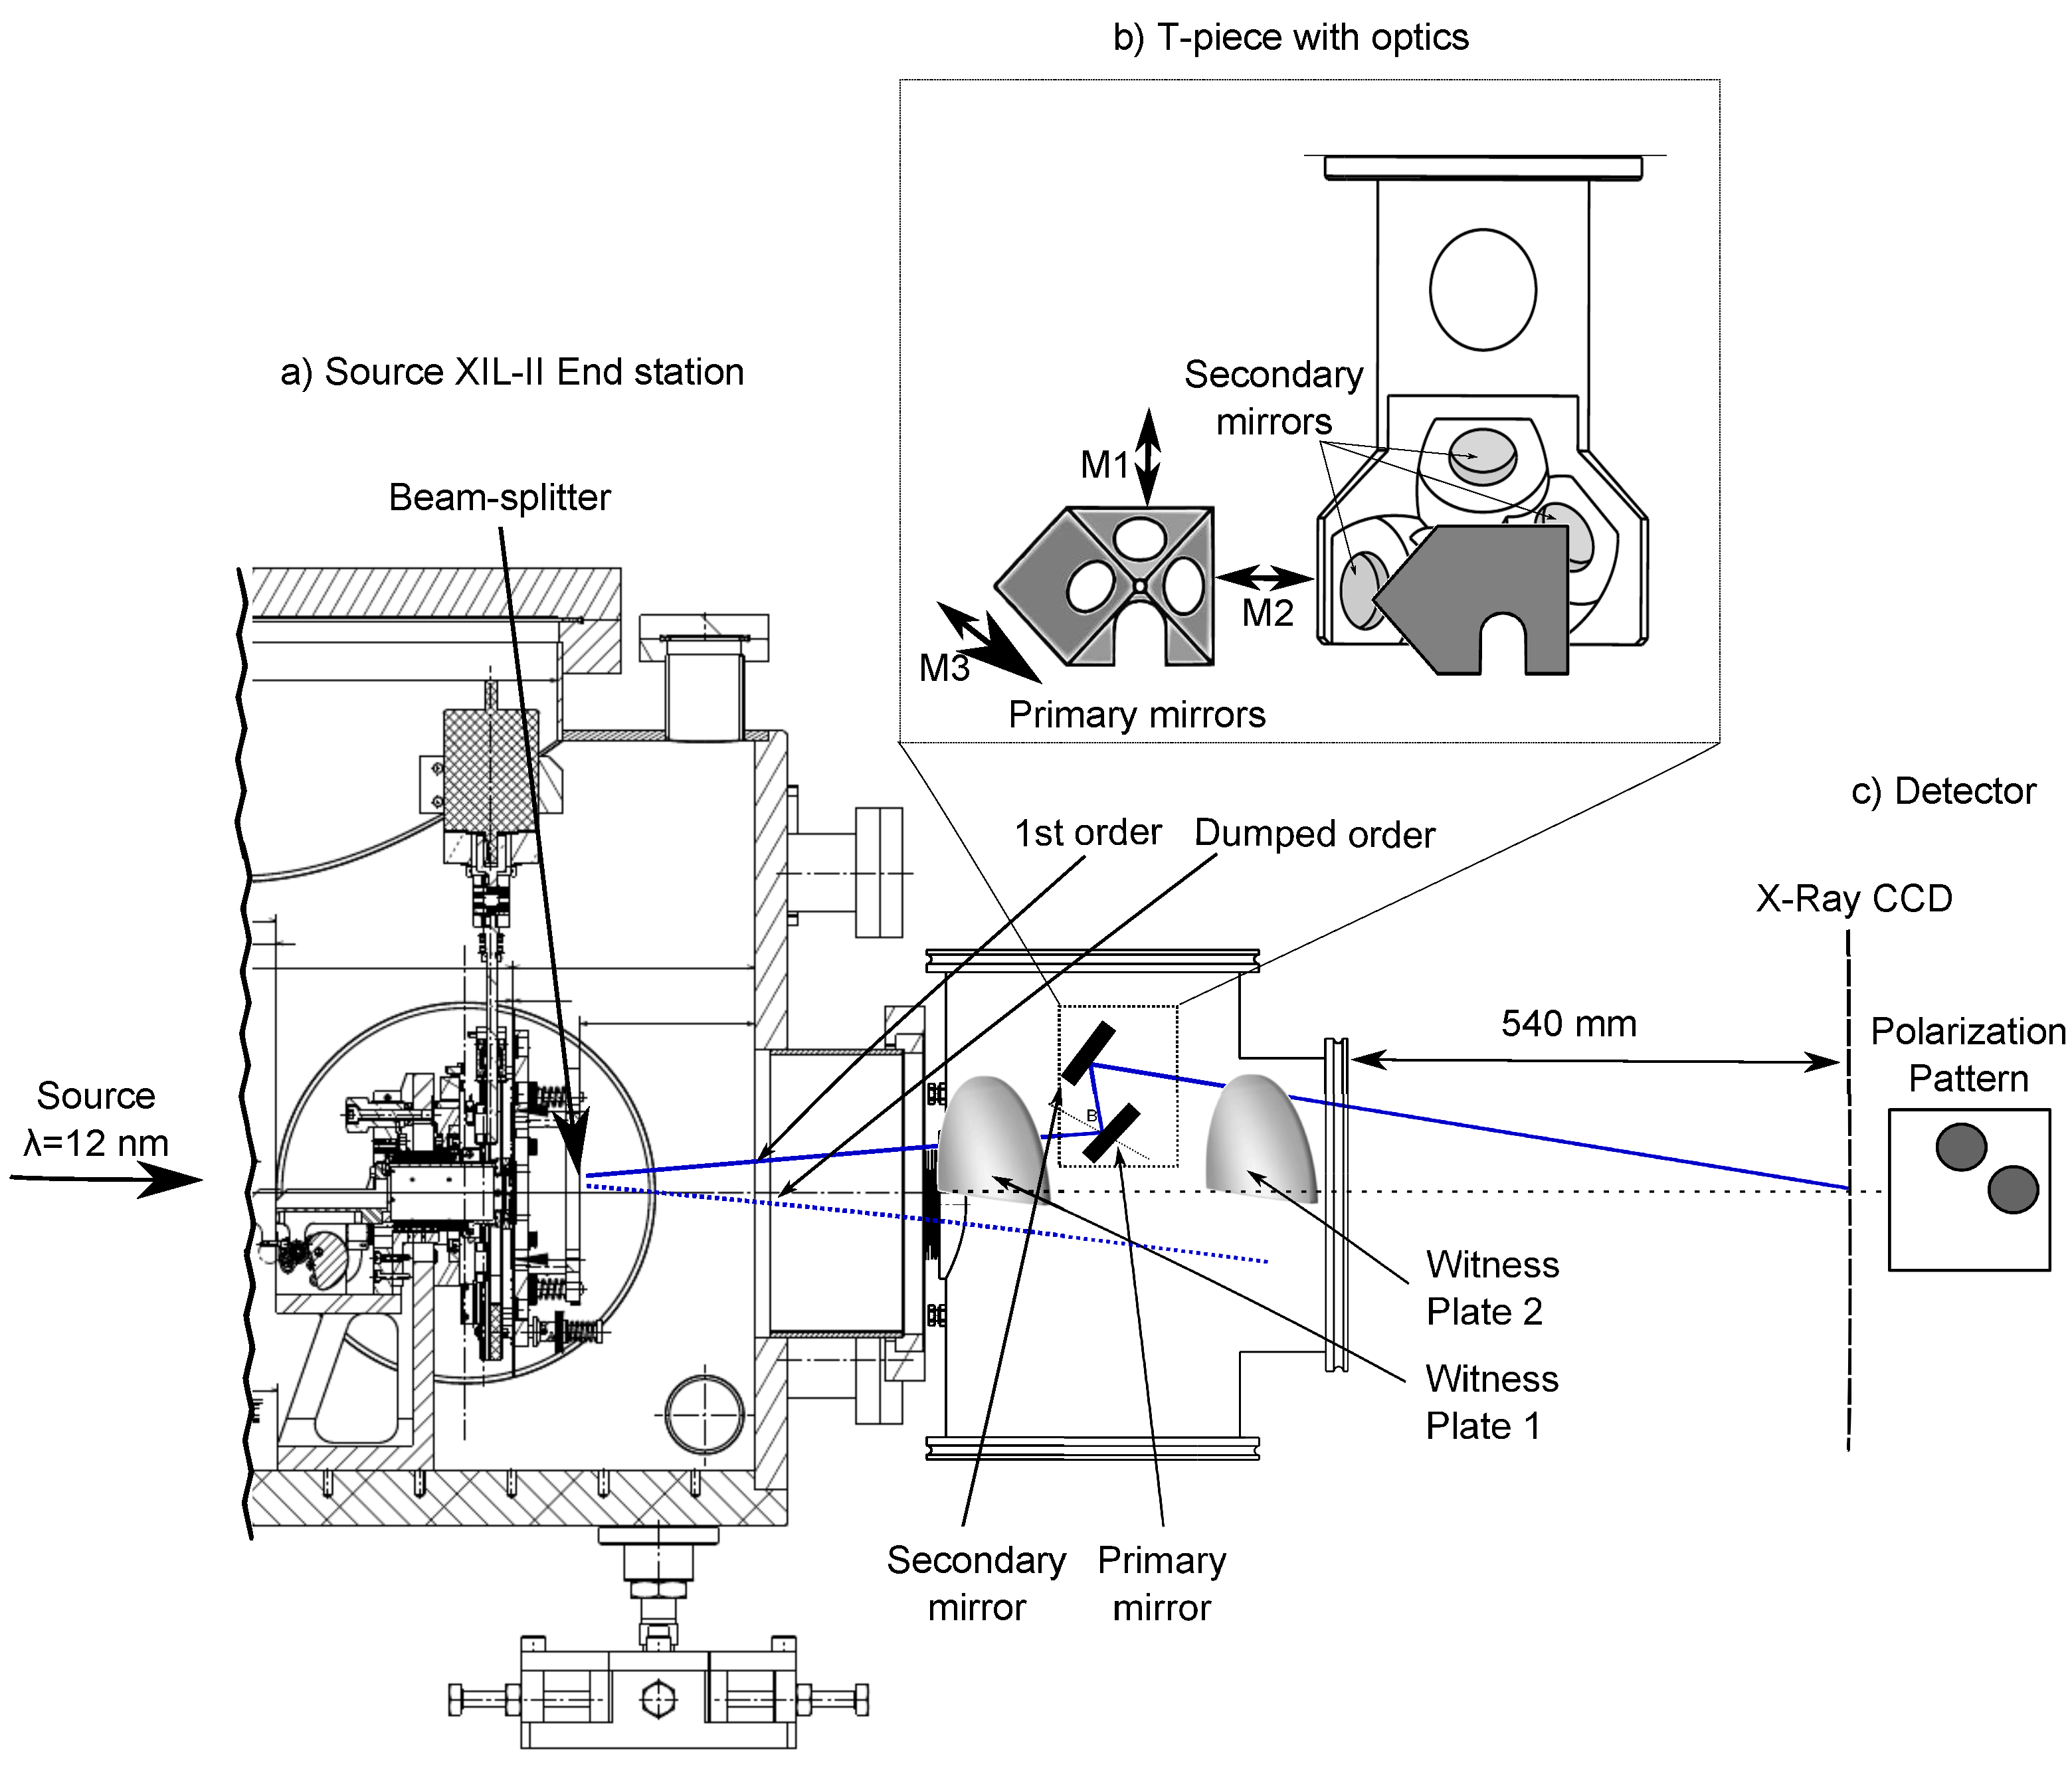
2.2. Experimental Setup

The characterization of the pulse, in terms of polarization, proceeds as follows: in the first place, the simultaneous measurement device (“Stokesmeter”), must provide the signal along an orthonormal Cartesian base (x,y) in order to obtain ± Q . Then, given a 45 -rotated Cartesian base (x’,y’), with the same origin in (x,y), the signal along x’ and y’ is necessary to determinate ± U . Equation (1) describes how the intensity along those orientations is related to the intensity of the signal. To close the Stokes matrix, at least three components have to be known. By knowing parameters I, Q and U, then V can be also determined in modulus. The sign of V gives the chirality of the circularly polarized light. In fact, the circularly-polarized parameter in counter-clockwise and clockwise rotation are defined by + V and V , respectively.
The experiment was performed at the third-generation synchrotron light source (SLS) at the Paul Scherrer Institute (PSI), in the X-ray Interference Lithography (XIL-II) beamline [24]. The beamline radiates energy in the range of 70 to 500 eV. Thanks to a 5 mm × 5 mm pinhole that masks the radiation, the XIL-II provides at the experimental chamber high spatially-coherent illumination. The brightness at extreme ultraviolet is 10 14 photons · s 1 · 0.1% Bandwidth 1 · mm 1 . The radiation is linearly polarized on the horizontal plane.
The Stokesmeter is made up of three parts (Figure 1): (a) the source, produced at the XIL-II end station and containing an EUV beam-splitter realized as a 2D diffraction grating; (b) a main body, realized as a T-piece vacuum tube, carrying the optical parts; and (c) an interface to the detector and the CCD camera. The radiation was split into four branches by using the first diffraction order of a 330-nm period 2D grating (chessboard). Three of the branches interact with the optics. The fourth was dumped into a witness plate to avoid the reflections. Figure 2 shows the grating. It was made using hydrogen silsesquioxane (HSQ) as an absorber. Later, it was exposed to 500 nm of SiO 2 [25]. For the membrane, Si 3 N 4 , was deposited on the top. During the fabrication process, a blank space of HSQ of 5 nm × 5 nm must be included in the tip-to-tip gap, for stability purposes. The grating was fabricated at PSI by e-beam lithography.
Figure 1. Sketch of the Stokesmeter. (a) The X-ray Interference Lithography (XIL-II) end station holds the beam-splitter. (b) The main body of the Stokesmeter is the mount for the optical elements, i.e., the primary and the secondary polarizer mirrors. The primary mirrors are inclined at the Brewster angle along the vertical (M1), horizontal (M2) and 45° (M3) axis. The radiation is monitored at three different positions, i.e., before the optics (Witness Plate 1), after the optics (Witness Plate 2) and at the detector (c).
Photonics 02 00241 g001
The optical set-up shown in Figure 1b is made-up of six Ru/B 4 C multilayer mirrors optimized for a peak reflectivity at λ = 12 nm. Figure 3 shows the measured rocking curve of the polarizers. The bandwidth covers a range between 11.5 nm and 13 nm, the FWHM being higher than 0.5 nm. Such a wavelength has been chosen to be in the EUV lithography range and to be the color of the Sn-Laser. However, the fact that 12 nm is exactly 100 eV can simplify some calculations. A first array of three primary polarizer mirrors is positioned at the Brewster angle ( α B = 41.8 ) along major directions (vertical, horizontal and 45 ), with respect to the incoming beamlets. From now on, we will refer to the orientation of the polarizer as M1 (M, mirror) for vertical, M2 for horizontal and M3 for 45 . In our instrument the reflectivity of the primary polarizers is approximately 50%, as shown in Figure 3. The Brewster angle reflections suppress the transverse-magnetic (TM) polarization (p-polarization) component of 10,000:1. The pattern is made of three spots, which are the footprints of each projected beamlet, M1, M2 and M3, respectively (Figure 1). The intensity of the dots describes the Stokes matrix and the polarization case of the source.
Figure 2. (a) Scanning electron micrograph of a preliminary chessboard beam-splitter design, with pixel dimensions. (b) Final beam-splitter specifications, with the optimized tip-to-tip gap (sketch not to scale).
Photonics 02 00241 g002
Figure 3. Reflectivity versus wavelength of the polarizer multilayer mirrors at the Brewster incident angle (42°).
Photonics 02 00241 g003
The array of “Brewster multilayers” (primary mirrors, Figure 1) is completed with a second array of multilayer mirrors (secondary mirrors, Figure 1) that project the beamlets onto the CCD. The secondary multilayer mirrors are set at 39 , and their efficiency is approximately 55%. They have a 1-inch diameter and are separated from the “Brewster mirrors” by 48 mm. They project the first order of diffraction over 540 mm, where the x-ray CCD collects the radiation.
With the present system, the sign of Stokes parameter V (Equation (1)) remains undetermined, which is redundant, since XIL-II is linearly polarized. A fourth mirror is essential for the sake of circular polarization chirality, as was discussed elsewhere [26]. The intensity of the EUV signal decreases each reflection. A study of the efficiency of each element is detailed in Section 3.
For radiation diagnostics, two witness plates were used as passive detectors. They were Si-wafers, coated with EUVJ-1099 photoresist, which is highly sensitive to EUV. Witness Plate 1 was located before the primary mirrors, while Witness Plate 2 was located after the secondary mirrors. The images were also collected in an X-ray CCD of 1300 × 1340 pixels.

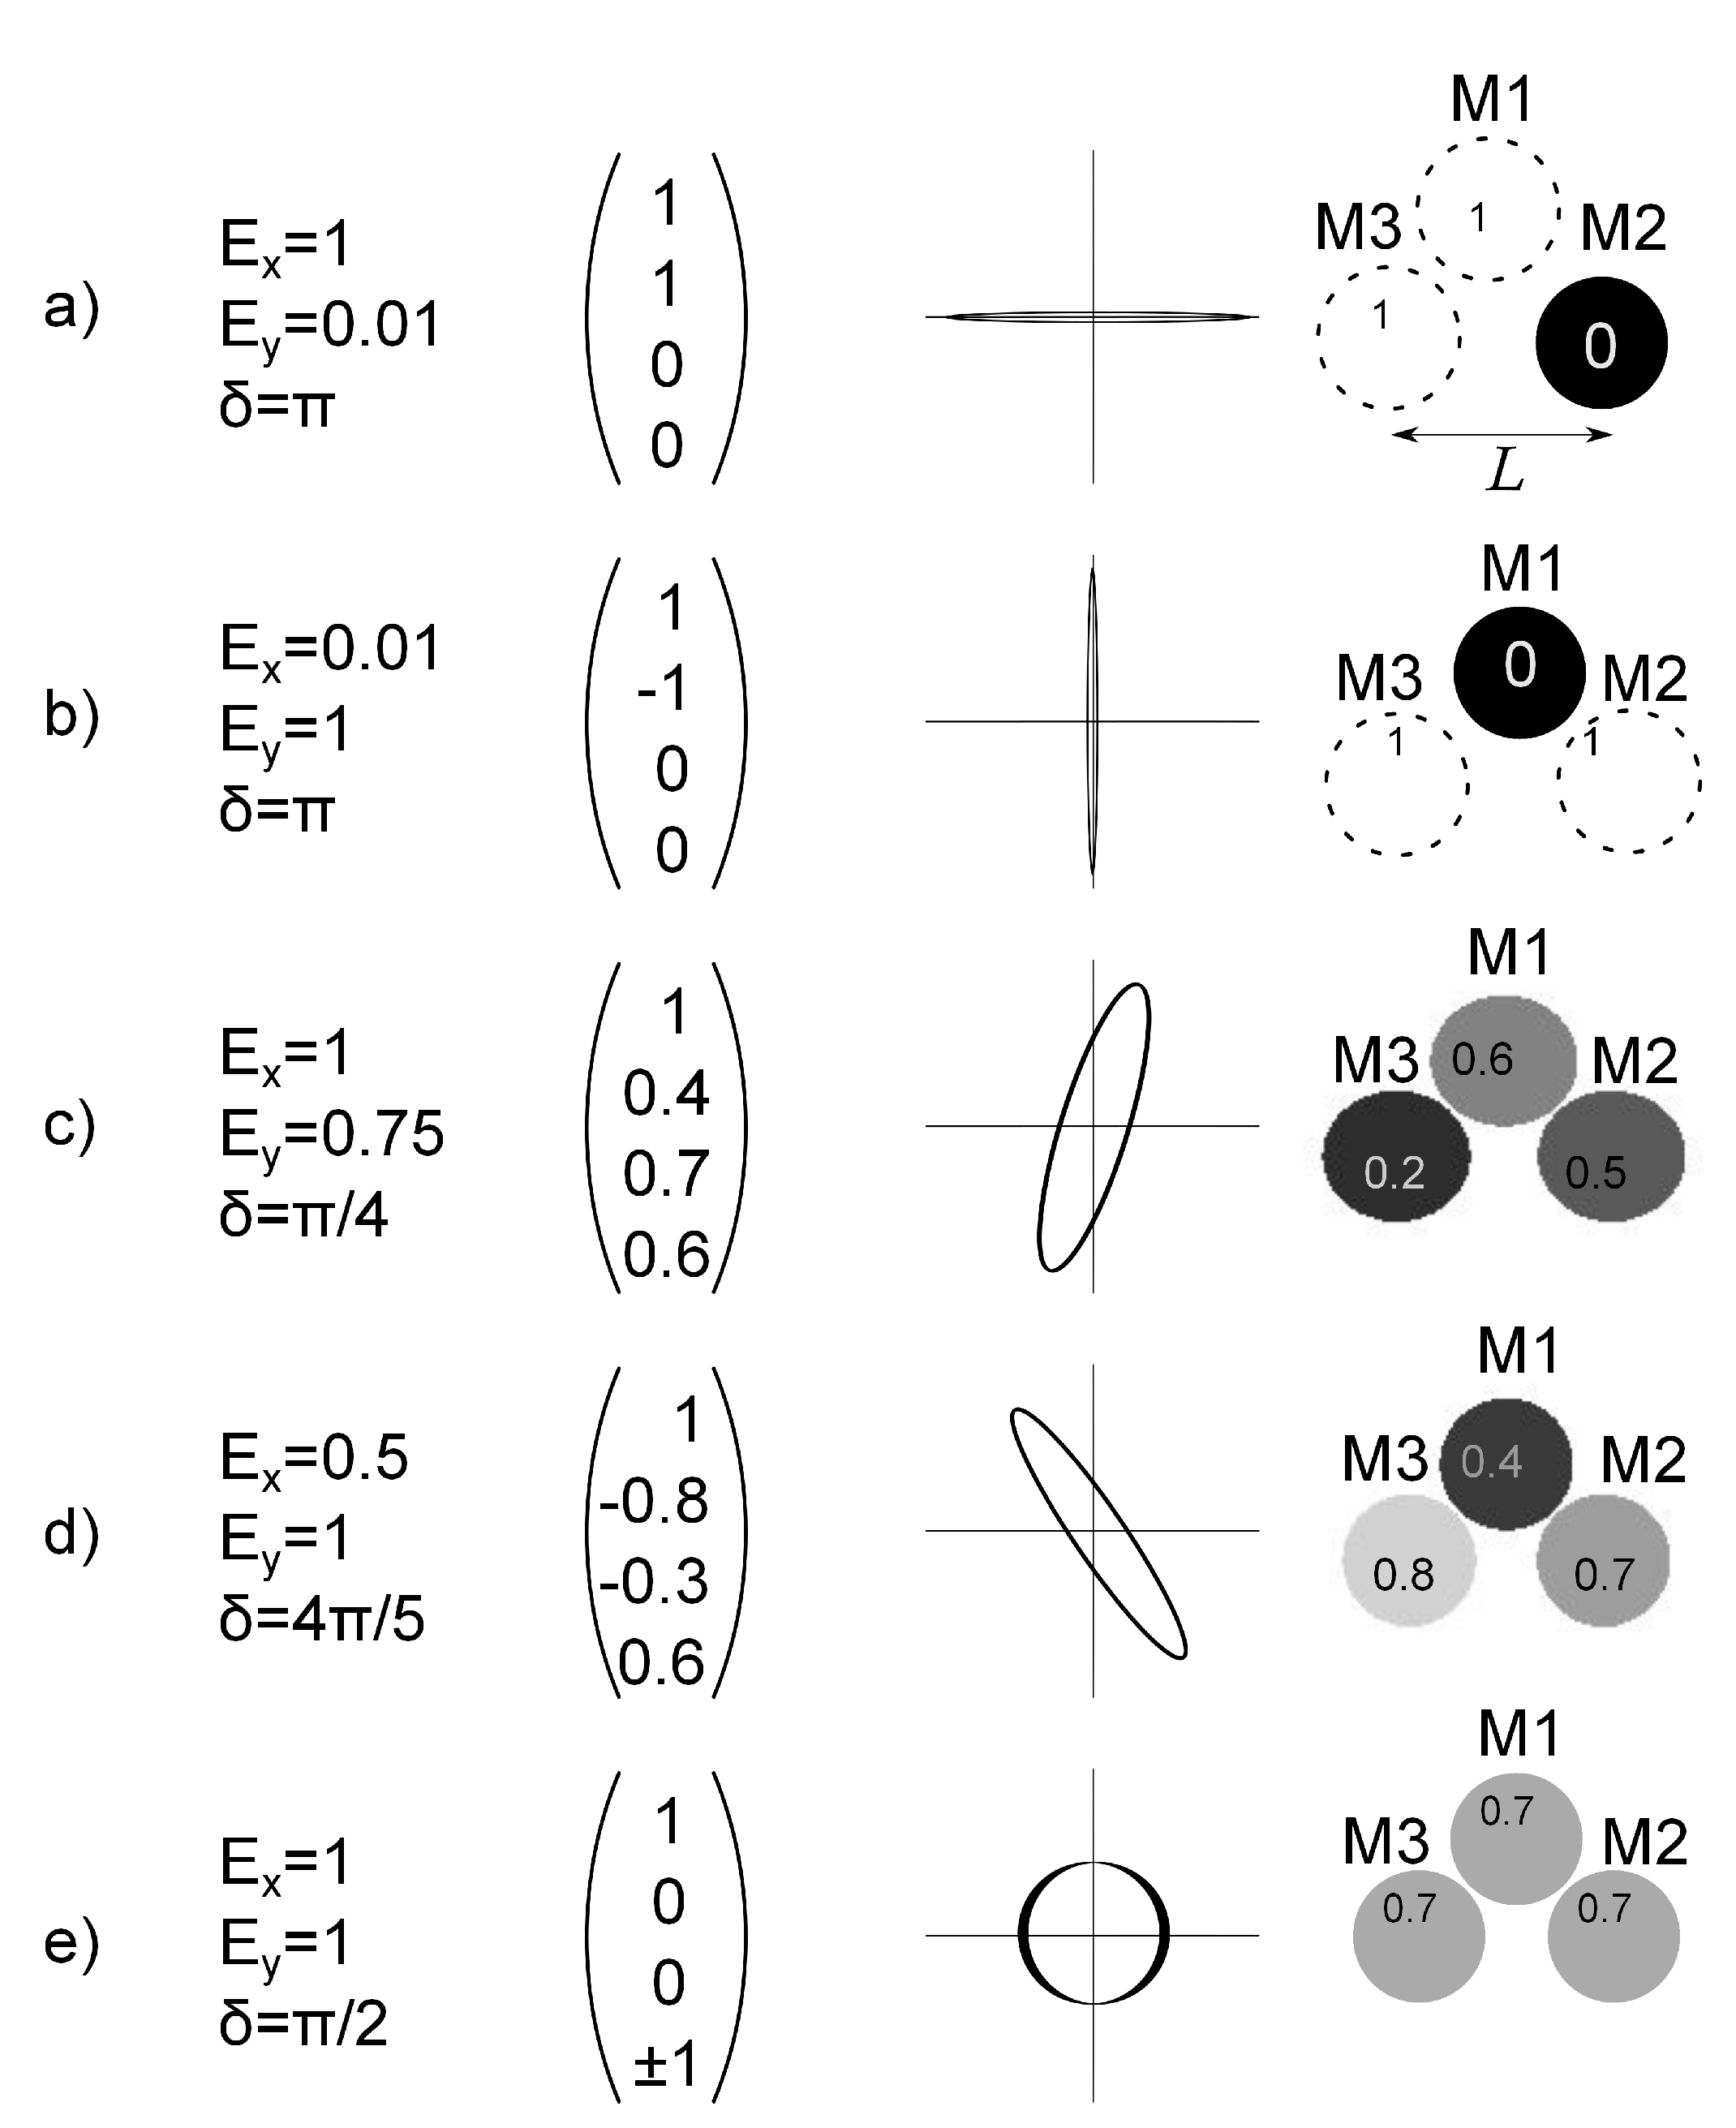
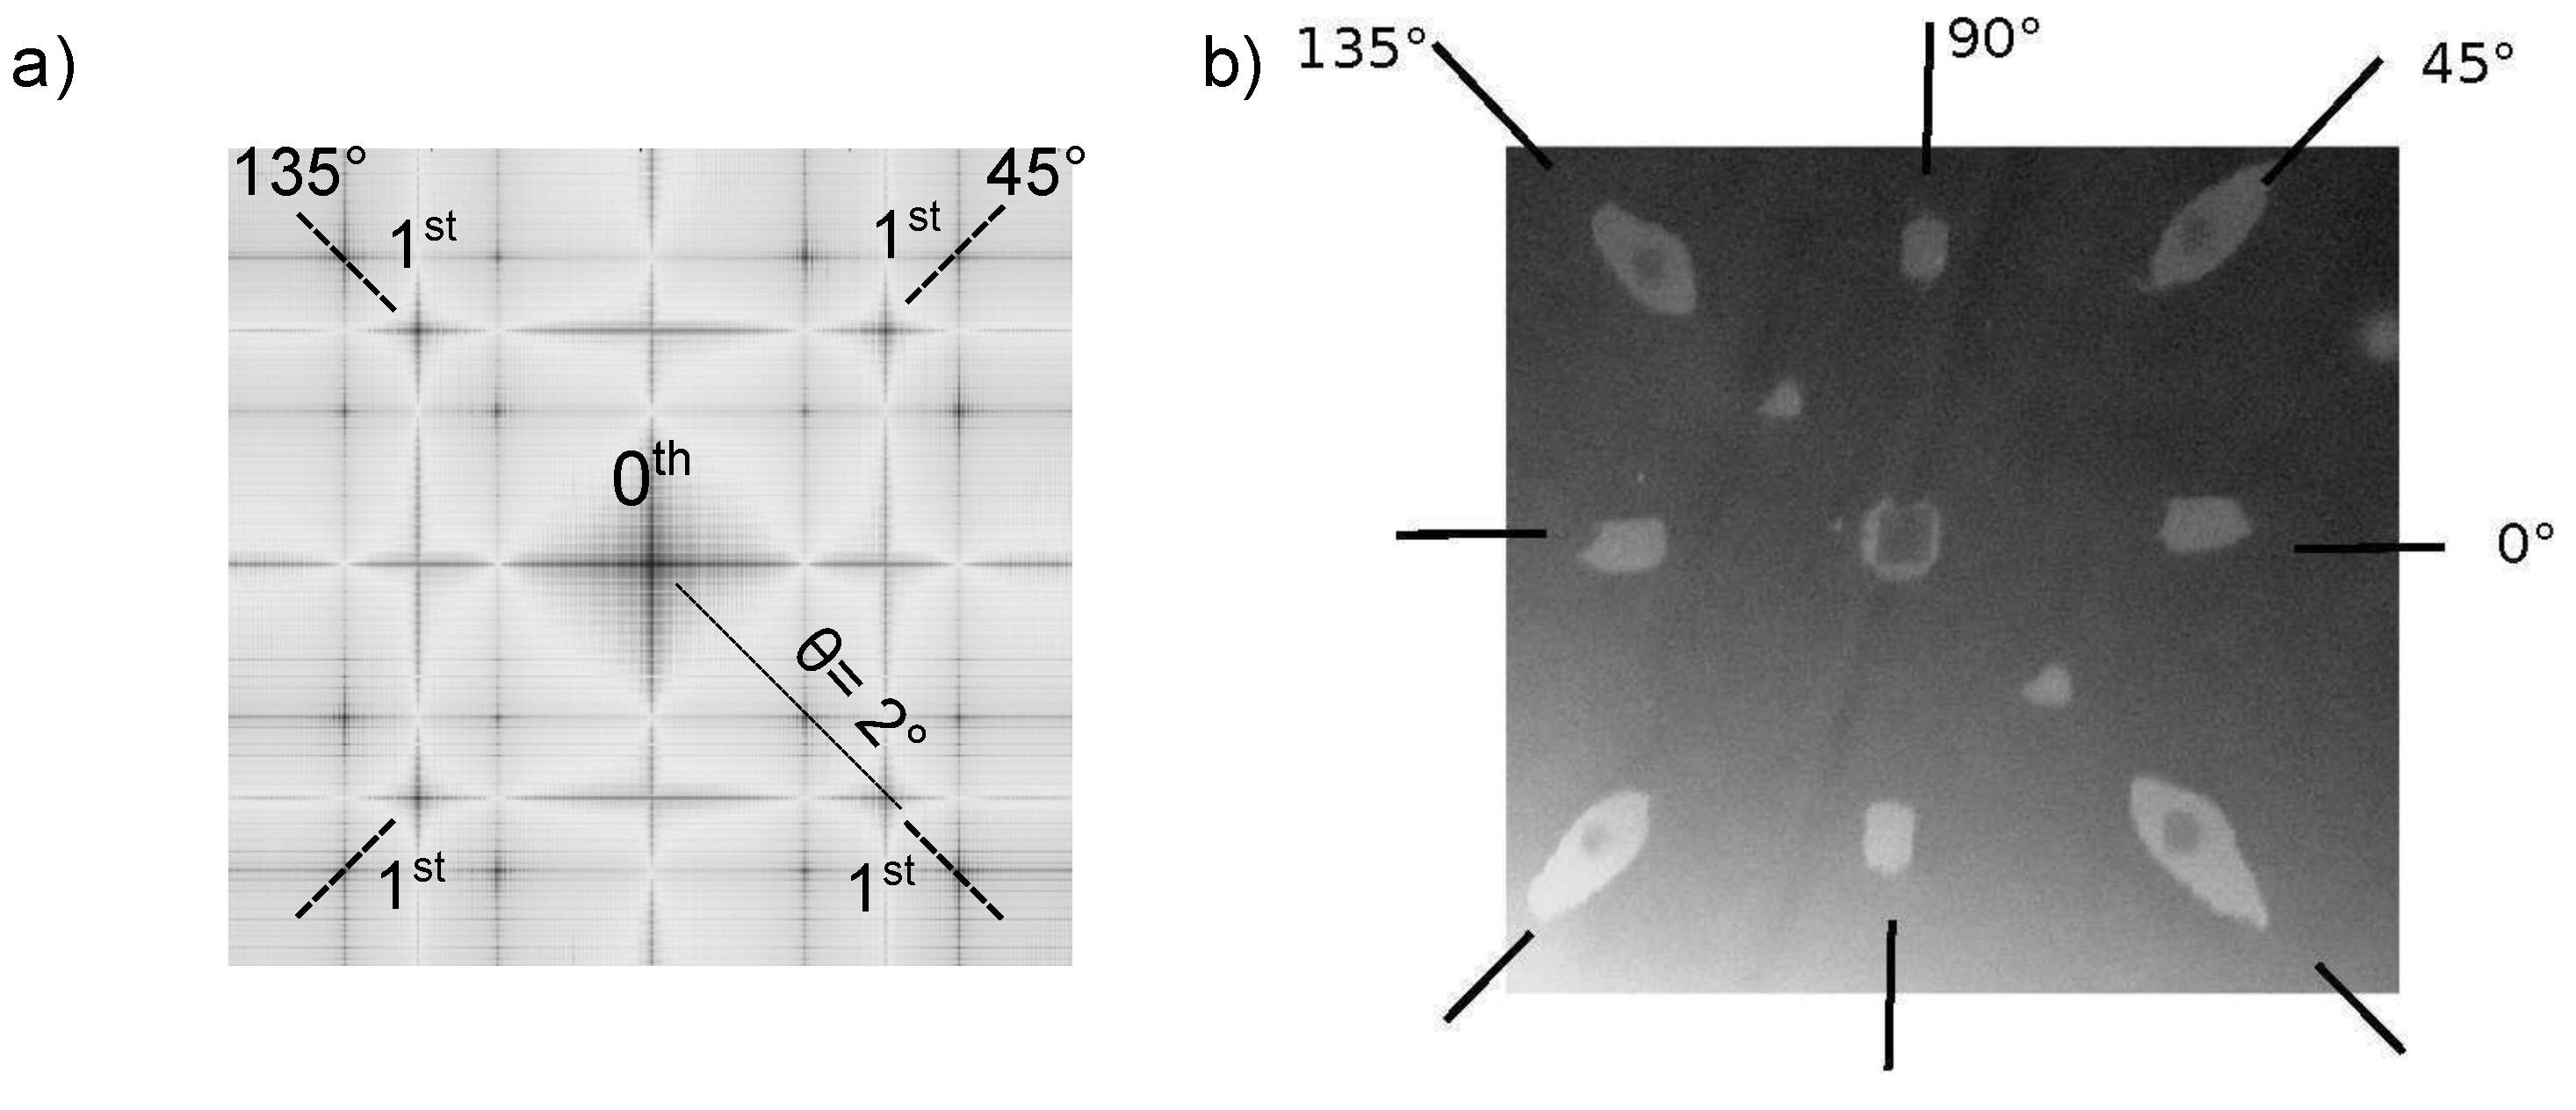
2.3. Stokesmeter Pattern Simulation
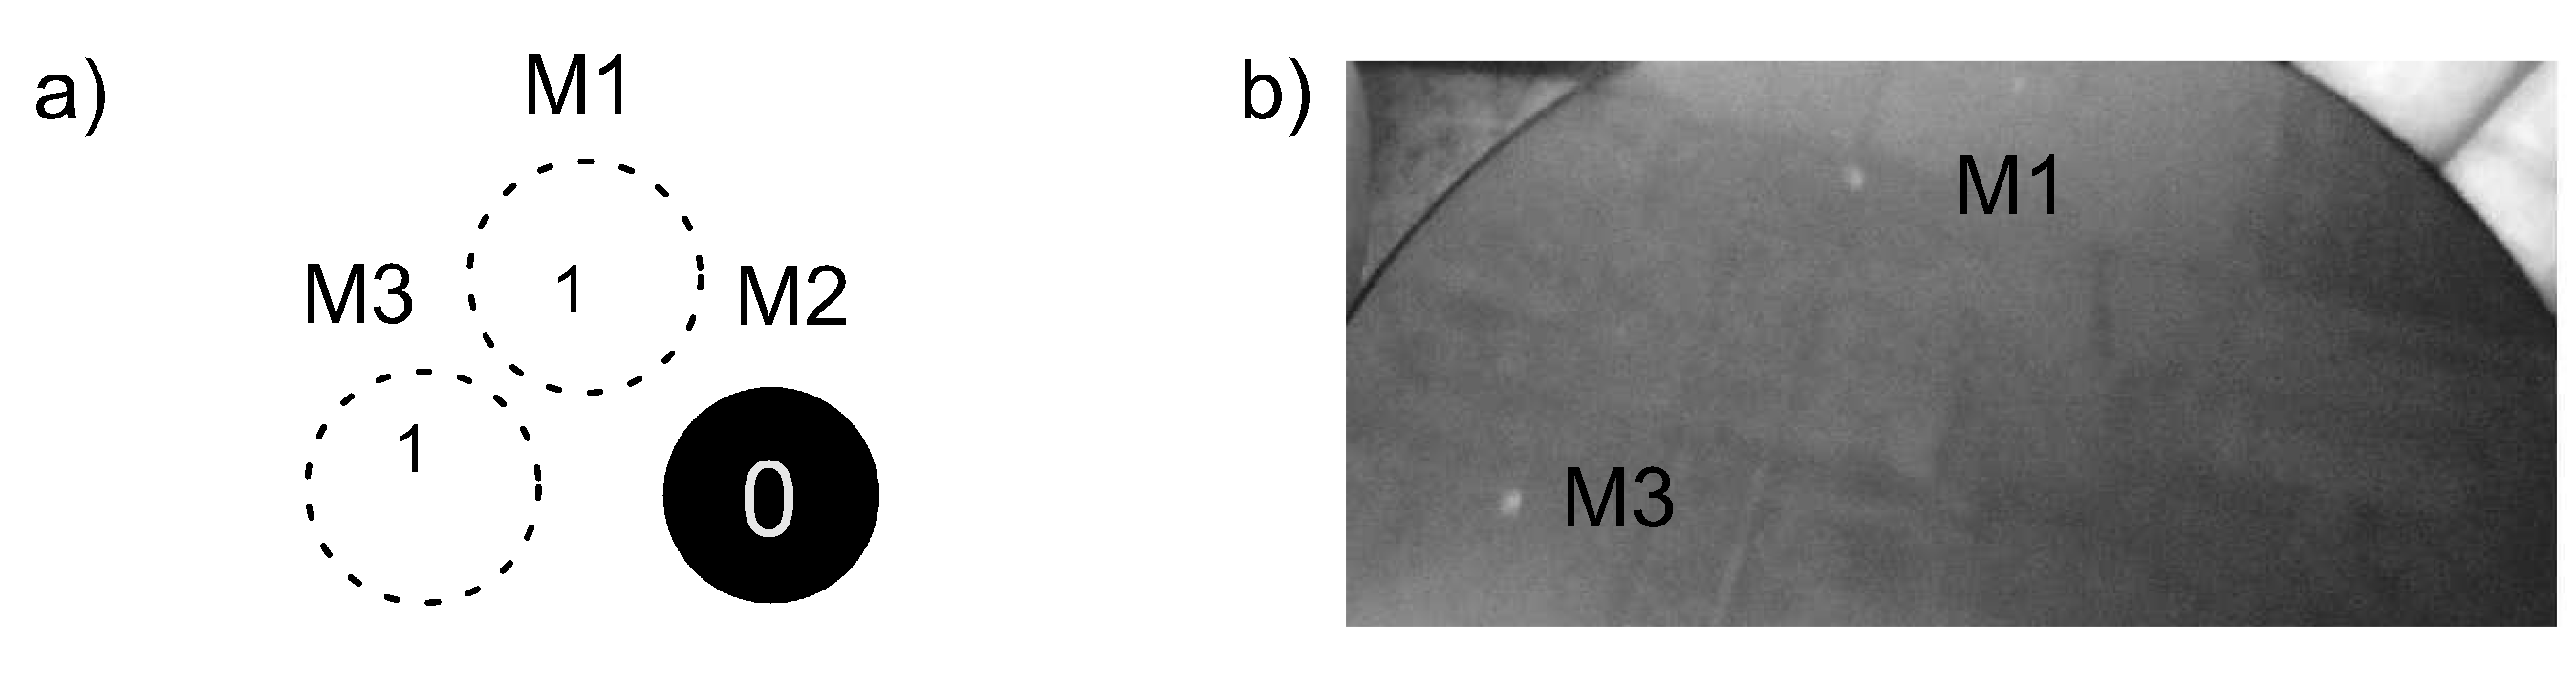
A Stokesmeter pattern simulator is written in MATLAB in order to provide guidance for the interpretation of the results. Our code determines the pattern by setting the incident energy and the phase difference between components E x and E y . The pattern is obtained by using input parameters of distance (d) between the polarizers and the CCD, wavelength (λ) and the period of the grating (p). The input values were d = 540 mm, (λ = 12 nm and p = 330 nm, respectively. Such parameters influence the position of the spots. The program uses Equation (1) and the equation, θ = λ p , where θ is the divergence angle of the beam-splitter and I 2 = Q 2 + U 2 + V 2 , to calculate the Stokes matrix from the electric field components and phase difference δ.
Figure 4 summarizes five sample polarization cases showing the radiation amplitude ( E x , E y ), the phase difference (δ), the Stokes matrix, a graphical representation and the pattern obtained with the Stokesmeter. The cases are discussed as follows:
(a)
The polarization is linear along the horizontal axis, i.e., the pulse energy is 100-times higher for the horizontal axis than for the vertical one. Two full-amplitude spots are observed at the CCD. They correspond to the projections of the polarizer mirrors oriented vertically (M1) and at 45 (M3). The secondary mirrors produce a suppression of the total reflectivity at the X-ray CCD of 50%. The relative intensity is marked in each spot.
(b)
The polarization is linear along the vertical axis, i.e., the pulse energy is 100-times higher for the vertical axis than for the horizontal one. Two full-amplitude spots are observed at the CCD. They correspond to the projections of the polarizer mirrors oriented horizontally (M2) and at 45 (M3).
(c)
The polarization is an elliptical axis, i.e., the ratio of the pulse energy of E x to E y is 4 to 3. Three partial-amplitude spots are observed at the CCD. They correspond to the projections of the polarizer mirrors, M1, M2 and M3. For a phase difference 3 π /2 <δ< π/2, the ellipse of polarization is oriented toward the right.
(d)
The polarization is elliptical, i.e., the ratio of the pulse energy of E x to E y is 1 to 2. Three partial-amplitude spots are observed at the CCD. They correspond to the projections of the polarizer mirrors, M1, M2 and M3. For a phase difference π/2 <δ< 3 π /2, the ellipse of polarization is oriented to the left.
(e)
The polarization is circular, i.e., the pulse energy of E x is equal to the pulse energy of E y . Three partial-amplitude spots are observed at the CCD. They have equal intensities. They correspond to the projections of the polarizer mirrors, M1, M2 and M3. The phase difference is π/2.
Figure 4. Sample patterns for various polarization cases. The first column shows the incident electrical field of two plane waves ( E x and E y ) and the phase difference δ. The second column shows the Stokes matrix. The third column has a graphic of the ellipse of polarization. The last column gives the simulated pattern of the Stokesmeter for the polarization case with normalized intensities. Black corresponds to the poor signal of the p-polarization (0) and white (1) to the full signal. The distance L depends on the wavelength. A larger wavelength means a longer distance between spots.
Photonics 02 00241 g004

3. Results and Discussion
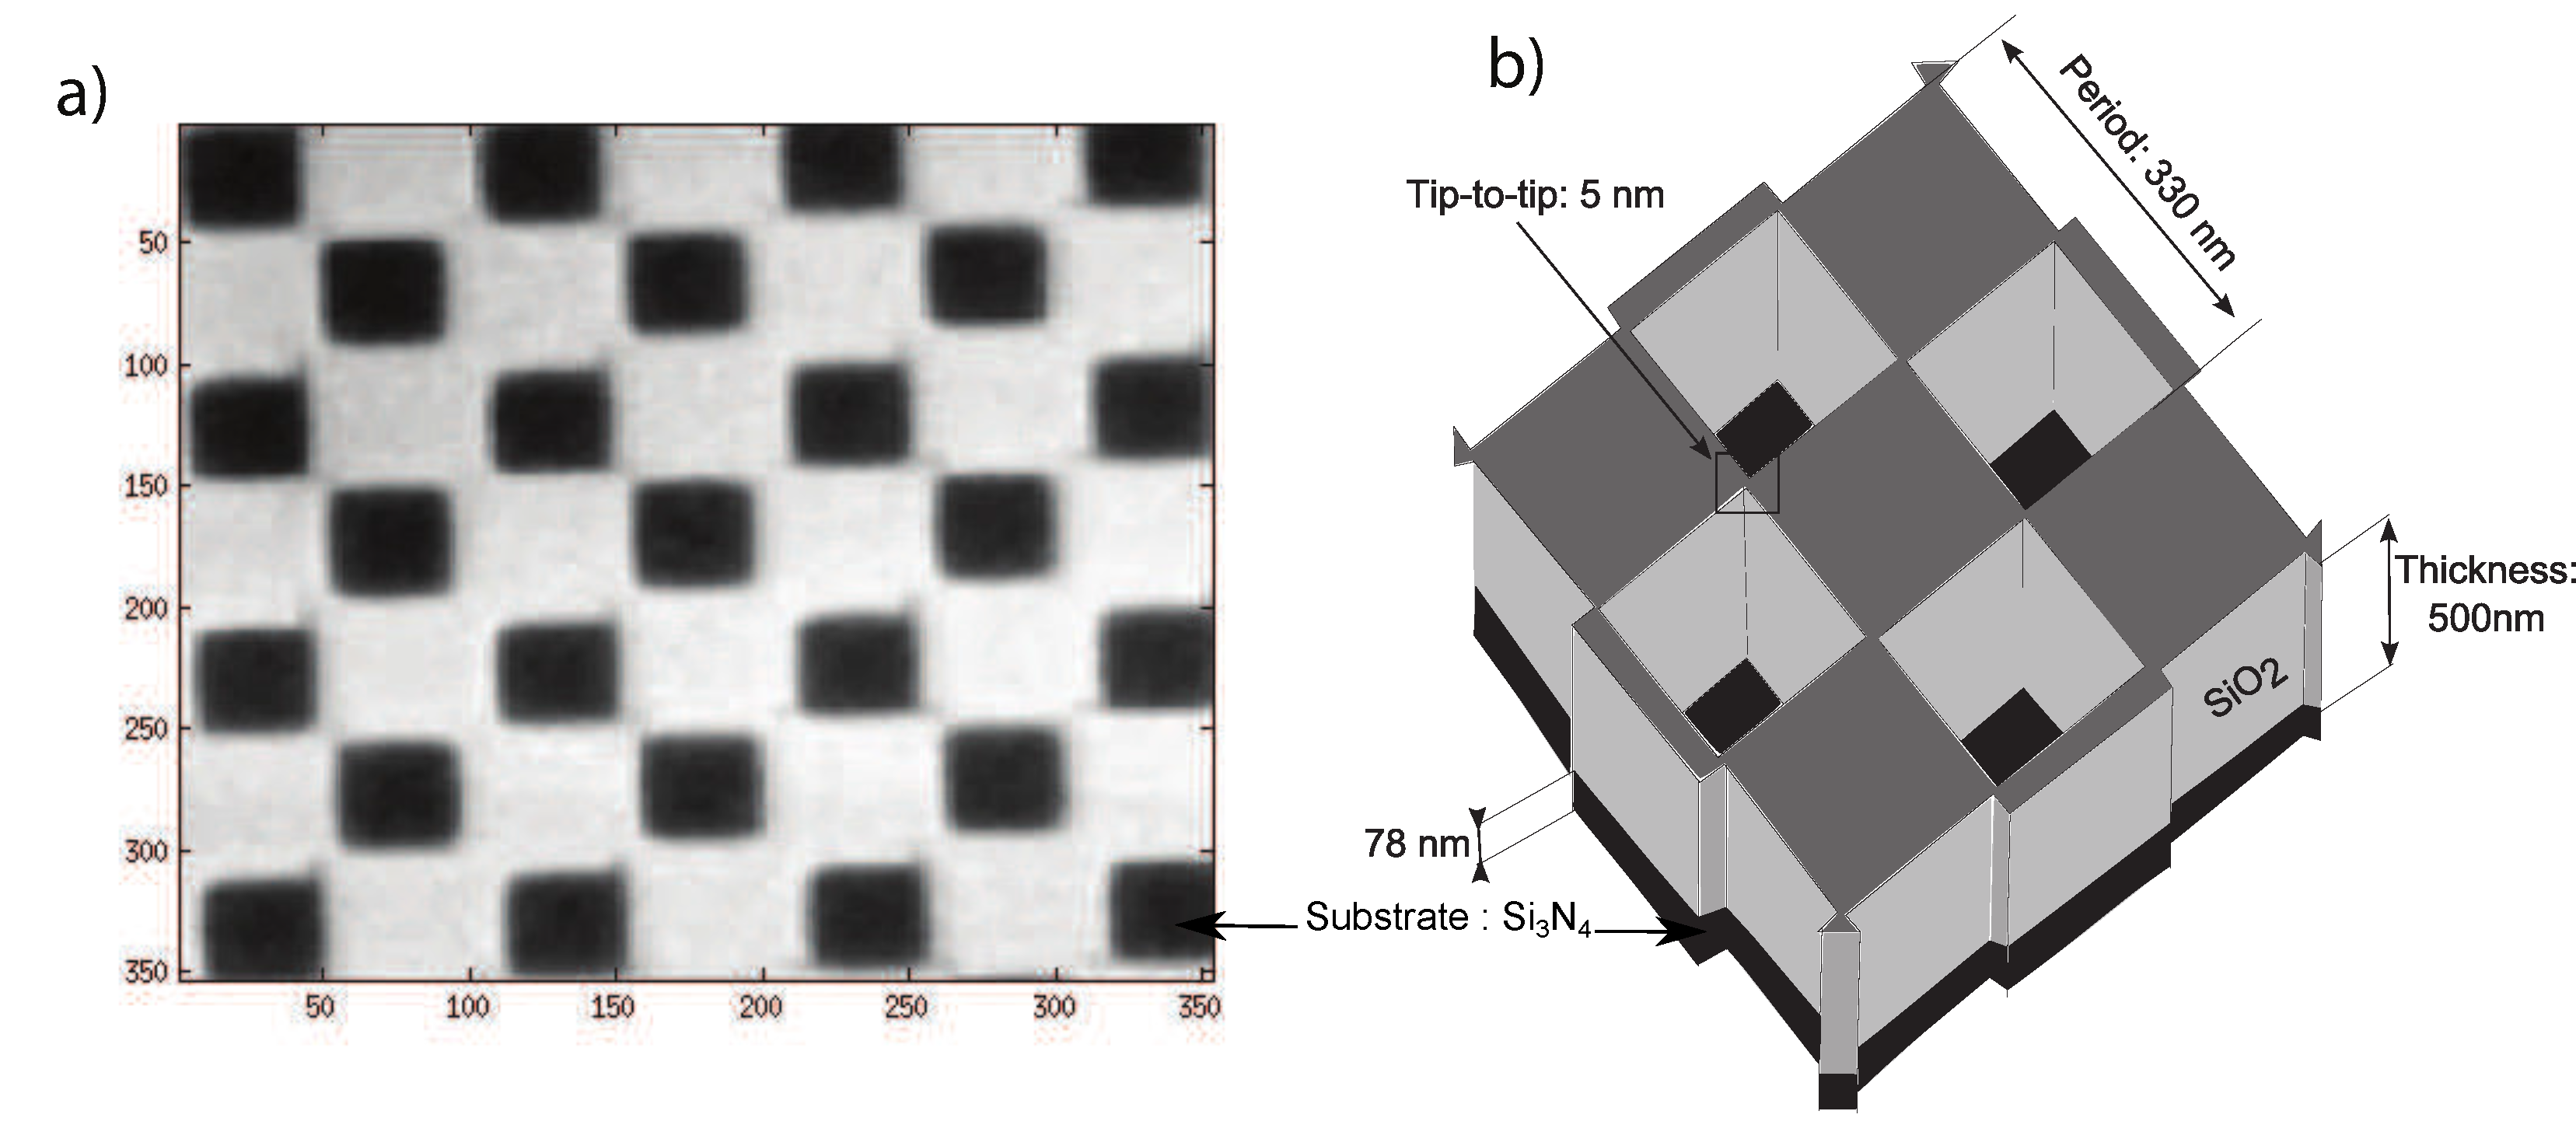
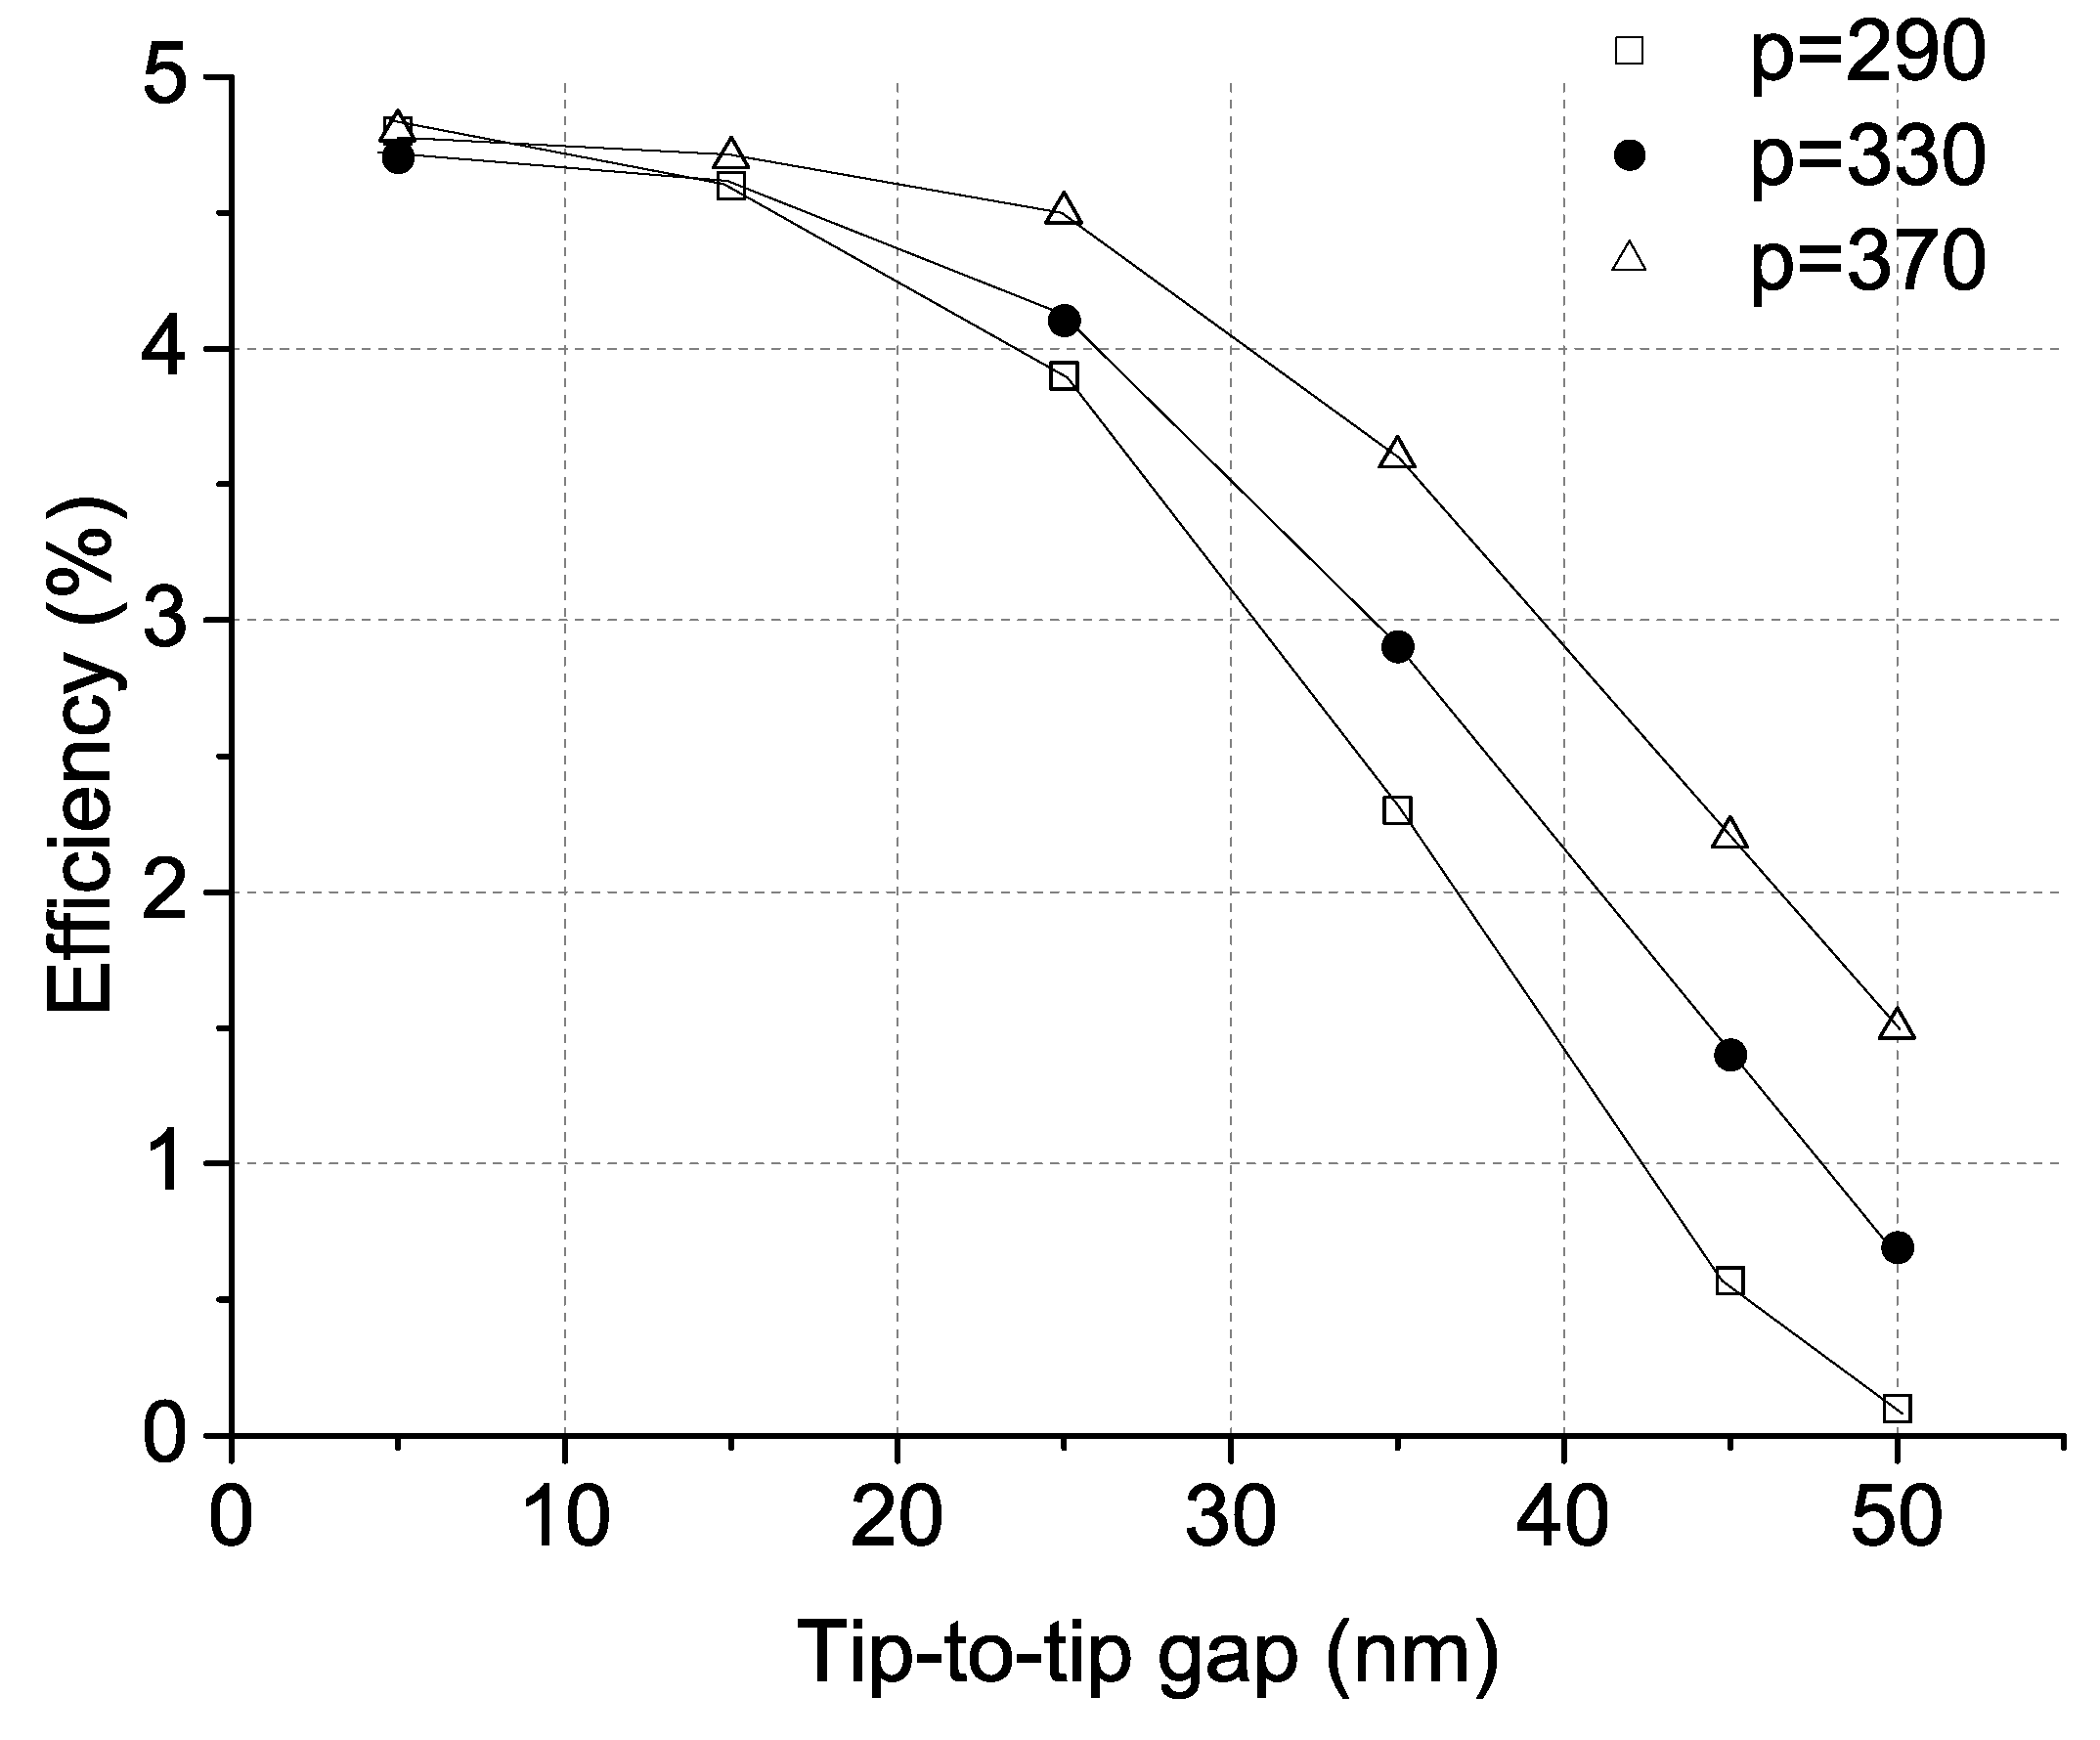
The validation of the Stokesmeter performance was done at a well-characterized EUV source, i.e., the synchrotron radiation of the Swiss Light Source (SLS). This experiment permitted verifying (i) the obtainment of all Stokes parameters in single acquisitions at (ii) reasonable efficiency in the EUV. For the former, the design parameters of 2D gratings (Table 1) were studied. For the latter purpose, the beam-splitter efficiency at the first diffraction order was maximized along with the minimum to the higher orders. Besides, the efficiency is also related to the reflectivity of the multilayer polarizers, which is also discussed.
Table 1. Parameters studied in the calculation of the optimal maximum efficiency of the grating. See Figure 2 for a parameter sketch.
GratingPeriod (nm)Tip-to-tip Gap (nm)Calculated efficiency(%)
A29054.8
B290253.9
C290500.1
D33054.7
E330254.1
F330500.7
G37054.8
H370254.5
I370501.5

3.1. Efficiency of the Stokesmeter

The diverging beam-splitter signals are collected onto the CCD by means of the secondary multilayer mirrors (Figure 1). These produce no further suppression of polarization information, but a certain reduction of reflected amplitude. Considering the discussed efficiency of 5% for the beam-splitter, and 50% of each of the multilayers, an overall throughput of approximately 1% is obtained. However small, such efficiency is sufficient to detect a Stokesmeter pattern on the CCD, being the signal-to-noise ratio (SNR) approximately 3.3 ± 0.3. Nevertheless, we attempted to maximize the efficiency of each optical component, in order to avoid additional degradation of the pattern, e.g., by means of optics aging [27]. For instance, the 2D grating (beam-splitter) could not be manufactured with a tip-to-tip gap below 5 nm for reasons of mechanical stability (Figure 2). Therefore, the effect of deviation from the theoretical optimum had to be investigated. Further, alternative grating designs were investigated to improve the first order efficiency.
Figure 5 shows the efficiency of three gratings versus the tip-to-tip gap. The efficiency, defined as the ratio between the intensity of the first order and the zeroth order, decreases from the tip-to-tip gap of 5 nm, which is also the one chosen for the experiment. A tip-to-tip gap distance shorter than 5 nm is not feasible, due to constraints in nano-fabrication process, i.e., the strong charging effects in the thick layer of the resist. One must not lose sight of the purpose of the grating, which is to act as a beam-splitter. Although smaller periods mean slightly higher efficiency, 0.1% to 1.5%, larger periods mean a compact Stokesmeter. The grating period of 330 nm was chosen to have a beam-splitting aperture of 2 , allowing a compromise between the total size of the setup and the beam-splitting resolution. The distance between the beam splitter and the primary mirrors is given (the dimensions of the XIL-II room). The angular aperture (2 ) between the beam splitter and the mentioned primary mirrors is also given. Therefore, the grating (beam splitter) period for the 12-nm wavelength to obtain an aperture of 2 must be 330 nm. The size of the CCD chip does not control the characteristics of the beam splitter, e.g., the aperture or period. The secondary set of mirrors is aligned to project the spots inside the chip surface. The dimensions of the full chip were 26.8 × 26 mm.
Figure 5. Efficiency versus tip-to-tip gap for three gratings with different periods. The efficiency decreases as a function of the tip-to-tip gap and increases as a function of the period (p).
Photonics 02 00241 g005
The high-order efficiency transmission grating proposed in [28] was also studied. It consists of a series of zig-zag profiled strips. This grating presents up to second order diffraction suppression efficiency, compared to a normal linear grating. However, the improvement in the first order compared to a 1D linear grating is not significant (<0.5%). The design is limited to 1D applications. Moreover, in order to obtain a 2D zig-zag grating, one must cross two of them, reducing the illumination by 50%. Furthermore, the slight distance between the two 1D cross-grating does not provide an equal diffraction angle for the four first orders, which make it useless as a beam-splitter.

3.2. Simultaneous Stokes Parameters for EUV Pulses

Calculated and experimental Stokesmeter patterns were monitored before the polarizer optics (Witness Plate 1, Figure 1) and right after them (Witness Plate 2, Figure 1). Figure 6a shows the simulated pattern at Witness Plate 1 with four main spots rotated exactly π / 2 around the zeroth order. Figure 6b shows the corresponding experimental pattern with two sets of four spots with a π / 4 rotational offset. These patterns emerge from the diffraction of the 1D periodicities present in the grating along the horizontal, vertical and oblique direction. The intensity is symmetrically identical for all spots, indicating that the beam-splitter is not biasing the amplitudes. Any effect on the intensity of the detected spot is thus only due to the polarization (see below). The pattern mismatch between simulation and experiment is due to the exposure time of Witness Plate 1 to the EUV radiation. The accumulative intensity allows one to observe only those orders with the highest amplitude. The pattern is not fully symmetric, since the tip-to-tip gap remodels the pattern in a non-symmetric one.
Figure 6. Stokesmeter pattern at Witness Plate 1 (Figure 1). (a) Simulation obtained with a tip-to-tip gap of 5 nm; (b) experimental pattern on the photo-resist.
Photonics 02 00241 g006
Figure 7a shows the simulated pattern at Witness Plate 2. Two full-intensity spots (M1 and M3) and an extinguished spot (M2) are observed. These spots are in agreement with the polarization of the SLS source and with the theoretical discussion made above. Figure 7b shows that the related experimental pattern is in agreement with the calculation. The XIL-II end station is known to have linear horizontal polarized EUV light ( Q = + 1 ), which is also obtained and shown in Figure 7b. This pattern actually resembles the sample case discussed in Figure 4a.
Figure 7. Stokesmeter pattern at Witness Plate 2 (Figure 1 (a) Simulation obtained for a linear polarization (Q = +1); (b) experimental pattern obtained on the photo-resist.
Photonics 02 00241 g007
In the case of laboratory-scale sources, e.g., plasma-driven EUV sources, the bandwidth may not be as narrow as in the present case of synchrotron radiation or for X-ray lasers [29]. This has two important implications to take into account, namely: (i) the Stokesmeter pattern efficiency and contrast may be degraded by the combination of wavelengths; and (ii) at a given imaging plane, the spot-to-spot distance may vary, as a consequence of different diffraction apertures for different wavelengths.
Figure 8 shows the Stokesmeter patterns for a set of nine acquisitions in the wavelength range between 12.0 nm and 13.0 nm. The color scale, representing the intensity of the radiation, was normalized for each image, such that it should not be compared from one image to the other. The interpretation of the patterns is given on the top of each experimental image. The pattern is here generated as a combined effect of wavelength and beam-splitting angle, which can alter the angle of incidence on the polarizing multilayer. This effect can eventually lead to modified reflectivity and/or polarization contrast between s and p-components. Indeed, it is only at the Brewster angle that the polarization contrast is maximum (see below). For cases where the suppression of polarization component “p” is not maximum (Figure 8a–h), the pattern may suggest elliptical polarization, which is, however, a measurement artifact, if the real polarization is linear. This effect can be handled in the data processing following the discussion below, leading to a correct polarization reconstruction. For cases where the distance between spots is higher than the CCD chip size, i.e., Figure 8a–c, only the reflection of M2 is observed.
Figure 8. Selection of experimental pattern acquisitions at various wavelengths and simulated patterns as a consequence. Two effects are observed: firstly, (ai) the distance spot-to-spot varies, being larger at (a) and shorter at (i). Secondly, the polarizer M2, which is oriented horizontally, acts as a horizontal spatial filter and leads to an elliptical spot (shown inside the dashed circle).
Photonics 02 00241 g008
Besides, the polarizer multilayer M2, which is oriented horizontally, acts as a horizontal spatial filter and leads to a streaked spot (shown inside the dashed circle). In order to eliminate such an artifact in combination with large bandwidth sources, spectral filtering is required. However, for the case of plasma-driven X-ray lasers, the linewidth is as narrow as Δ λ / λ 10 4 , such that spectral filtering is not required.
In order to investigate the effect of the operating wavelength on the performance of the Stokesmeter, we studied the relation between the angle of incidence and reflectivity, as well as the wavelength and the angle of incidence. Figure 9a shows the angle of incidence (α) versus the wavelength (λ) of the polarizer mirrors for the full bandwidth. At the slope α λ = 6, the highest reflectivity is observed, i.e., approximately 50%. Beyond the axis of the maximum reflectivity (white range), the intensity within a bandwidth of a few tenths of nm decreases. Such a change in the total reflectivity affects also the relative polarization contrast, as shown in Figure 8. The ellipse of polarization appears more intense at 13.0 nm, although the reflectivity of the mirror is only 7% at such a wavelength and angle. Figure 9b shows the reflectivity of the components “p” and “s” versus the angle of incidence. The contrast at the Brewster angle is 1:10,000. The contrast of reflectivity decreases to 1:100, 0.2 apart from the Brewster angle.
Figure 9. (a) Angle of incidence on the polarizer mirrors versus wavelength. The maximum reflectivity is approximately 50% for each wavelength for a specific angle of incidence. (b) Reflectivity versus incident angle (parallel, Rs (dashed line), and perpendicular, Rp (continuous line)) on the EUV range. (a) and (i) refer to Figure 8. The reflectivity has been calculated using the equation of [30].
Photonics 02 00241 g009

4. Conclusions

A self-designed Stokesmeter was tested measuring all four Stokes parameter simultaneously in the EUV pulses. The polarization pattern acquired on the X-ray CCD is formed by experimental spots in agreement with our simulations. Such a pattern reproduces the linear horizontal behavior of the XIL-II source. The design, realized with three polarizer multilayer mirrors and three secondary multilayer mirrors, was optimized for energy incising at 42 , to obtain approximately 50% of the reflectivity in each mirror. The 2D grating, used to split the source, was designed to have a small tip-to-tip gap, i.e., 5 nm, approximately equal to the e-beam diameter.

Acknowledgments

The authors are grateful to M. Kropf, M. Vockenhuber, V. Guzenko and S. Lee (Paul Scherrer Institute), A. Bieler (Michigan State University), Y. Arbelo and A. Borgschulte (Empa) for discussions. The present work was supported by the Swiss National Science Foundation under Grant Number PP00P2-133564/1.

Conflicts of Interest

The authors declare no conflicts of interest.

References

  1. Armelao, L.; Bleiner, D.; di Noto, V.; Gross, S.; Sada, C.; Schubert, U.; Tondello, E.; Vonmont, H.; Zattin, A. Ion-, photoelectron- and laser-assisted analytical investigation of nano-structured mixed HfO2-SiO2 and ZrO 2-SiO2 thin films. Appl. Surface Sci. 2005, 249, 277–294. [Google Scholar] [CrossRef]
  2. Len, P. M.; T.Gog, D.; Novikov, R.A.; Eisengower, G.; Materlik, C.S. Fadley, Multiple energy X-ray holography: Incident-radiation polarization effects. Phys. Rev. B 1997, 56, 1529–1539. [Google Scholar] [CrossRef]
  3. Van der Laan, G. Applications of soft X-ray magnetic dichroism. J. Phys. Conf. Ser. 2013, 430, 012127. [Google Scholar] [CrossRef]
  4. Lopez-Flores, V.; Arabski, J.; Stamm, C.; Halté, V.; Pontius, N.; Beaurepaire, E.; Stamm, C. Time-resolved X-ray magnetic circular dichroism study of ultrafast demagnetization ferromagnetic film excited by circularly polarized laser pulse. Phys. Rev. B 2012, 86, 014424. [Google Scholar]
  5. Allwood, D.A.; Xiong, G.; Cooke, M.D.; Cowburn, R.P. Magneto-optical Kerr effect analysis of magnetic nanostructure. J. Phys. D: Appl. Phys. 2003, 36, 2175–2182. [Google Scholar]
  6. Dae-Eun, J.; Ki-Suk, L.; Sang-Koog, K. X-ray Magneto-Optical Kerr Effect Based on Circular Polarization Eigenmode. J. Korean Phys. Soc. 2005, 46, 1180–1184. [Google Scholar]
  7. Heigl, F.; Krupin, O.W.; Vollmer, A.; Starke, K. Soft X-ray magneto-optics at rare-earth 4dâĹŠ-4f thresholds. Appl. Phys. A 2001, 86, 3415–3418. [Google Scholar]
  8. Starke, K.; Heigl, F.; Vollmer, F.; Weiss, M.; Reichartdt, G.; Kainfle, G. X-ray magneto-optics in lanthanides. Phys. Rev. Lett. 2001, 86, 3415. [Google Scholar] [CrossRef] [PubMed]
  9. Polisetty, S.; Zhou, J.; Karthik, J.; Damodaran, A.R.; Chen, D.; Scholl, A.; Martin, L.W.; Holcomb, M. X-ray linear dichroism dependence on ferroelectric polarization. J. Phys. Condens. Matter 2012, 24, 245902. [Google Scholar] [CrossRef] [PubMed]
  10. Tesch, M.F.; Gilbert, M.C.; Mertins, H.-C.; Bürgler, D.E.; Berges, U.; Schneider, C.M. X-ray magneto-optical polarization spectroscopy: An analysis from the visible region to the X-ray regime. Appl. Opt. 2013, 52, 4294–4310. [Google Scholar] [CrossRef] [PubMed]
  11. Eisebitt, S.; Luening, J.; Schlotter, W.F.; Loergen, M.; Hellwig, O.; Eberhardt, W.; Stöhr, J. Lensless imaging of magnetic nanostructures by X-ray spectro-holography. Nature 2004, 43, 885–888. [Google Scholar] [CrossRef] [PubMed]
  12. Turner, J.; Huang, X.; Krupin, O.; Seu, K.A.; Parks, D.; Kevan, S.; Lima, E.; Kisslinger, K.; McNulty, I.; Gambino, R.; et al. X-Ray Diffraction Microscopy of Magnetic Structures. Phys. Rev. Lett. 2011, 107, 033904. [Google Scholar] [CrossRef] [PubMed]
  13. Sacchi, M.; Popescu, H.; Jaouen, N.; Tortarolo, M.; Fortuna, F.; Delaunay, R.; Spezzani, C. Magnetic imaging by Fourier transform holography using linearly polarized X-rays. Opt. Express 2012, 20, 9769–9776. [Google Scholar] [CrossRef] [PubMed]
  14. Pfau, B.; Günther, C.M.; Könnecke, R.; Guehrs, E.; Hellwig, O.; Schlotter, W. F.; Eisebitt, S. Magnetic imaging at linearly polarized X-ray sources. Opt. Express 2010, 18, 13608–13615. [Google Scholar] [CrossRef] [PubMed]
  15. Bahrdt, J.; Frentrup, W.; Gaupp, A.; Scheer, M.; Gudat, W.; Ingold, G.; Sasaki, S. Elliptically polarizing insertion devices at BESSY IIt. In Proceedings of the 7th International Conference on Synchrotron Radiation Instrumentation, Berlin, Germany, 21–25 August 2000; Volume 467–468, pp. 21–29.
  16. Dhez, P. Polarizers and polarimeters in the xuv range. Nucl. Instrum. Methods A 1987, 261, 66–71. [Google Scholar] [CrossRef]
  17. Kortright, J.B.; Rice, M.; Franck, K.D. Tunable multilayer EUV/soft X-ray polarimeter. Rev. Sci. Instrum. 1995, 66, 1567. [Google Scholar] [CrossRef]
  18. Schäfer, F. Multilayers for the EUV/soft X-ray range. Phys. B 2000, 283, 119–124. [Google Scholar] [CrossRef]
  19. Schäfer, F.; Mertins, H.C.; Andreas Gaupp, W.; Gudat, M.; Mertin, I.; Packe, F.; Schmolla, S.; di Fonzo, G.; Soullie, W.; Richard Walker, J.; et al. Soft-x-ray polarimeter with multilayer optics: Complete analysis of the polarization state of light. Appl. Opt. 1999, 38, 4074–4088. [Google Scholar] [CrossRef]
  20. Rabinovitch, K.; Canfield, L.R.; Madden, R.P. A Method for Measuring Polarization in the Vacuum Ultraviolet. Appl. Opt. 1965, 4, 1005–1010. [Google Scholar] [CrossRef]
  21. Johnson, R.L.; Barth, J.; Cardona, M.; Fuchs, D.; Bradshaw, A.M. Spectroscopic ellipsometry with synchrotron radiation. Rev. Sci. Instrum. 1989, 60, 2209–2212. [Google Scholar] [CrossRef]
  22. Uschakow, S.; Gaupp, A.; MacDonald, M.; Schäfer, F. EUV Ellipsometry on Mo/Si Multilayers. In Procedding of the 11th International Conference on Synchrotron Radiation Instrumentation, SRI 2012, Lyon, France, 9–13 July 2012; Volume 425, p. AN 152011.
  23. Träger, F. Handbook of Lasers and Optics; Springer: Berlin, Germany, 2012; Chapter 3; pp. 108–110. [Google Scholar]
  24. XIL-II (X09LB): Extreme Ultraviolet Interference Lithography. Available online: http://www.psi.ch/sls/xil/xil (accessed on 15 February 2015).
  25. Electron Beam Lithography. Available online: http://www.psi.ch/lmn/electron-beam-lithography (accessed on 15 February 2015).
  26. Aquila, A.; Bleiner, D.; Balmer, J.; Bajt, S. Polarization measurement of plasma excited X-ray lasers. Proc. SPIE 2011, 8140, 81400Z-2. [Google Scholar]
  27. Bleiner, D.; Yulin, S.; Martynczuk, J.; Ruiz-Lopez, M.; Arbelo, Y.; Balmer, J.E.; Günther, D. Actinic damage of Y/Mo multilayer optics in a table-top plasma-driven X-ray laser. Appl. Opt. 2014, 52, 4894–4902. [Google Scholar] [CrossRef] [PubMed]
  28. Zang, H.P.; Wang, C.K.; Gao, Y.L.; Zhou, W.M.; Kuang, L.Y.; Wei, L.; Fan, W.; Zhang, W.H.; Zhao, Z.Q.; Cao, L.F.; et al. Elimination of higher-order diffraction using zigzag transmission grating in soft X-ray region. App. Phys. Lett. 2012, 100, AN 111904. [Google Scholar] [CrossRef]
  29. Bleiner, D.; Arbelo-Pena, Y.; Masoudnia, L.; Ruiz-Lopez, M. Table-top X-ray lasers using a plasma gain-medium: Limits and potentials. Phys. Scripta 2014, T162, 014050. [Google Scholar] [CrossRef]
  30. Attwood, D. Soft X-Ray and Extreme Ultraviolet Radiation: Principles and Applications; Cambridge University: Cambridge, UK, 1999; Chapter 3; pp. 69–78. [Google Scholar]

