3.1. Soliton Mode-Locking Regime (DT < 0)
First, we examined the anomalous dispersion regime, in which DT = −0.05 ps2. The length of the NDF was 0.2 m, and the repetition rate was 30.8 MHz. We achieved single-pulse soliton mode-locking operation.
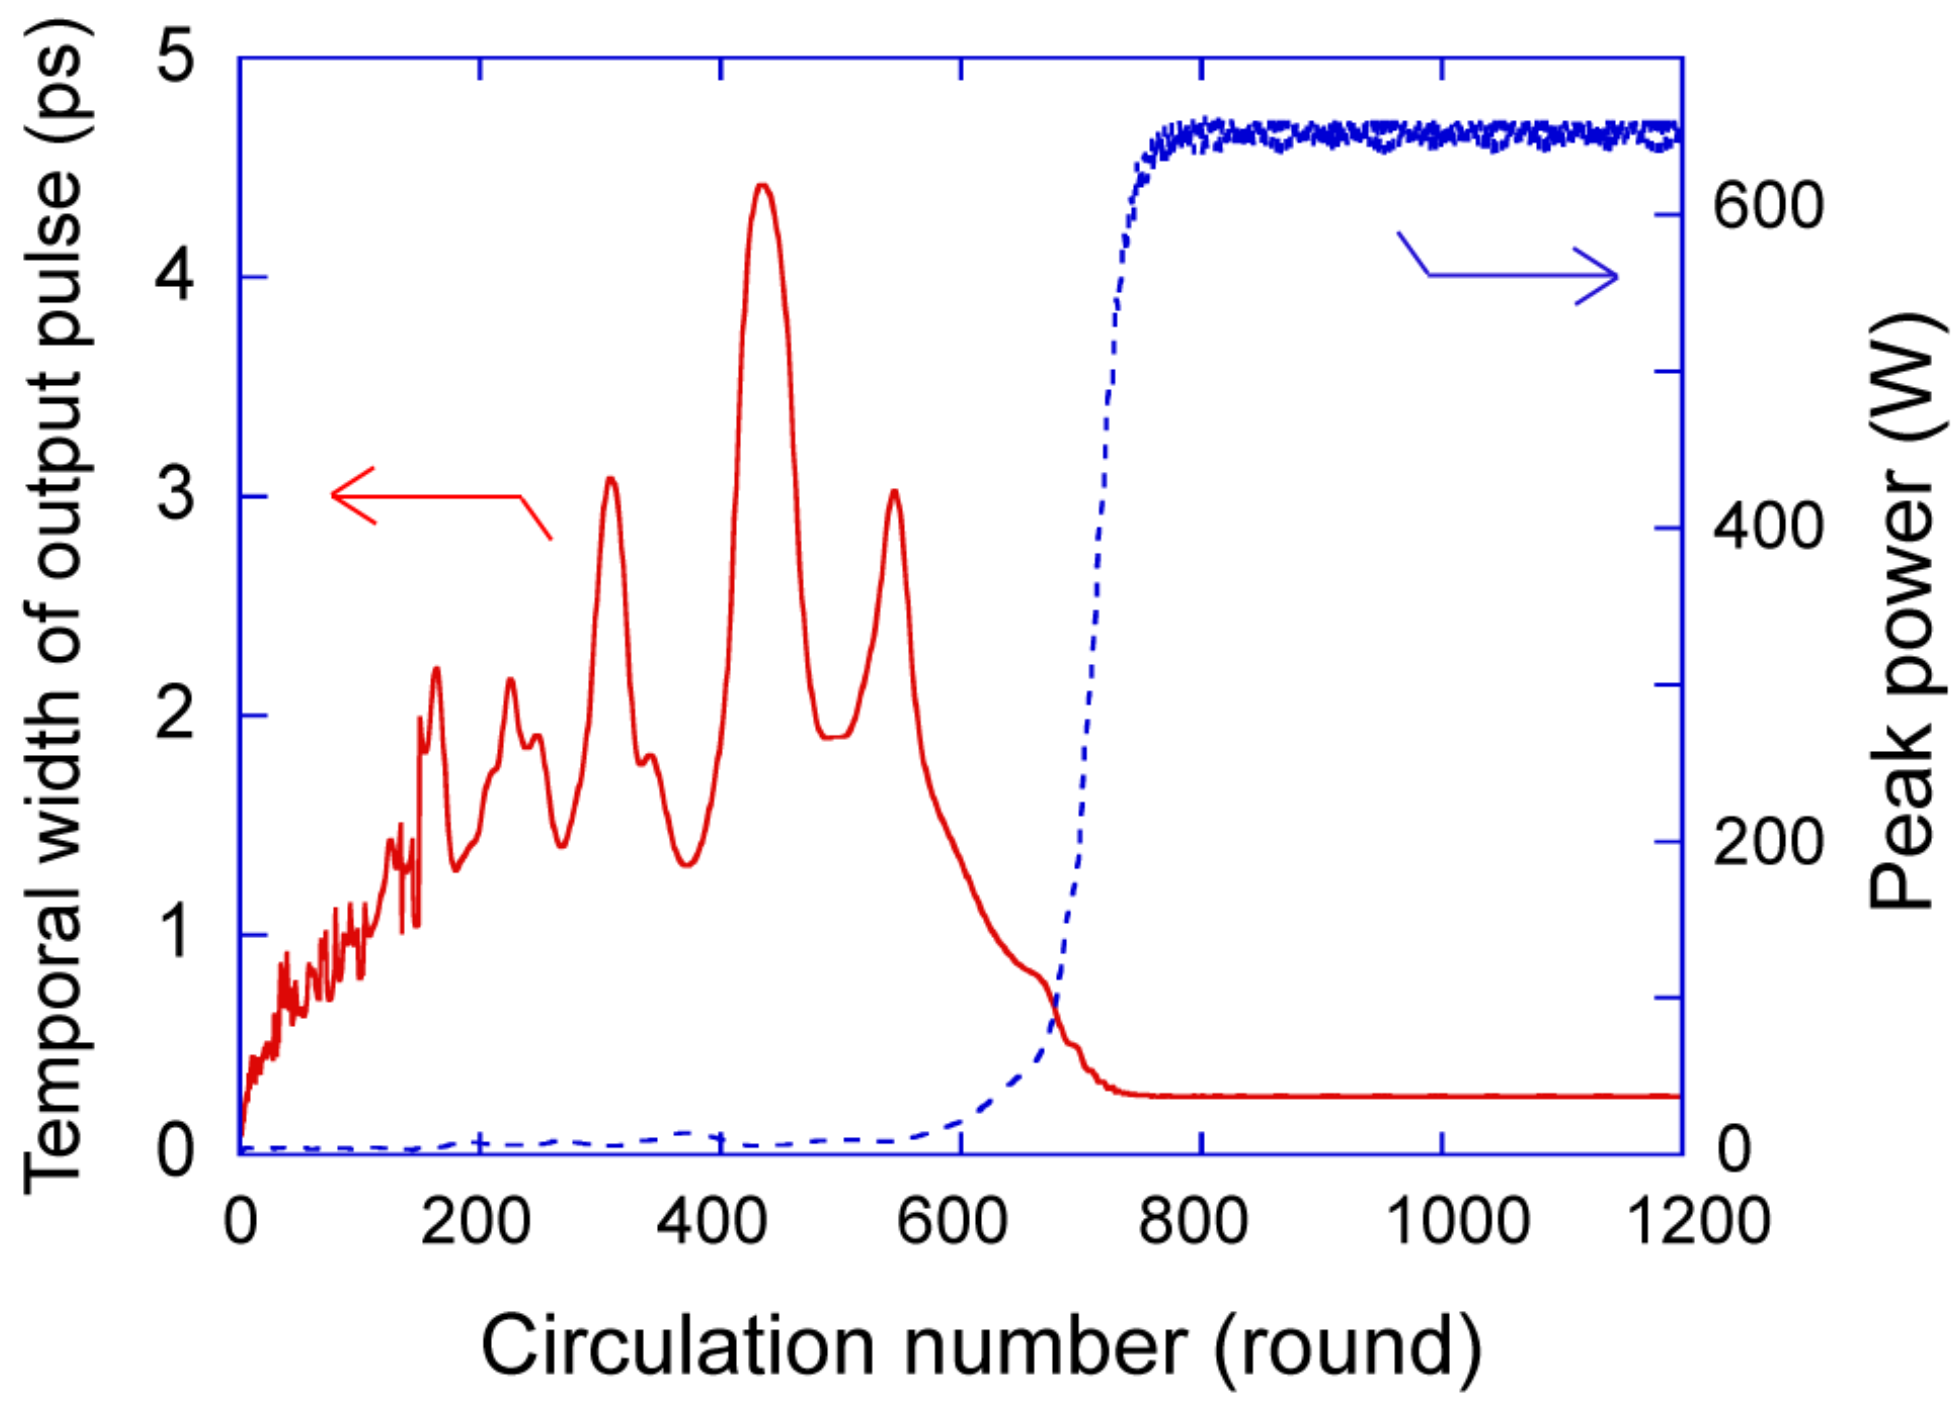
Figure 3 shows the variation of the pulse duration and peak power for the initial process of passive mode-locking in this regime. The bandwidth of the wavelength filter was set to be 25 nm full width at half-maximum (FWHM). The variations of the spectral and temporal shapes of the circulating pulse for the initial mode-locking process are shown as movies in Media 1 and 2. ASE noise circulated around the ring cavity and was amplified at the EDF for every round-trip. At the SWNT film, the intense component suffered low absorption loss owing to the saturable absorption property. Therefore, the intense component survived and was amplified at the EDF, and above a certain threshold, the amplified pulse component suffered the soliton effect, resulting in pulse compression and pulse shaping. The temporal width decreased and the peak power and spectral width rapidly increased at around 700 rounds of circulation. Then, since this intense pulse dominated the gain of the EDF, the low-power background noise component gradually decreased. Finally, a stable sech
2-shaped, single ultrashort soliton pulse with Kelly sidebands was generated.
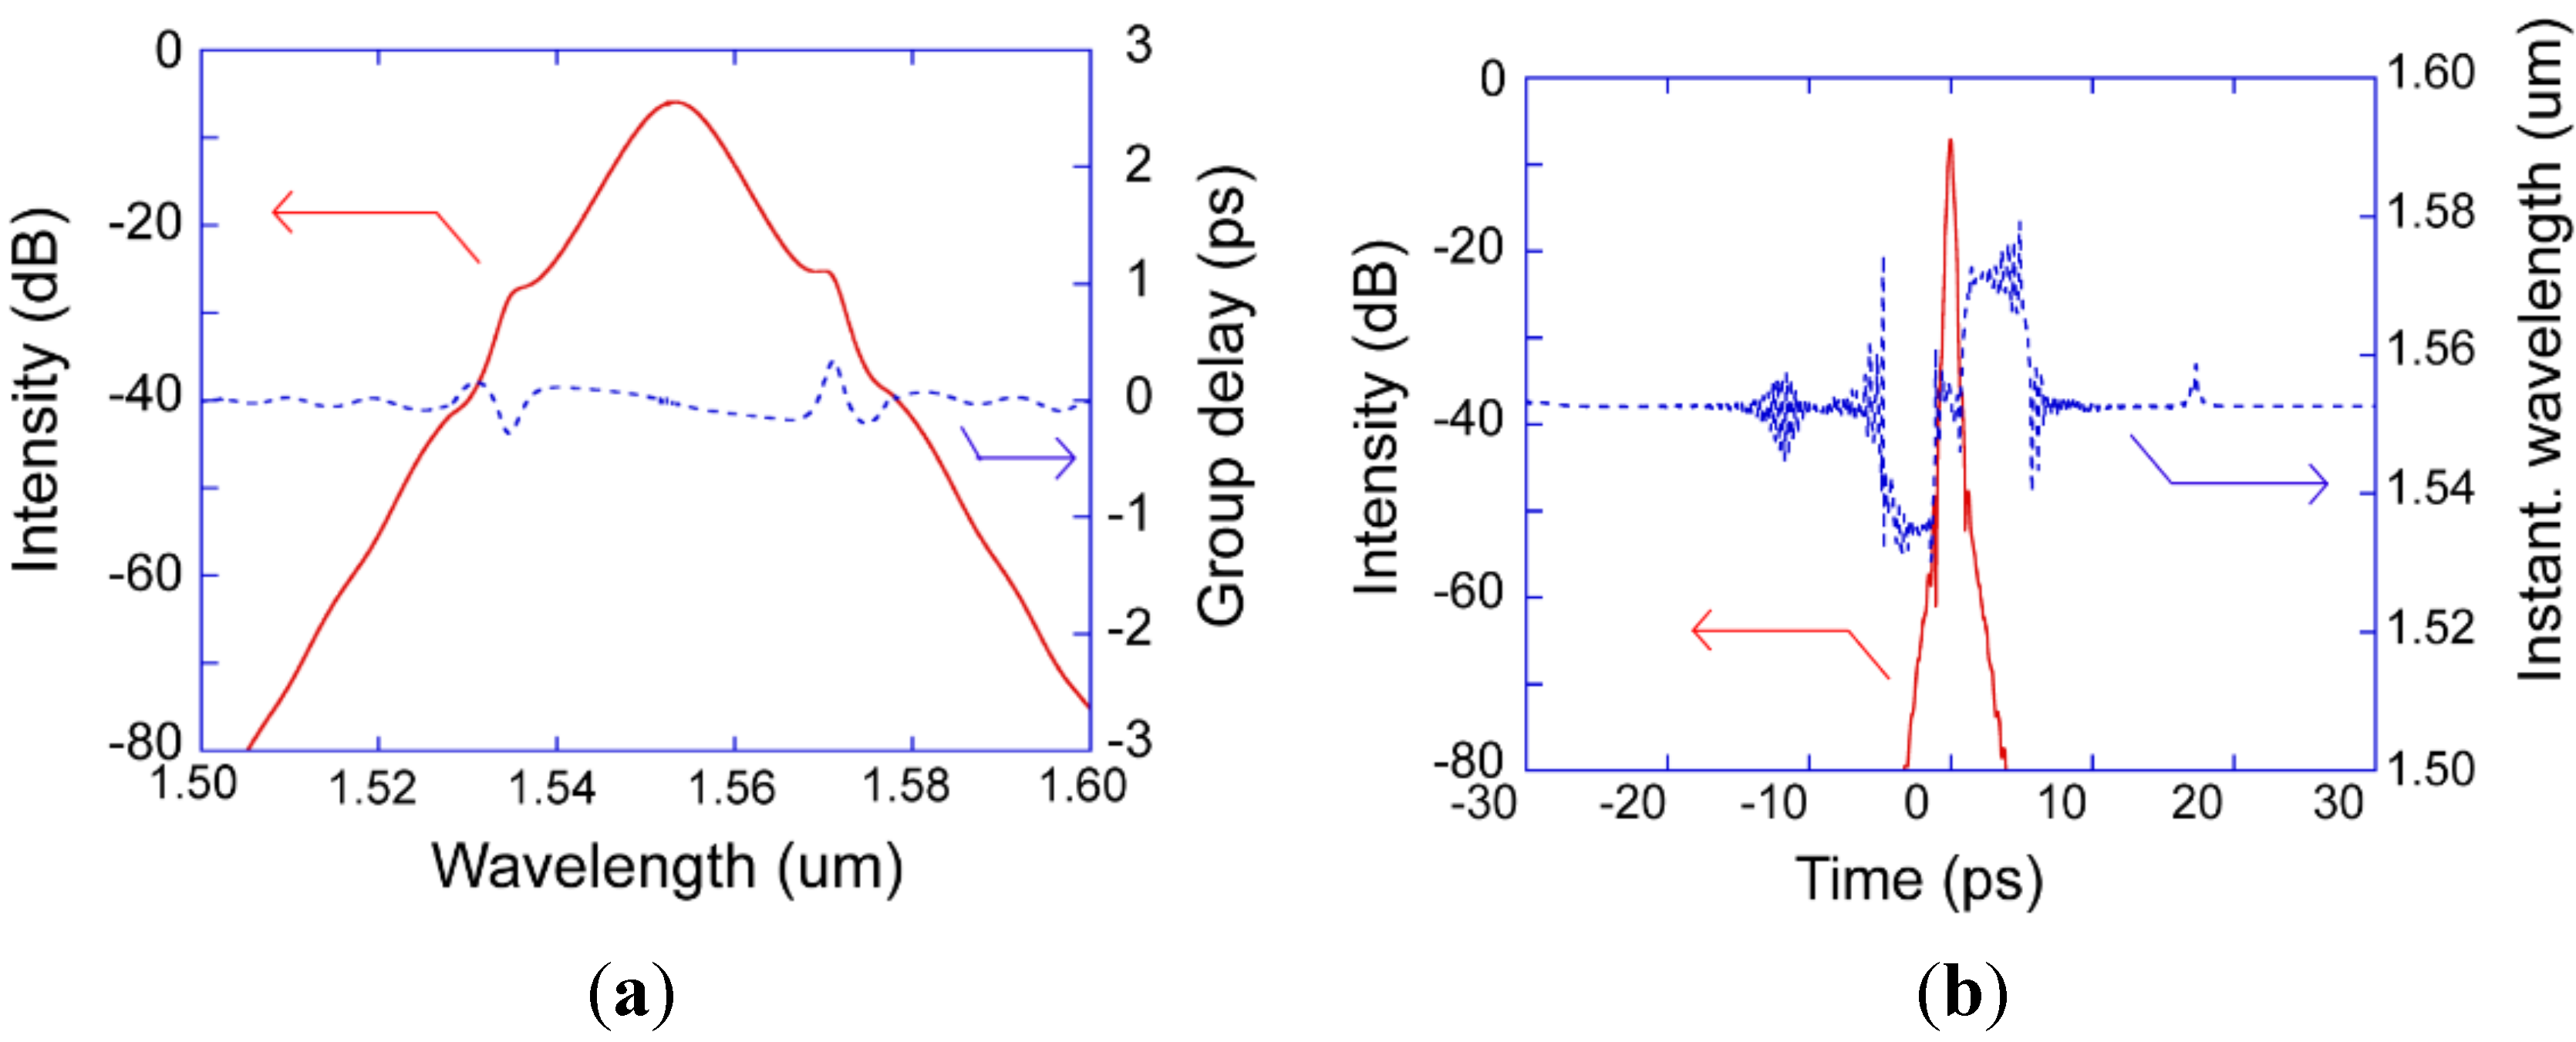
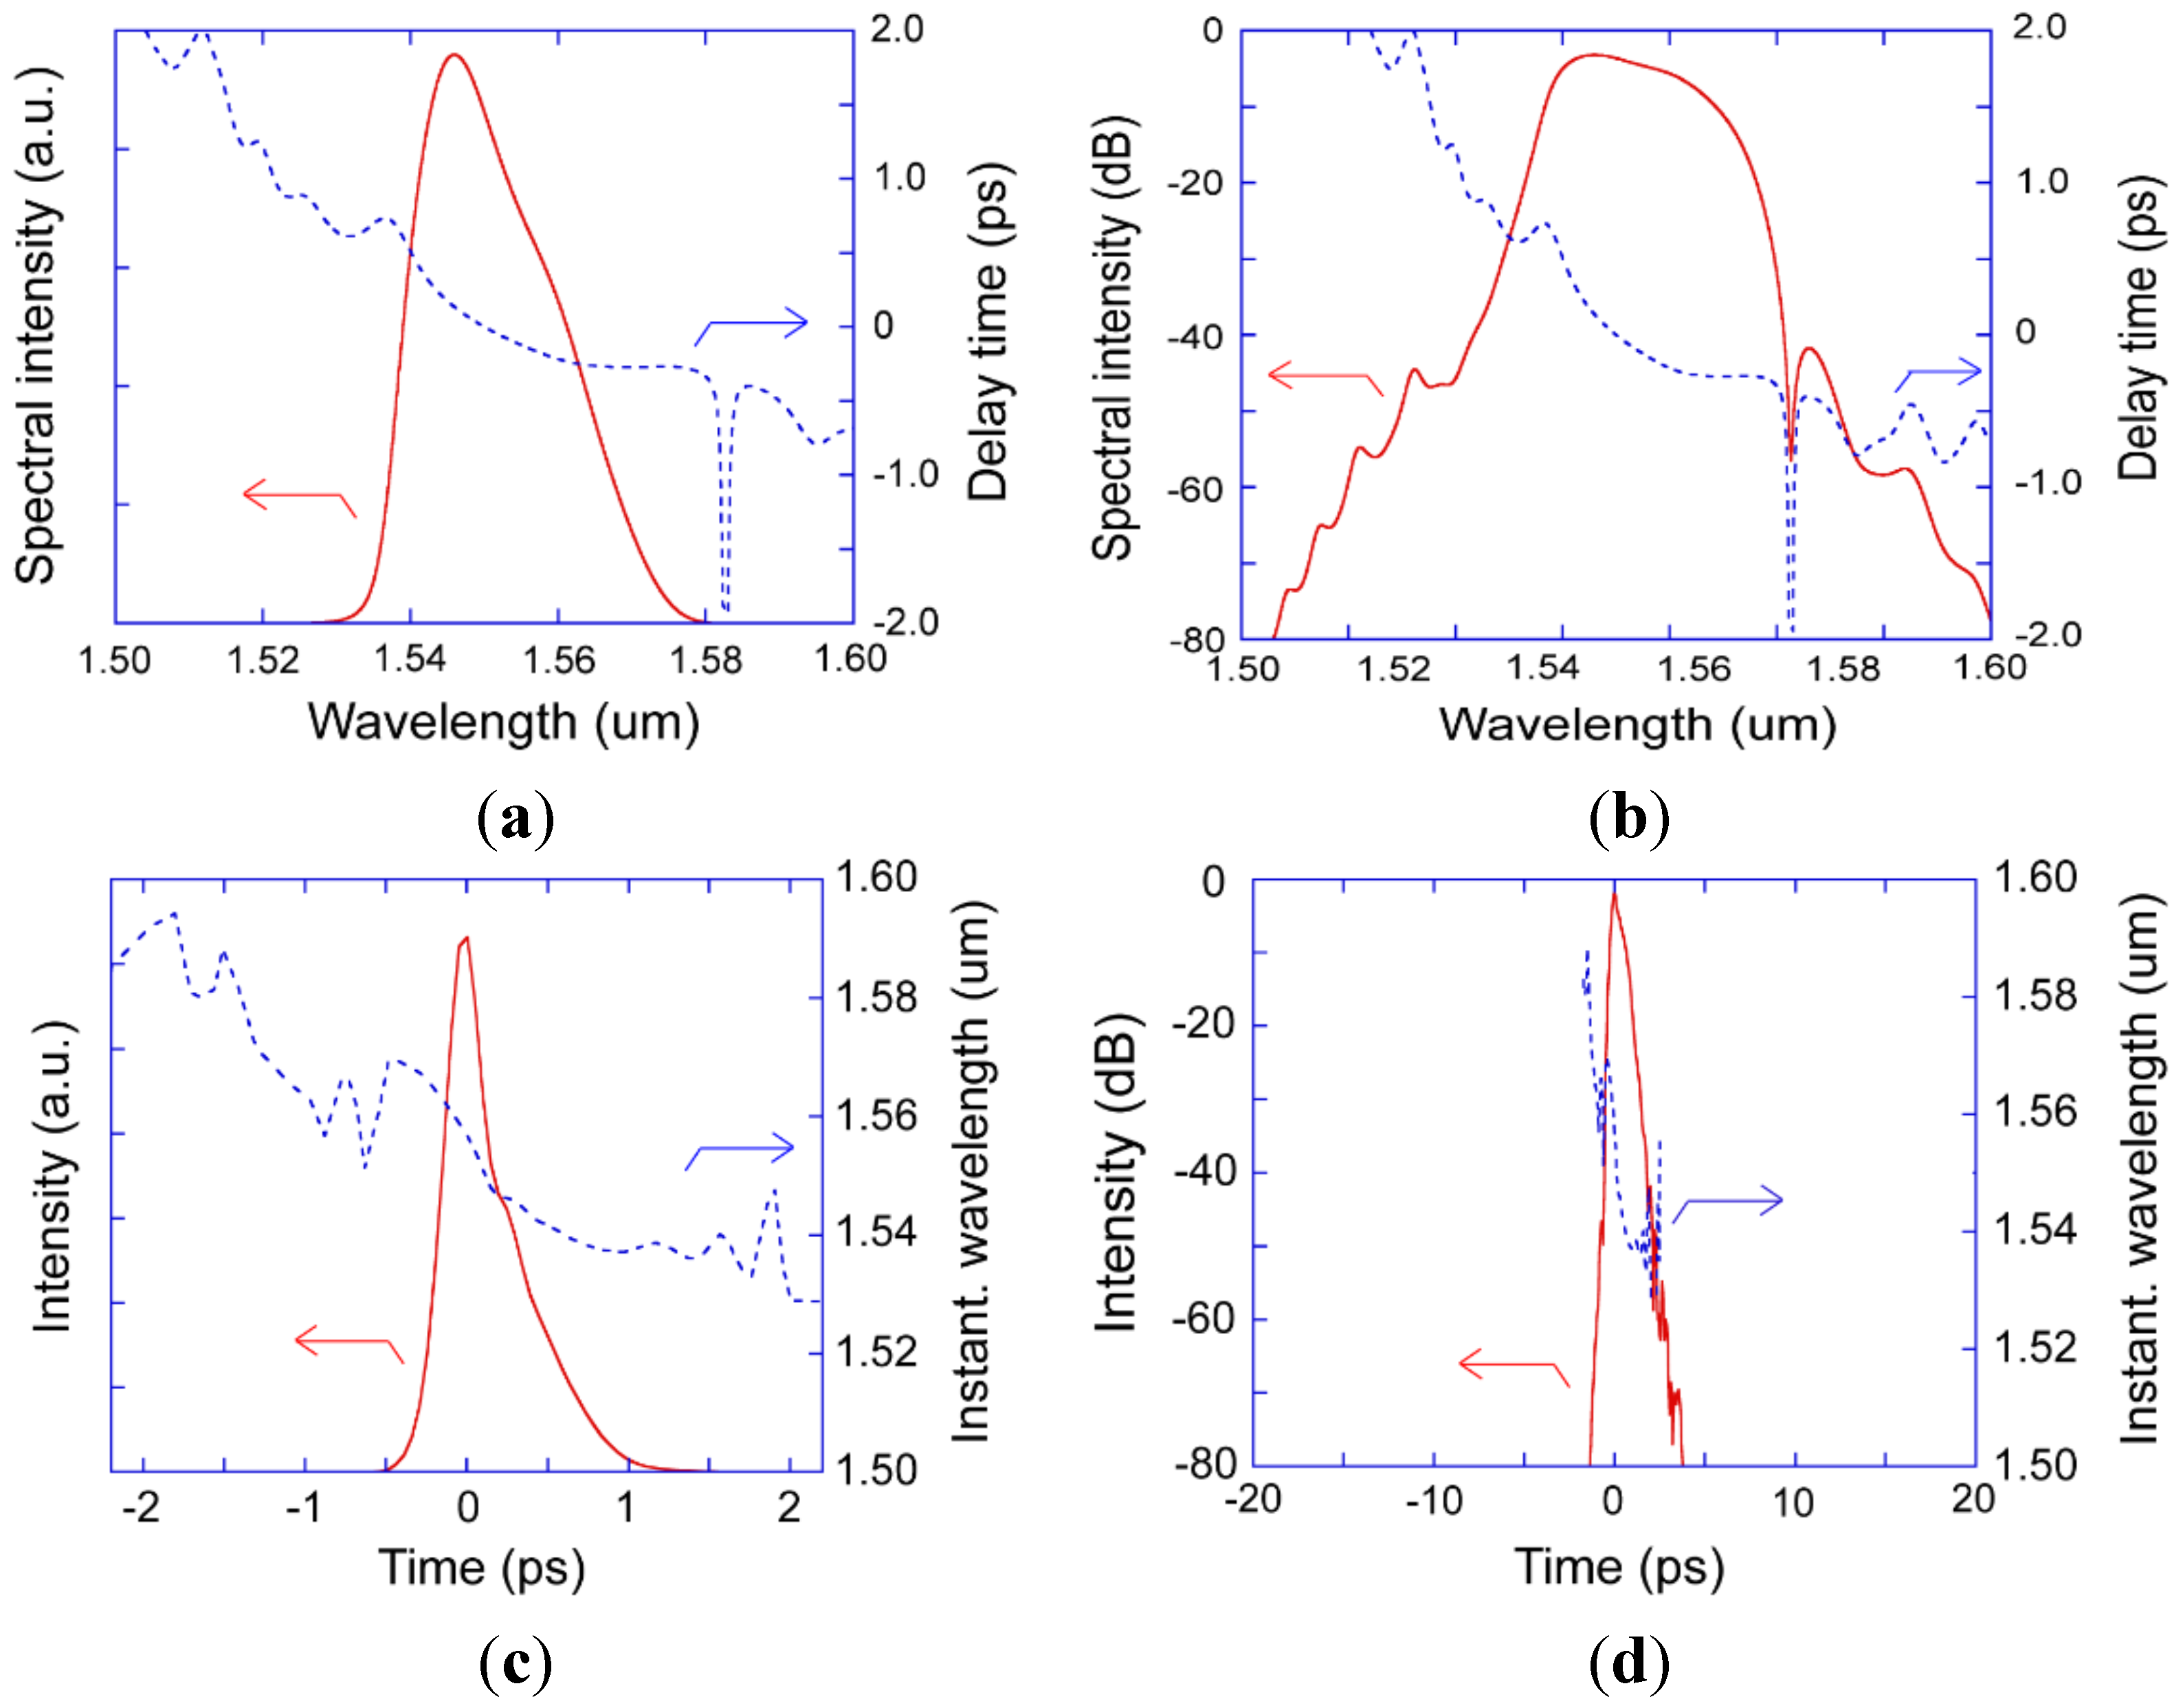
Figure 4 shows the spectral and temporal waveforms of oscillating pulses at the laser output. As the numerical results, the temporal width was 265 fs, and the spectral width was 9.3 nm FWHM. The average power was 6.8 mW. In the experiments, the temporal width, spectral width, and average power were 249 fs, 10.0 nm, and 2.9 mW, respectively, when
DT = −0.032 ps
2 and the repetition rate was 39.4 MHz [
16]. The output characteristics showed similar behavior to the experimental ones. Multiple pulse oscillation was observed when the pumping power was increased.
Figure 3.
Variation of temporal width and peak power of output pulse for initial passive mode-locking process in soliton mode-locking regime (DT = −0.05 ps2).
Figure 3.
Variation of temporal width and peak power of output pulse for initial passive mode-locking process in soliton mode-locking regime (DT = −0.05 ps2).
As shown in
Figure 3, many peaks arose in the temporal width, and a stable short pulse width and high peak power were achieved due to the soliton effect. Similar behavior was almost always observed, and the same mode-locked pulse was always exactly obtained regardless of the initial ASE noise condition. In this analysis, a stable, clean passively mode-locked pulse was obtained after ~1000 circulations. The required number of circulations decreased as the output coupling ratio was decreased.
Figure 4.
Characteristics of output pulse for soliton mode-locking regime without wavelength filter. (a,b) Spectral shapes on linear and log scales. (c,d) Temporal shapes on linear and log scales. Variations of spectral and temporal shapes of output pulse for initial mode-locking process are shown as movies in Media 1 and 2.
For the pulse spectra, a clear sech2-shaped spectrum with Kelly sidebands was obtained. The magnitude of chirping was small owing to the soliton effect. In the temporal shape, a wide pedestal component below −35 dB was observed. From information about the instantaneous wavelength and group delay, we can see that the Kelly sideband components propagated just before and after the main pulse component, and the instantaneous wavelength of the pedestal components at the front of the main pulse was shorter than that at the center wavelength, whereas that at the back was longer.
Therefore, it is considered that the pedestal components consist of Kelly sideband components. The same correspondence was also observed experimentally by frequency resolved optical gating (FROG) in Reference [
15].
Figure 5 shows the mode-locked pulse spectrum and its temporal waveform when we used a narrow-band wavelength filter to reduce the Kelly sideband components. The filter bandwidth was set to 7.8 nm FWHM to fit the spectral shape. We can see that the Kelly sideband components were effectively reduced by the wavelength filter, resulting in the elimination of temporal pedestal components in
Figure 5. From this result, we confirmed that Kelly sideband components form the pedestal components of the output pulses in the soliton mode-locking regime.
As experimentally shown in Reference [
16], when
DT = −0.02 ps
2, the magnitude of the Kelly sidebands and the corresponding pedestal component were small compared with those when
DT = −0.05 ps
2.
Figure 5.
(a) Spectral and (b) temporal shapes of output pulses on log scale when a wavelength filter was used to remove the Kelly sideband components.
Figure 5.
(a) Spectral and (b) temporal shapes of output pulses on log scale when a wavelength filter was used to remove the Kelly sideband components.
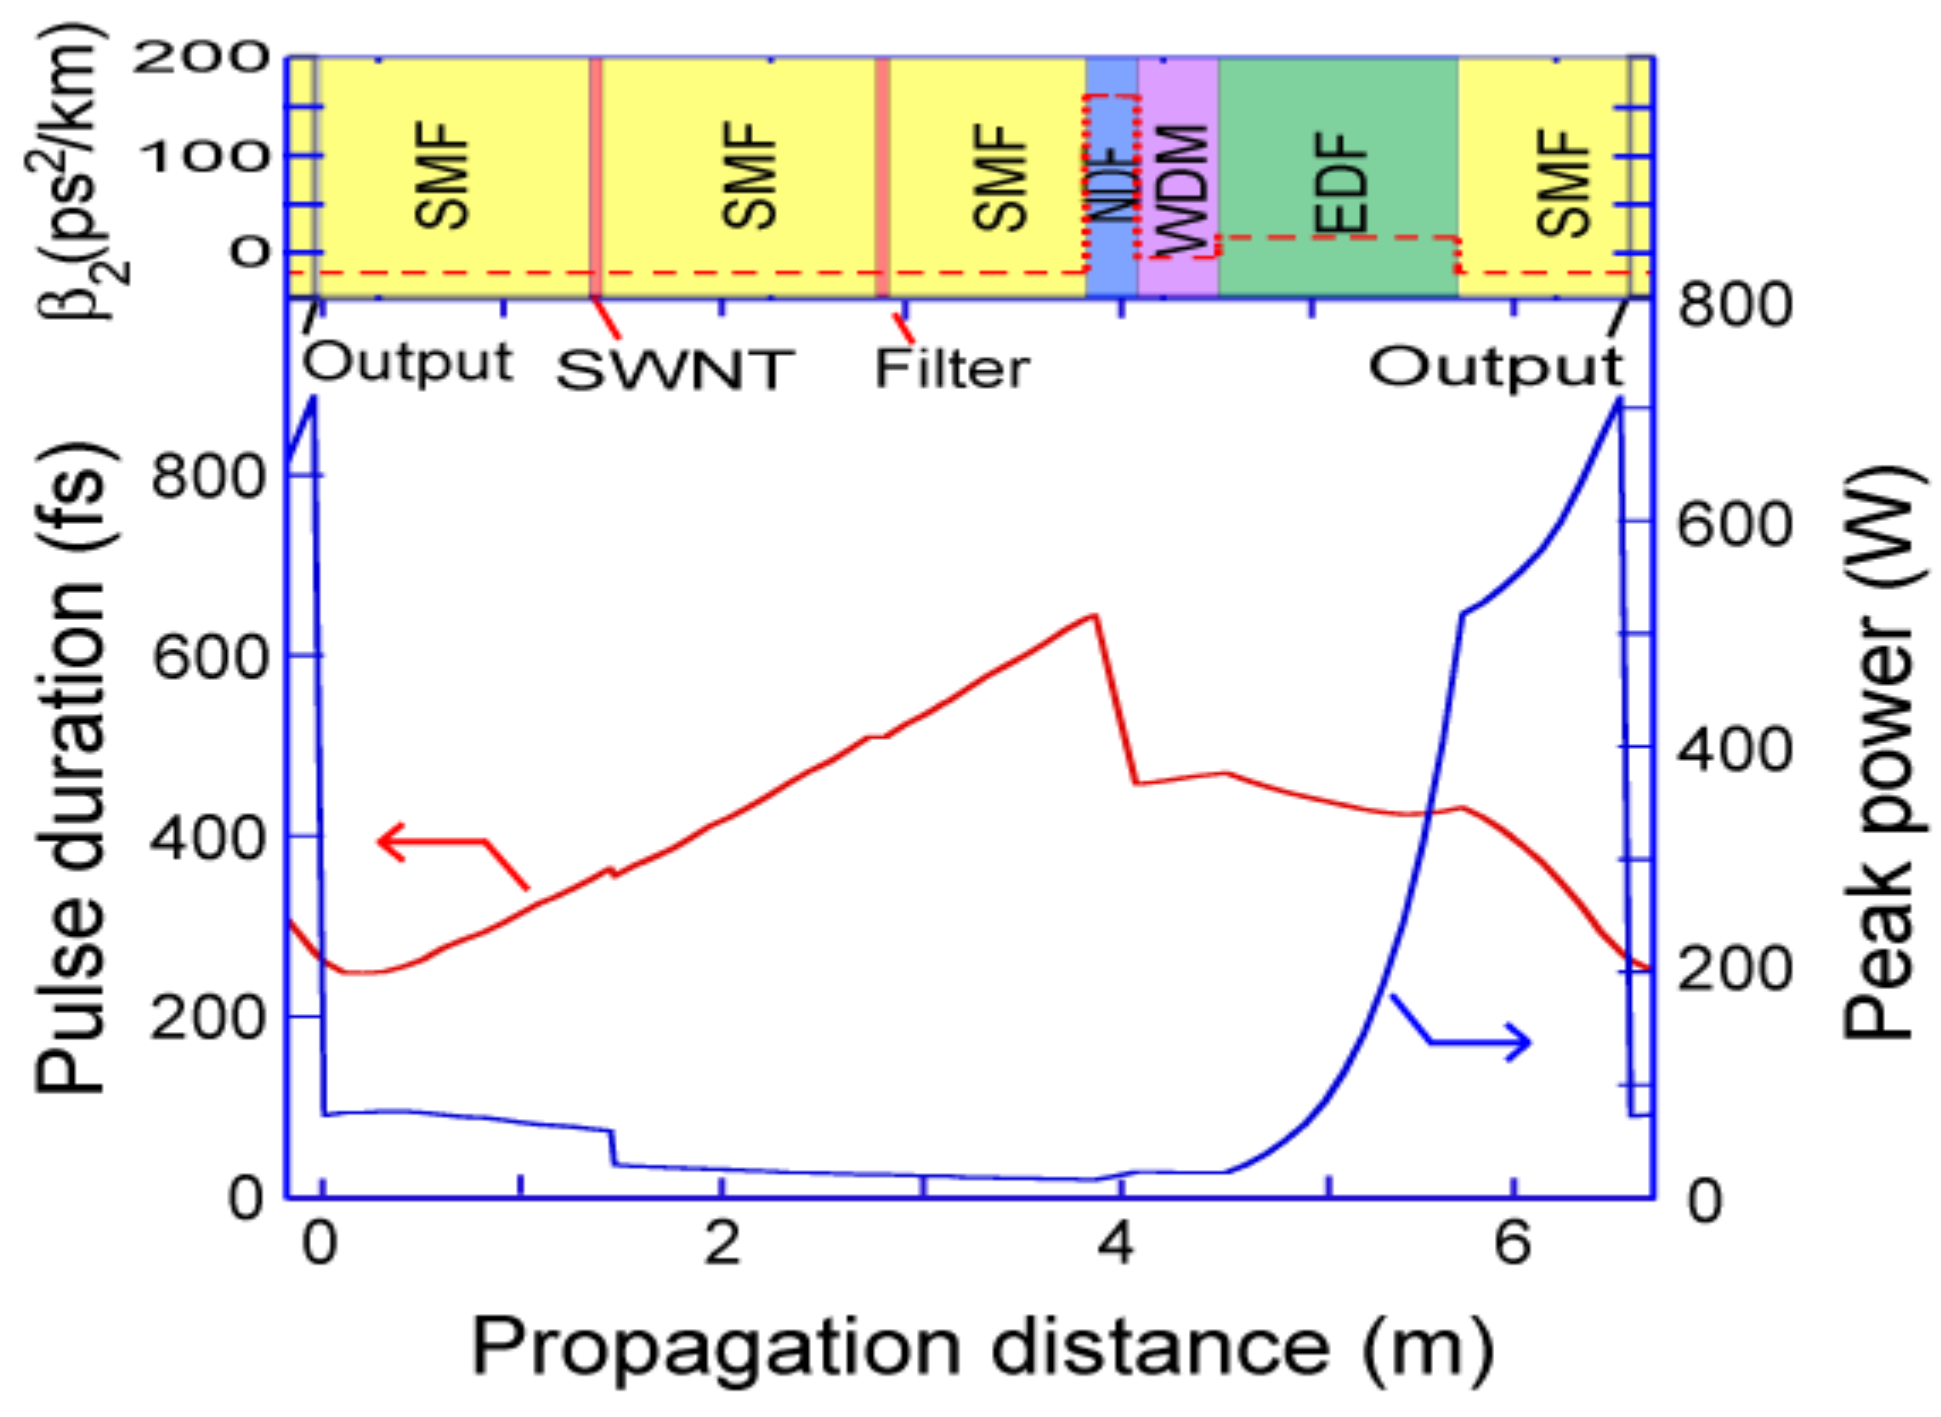
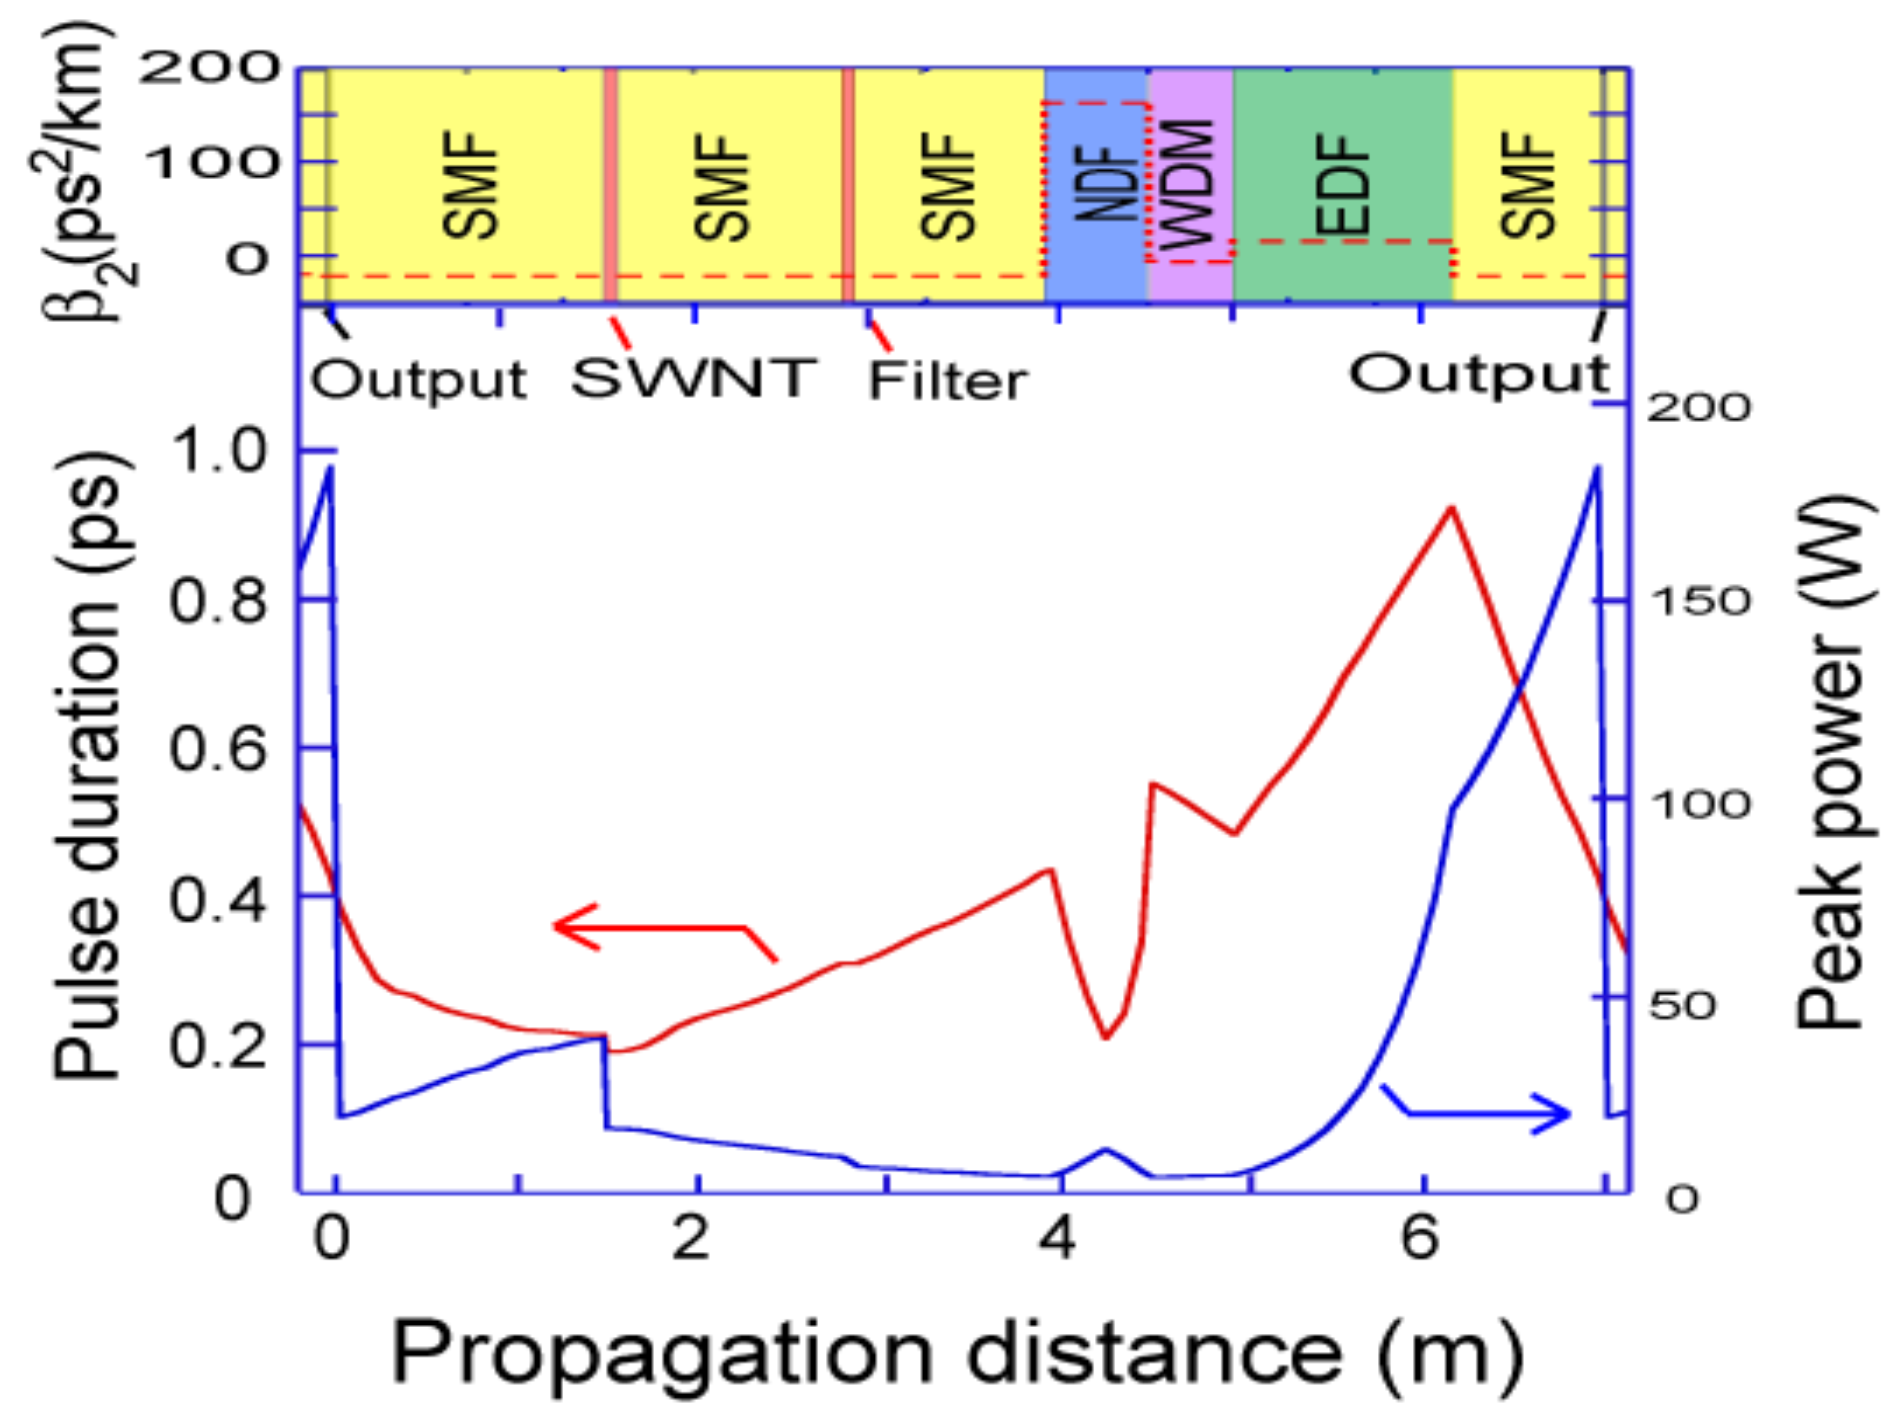
Figure 6 shows the variation of the pulse duration and peak power for a cavity round-trip in the stable soliton mode-locking regime. It is interesting to note that almost the shortest pulse was achieved at the output coupler. Since the output coupling ratio was 90%, a large part of the pulse energy was picked out at the output coupler. Thus, soliton compression did not occur after the output coupler, and the pulse started to broaden due to anomalous dispersion. Then, the pulse was compressed in the NDF by normal dispersion. At the EDF, the pulse was rapidly amplified by ~13 dB in this case. After the EDF, soliton compression occurred up until the pulse reached the output coupler owing to the high peak power. The laser output was a sech
2-shaped, almost-chirp-free pulse. The spectral width was almost constant at 9.2 ± 0.3 nm.
Figure 6.
Dynamics of pulse propagation inside the fiber laser cavity for soliton mode-locking regime.
Figure 6.
Dynamics of pulse propagation inside the fiber laser cavity for soliton mode-locking regime.
3.2. Dissipative-Soliton Mode-Locking Regime (DT > 0)
Next, we examined the strong normal dispersion regime. The length of the NDF was 100 cm and
DT was +0.08 ps
2. In this condition, dissipative-soliton mode-locking operation was achieved, and a high-energy picosecond pulse was generated [
16,
30,
31,
32]. The repetition rate was 27.4 MHz. The filter bandwidth was set to 25 nm FWHM.
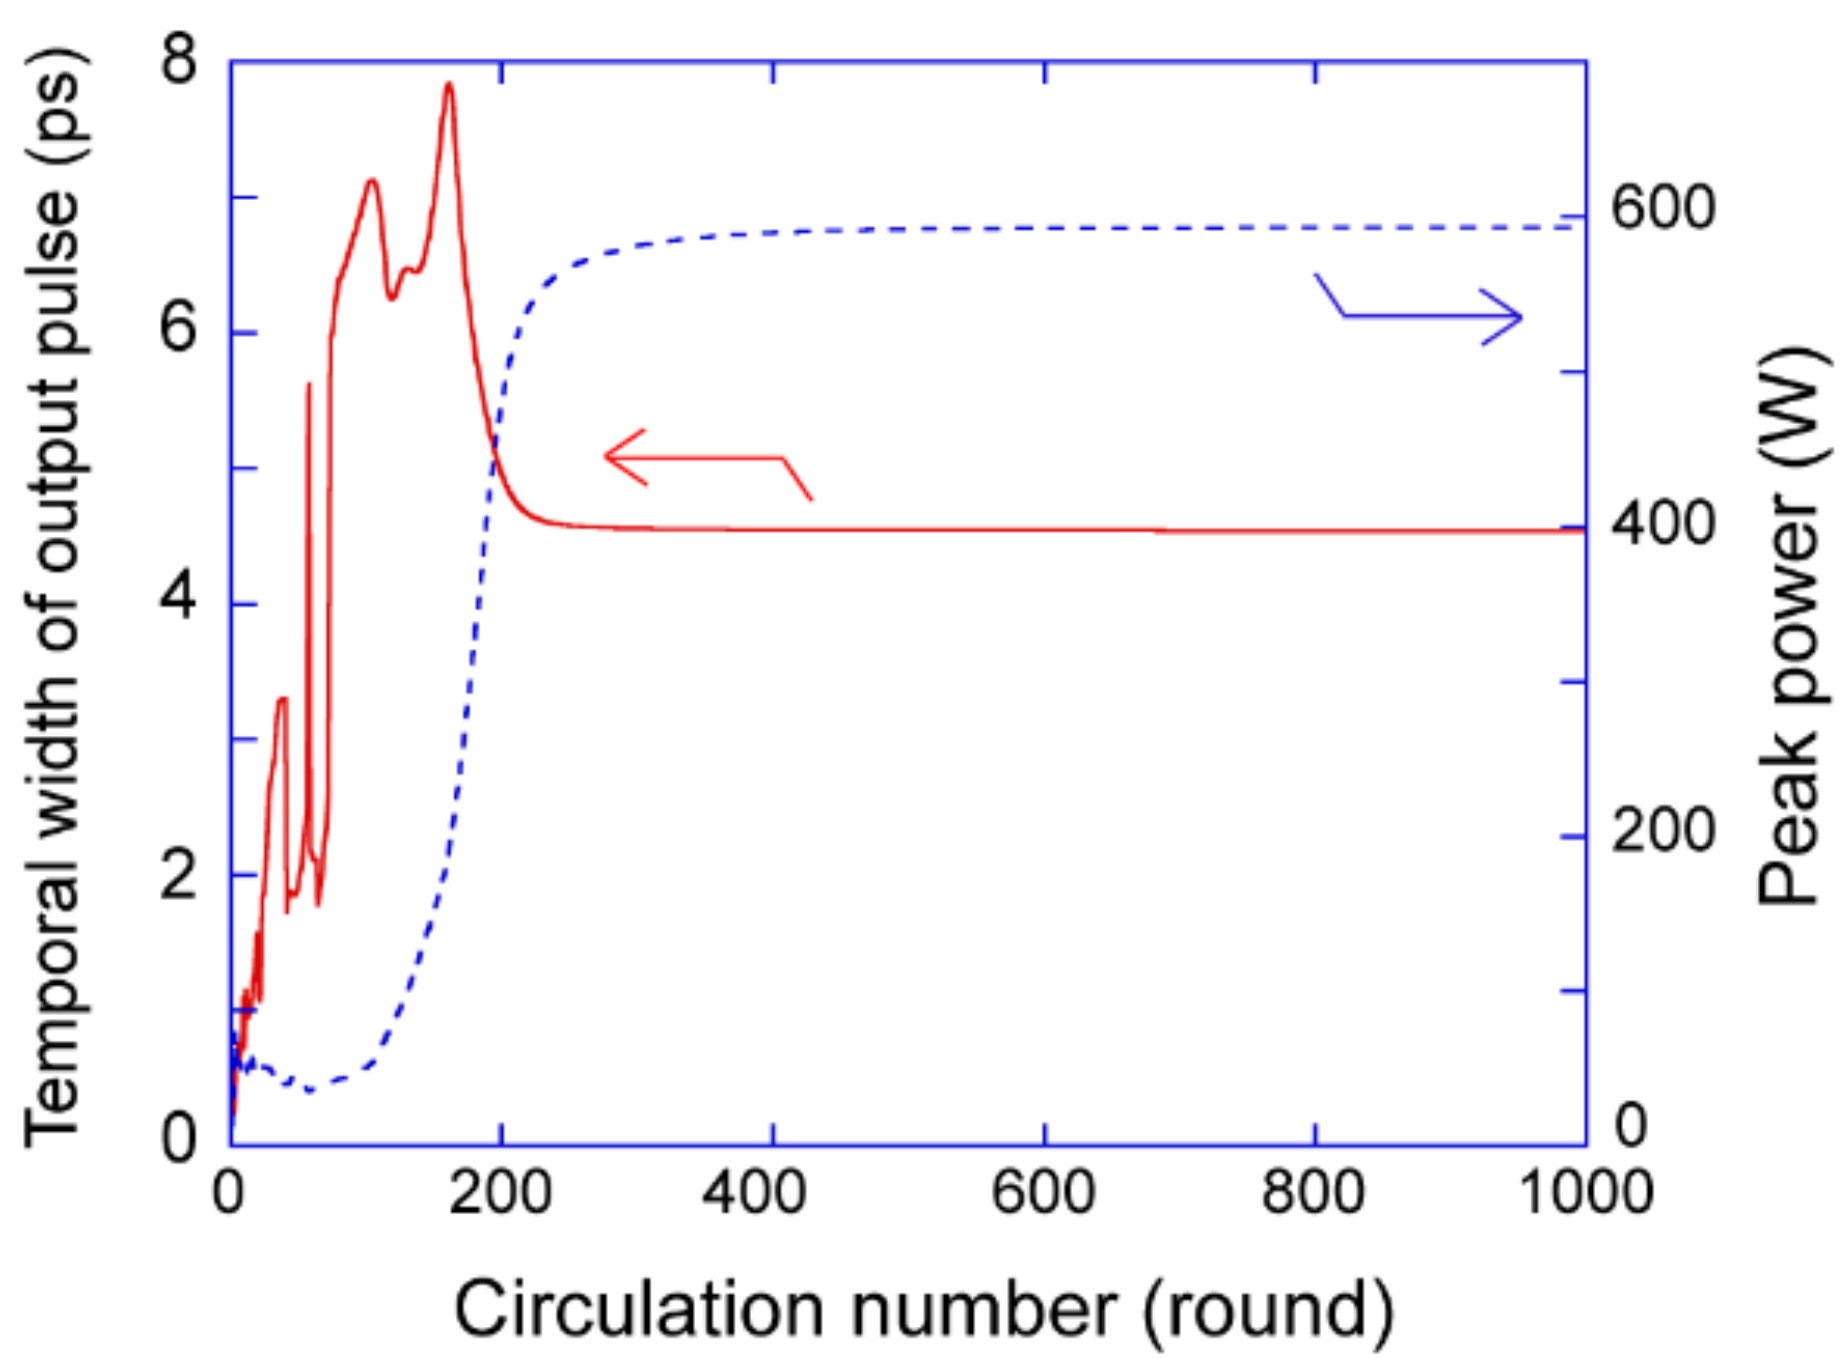
Figure 7 shows the variation of the pulse duration and peak power for the initial process of passive mode locking. The variations of the spectral and temporal shapes of the circulating pulse are shown as movies in Media 3 and 4. Initially, both the temporal width and peak power increased as the circulation number increased. Then, the formation of a mode-locked pulse was achieved in a relatively small number of round trips (~300) even for a large output coupling ratio of 90%. After that, the background noise level gradually decreased, and a clean, stable mode-locked dissipative soliton pulse was generated at ~1100 rounds.
Figure 7.
Variation of temporal width and peak power of output pulse for initial passive mode-locking process in dissipative-soliton mode-locking regime (DT = +0.08 ps2).
Figure 7.
Variation of temporal width and peak power of output pulse for initial passive mode-locking process in dissipative-soliton mode-locking regime (DT = +0.08 ps2).
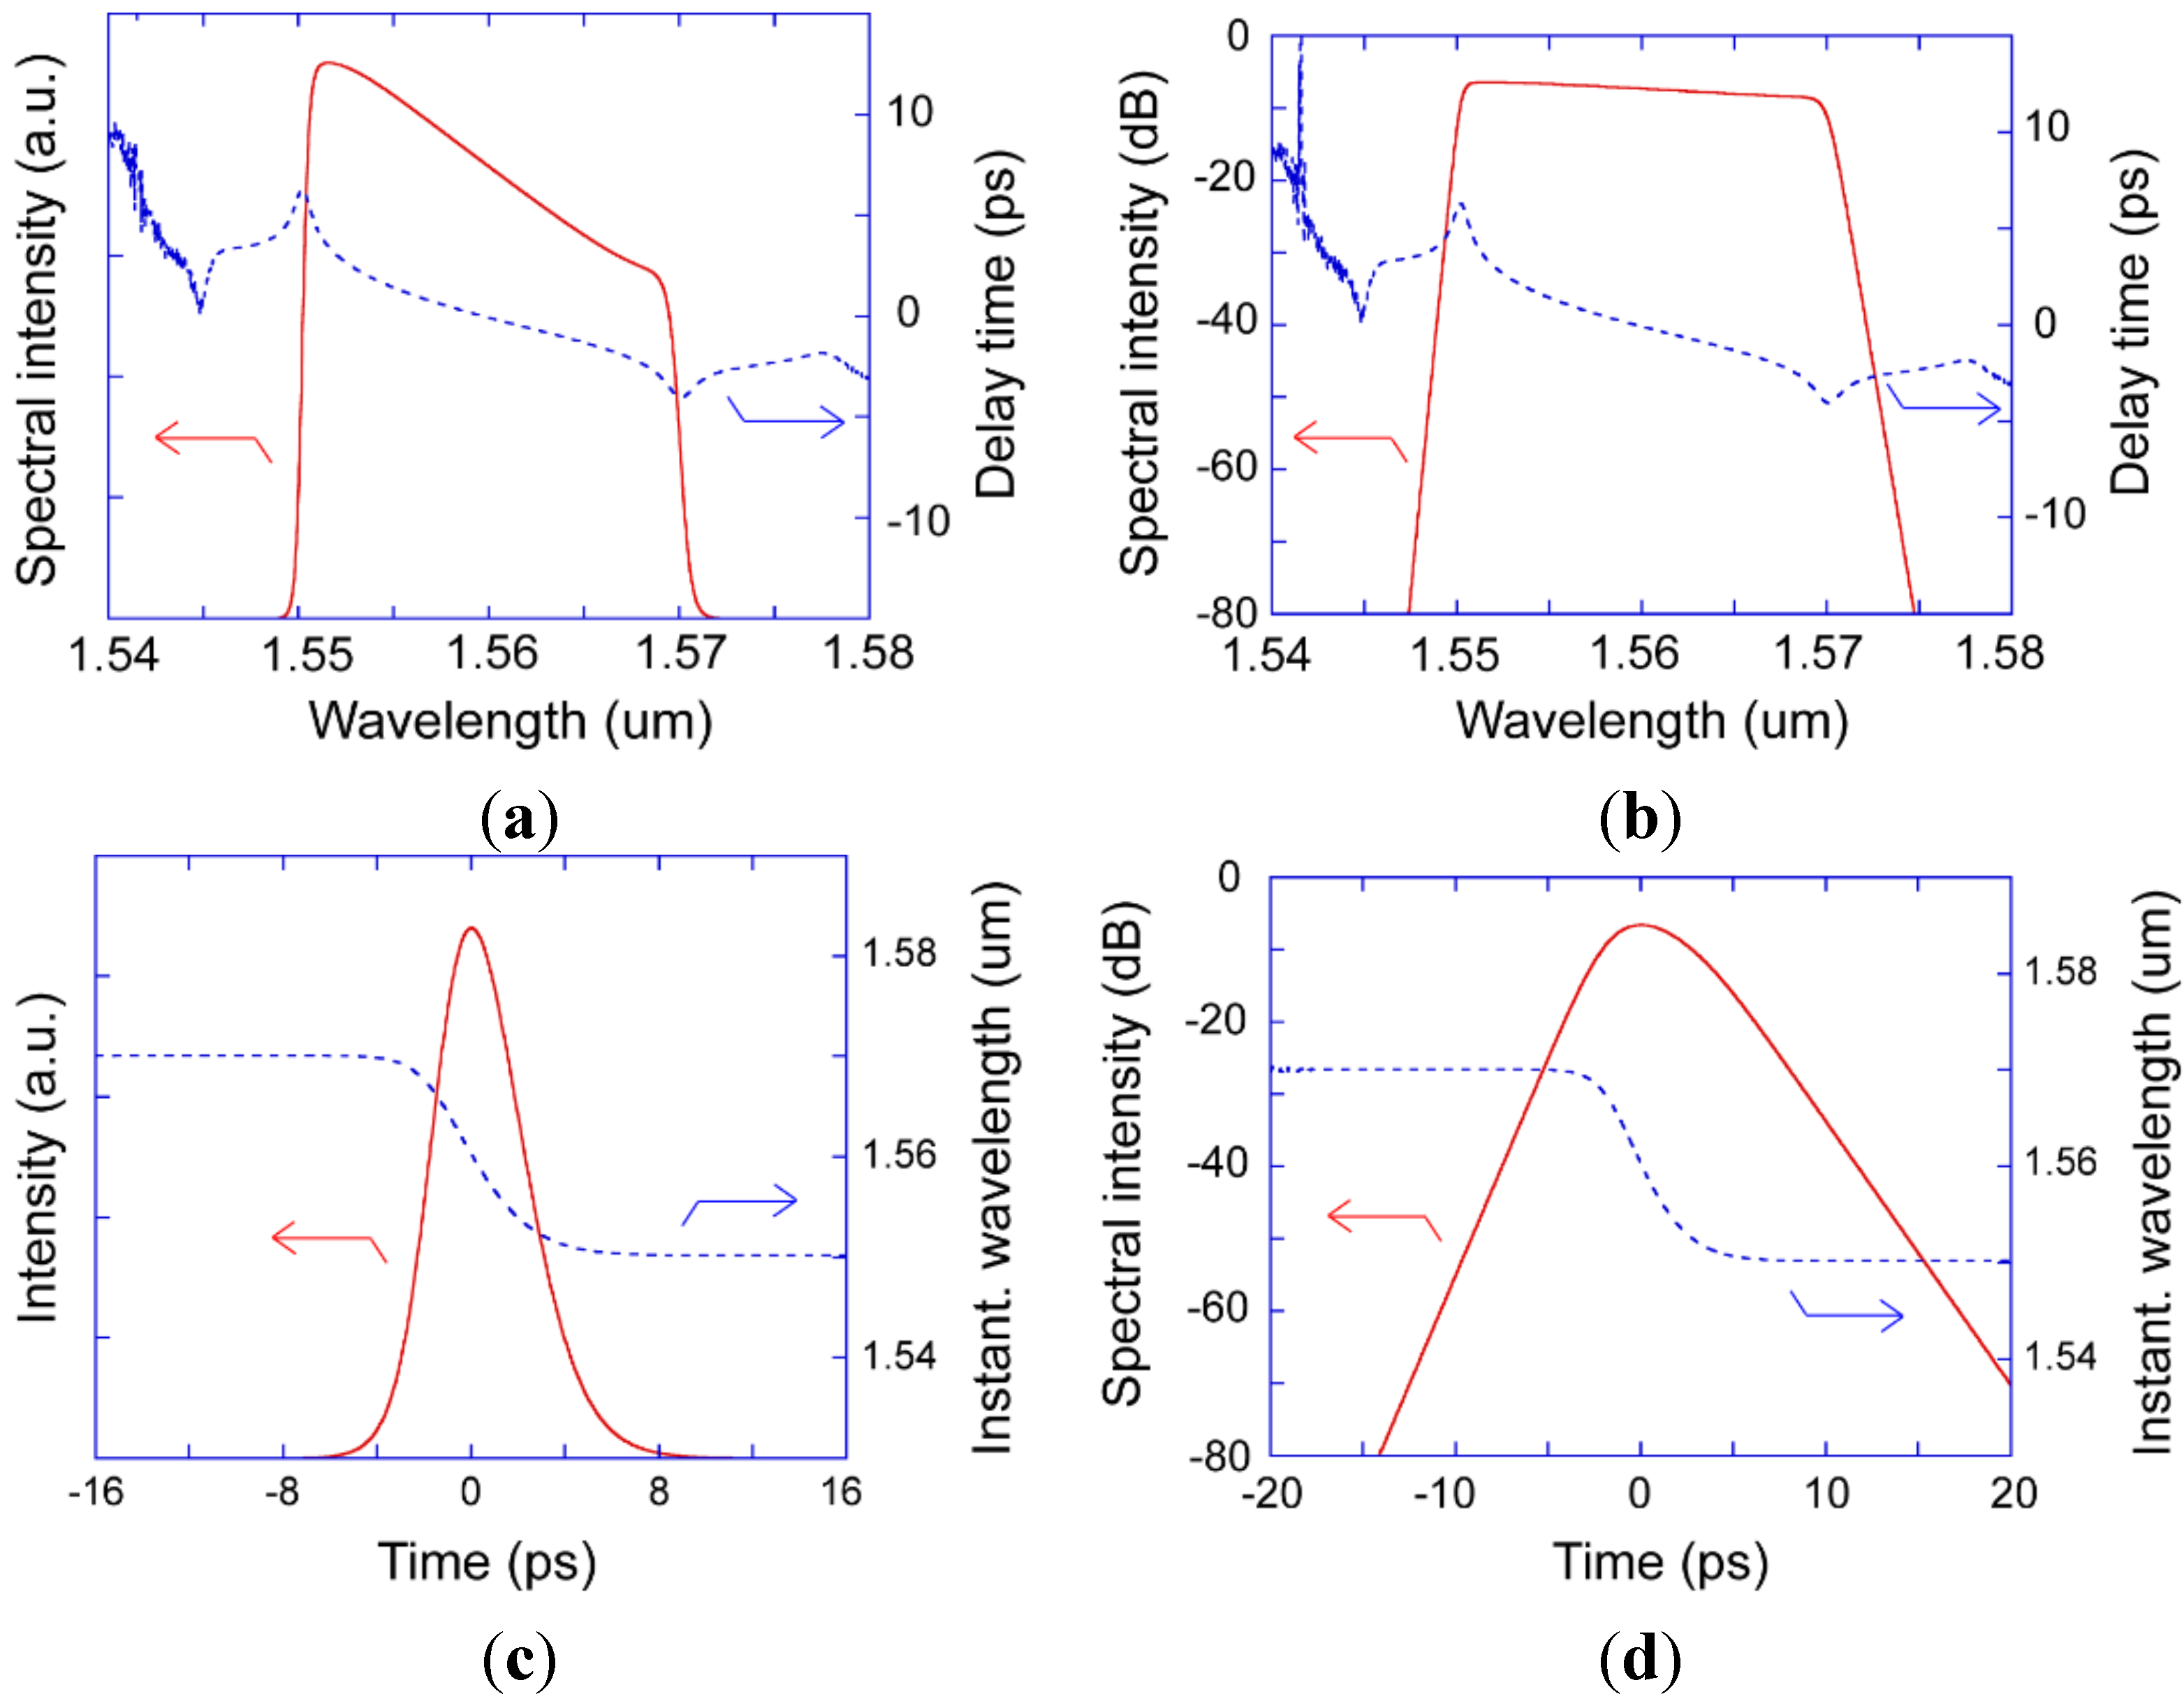
Figure 8 shows the spectral and temporal shapes of the output pulses. The spectral shape had steep edges at both sides and an inclined smooth roof. The spectral width was 19.2 nm, and the temporal width was 4.54 ps FWHM. The average power was 111 mW. For the temporal shape, a Gaussian-like, almost linearly up-chirped picosecond pulse was generated. It is interesting to note that there was no pedestal component around the main pulse.
The shaping process of the circulating pulses can be seen in Media 3 and 4. Multiple spectral peaks appeared due to self-phase modulation (SPM) in the process of shaping the mode-locked pulse in Media 3. The variation of the temporal shape was similar to that for the soliton mode-locking regime.
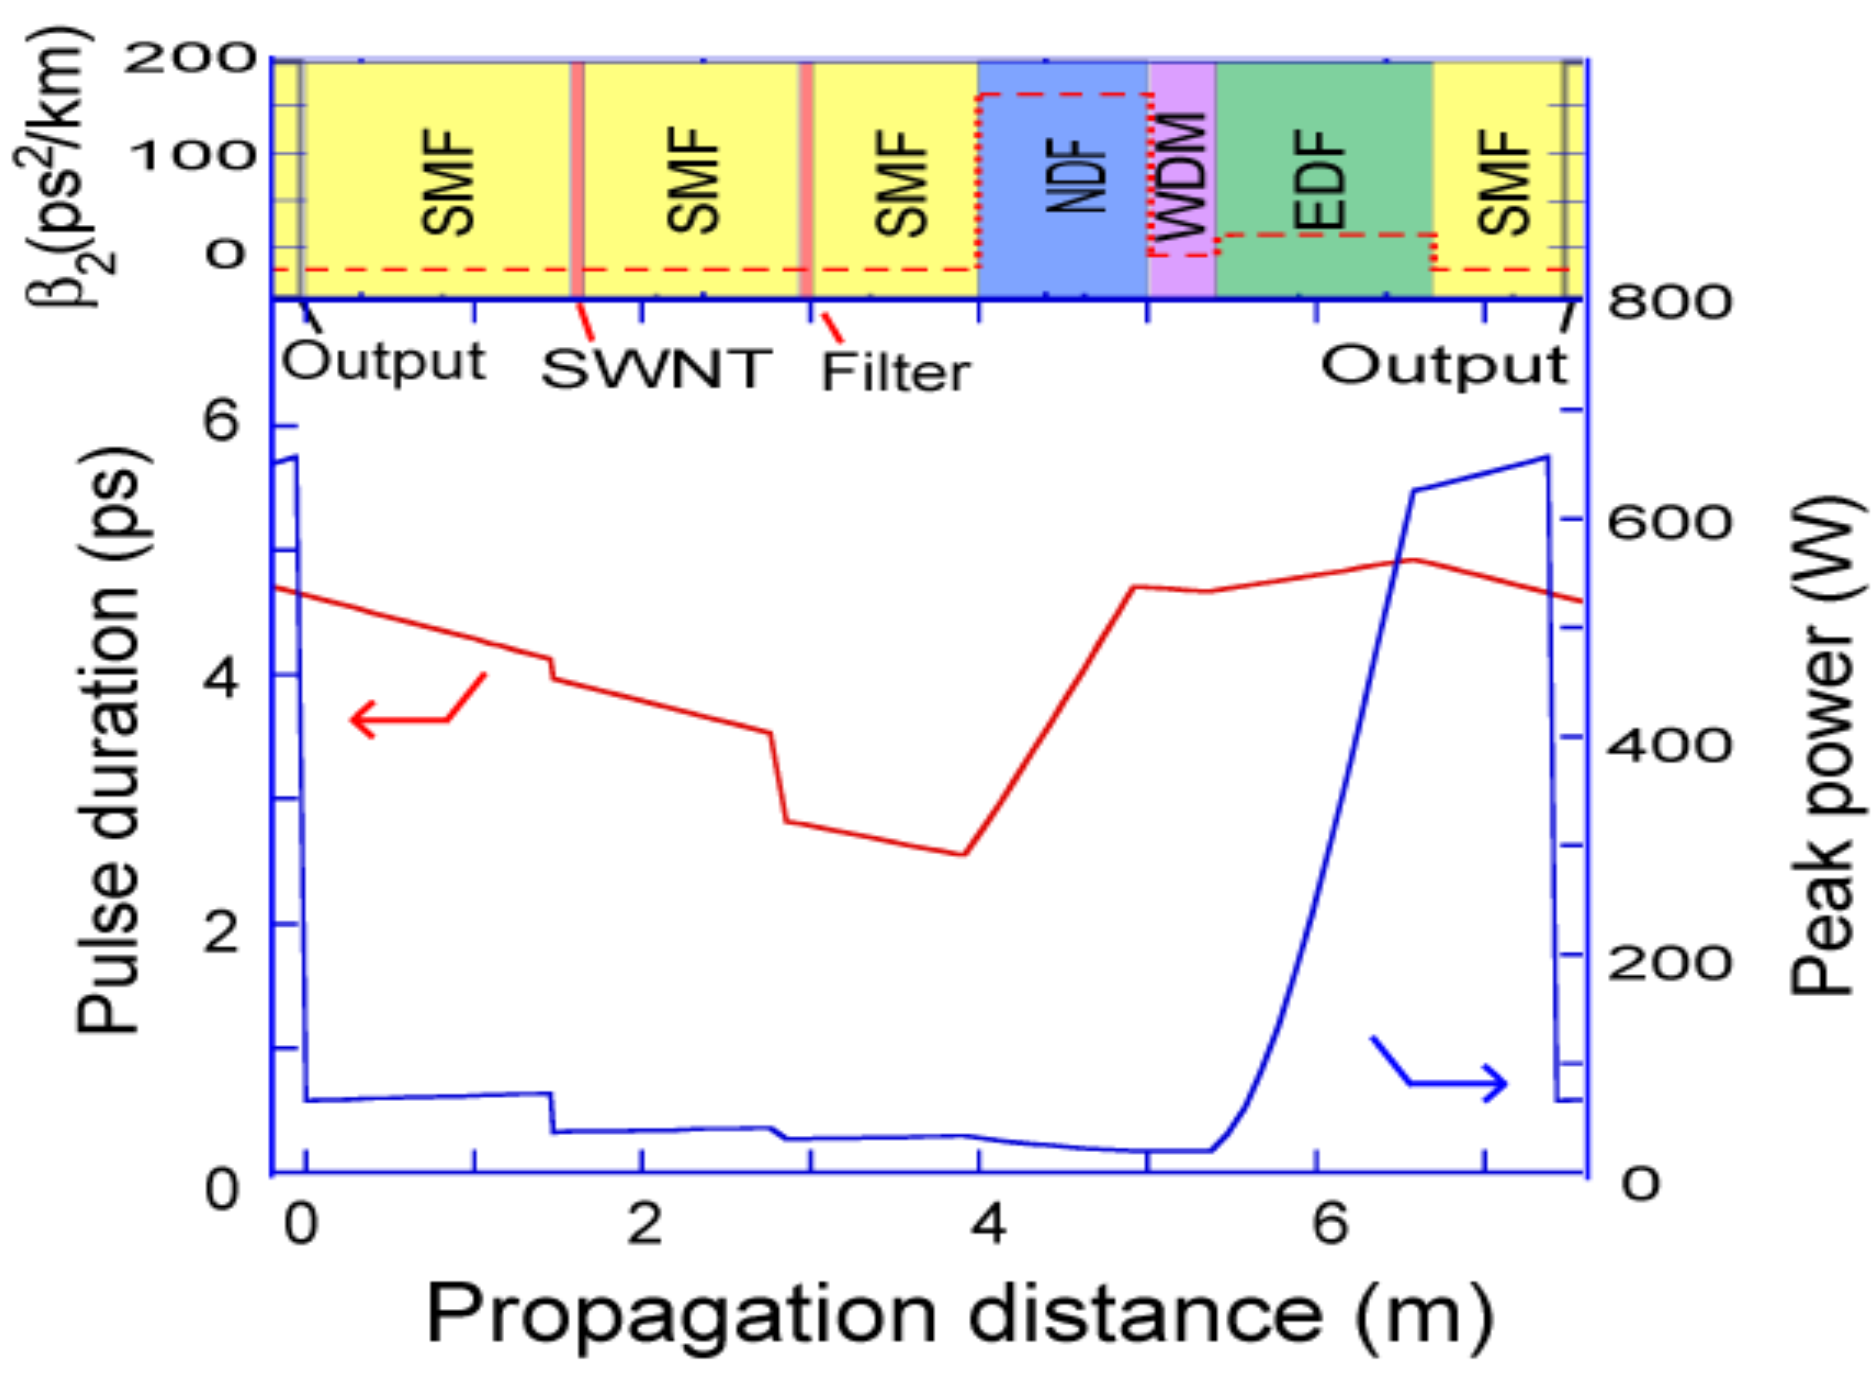
Figure 9 shows the variation of the pulse duration and peak power for a cavity round-trip. The pulse had the minimum width at the input of the NDF and rapidly broadened, taking the maximum width at the output of the EDF. Then, the pulse width continuously decreased in other anomalous-dispersion fibers. Additional temporal narrowing can be seen at the SWNT film and the wavelength filter. The peak power was rapidly amplified at the EDF by ~20 dB, and the 90% component was picked off as the output. Since the peak power was suppressed, except for in EDF, the amount of induced SPM was well-suppressed. The high output coupling ratio is also effective in protecting against optical damage in the SWNT film. The spectral width was almost constant at 18.9 ± 0.5 nm.
As the bandwidth of the filter was reduced, the temporal width of the mode-locked pulse was also reduced. In the experiments, the temporal width, spectral width, and average power were 3.05 ps, 15.6 nm, and 105 mW, respectively, when
DT = +0.082 ps
2 and the repetition rate was 33.8 MHz [
16]. The numerical results showed similar behavior to the experimental ones.
Figure 8.
Characteristics of output pulse for dissipative-soliton mode-locking regime. (a,b) Spectral shapes on linear and log scales. (c,d) Temporal shapes on linear and log scales. Variations of the spectral and temporal shapes of the output pulse for the initial mode-locking process are shown as movies in Media 3 and 4.
Figure 9.
Dynamics of pulse propagation inside the fiber laser cavity for dissipative-soliton mode-locking regime.
Figure 9.
Dynamics of pulse propagation inside the fiber laser cavity for dissipative-soliton mode-locking regime.
3.3. Stretched-Pulse Mode-Locking Regime (DT ~ 0)
Finally, we examined the near-net-zero dispersion condition. In experiments reported in References [
16,
33], although multiple pulse oscillation was observed, stable single-pulse mode-locking was not achieved. In the numerical analysis, single-pulse mode-locking was also not observed for the actual properties of the SWNT film, similar to the experiment. When we assumed a deeper modulation depth twice as large as that achieved in the LA-SWNT film, single-pulse mode-locking operation was observed for the stretched-pulse mode-locking regime [
33,
34]. Here, we assumed 55 cm of NDF. The net dispersion was
DT = +0.007 ps
2. The corresponding repetition rate was 29.2 MHz. The bandwidth of the wavelength filter was set to be as wide as 100 nm to obtain the widest pulse spectrum.
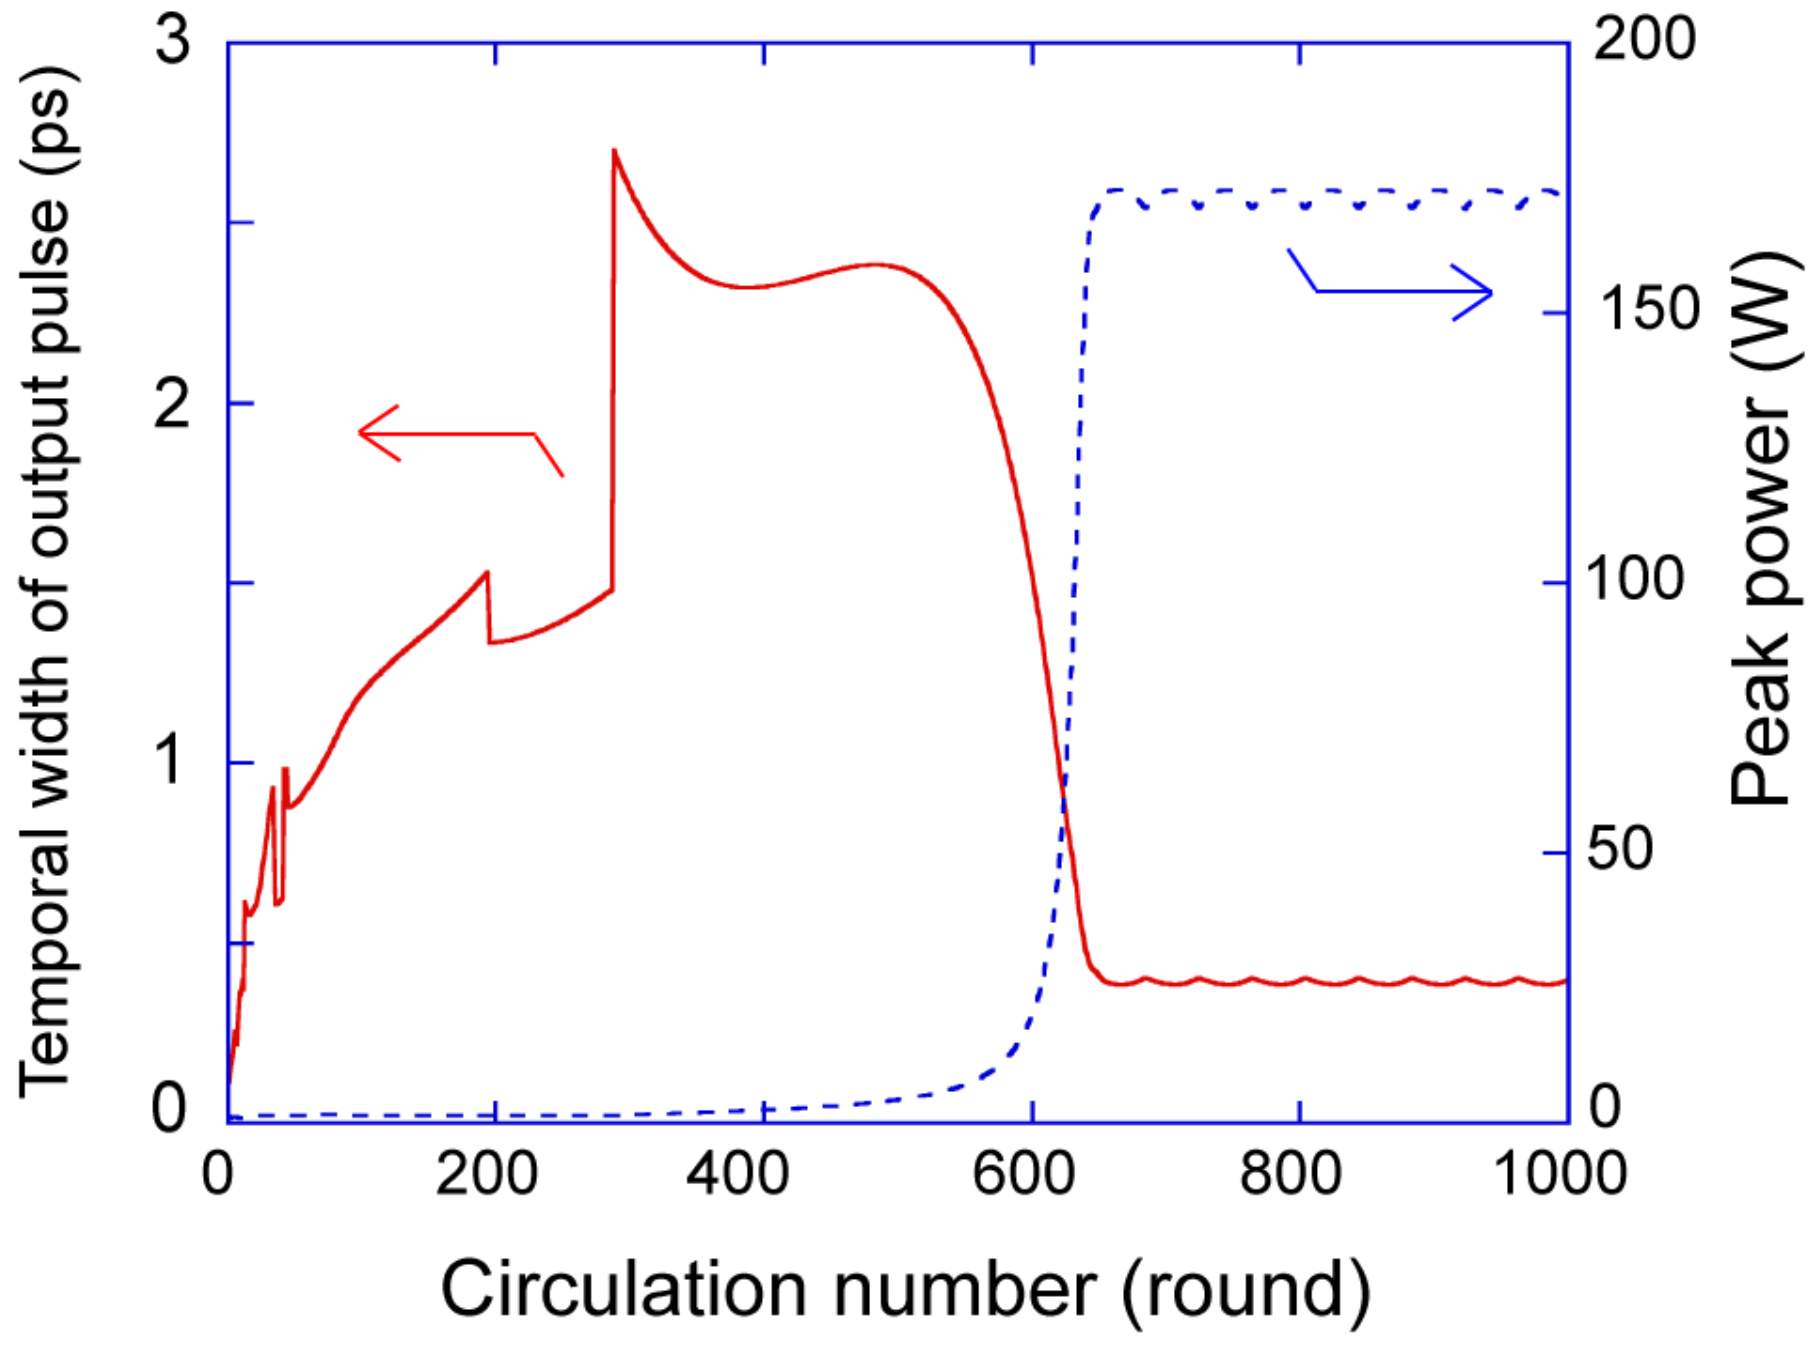
Figure 10 shows the variation of the pulse duration and peak power for the initial process of passive mode-locking. The variations of the spectral and temporal shapes of the circulating pulse are shown as movies in Media 5 and 6. The pulse duration increased as the number of circulations increased, and it suddenly started decreasing while showing a smooth curve. At the same time, the peak power also suddenly increased, and then stable mode-locking was achieved. A small periodical modulation of ~2% was observed in the peak power and pulse width.
Figure 10.
Variation of temporal width and peak power of output pulse for initial passive mode-locking process in dissipative soliton mode-locking condition (DT = +0.02 ps2).
Figure 10.
Variation of temporal width and peak power of output pulse for initial passive mode-locking process in dissipative soliton mode-locking condition (DT = +0.02 ps2).
Figure 11 shows the spectral and temporal shapes of the mode-locked pulses at the laser output for the stretched-pulse mode-locking regime. A broad pulse spectrum with a single smooth peak was observed. As mentioned above, since the temporal shape showed almost linear up-chirping properties, the temporal shape was similar to the spectral one. An almost linear up-chirping pulse without a pedestal component was achieved. The spectral width was 22.9 nm, and the temporal width was 390 fs. The largest spectral width was observed in terms of
DT. The spectral width was almost constant during the cavity round trip at 23.1 ± 0.8 nm. As the modulation depth increased, the spectral width increased.
Figure 12 shows the variation of the pulse duration and peak power for a cavity round-trip. There were two points where the temporal width was minimum: one is in the anomalous dispersion region, and the other is in the normal dispersion region. This behavior is characteristic of stretched-pulse mode-locking. Generally, the minimum point in normal dispersion region occurs in the EDF. For the cavity in this work, since the magnitude of normal dispersion in NDF is so large, the minimum point was observed in the NDF. The pulse showed the minimum width around the SWNT film and then started broadening. After the EDF, the pulse started narrowing, and the peak power increased. The highest peak power was achieved at the output coupler.
Figure 11.
Characteristics of output pulse for stretched-pulse mode-locking regime. (a,b) Spectral shapes on linear and log scales. (c,d) Temporal shapes on linear and log scales. Variations of the spectral and temporal shapes of the output pulse for the initial mode-locking process are shown as movies in Media 5 and 6.
Figure 12.
Dynamics of pulse propagation inside the fiber laser cavity for the stretched-pulse mode-locking regime.
Figure 12.
Dynamics of pulse propagation inside the fiber laser cavity for the stretched-pulse mode-locking regime.
3.4. Dependence on Net Dispersion, DT
With the setup shown in
Figure 1, we examined the dependence of the laser performance on the net dispersion,
DT. As in Reference [
16], the length of the NDF was varied to control the amount of
DT.
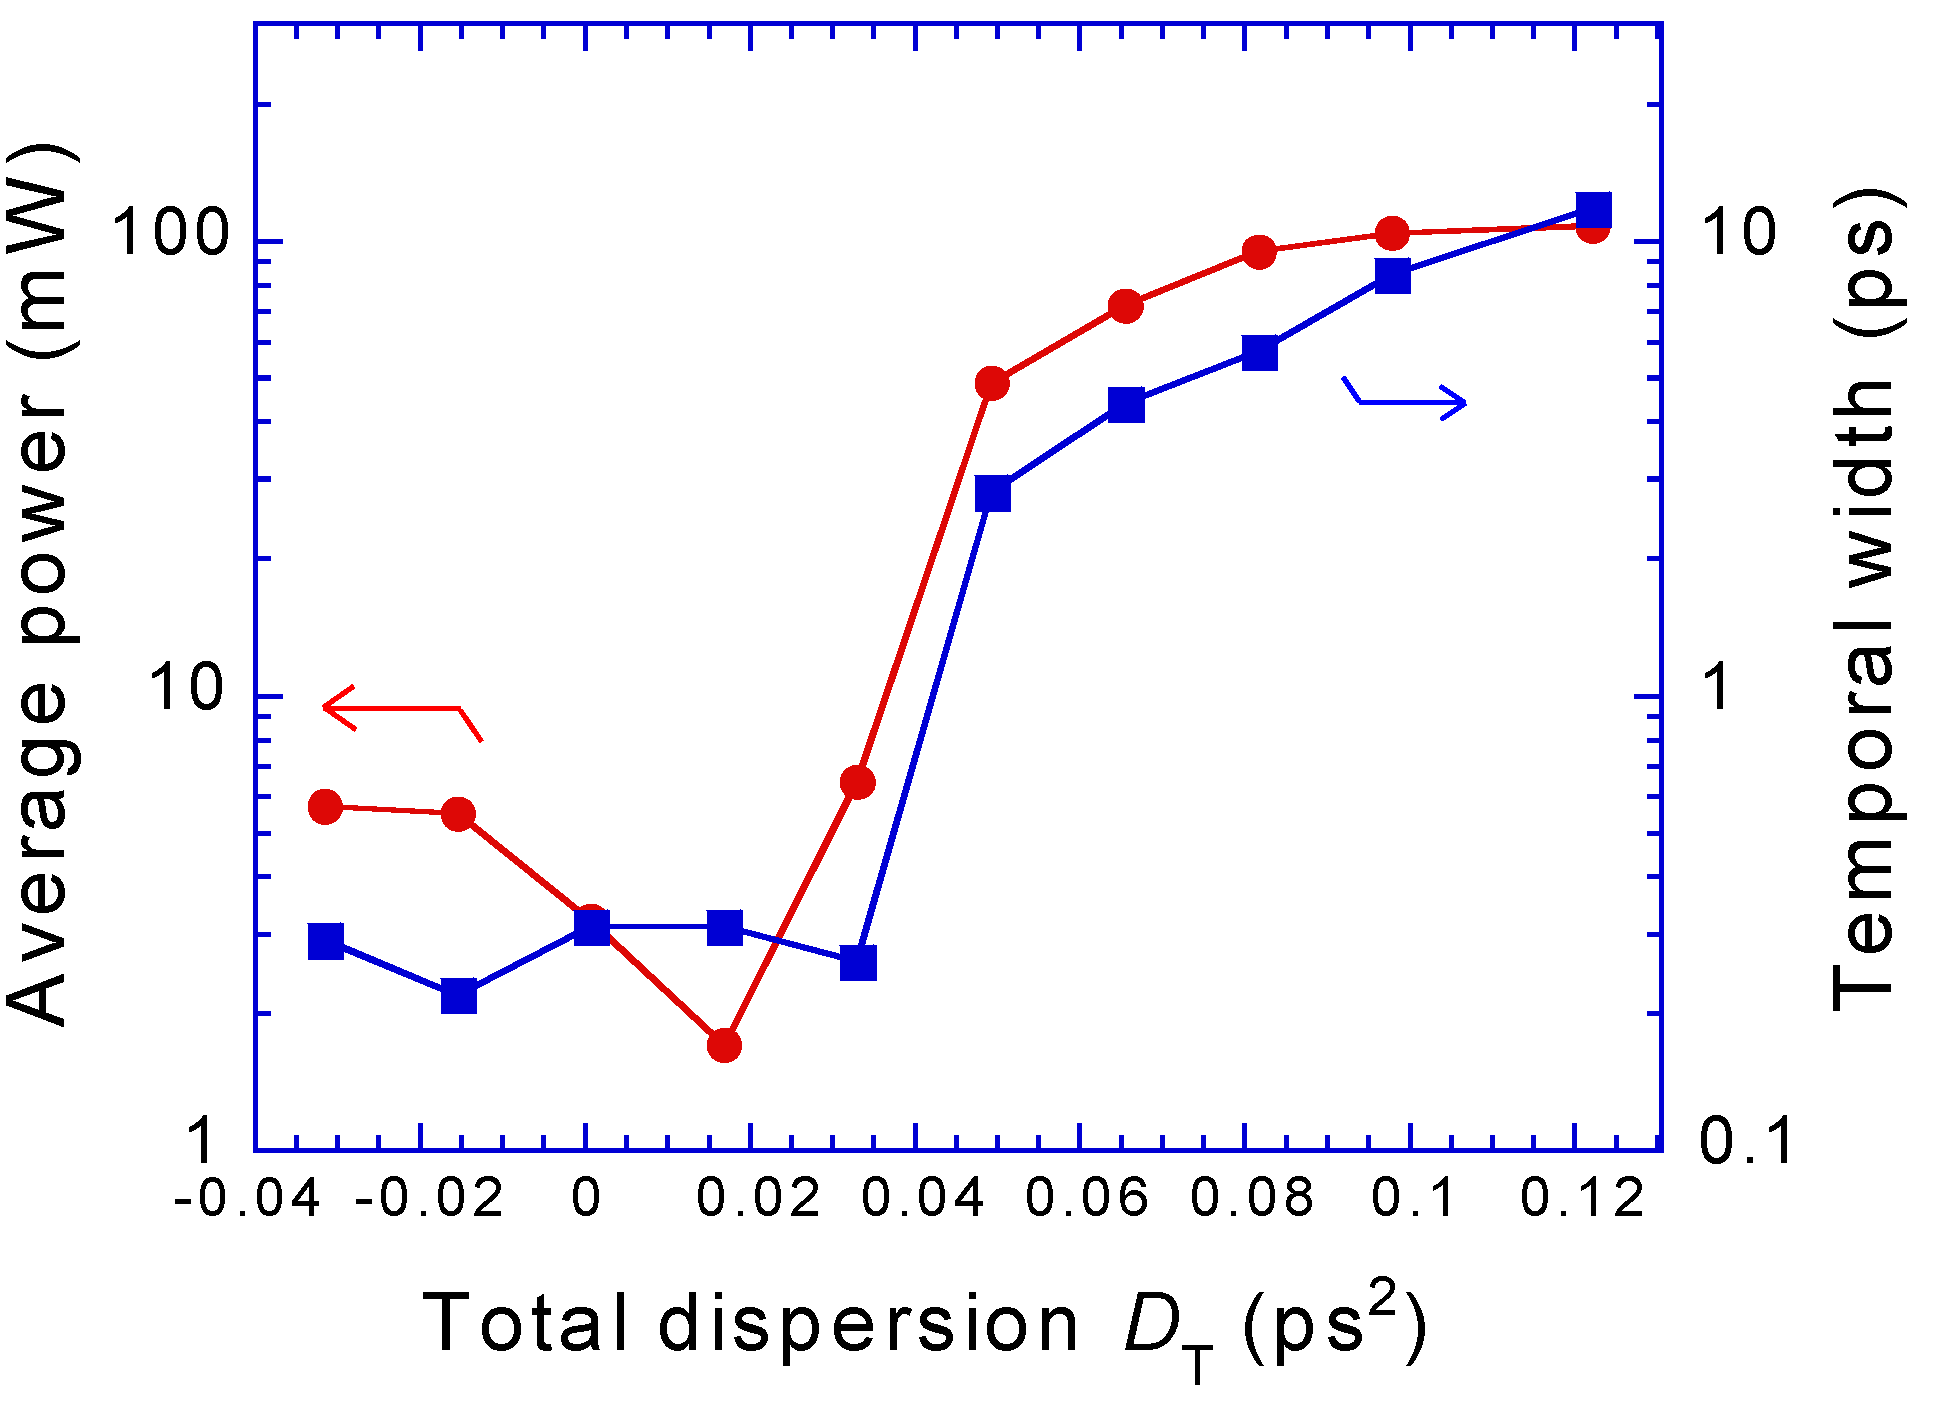
Figure 13 shows the variation of the maximum average power for single-pulse mode-locking and the temporal width of the output pulse as a function of
DT. For the region where
DT~0, the modulation depth was assumed to be twice as large as that in the actual LA-SWNT film. In agreement with the experimental results reported in Reference [
16], the achievable maximum power for single-pulse oscillation and the temporal width both increased as
DT increased. We can see that, in order to achieve high pulse energy, the strong normal dispersion regime is adequate, owing to the high single-pulse oscillation limit. The maximum power was limited by the available pump power of 900 mW in the experiment. In a recent experiment, when we used 1.7 W pump power, a maximum output power of up to 285 mW was observed [
17]. In terms of temporal width, the short pulses of 220-310 fs were obtained at |
DT| < 0.04 ps
2. The shortest pulse of 220 fs was obtained for
DT = −0.015 ps
2.
Figure 13.
Variation of maximum average power and temporal width of output pulse as a function of net dispersion, DT.
Figure 13.
Variation of maximum average power and temporal width of output pulse as a function of net dispersion, DT.
3.5. Effect of Response Time and Modulation Depth of SWNT Film
Generally, the recovery time of an SWNT film is from sub-picosecond to a few picoseconds, which is sometimes slower than the temporal width of mode-locked pulses. By the characteristic control of SWNT, such as chirality, diameter, and ratio of metallic and semiconducting SWNT, there is a possibility to control the response time of SWNT film. Thus, it is worth to investigating the effect of response time of SWNT film for fiber laser performance.
In this work, we examined the dependence of the laser performance on the response time of the SWNT film for the three mode-locking regimes that we investigated in the previous sections. Here, the recovery time up to the 90% level was varied from 10−13 to 10−10 s, exponentially.
When the recovery time was less than 10
−12 s, clear mode-locked pulses were achieved for all three regimes.
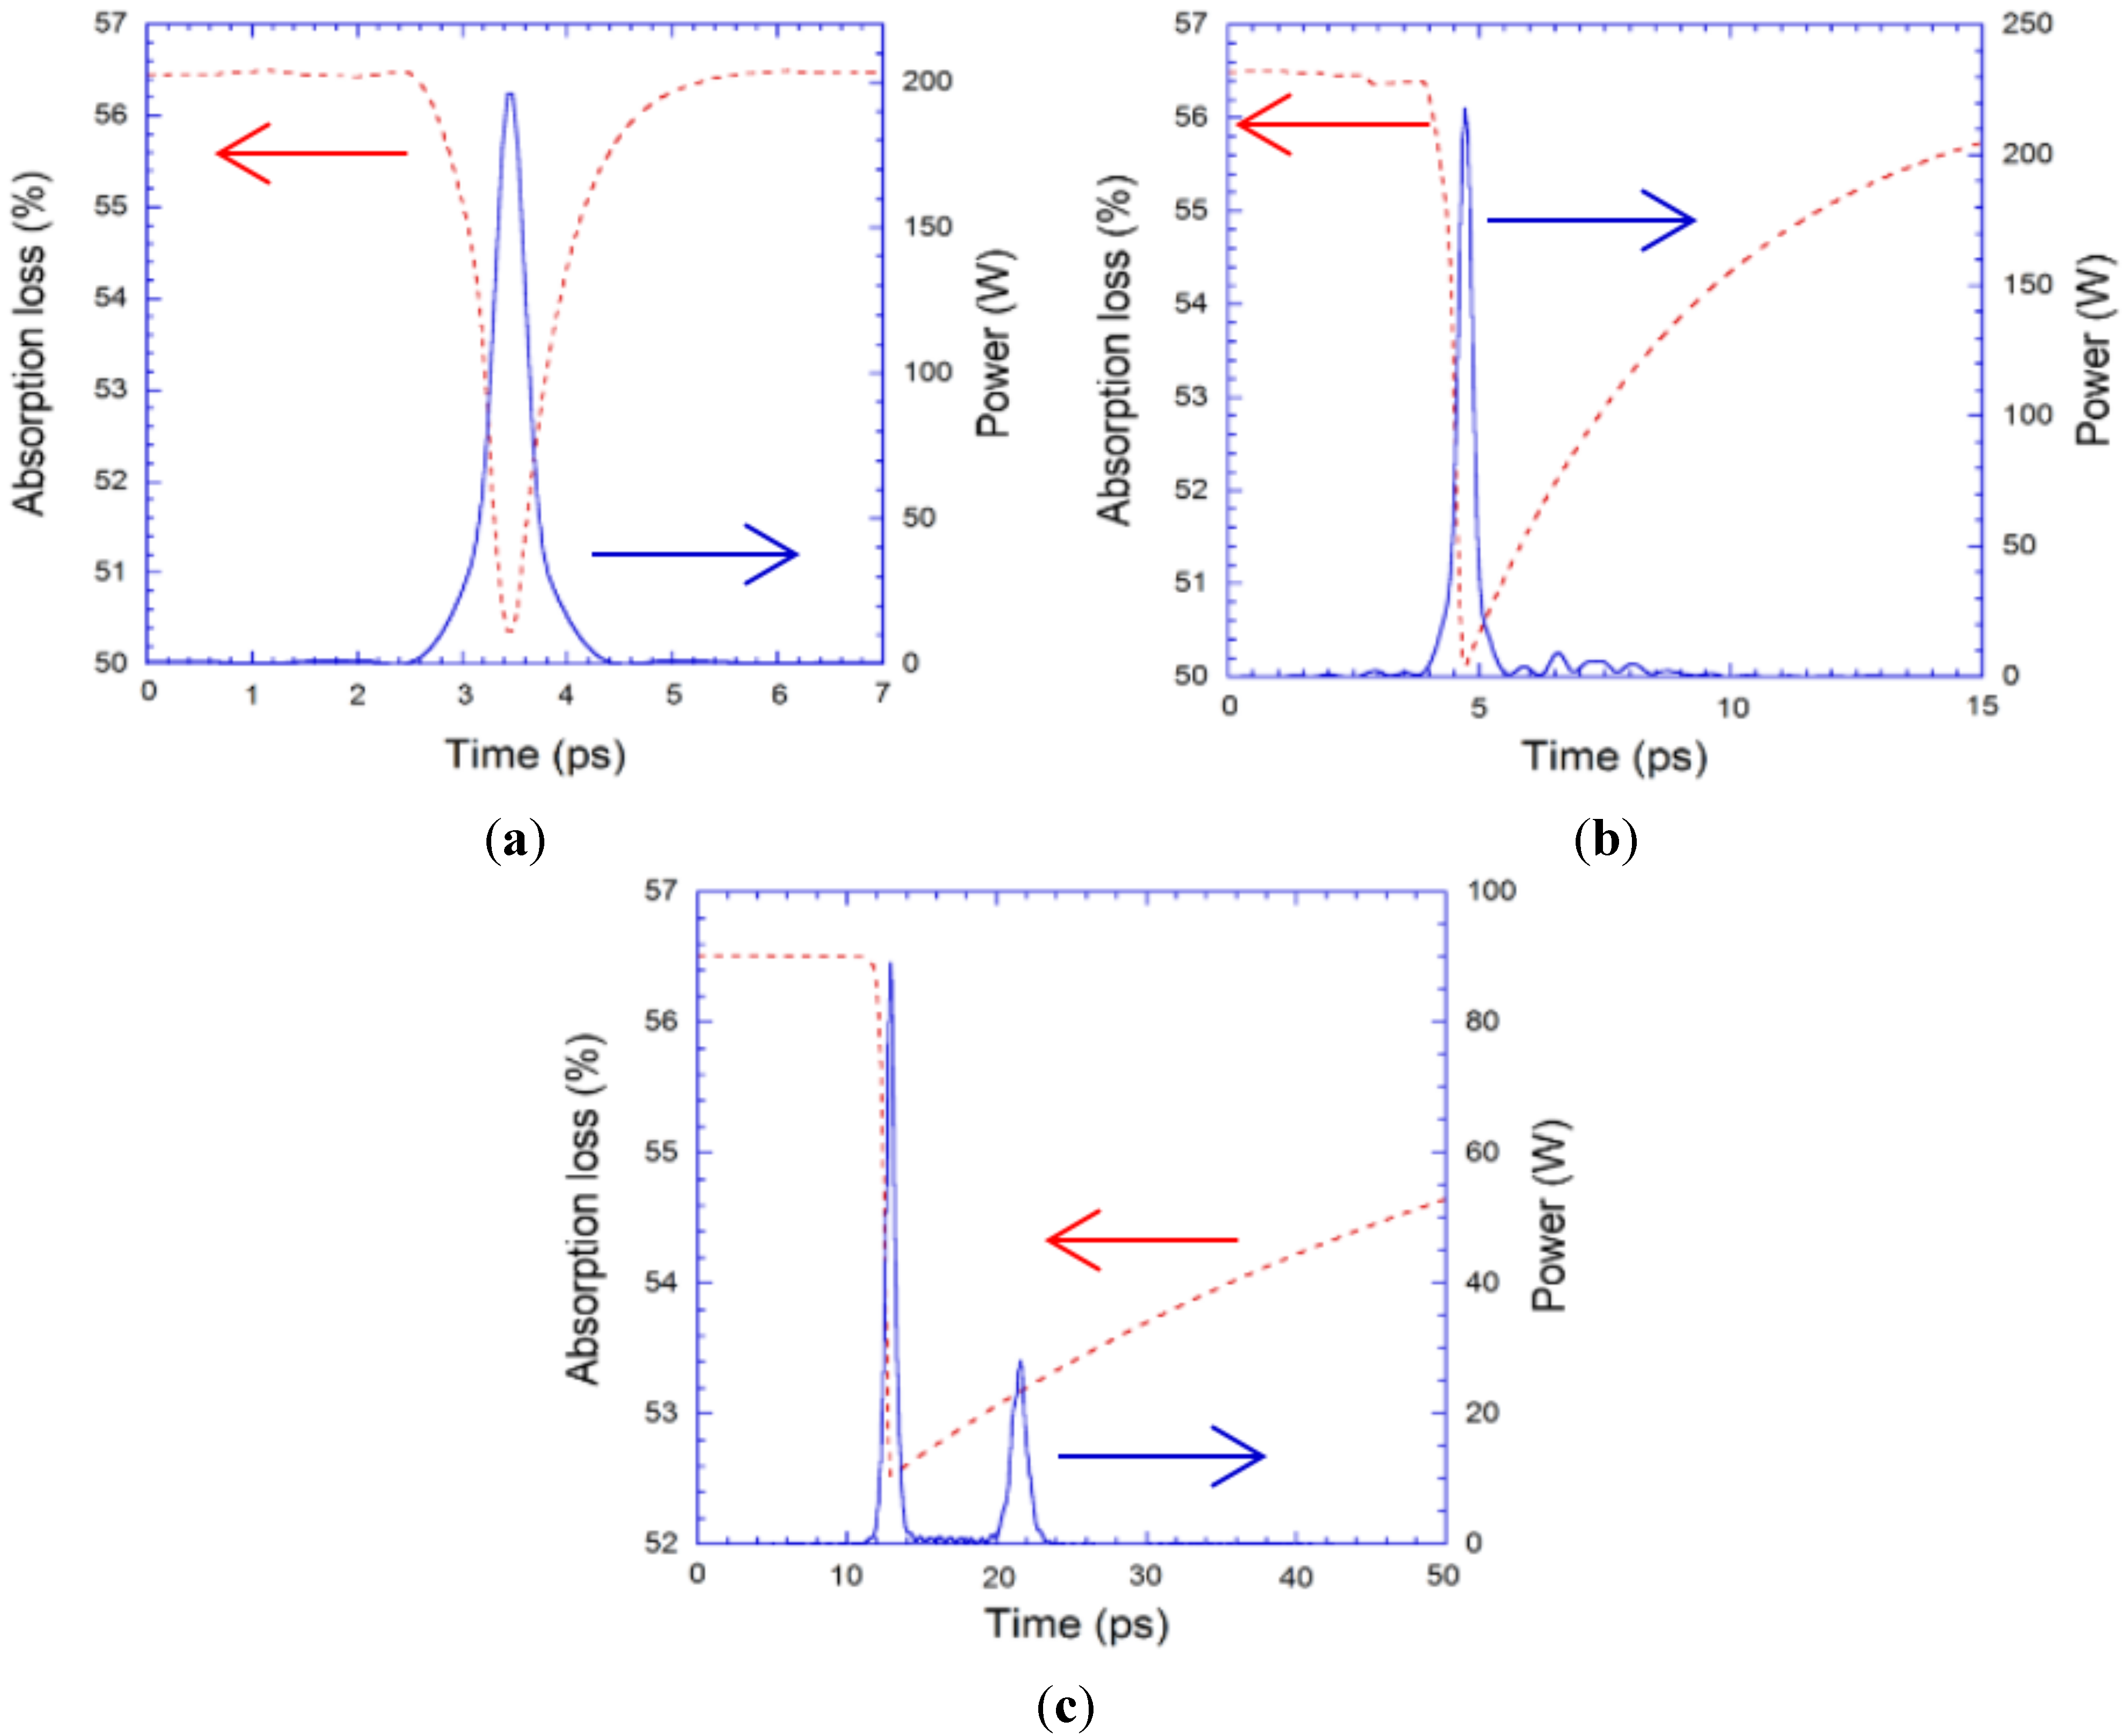
Figure 14a shows the temporal shape of the oscillating pulse and the temporal response of saturable absorption in the SWNT film for the soliton mode-locking regime. The obtained pulses were exactly the same as those for an instantaneous recovery time. The recovery time of conventional SWNTs is ~1 ps, which is considered fast enough not to degrade the mode-locked pulses in all three regimes. This means that the pulse formation is determined by the properties of the cavity, such as nonlinear effects, chromatic dispersion, and the characteristics of the wavelength filter.
When the recovery time of SWNT is as fast as 10
−11 s, the behavior depends on the value of
DT. For the soliton mode-locking regime, passive mode-locking was achieved, and the temporal width of the mode-locked pulse was the same as that for the instantaneous recovery time. However, if we look at the pulse carefully, there is a small noise component in the background of the mode-locked pulse, as shown in
Figure 14b [
35]. When the recovery time becomes slower, 10
−10 s, a small sub-pulse arises after the main pulse, as shown in
Figure 14c. It is considered that these effects are due to the slow recovery time of the SWNT film. For the dissipative-soliton mode-locking regime, when the recovery time was slower than the temporal width of the mode-locked pulse, the temporal width was broadened as the recovery time was increased. For the stretched-pulse mode-locking regime, passive mode-locking was not observed when the recovery time was larger than 10
−11 s.
Figure 14.
Temporal shapes of mode-locked pulse and variation of absorption loss at SWNT film for recovery times of (a) 0.7 ps; (b) 7 ps; and (c) 70 ps in soliton mode-locking regime.
Figure 14.
Temporal shapes of mode-locked pulse and variation of absorption loss at SWNT film for recovery times of (a) 0.7 ps; (b) 7 ps; and (c) 70 ps in soliton mode-locking regime.
We also examined the effect of modulation depth for mode-locking. As mentioned previously, the large modulation depth was required to achieve stretched pulse mode-locking. For the soliton mode-locking regime, the mode-locking was achieved for the wide range of modulation depth. When the magnitude of modulation depth was smaller than 1%, the background noise increased. The properties of the mode-locked pulse, however, were determined by the cavity condition, and they were independent of the modulation depth. For the dissipative soliton mode-locking regime, as the modulation depth was increased, the temporal width was decreased and the spectral width was increased.


