Design Considerations for Integration of Terahertz Time-Domain Spectroscopy in Microfluidic Platforms

School of Engineering, University of Guelph, Guelph, ON N1G 2W1, Canada
*
Author to whom correspondence should be addressed.
Photonics 2018, 5(1), 5; https://doi.org/10.3390/photonics5010005
Submission received: 4 February 2018
/
Revised: 6 March 2018
/
Accepted: 9 March 2018
/
Published: 10 March 2018
(This article belongs to the Special Issue Microwave Photonics 2017)
Abstract
:Microfluidic platforms have received much attention in recent years. In particular, there is interest in combining spectroscopy with microfluidic platforms. This work investigates the integration of microfluidic platforms and terahertz time-domain spectroscopy (THz-TDS) systems. A semiclassical computational model is used to simulate the emission of THz radiation from a GaAs photoconductive THz emitter. This model incorporates white noise with increasing noise amplitude (corresponding to decreasing dynamic range values). White noise is selected over other noise due to its contributions in THz-TDS systems. The results from this semiclassical computational model, in combination with defined sample thicknesses, can provide the maximum measurable absorption coefficient for a microfluidic-based THz-TDS system. The maximum measurable frequencies for such systems can be extracted through the relationship between the maximum measurable absorption coefficient and the absorption coefficient for representative biofluids. The sample thickness of the microfluidic platform and the dynamic range of the THz-TDS system play a role in defining the maximum measurable frequency for microfluidic-based THz-TDS systems. The results of this work serve as a design tool for the development of such systems.
1. Introduction
The development of ultrafast pulsed lasers (pulse duration <1 ps) was a significant scientific achievement, with a plethora of applications including semiconductor characterization [1,2], optical interferometric studies [3,4], and material analyses [5], and was a key advancement to allow electromagnetic measurements over the terahertz (THz) spectrum [6,7,8,9]. The THz spectrum contains electromagnetic radiation in a frequency interval from 0.1 to 10 THz (corresponding to wavelengths from 3 mm to 30 μm, respectively) and is of great interest for science and technology. The THz spectrum is situated between the infrared spectrum (used in photonics [10]) and the microwave spectrum (used in electronics [11]). Since initial advancements in ultrafast pulsed lasers, the THz spectrum has been employed in many contemporary applications. These contemporary applications include communications [12], chemical and biological sensing [13], security [14], quality control [15], and biomedical spectroscopic devices [16].
Biomedical spectroscopic devices is a challenging and emerging application of the THz spectrum. The THz spectrum is valuable for biomedical spectroscopic devices for several reasons: the THz spectrum is strongly attenuated by water, and therefore is very sensitive to heightened moisture content associated with disease [17]; the THz spectrum has low photon energies, and therefore has little to no ionization hazard for biological tissues [18]; and the THz spectrum has a close match between its photon energies and the conformational modes of biomolecules [19]. Because the THz spectrum possesses these characteristic properties, there has been an increasing interest in terahertz imaging and spectroscopy for biomedical spectroscopic devices over the last years [16,18].
Spectroscopy over the THz spectrum is either implemented through continuous-wave THz spectroscopy systems using continuous-wave (single-frequency) THz radiation [20] or through THz time-domain spectroscopy (THz-TDS) systems using pulsed (multiple-frequency) THz radiation [9]. The latter technique is particularly appealing, with both the amplitude and phase being measured, and allows extensive characterization of biomedical samples in biomedical spectroscopic devices.
Terahertz time-domain spectroscopy systems are currently being explored for biomedical applications such as oncological diagnostics [18] and protein analyses [21]. However, in these THz-TDS systems, the high absorption of liquid places restrictions on the volume size of the biomedical samples, as the dynamic range must be large enough that the THz radiation at each frequency is not attenuated below the noise floor. In response, microfluidic platforms [22,23,24] have been integrated with THz-TDS systems and these studies have begun to appear in the literature. For example, Tang et al. [25] and George et al. [26] have both initiated work integrating such microfluidic-based THz-TDS systems. These microfluidic-based THz-TDS systems require careful design considerations due to significant and fundamental challenges. These challenges are caused by a twofold effect: the maximum measurable absorption coefficient of a THz-TDS system monotonically decreases from its maximum (scaling with the logarithm of its dynamic range function); while simultaneously, the absorption coefficient of most liquids monotonically increases over the THz spectrum [27] (as resonance peaks typically seen in vapour THz-TDS measurements blur together). These twofold challenges force the maximum measurable frequency of a THz-TDS system to be much less than the bandwidth of the THz-TDS system. This challenge is further exacerbated by the fact that the maximum measurable absorption coefficient scales with the reciprocal of the thickness of the biomedical sample in the microfluidic platform. As such, thick microfluidic platforms with integrated THz-TDS systems possessing low dynamic range will have a low maximum measurable frequency (much less than the bandwidth of the THz-TDS system), whereas thin microfluidic platforms with integrated THz-TDS systems possessing high dynamic range will have a high maximum measureable frequency (approaching the bandwidth of the THz-TDS system). This is a significant issue as many applications require absorption coefficient measurements up to high frequencies within the THz spectrum; e.g., to measure cytidine deaminase absorption near 2.14 THz for oncology [28]; or to measure L-glucose absorption near 2.12 THz for DNA analyses [29]. At the same time, it is difficult to scale microfluidic platforms down to micron-scale thicknesses and it is difficult to produce high dynamic range THz-TDS systems. The dynamic range can be quite low for such THz-TDS systems as the data acquisition must take place quickly, given the dynamic nature of microfluidic platforms [30]. (Achieving a large dynamic range value can require minutes for data acquisition [31].) With this in mind, such microfluidic platforms with integrated THz-TDS systems must be carefully designed in terms of sample thickness and dynamic range.
This work provides an investigation into the design of a microfluidic-based THz-TDS system. The effects of dynamic range (in the THz-TDS system) and sample thickness (in the microfluidic platform) are considered. The analysis begins by defining a semiclassical computational model to simulate emission from a photoconductive THz emitter (as these are the most common THz emitters in modern THz-TDS systems [32]). The semiclassical computational model is based on the work of Rodriquez and Taylor [33]. The analysis continues by superimposing white noise with increasing noise amplitude into the results of the semiclassical computational model, which corresponds to a decreasing dynamic range. Finally, the analysis solves for the maximum measurable frequency, with input parameters of dynamic range and sample thickness, for a nominal fluidic absorption coefficient. (It is assumed that the absorption coefficient of biofluids possessing high water content have minimal deviation from the absorption coefficient of water.) Such results can be used to design microfluidic-based THz-TDS systems.
It should be noted that the connection between sample thickness and maximum measureable frequency for THz-TDS systems was first noted in the seminal work of Jepsen and Fischer [34]. In Jepsen and Fischer’s work, a THz-TDS system (with a single dynamic range value) was presented and tested with two polylactide samples with sample thicknesses of d = 0.58 mm and 2.79 mm. As a result of this increased sample thickness, the maximum measurable frequency of the THz-TDS system falls from 1.9 THz to 1.2 THz. In contrast, our work leverages these initial (and fundamental) findings to provide a thorough analysis for the design of microfluidic-based THz-TDS systems, both in terms of sample thickness and dynamic range value. This is accomplished through extensive simulation and analysis with sample thicknesses spanning 30–480 μm (applicable to modern microfluidic platforms [35]) and dynamic range values spanning 2.8 × 100–5.8 × 10³ (applicable to modern THz-TDS systems [8]).
2. Design and Simulation
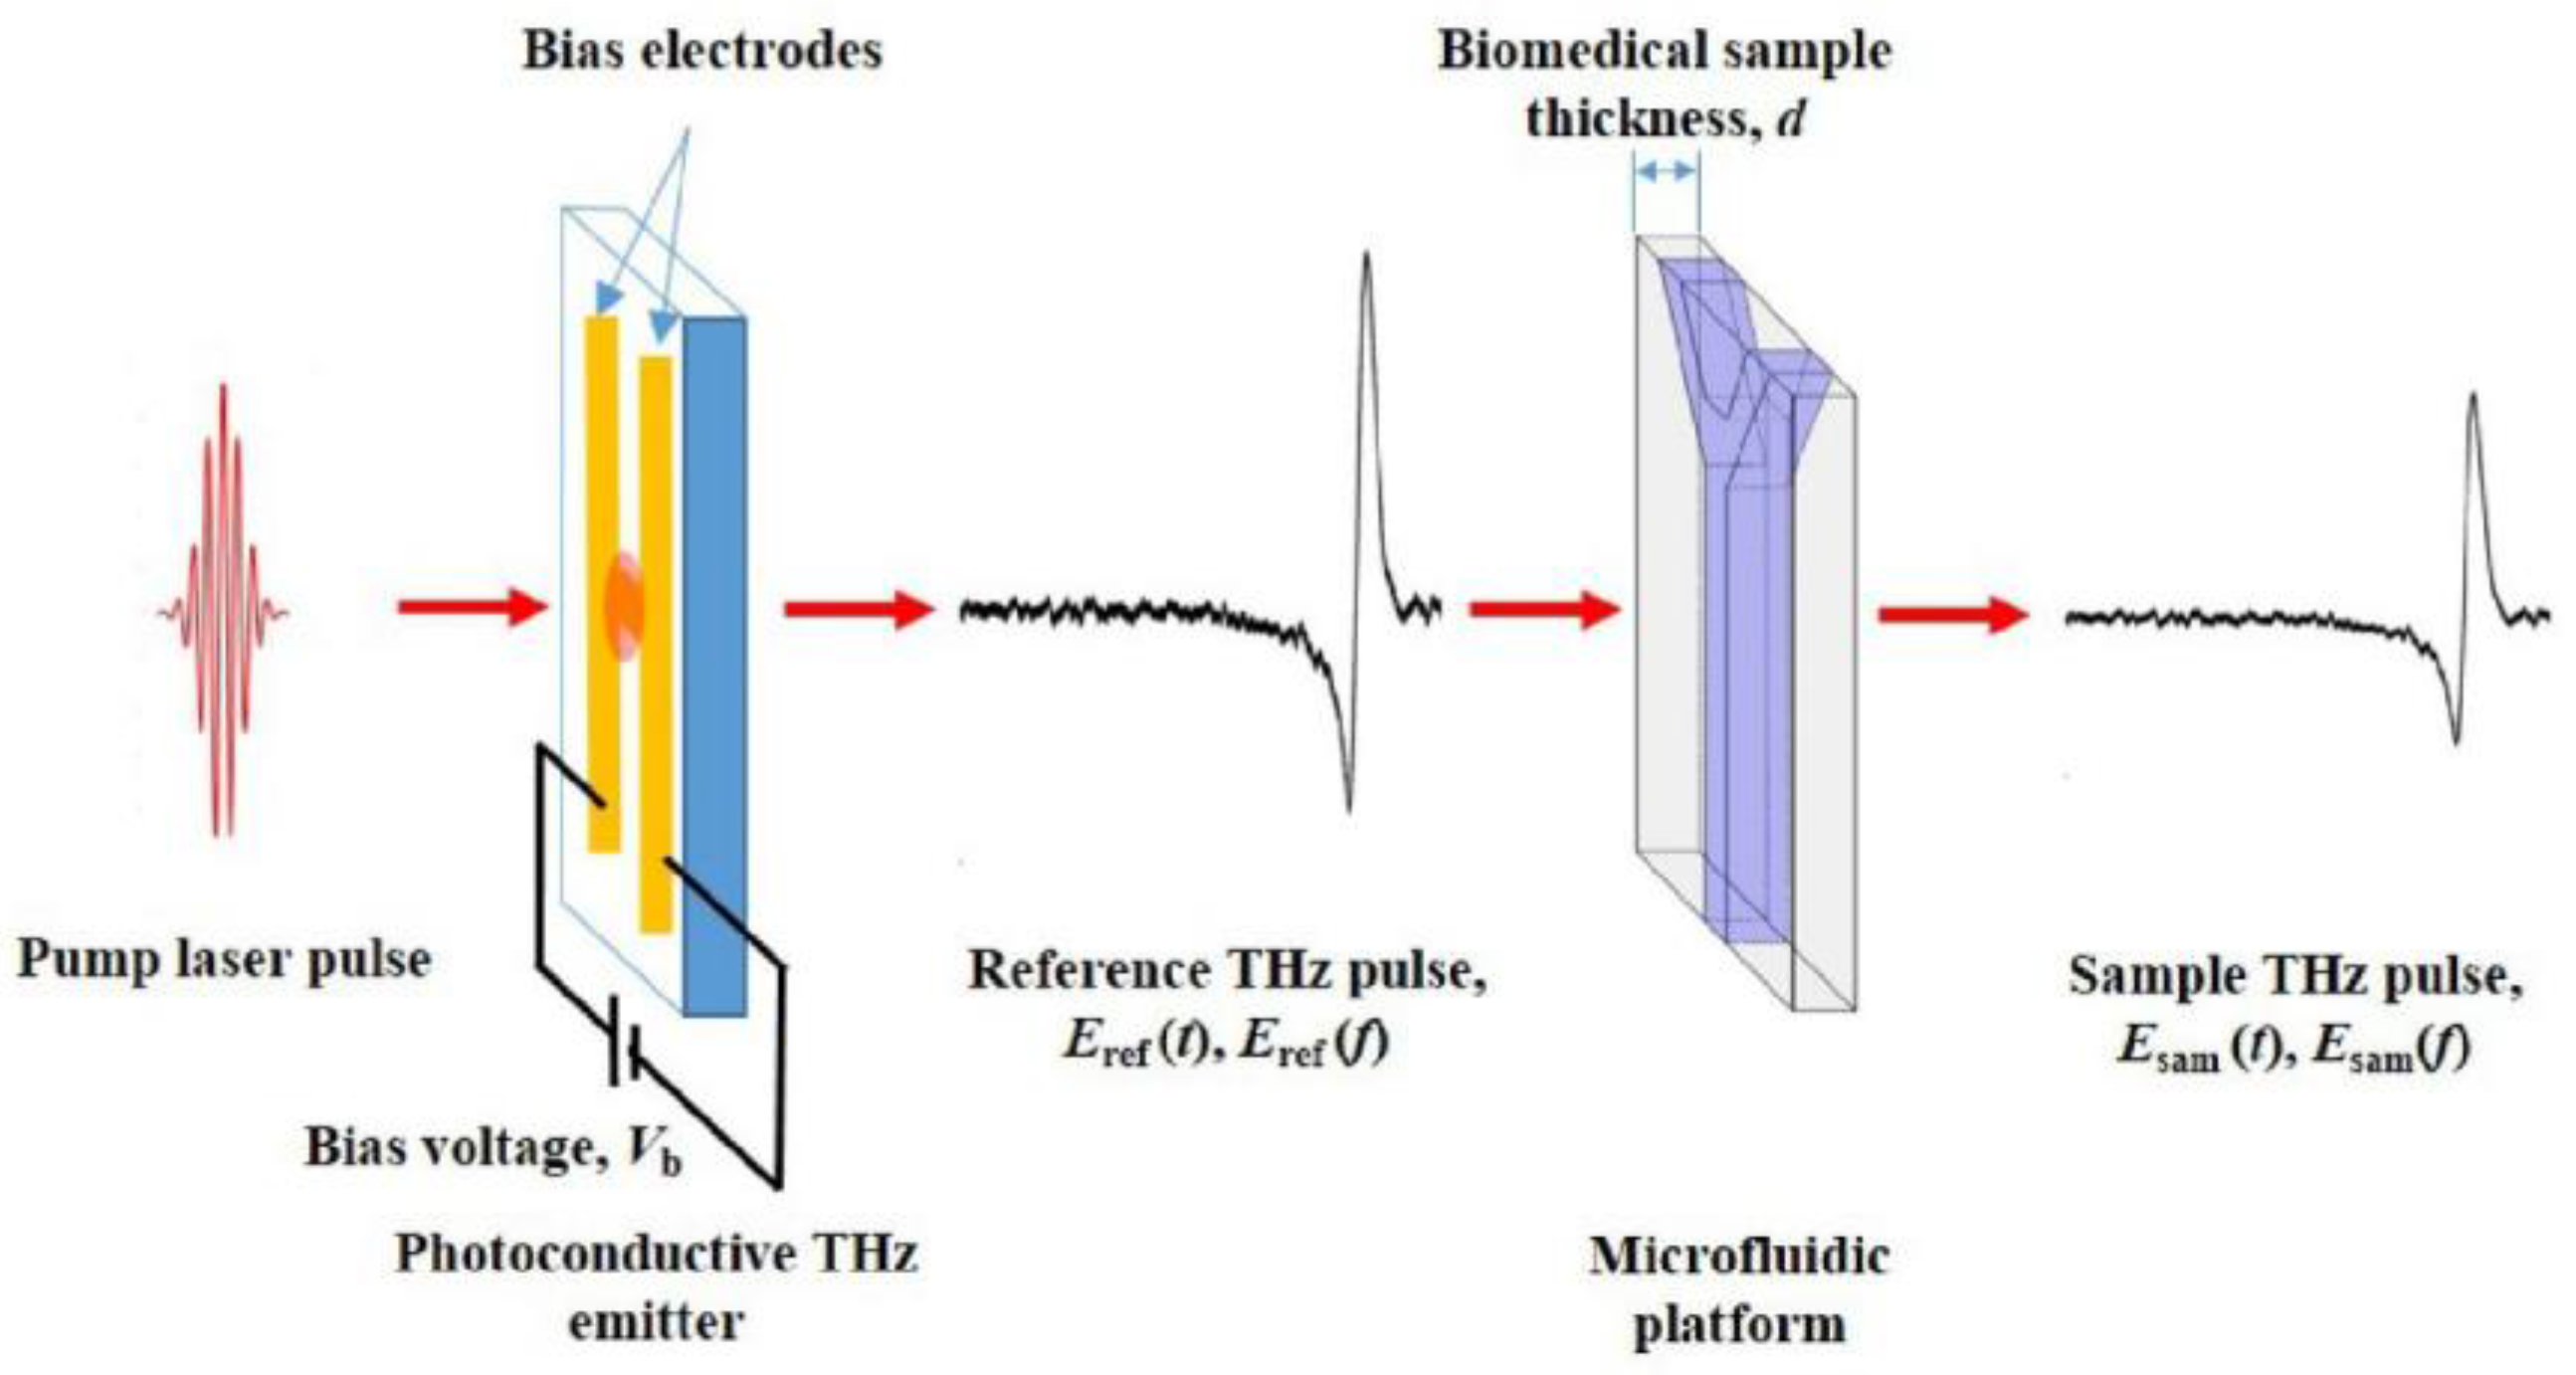
An exemplary microfluidic-based THz-TDS system is shown in Figure 1. Such a system has a photoconductive THz emitter based on a GaAs substrate, which is illuminated by a pump laser pulse. This pump laser pulse will generate a THz reference pulse in the photoconductive THz emitter. The electric field associated with the THz reference pulse is represented as Eref(t) in the time domain and Eref(f) in the frequency domain. The THz reference pulse passes through a microfluidic platform with sample thickness of d, where it undergoes a transformation into the THz sample pulse, which is represented as Esam(t) in the time domain and Esam(f) in the frequency domain. Data representing this THz reference pulse is generated with a semiclassical computational model.
The semiclassical computational model is based on the work of Rodriquez and Taylor [33] and solves semiconductor and optical (electromagnetic) equations for a photoconductive THz emitter. Here, the photoconductive THz emitter has a gap between electrodes that is illuminated with an optical pulse which is Gaussian, both temporally and spatially. This optical pulse is represented as
where the temporal full-width-at-half-maximum is τp = 1 ps (being equal to the semiconductor response time of GaAs), the transverse spatial dimension is x, the spatial full-width-at-half-maximum is xp = 150 μm, and the fluence of the illumination pulse is Φ. The semiclassical computational model also requires the transport equation for the surface electron current, which is
and the transport equation for the surface hole current, which is
where the surface density of electrons and holes are ns(x,t) and ps(x,t), respectively; the surface currents of electrons and holes are kn(x,t) and kp(x,t), respectively; the elementary charge is q; Planck’s constant is h; the optical frequency of the ultrafast pulsed laser is ν = 365 THz (corresponding to a wavelength of 800 nm); and the GaAs reflectivity is R = 0.3. These equations can be solved with a finite difference method along with Poisson’s Equation, which is
where the optical penetration depth is δ = 700 nm, the permittivity of free space is ε0, and the relative permittivity of GaAs is εr = 13. Ultimately, an approximation to a Hertzian dipole antenna can be used, and the electric field THz pulse in the far-field can be expressed as
where the y-direction length of the gap is Ly = 300 μm and the x-direction length of the gap is Lx = 300 μm. This radiation simulates noise-free emission of radiation from a photoconductive THz emitter. It should be noted that the semiclassical computational model provides a simulation for one pulse. As such, the repetition rate of the ultrafast pulsed laser is not considered. (Repetition rates of 90 MHz are standard for titanium sapphire or erbium-doped fibre ultrafast pulsed lasers.)
To incorporate noise into the semiclassical computational model of a photoconductive THz emitter and subsequent THz-TDS system, various noise sources must be considered. These noise sources include white noise, 1/f noise (i.e., pink noise), mechanical noise from the pellicle beamsplitter, and others. Of these, the most significant noise processes are 1/f noise associated with the THz emitter and white noise associated with the THz detector [36,37]. In a THz-TDS system with a sample that has low absorption (e.g., quartz with a thickness of microns), the 1/f noise associated with the THz emitter can be larger than or similar to the white noise associated with the THz detector. However, the 1/f noise drops off considerably at higher frequencies (due to the reciprocal relationship to frequency). Therefore, for a low absorption sample, 1/f noise need not be considered for the high-frequency regime, but still could be considered for the low-frequency regime. On the other hand, in a THz-TDS system with high absorption (e.g., water or biofluids with thickness of tens of microns or greater, as in the microfluidic platforms considered in this work), the 1/f noise associated with the THz emitter will be substantially attenuated due to the high absorption when passing through the sample. Here, the white noise associated with the THz detector, which is not affected by the absorption, takes a prominent role over both low- and high-frequency regimes. The microfluidic platforms described in our work represent a high-absorption THz-TDS system. Therefore, white noise associated with the THz detector is considered in the analysis and 1/f noise associated with the THz emitter is not considered in the analysis [36].
White noise associated with the THz detector can be incorporated into the semiclassical computational model through an additive white noise signal, n(t), defined as a uniform random noise signal that is centered about zero with a peak-to-peak spread equal to the amplitude of the electric field THz pulse. This noise signal is superimposed onto the electric field THz pulse at an arbitrary point in space (i.e., an arbitrary z value) in the far-field to form the reference THz pulse
where the noise amplitude is An.
3. Results and Discussion
For a representative photoconductive THz emitter with an incident average power of 50 mW and an external biasing field of 25 V/150 μm, Figure 2a shows the output of the semiclassical computational model in the time domain, Eref(t), with increasing noise amplitudes of An = 0, 10−3, 10−2, 10−1, 100, and 101. Figure 2b shows the equivalent output in the frequency domain, Eref(f), with corresponding dynamic range values of DR = 5.8 × 10³, 5.7 × 10³, 2.4 × 10³, 3.0 × 10², 2.8 × 101, and 2.8 × 100 (with DR being defined as the maximum of Eref(f) divided by the noise floor). It is clear that DR decreases as An increases. This DR along with the sample thickness, d, will limit the maximum measurable (intensity) absorption coefficient, αM, according to
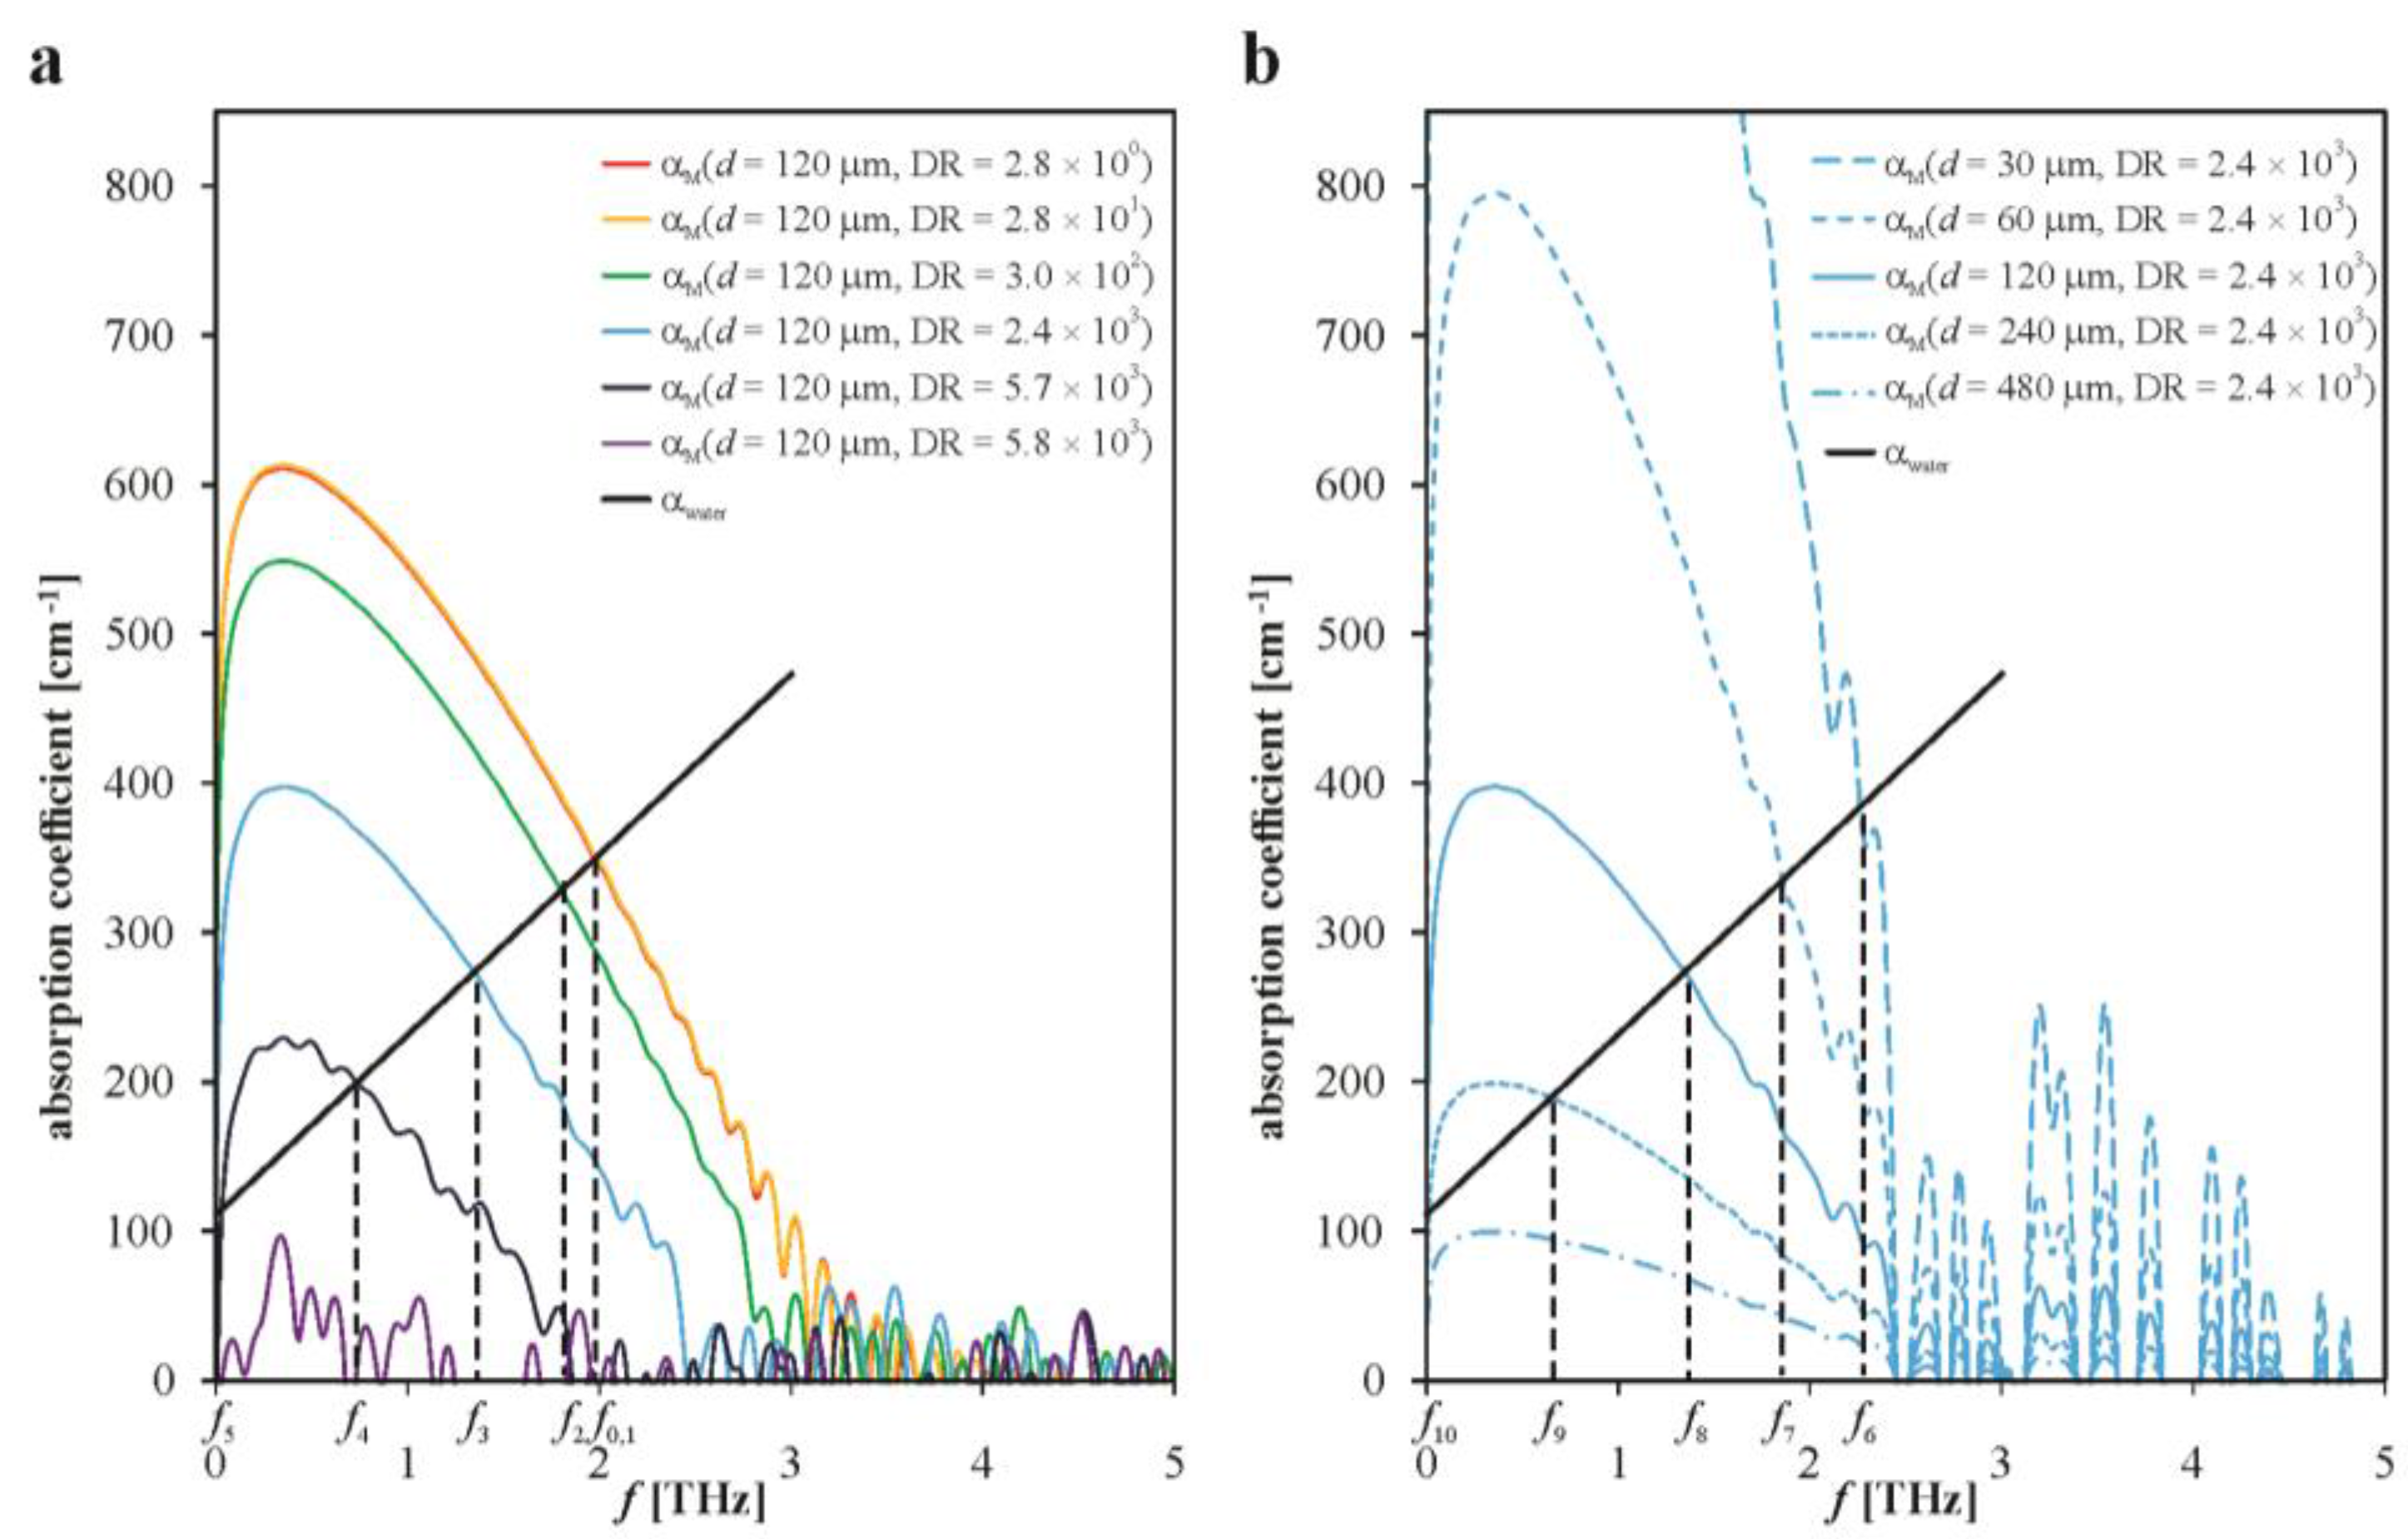
where the dynamic range function is DRF(f) (being Eref(f) normalized with respect to its noise floor) and n is the refractive index of water over the THz spectrum. (This fundamental equation was initially reported by Jepsen and Fischer [34] and its derivation is given in the Appendix.) A piece-wise equation for the refractive index of water is fit to data reported by Wang et al. [38]. The piece-wise function for refractive index is n = −1.8f + 3.1, for f < 0.5 THz with respective slope and intercept uncertainties of 10% and 1%; and n = −0.1f + 2.3, for f > 0.5 THz with respective slope and intercept uncertainties of 7% and 1%. Figure 3a shows the maximum measurable absorption coefficient for the dynamic range values of DR = 5.8 × 10³, 5.7 × 10³, 2.4 × 10³, 3.0 × 10², 2.8 × 101, and 2.8 × 100 and a constant sample thickness of d = 120 μm, plotted as red, yellow, green, blue, indigo, and violet solid lines, respectively. The absorption coefficient of water, αwater = 121f + 109 cm−1, is quantified by fitting data from Wang et al. [38] to a linear fit of R2 = 0.978 with both slope and intercept uncertainties being 4%, and is plotted as a solid black line. The intersection of the αwater curve with the maximum measurable absorption coefficient curves defines each of the maximum measurable frequencies of f0–5, which correspond to the respective DR values of 5.8 × 10³, 5.7 × 10³, 2.4 × 10³, 3.0 × 10², 2.8 × 101, and 2.8 × 100. These maximum measurable frequencies range from f0 = 2.0 THz to f5 = 0 and decrease with decreasing DR values. From these results, it is clear that a THz-TDS system with a limited dynamic range value will severely limit the application of a microfluidic-based THz-TDS system, and care must be taken in the design of such systems.
Figure 3b shows the maximum measurable absorption coefficient for a constant dynamic range value of DR = 2.4 × 10³ and sample thicknesses of d = 30, 60, 120, 240, and 480 μm, plotted as blue long-dashed, medium-dashed, solid, short-dashed, and dashed-dotted lines, respectively. The absorption coefficient of water is plotted as a solid black line. The intersection of the αwater curve with the maximum measurable absorption coefficient curves defines each of the maximum measurable frequencies of f6–10, which correspond to respective sample thicknesses of d = 30, 60, 120, 240, and 480 μm. These maximum measurable frequencies range from f6 = 2.3 THz to f10 = 0 and decrease with increasing sample thickness. From these results, it is clear that a microfluidic platform with a large sample thickness will severely limit the application of a microfluidic-based THz-TDS system.
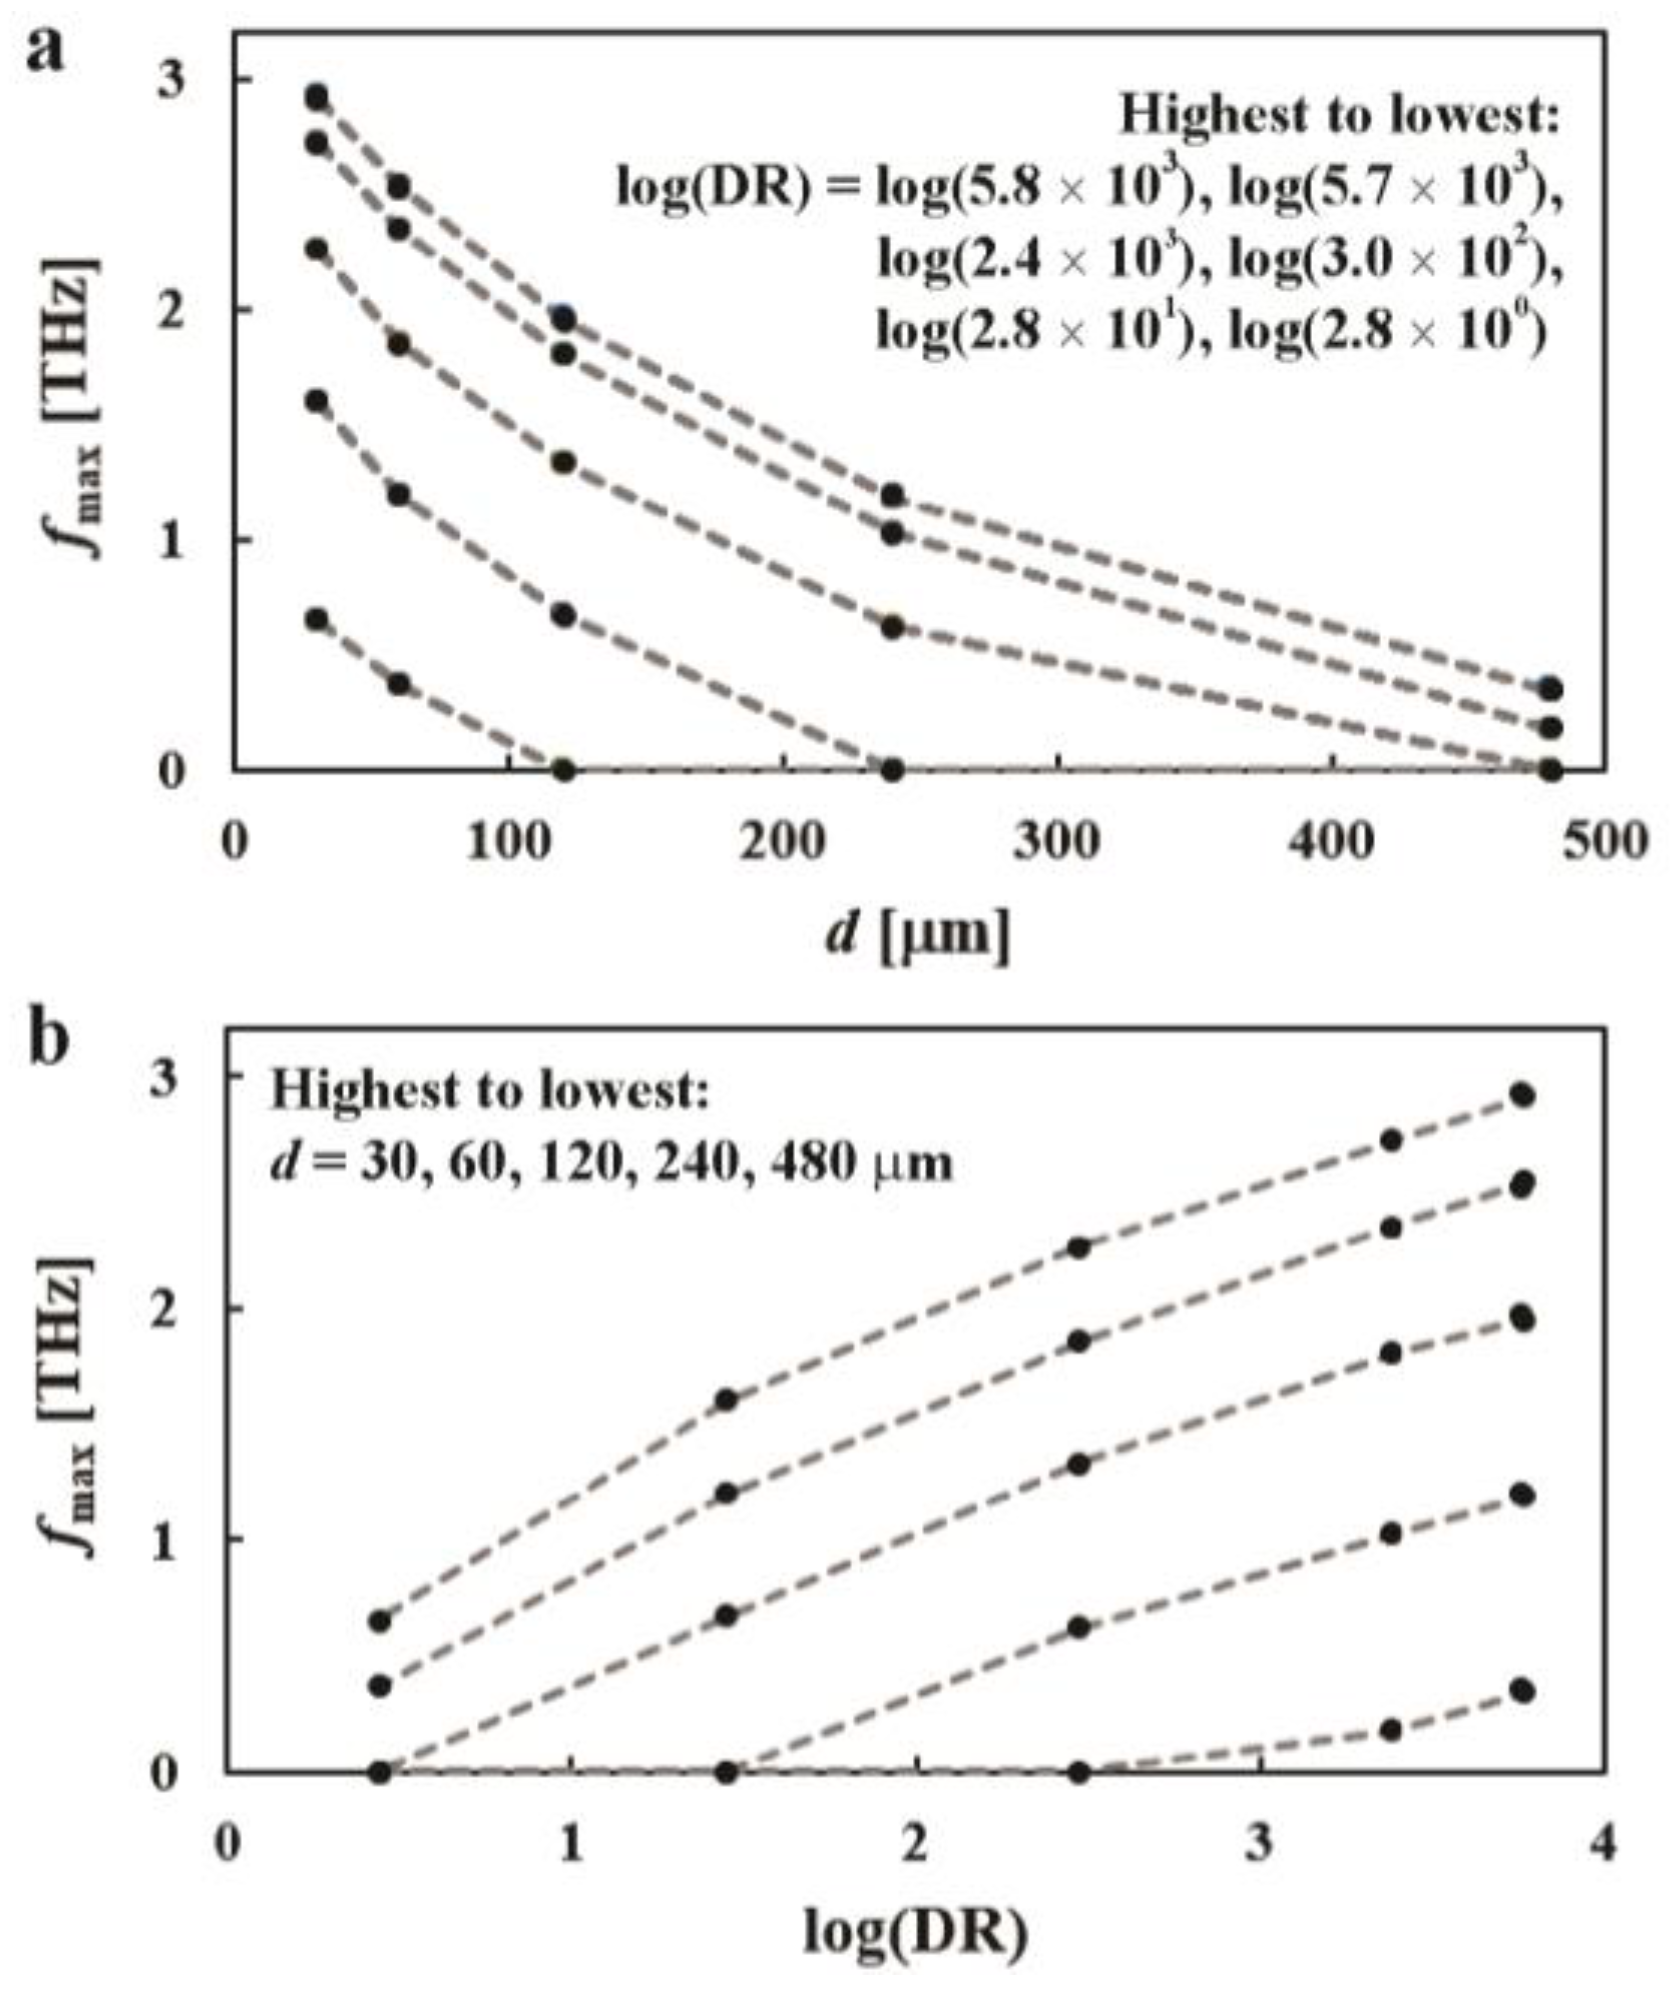
These results can be summed up with a set of measurements rastering through the foreseeable combinations of dynamic range values and sample thicknesses, as presented in Figure 4. Figure 4a,b plot maximum measureable frequency versus sample thickness and logarithm of dynamic range value, respectively. The equations for the curves in Figure 4a, from highest to lowest, are: fmax = −0.0055 d + 2.82, fmax = −0.0055 d + 2.81, fmax = −0.0055 d + 2.63, fmax = −0.0075 d + 2.36, fmax = −0.0101 d + 1.87, and fmax = −0.0094 d + 0.94. The equations for the curves in Figure 4b, from highest to lowest, are: fmax = 0.66 log(DR) + 0.51, fmax = 0.63 log(DR) + 0.19, fmax = 0.55 log(DR) − 0.09, fmax = 0.44 log(DR) − 0.47, and fmax = 0.45 log(DR) − 1.34. (All of these linear equations have a fit of R2 ≥ 0.94.) These results can inform the design of future THz-TDS microfluidic platforms. For example, consider the THz-TDS system of Venkatesh et al. that is able to achieve a dynamic range value up to 103 [39], with performance beyond this value being unattainable or unpractical; and the microfluidic platform of Ng et al. that is able to achieve sample thickness down to 180 μm [40]. Combining these into one THz-TDS microfluidic platform would yield a maximum measurable frequency of 1.0 THz. As such, this THz-TDS microfluidic platform would be suited for lysozyme measurements with absorption over 0.4–0.9 THz. However, this microfluidic-based THz-TDS system would be unsuited for lactose measurements with absorption at 1.4 THz. In this way, the data set of Figure 4 can be used for the design of future microfluidic-based THz-TDS systems.
4. Conclusions
This work explored design considerations for microfluidic-based terahertz time-domain spectroscopy (THz-TDS) systems wherein microfluidic platforms and THz-TDS systems are integrated. The critical parameters of sample thickness (of the microfluidic platform) and dynamic range (of the THz-TDS system) were considered as they greatly influence the maximum measurable frequency of the overall system. The work developed a semiclassical computational model to simulate the emission of THz radiation from a GaAs photoconductive THz emitter. This model incorporated white noise with increasing noise amplitude corresponding to decreasing dynamic range values. Through the results of this semiclassical computational model and defined sample thicknesses, the maximum measurable absorption coefficient was found for numerous microfluidic-based THz-TDS systems with varying dynamic range values and sample thicknesses. The corresponding maximum measurable frequencies for such microfluidic-based THz-TDS systems were found through the intersection of the maximum measurable absorption coefficient and a representative absorption coefficient for biofluids. These results will serve as a design tool for the development of future microfluidic-based THz-TDS systems.
Acknowledgments
The authors would like to acknowledge financial support through the Natural Science and Engineering Research Council of Canada.
Author Contributions
C.M.C. conceived and designed the analysis; C.M.C. prepared the simulation software; R.A.-H. and C.M.C. analysed the data; R.A.-H. and C.M.C. wrote the paper.
Conflicts of Interest
The authors declare no conflict of interest.
Appendix A
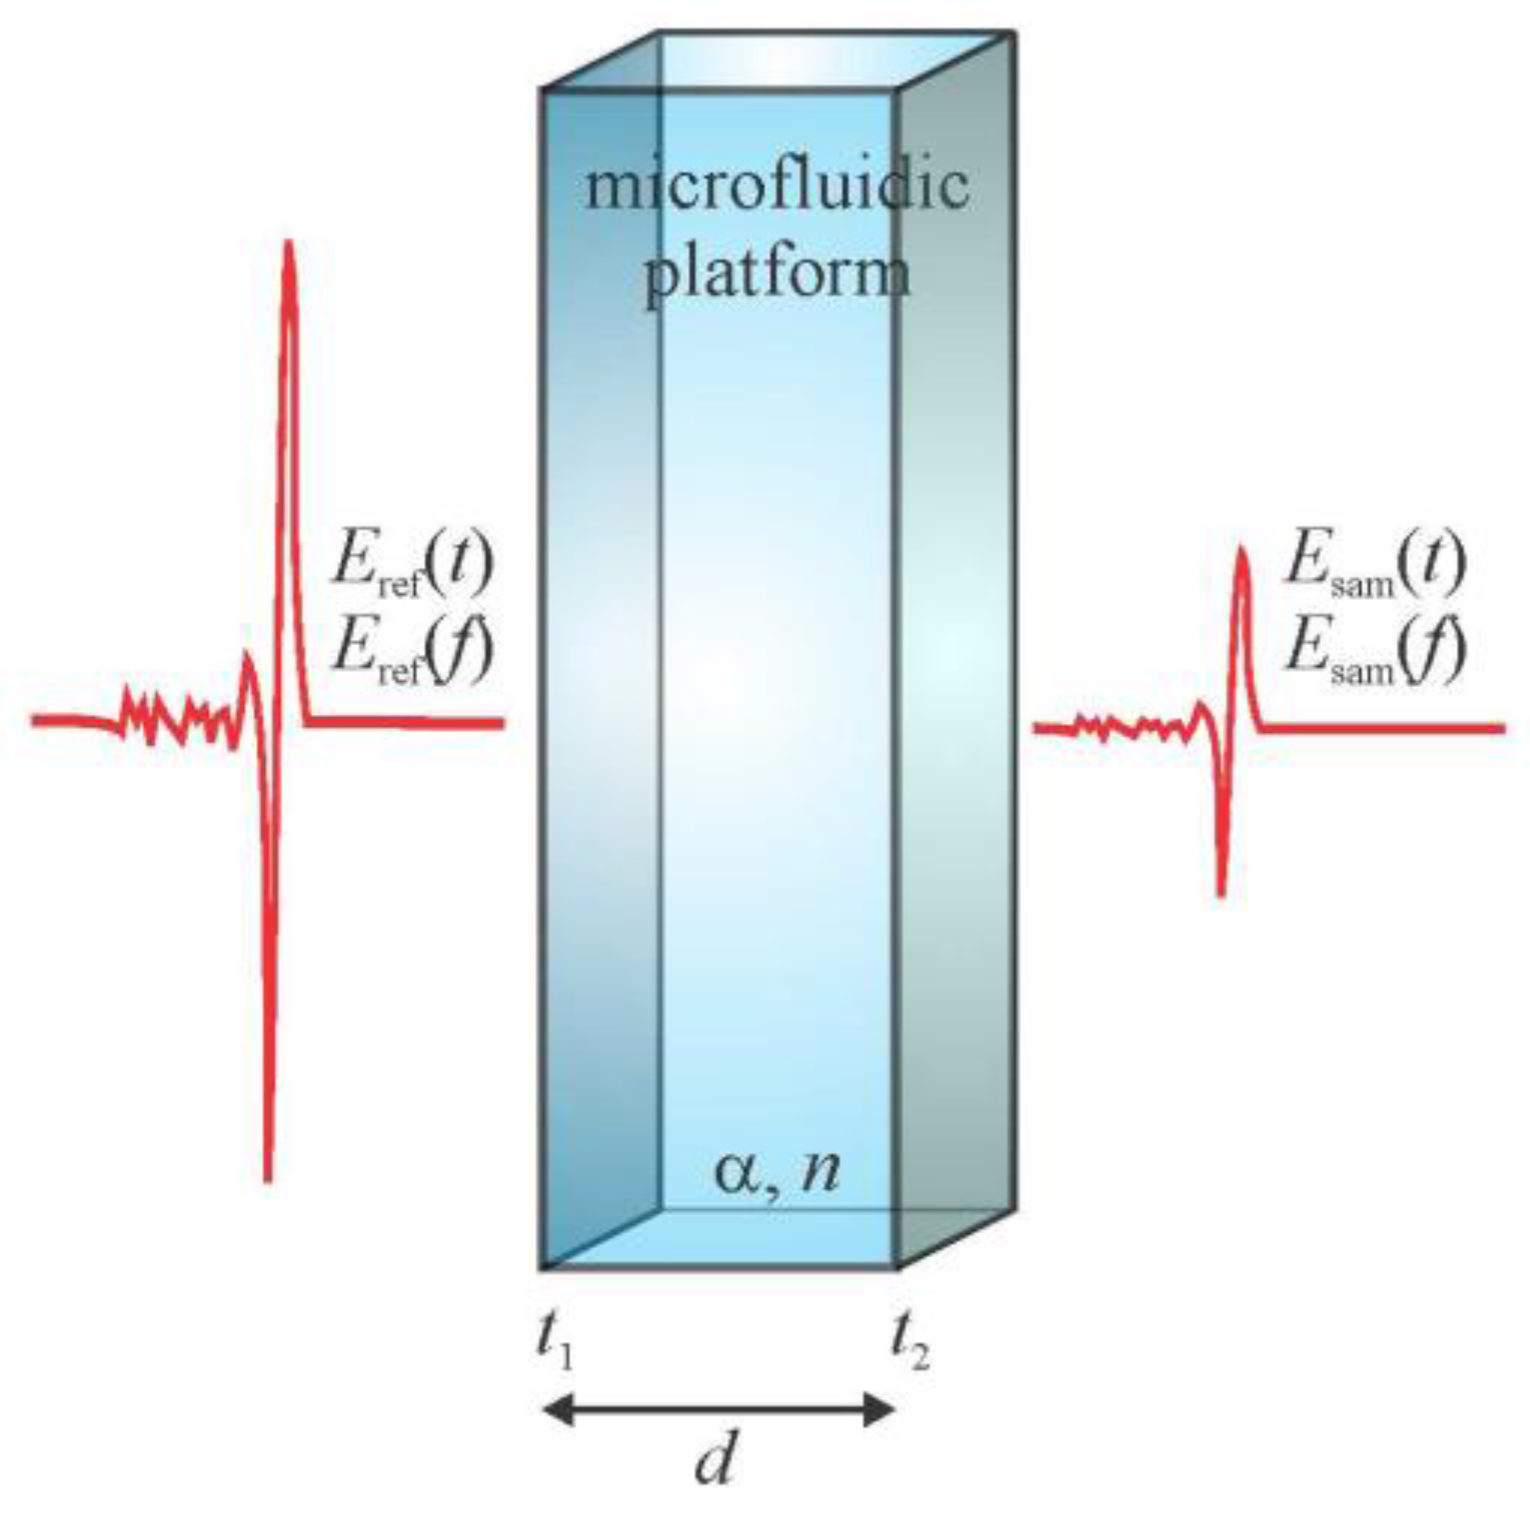
This appendix provides the derivation of Equation (7), which is the same as Equation (3) in Jepsen and Fischer [34], but for electric field rather than intensity. Figure A1 shows an image of the THz-TDS of a microfluidic platform of sample thickness d, (intensity) absorption coefficient α, and refractive index n. The microfluidic platform alters the THz reference pulse (Eref(t) in the time domain and Eref(f) in the frequency domain) to become the THz sample pulse (Esam(t) in the time domain and Esam(f) in the frequency domain). The left air–liquid interface has a Fresnel transmission coefficient of t1 = 2/(n + 1) and the right liquid–air interface has a Fresnel transmission coefficient of t2 = 2n/(n + 1). (The thickness between liquid and air is assumed to be neglible.) In the frequency domain, the relationship between the magnitude of the sample and reference electric field is
This equation can be rearranged to express the (intensity) absorption coefficient as
The maximum measurable absorption coefficient will occur when the ratio between the amplitude spectra of the THz reference and the THz sample pulses is equal to the dynamic range function: DRF(f) = |Eref(f)|/|Eref(f)|. Substituting this relation into Equation (A2) defines Equation (7) in the body of this manuscript.
Figure A1.
An illustration of the THz-TDS in a microfluidic platform is shown. The microfluidic platform has a sample thickness of d, absorption coefficient of α, and refractive index of n. The THz reference pulse (prior to the microfluidic platform) is Eref(t) and Eref(f) in the time and frequency domains, respectively; and the THz sample pulse (after the microfluidic platform) is Esam(t) and Esam(f) in the time and frequency domains, respectively. The left air–liquid interface has a Fresnel coefficient of t1 and the right liquid–air interface has a Fresnel coefficient of t2.

References
- Jin, X.; Collier, C.M.; Garbowski, J.J.A.; Born, B.; Holzman, J.F. Ultrafast transient responses of optical wireless communication detectors. Appl. Opt. 2013, 52, 5042–5049. [Google Scholar] [CrossRef] [PubMed]
- Haiml, M.; Grange, R.; Keller, U. Optical characterization of semiconductor saturable absorbers. Appl. Phys. B 2004, 79, 331–339. [Google Scholar] [CrossRef]
- Süss, B.; Ringleb, F.; Heberle, J. New ultrarapid-scanning interferometer for FT-IR spectroscopy with microsecond time-resolution. Rev. Sci. Instrum. 2016, 87, 063113. [Google Scholar] [CrossRef] [PubMed]
- Collier, C.M.; Jin, X.; Holzman, J.F. Ultrafast refractometry for characterization of nanocomposite material systems. IEEE Photon. Technol. Lett. 2012, 24, 590–592. [Google Scholar] [CrossRef]
- Correa, D.S.; Almeida, J.M.P.; Almeida, G.F.B.; Cardoso, M.R.; De Boni, L.; Mendonça, C.R. Ultrafast laser pulses for structuring materials at micro/nano scale: From waveguides to superhydrophobic surfaces. Photonics 2017, 4, 8. [Google Scholar] [CrossRef]
- Nefedov, I.; Melnikov, L. Plasmonic terahertz amplification in graphene-based asymmetric hyperbolic metamaterial. Photonics 2015, 2, 594–603. [Google Scholar] [CrossRef]
- Auston, D.H.; Cheung, K.P.; Smith, P.R. Picosecond photoconducting Hertzian dipoles. Appl. Phys. Lett. 1984, 45, 284–286. [Google Scholar] [CrossRef]
- Collier, C.M.; Bergen, M.H.; Stirling, T.J.; DeWachter, M.A.; Holzman, J.F. Optimization processes for pulsed terahertz systems. Appl. Opt. 2015, 54, 535–545. [Google Scholar] [CrossRef]
- Petev, M.; Westerberg, N.; Rubino, E.; Moss, D.; Couairon, A.; Légaré, F.; Morandotti, R.; Faccio, D.; Clerici, M. Phase-Insensitive Scattering of Terahertz Radiation. Photonics 2017, 4, 7. [Google Scholar] [CrossRef]
- Omar Clay, G.; Schaffer, C.B.; Kleinfeld, D. Large two-photon absorptivity of hemoglobin in the infrared range of 780–880 nm. J. Chem. Phys. 2017, 126, 025102. [Google Scholar] [CrossRef] [PubMed]
- Sandhu, M.Y.; Ali, A.; Hunter, I.C.; Roberts, N.S. A new method for the precise multiband microwave dielectric measurement using stepped impedance stub. Meas. Sci. Technol. 2016, 27, 117001. [Google Scholar] [CrossRef]
- Shams, H.; Fice, M.J.; Balakier, K.; Renaud, C.C.; van Dijk, F.; Seeds, A.J. Photonic generation for multichannel THz wireless communication. Opt. Express 2014, 22, 23465–23472. [Google Scholar] [CrossRef] [PubMed]
- Qin, J.; Xie, L.; Ying, Y. Rapid analysis of tetracycline hydrochloride solution by attenuated total reflection terahertz time-domain spectroscopy. Food Chem. 2017, 224, 262–269. [Google Scholar] [CrossRef] [PubMed]
- Federici, J.F.; Schulkin, B.; Huang, F.; Gary, D.; Barat, R.; Oliveira, F.; Zimdars, D. THz imaging and sensing for security applications–explosives, weapons and drugs. Semicond. Sci. Technol. 2005, 20, 266–280. [Google Scholar] [CrossRef]
- Hernandez-Serrano, A.I.; Corzo-Garcia, S.C.; Garcia-Sanchez, E.; Alfaro, M.; Castro-Camus, E. Quality control of leather by terahertz time-domain spectroscopy. Appl. Opt. 2014, 53, 7872–7876. [Google Scholar] [CrossRef] [PubMed]
- Fan, S.; He, Y.; Ung, B.S.; Pickwell-MacPherson, E. The growth of biomedical terahertz research. J. Phys. D Appl. Phys. 2014, 47, 374009. [Google Scholar] [CrossRef]
- Shumyatsky, P.; Alfano, R.R. Terahertz sources. J. Biomed. Opt. 2011, 16, 033001. [Google Scholar] [CrossRef] [PubMed]
- Yu, C.; Fan, S.; Sun, Y.; Pickwell-MacPherson, E. The potential of terahertz imaging for cancer diagnosis: A review of investigations to date. Quant. Imag. Med. Surg. 2012, 2, 33–45. [Google Scholar] [CrossRef]
- Markelz, A.; Whitmire, S.; Hillebrecht, J.; Birge, R. THz time domain spectroscopy of biomolecular conformational modes. Phys. Med. Biol. 2002, 47, 3797–3805. [Google Scholar] [CrossRef] [PubMed]
- Rogenbuck, A.; Schmitz, H.; Deninger, A.; Mayorga, I.C.; Hemberger, J.; Güsten, R.; Grüninger, M. Coherent broadband continuous-wave terahertz spectroscopy on solid-state samples. New J. Phys. 2010, 12, 043017. [Google Scholar] [CrossRef]
- Falconer, R.J.; Markelz, A. Terahertz spectroscopic analysis of peptides and proteins. J. Infrared Millim. Terahertz Waves 2012, 33, 973–988. [Google Scholar] [CrossRef]
- Collier, C.M.; Wiltshire, M.; Nichols, J.; Born, B.; Landry, E.L.; Holzman, J.F. Nonlinear dual-phase multiplexing in digital microfluidic architectures. Micromachines 2011, 2, 369–384. [Google Scholar] [CrossRef]
- Nichols, J.; Collier, C.M.; Landry, E.L.; Wiltshire, M.; Born, B.; Holzman, J.F. On-chip digital microfluidic architectures for enhanced actuation and sensing. J. Biomed. Opt. 2012, 17, 067005. [Google Scholar] [CrossRef] [PubMed]
- Nichols, J.; Landry, E.L.; Born, B.; Wiltshire, M.; Collier, C.M.; Holzman, J.F. Optical sensing for on-chip digital microfluidics. In Proceedings of the SPIE Photonics West, San Francisco, CA, USA, 14 February 2012. [Google Scholar]
- Tang, Q.; Liang, M.; Lu, Y.; Wong, P.K.; Wilmink, G.J.; Zhang, D.D.; Xin, H. Microfluidic devices for terahertz spectroscopy of live cells toward lab-on-a-chip applications. Sensors 2016, 16, 476. [Google Scholar] [CrossRef] [PubMed]
- George, P.A.; Hui, W.; Rana, F.; Hawkins, B.G.; Smith, A.E.; Kirby, B.J. Microfluidic devices for terahertz spectroscopy of biomolecules. Opt. Express 2008, 16, 1577–1582. [Google Scholar] [CrossRef] [PubMed]
- Kindt, J.T.; Schmuttenmaer, C.A. Far-infrared dielectric properties of polar liquids probed by femtosecond terahertz pulse spectroscopy. J. Phys. Chem. 1996, 100, 10373–10379. [Google Scholar] [CrossRef]
- Cheon, H.; Yang, H.; Lee, S.-H.; Kim, Y.A.; Son, J.-H. Terahertz molecular resonance of cancer DNA. Sci. Rep. 2016, 6, 37103. [Google Scholar] [CrossRef] [PubMed]
- Upadhya, P.C.; Shen, Y.C.; Davies, A.G.; Linfield, E.H. Terahertz time-domain spectroscopy of glucose and uric acid. J. Biol. Phys. 2003, 29, 117–121. [Google Scholar] [CrossRef] [PubMed]
- Jin, B.-J.; Esteva-Font, C.; Verkman, A.S. Droplet-based microfluidics platform for measurement of rapid erythrocyte water transport. Lab Chip 2015, 15, 3380–3390. [Google Scholar] [CrossRef] [PubMed]
- Tripathi, S.R.; Aoki, M.; Mochizuki, K.; Asahi, T.; Hosako, I.; Hiromoto, N. Randon error estimation in refractive index measured with the terahertz time domain spectroscopy. IEICE Electron. Express 2009, 6, 1690–1696. [Google Scholar] [CrossRef]
- Jarrahi, M. Terahertz radiation-band engineering through spatial beam-shaping. IEEE Photon. Technol. Lett. 2009, 21, 830–832. [Google Scholar] [CrossRef]
- Rodriguez, G.; Taylor, A.J. Screening of the bias field in terahertz generation from photoconductors. Opt. Lett. 1996, 21, 1046–1048. [Google Scholar] [CrossRef] [PubMed]
- Jepsen, P.U.; Fischer, B.M. Dynamic range in terahertz time-domain transmission and reflection spectroscopy. Opt. Lett. 2005, 30, 29–31. [Google Scholar] [CrossRef] [PubMed]
- Fan, S.-K.; Hsieh, T.-H.; Lin, D.-Y. General digital microfluidic platform manipulating dielectric and conductive droplets by dielectrophoresis and electrowetting. Lab Chip 2009, 9, 1236–1242. [Google Scholar] [CrossRef] [PubMed]
- Duvillaret, L.; Garet, F.; Coutaz, J.-L. Influence of noise on the characterization of materials by terahertz time-domain spectroscopy. J. Opt. Soc. Am. B 2000, 17, 452–461. [Google Scholar] [CrossRef]
- Van Exter, M.; Grischkowsky, D. Characterization of an optoelectronic terahertz beam system. IEEE Trans. Microw. Theory Tech. 1990, 38, 1684–1691. [Google Scholar] [CrossRef]
- Wang, T.; Klarskov, P.; Jepsen, P.U. Ultrabroadband THz time-domain spectroscopy of a free-flowing water film. IEEE Trans. Terahertz Sci. Technol. 2014, 4, 425–431. [Google Scholar] [CrossRef]
- Venkatesh, M.; Rao, K.S.; Abhilash, T.S.; Tewari, S.P.; Chaudhary, A.K. Optical characterization of GaAs photoconductive antennas for efficient generation and detection of Terahertz radiation. Opt. Mater. 2014, 36, 596–601. [Google Scholar] [CrossRef]
- Ng, A.H.C.; Chamberlain, M.D.; Situ, H.; Lee, V.; Wheeler, A.R. Digital microfluidic immunocytochemistry in single cells. Nat. Commun. 2015, 6, 7513. [Google Scholar] [CrossRef] [PubMed]
Figure 1.
A microfluidic-based THz-TDS system is shown. Initially, a pump laser pulse is incident on the photoconductive THz emitter with a bias voltage applied over the bias electrodes. The outcome of the interaction between the pump laser pulse and the photoconductive THz emitter is the emission of the reference THz pulse. This reference THz pulse passes through a microfluidic platform with a defined sample thickness and is transformed into the sample THz pulse. The relationship between the reference and sample THz pulses and the sample thickness defines the maximum measurable absorption coefficient.

Figure 2.
Results are shown from the semiclassical computational model for a representative photoconductive THz emitter with an incident average power of 50 mW and an external biasing field of 25 V/150 μm. The results are shown (a) in the time domain as Eref(t) with increasing noise amplitudes of An = 0, 10−3, 10−2, 10−1, 100, and 101; and (b) in the frequency domain as Eref(f) with corresponding dynamic range values of DR = 5.8 × 10³, 5.7 × 10³, 2.4 × 10³, 3.0 × 10², 2.8 × 101, and 2.8 × 100.
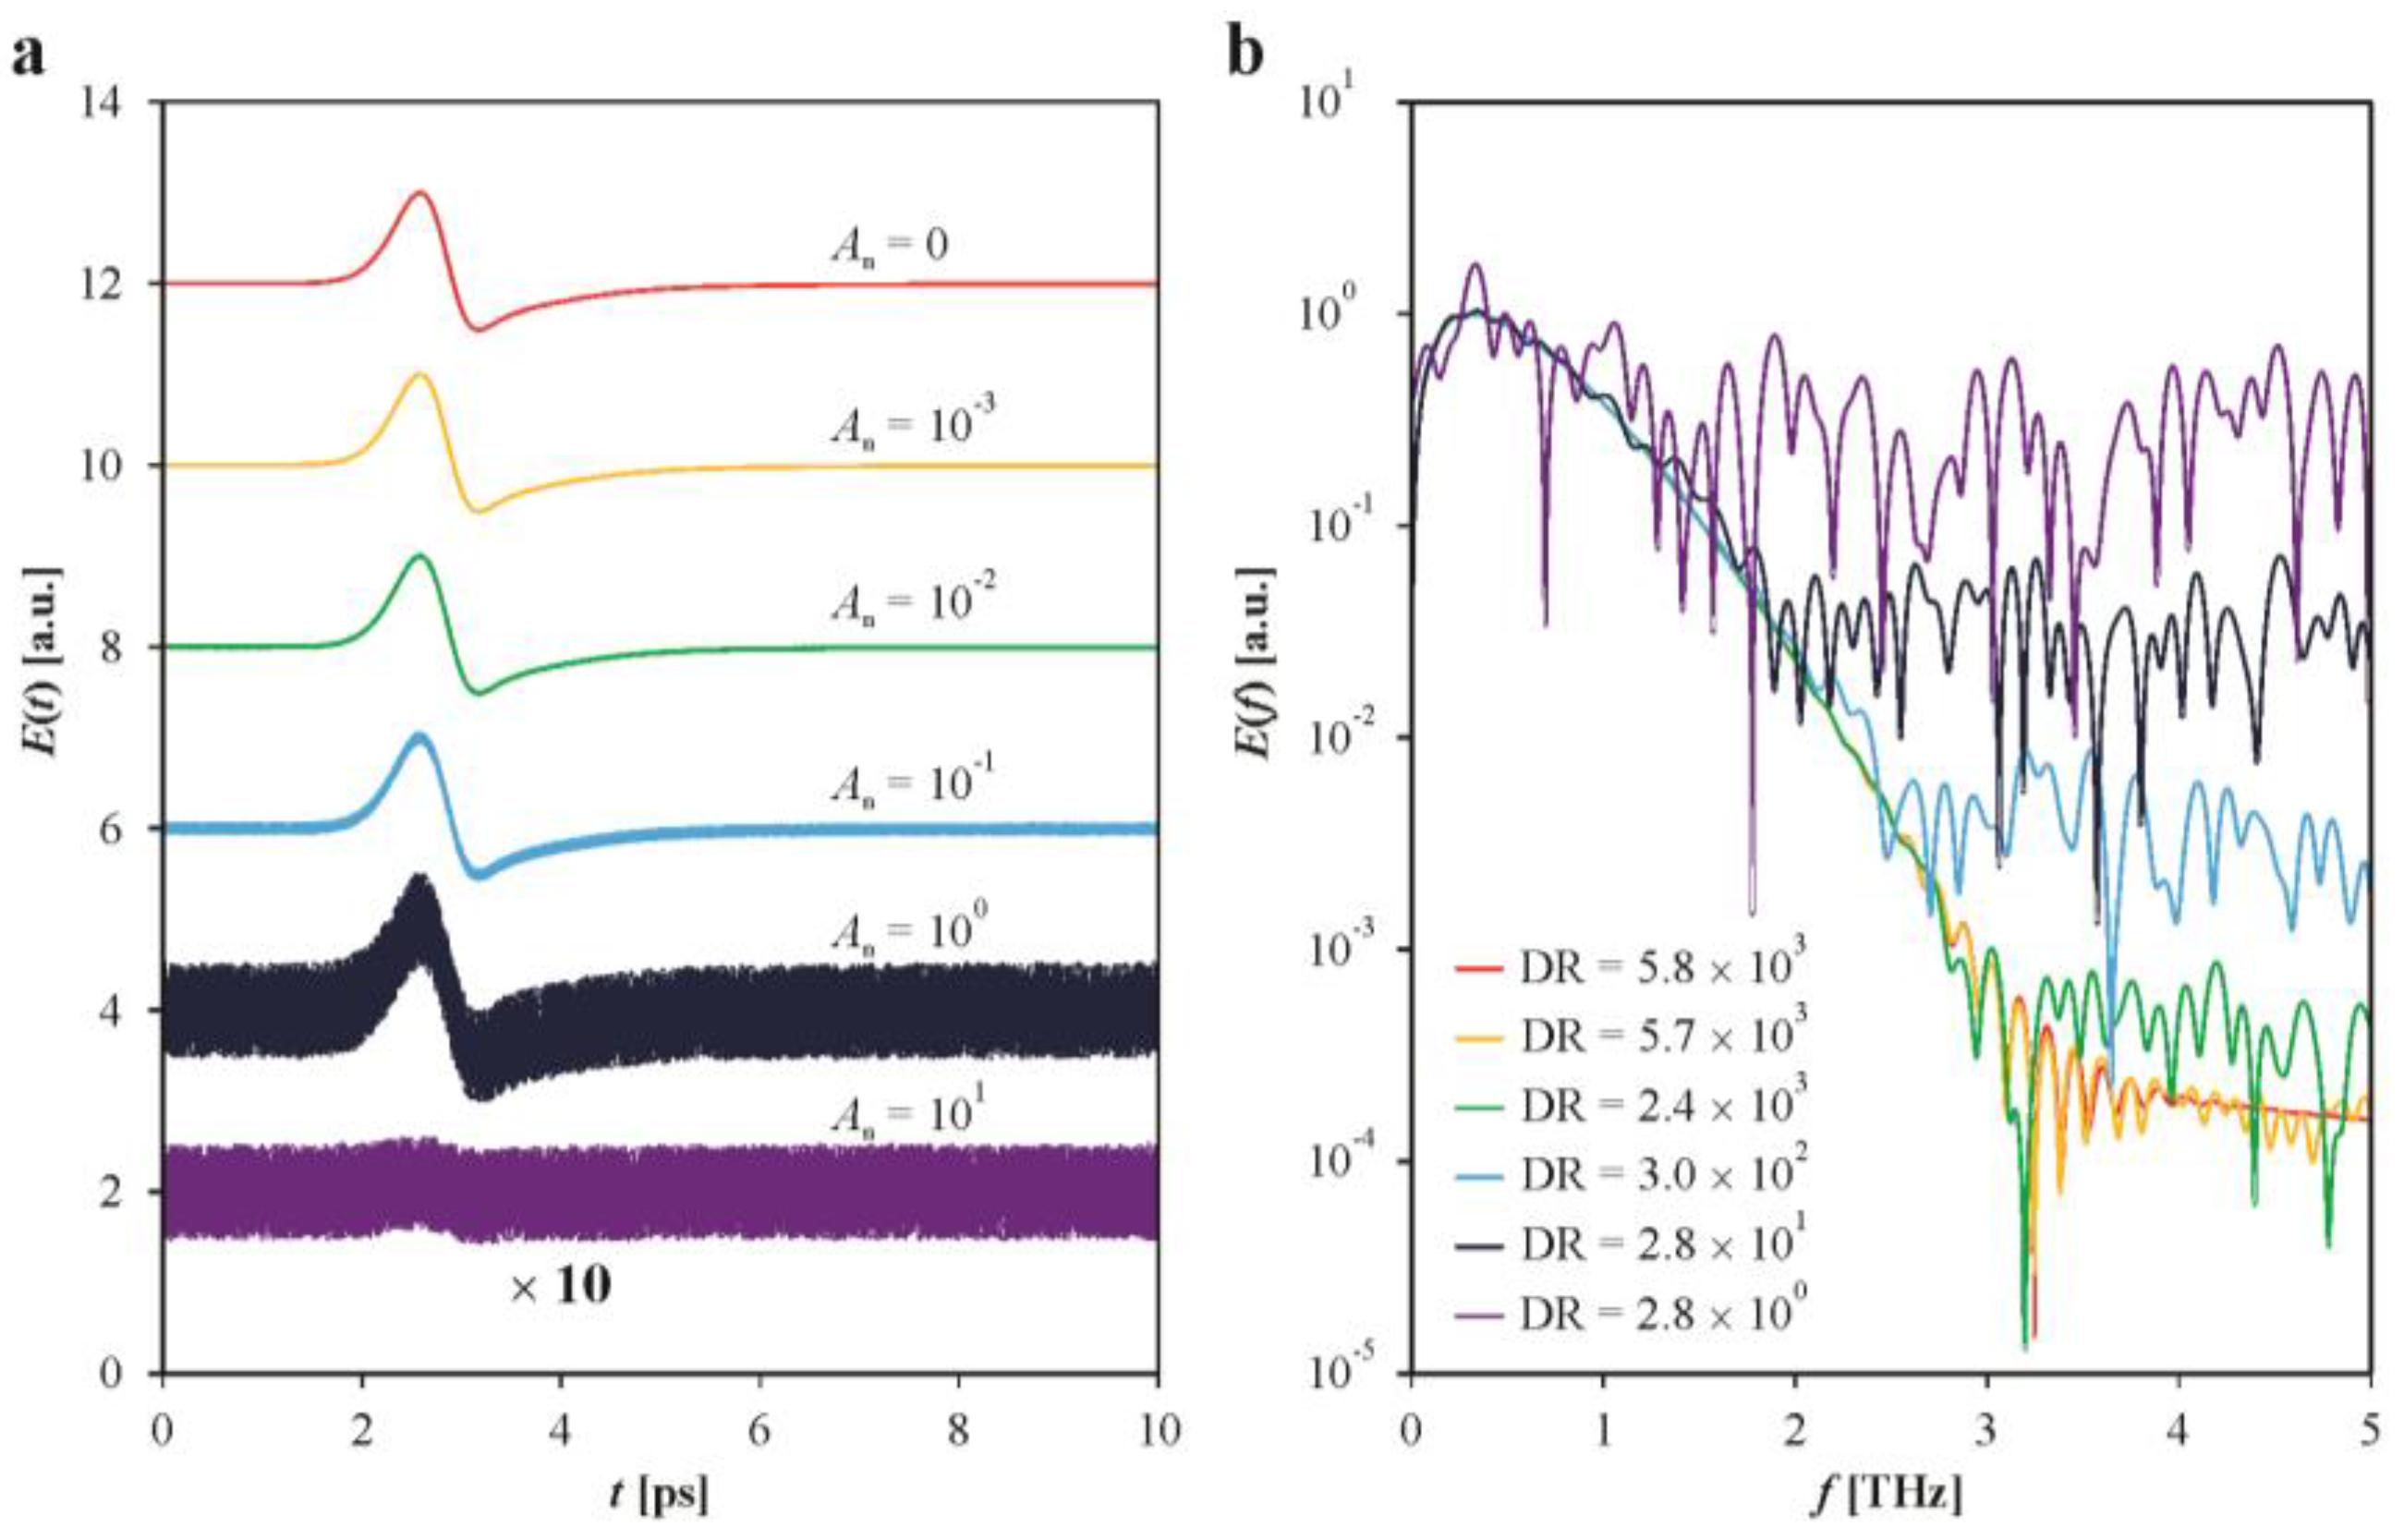
Figure 3.
The maximum measurable absorption coefficient is shown (a) for the dynamic range values of DR = 5.8 × 10³, 5.7 × 10³, 2.4 × 10³, 3.0 × 10², 2.8 × 101, and 2.8 × 100 and a constant sample thickness of d = 120 μm, plotted as red, yellow, green, blue, indigo, and violet solid lines, respectively; and (b) for the dynamic range value of DR = 2.4 × 10³ and sample thicknesses of d = 30, 60, 120, 240, and 480 μm, plotted as blue long-dashed, medium-dashed, solid, short-dashed, and dashed-dotted lines, respectively. The absorption coefficient of water, αwater, is plotted as a solid black line. The intersection of the αwater curve with the maximum measurable absorption coefficient curves defines each of the maximum measurable frequencies f1–10. These maximum measurable frequencies decrease with decreasing dynamic range values and increasing sample thicknesses.

Figure 4.
In (a), a plot is presented with the maximum measurable frequency as the dependent variable and the sample thickness as the independent variable, with the logarithm of the dynamic range value identifying the individual curves. In (b), a plot is presented with the maximum measurable frequency as the dependent variable and the logarithm of the dynamic range value as the independent variable, with sample thickness identifying the individual curves. From this data, the range of appropriate dynamic range values and sample thicknesses can be found for a desired maximum measureable frequency.
© 2018 by the authors. Licensee MDPI, Basel, Switzerland. This article is an open access article distributed under the terms and conditions of the Creative Commons Attribution (CC BY) license (http://creativecommons.org/licenses/by/4.0/).
Share and Cite
MDPI and ACS Style
Al-Hujazy, R.; Collier, C.M. Design Considerations for Integration of Terahertz Time-Domain Spectroscopy in Microfluidic Platforms. Photonics 2018, 5, 5. https://doi.org/10.3390/photonics5010005
AMA Style
Al-Hujazy R, Collier CM. Design Considerations for Integration of Terahertz Time-Domain Spectroscopy in Microfluidic Platforms. Photonics. 2018; 5(1):5. https://doi.org/10.3390/photonics5010005
Chicago/Turabian StyleAl-Hujazy, Rasha, and Christopher M. Collier. 2018. "Design Considerations for Integration of Terahertz Time-Domain Spectroscopy in Microfluidic Platforms" Photonics 5, no. 1: 5. https://doi.org/10.3390/photonics5010005
Note that from the first issue of 2016, this journal uses article numbers instead of page numbers. See further details here.