Considerations and Framework for Foveated Imaging Systems †


1
Department of Electrical Engineering, The Pennsylvania State University, University Park, PA 16802, USA
2
US Army Armament Research, Development and Engineering Center, Picatinny Arsenal, NJ 07086, USA
*
Author to whom correspondence should be addressed.
†
This work was presented partially at Long, A.D.; Narayanan, R.M.; Kane, T.J.; Rice, T.F.; Tauber, M.J. Analysis and implementation of the foveated vision of the raptor eye. In Proceedings of the SPIE Conference on Image Sensing Technologies: Materials, Devices, Systems, and Applications III, Baltimore, MD, USA, 20–21 April 2016; pp. 98540T-1–98540T-9, and Long, A.D.; Narayanan, R.M.; Kane, T.J.; Rice, T.F.; Tauber, M.J. Foveal scale space generation with the log-polar transform. In Proceedings of the SPIE Conference on Image Sensing Technologies: Materials, Devices, Systems, and Applications IV, Anaheim, CA, USA, 12–13 April 2017; pp. 1020910-1–1020910-8.
Photonics 2018, 5(3), 18; https://doi.org/10.3390/photonics5030018
Submission received: 7 March 2018
/
Revised: 25 June 2018
/
Accepted: 12 July 2018
/
Published: 19 July 2018
Abstract
:Foveated sight as observed in some raptor eyes is a motivation for artificial imaging systems requiring both wide fields of view as well as specific embedded regions of higher resolution. These foveated optical imaging systems are applicable to many acquisition and tracking tasks and as such are often required to be relatively portable and operate in real-time. Two approaches to achieve foveation have been explored in the past: optical system design and back-end data processing. In this paper, these previous works are compiled and used to build a framework for analyzing and designing practical foveated imaging systems. While each approach (physical control of optical distortion within the lens design process, and post-processing image re-sampling) has its own pros and cons, it is concluded that a combination of both techniques will further spur the development of more versatile, flexible, and adaptable foveated imaging systems in the future.
1. Introduction and Motivation
1.1. Features of Raptors’ Vision
Birds of prey, such as raptors (e.g., falcons, hawks, and eagles) have two regions of the retina in each eye that are specialized for acute vision: the deep fovea and the shallow fovea. The line of sight of the deep fovea points forwards and approximately 45° to the right or left of the head axis, while that of the shallow fovea also points forwards but approximately 15° to the right or left of the head axis. The anatomy of the foveae suggests that the deep fovea has the higher acuity. Most raptor eye traits include a retina that acts like a telephoto lens and provides stereo vision and UV light detection. Raptors thus employ modified lens and foveal arrangements and widened spacing of their photoreceptors in order to achieve the image resolution needed to locate their prey. Their special eye structure allows for simultaneous perception of distant and near objects and scenes. Using ray plotting through foveal outline traces, it was noted that sharp images were formed beneath the center and shoulders, with an enlarged center image accounting for the high acuity of raptors [1].
Deep foveas were also seen to exaggerate eccentricity of off-center images of a point source. Real raptors also appear to have higher visual acuity along the line of sight (LOS) of the deep fovea than along the LOS of the shallow fovea, because the receptor density in the deep fovea is higher than that in the shallow fovea. It was suggested that the deep fovea further enhances acuity by acting as a telephoto lens [2]. The brown falcon is exceptional in having equal receptor densities in the deep and shallow foveae [3]. Behavioral studies also suggest that real raptors have their highest visual acuity along the LOS of the deep foveae. In addition, birds have sharper vision than humans and can see in certain spectral bands, like the ultraviolet (UV), which humans cannot [4]. This is due to their significantly larger number and types of retinal photoreceptive “cones” located at the back of the eye for enhanced color perception and significantly larger number of retinal photoreceptive “cell rods” for enhanced visual acuity. The speed of accommodation, i.e., the ability to change focus, was found to be very rapid in various species of owls [5].
1.2. Prior Work on Foveated Imaging
If an image sensor with similar properties is constructed, it would be useful for machine vision applications where high acuity in (select portions of) the far field of view and wide view angle in the near field of view are of equal importance. A two-camera composite sensor combining a front end comprising of a set of video cameras imitating a falconiform eye and a back end employing a log-polar model of retino-cortical projection in primates was demonstrated [6]. The sensor output was a composite log-polar image incorporating both near and far visual fields into a single homogeneous image space. A wide-angle lens design intended for foveated imaging applications was presented, and typical tradeoffs were discussed [7]. It was shown that, with appropriate lens design and spatial light modulator (SLM) resolution, a diffraction limited performance could be achieved across a wide field of view (FOV) and that diffraction could be reduced by choosing the minimum SLM resolution to correct the wavefront error.
A dynamic dual-foveated imaging system in the infrared band was developed for two fields of interest (FOIs), wherein a transmissive SLM was used as an active optical element placed near the image plane instead of the pupil plane to separate the rays of two different selected fields [8]. Compared to conventional imaging systems, a dual-foveated imaging approach simplifies the wide-FOV optical system by using SLM, which also decreases the data needed for program processing and transmission.
A foveal infrared focal plane array (FPA) was developed having higher spatial frequency of pixel channels near the center of attention (COA) and a radially symmetric spatial frequency diminishing radially out from the COA [9]. This architecture allowed for coverage of the entire field of view at high frame rates by dynamically forming larger superpixels on the FPA in regions of relative unimportance, thus reducing the total number of pixel values required to be multiplexed off the FPA [10].
A design study of various tradeoffs related to axial and off-axis foveation approaches addressed solutions to overcome problems such as aberrations and distortions [11]. The study suggested that a reimaging relay lens was the best solution to add the required correction and maintain the required focal length.
An alternate approach was presented for an optical surveillance system featuring a panomorph lens operating over a 360-degree area with 100% coverage yielding enhanced performance with better pixel/cost ratio [12]. In such a system, the panoramic image was able to follow events (such as moving objects) in real time, thereby allowing operators to focus their activities on a narrow field pan/tilt camera without losing any information in the field. An outline for target identification capabilities for a given number of pixels per target was also presented.
A conceptual stereo-foveation model was presented to achieve the benefits of binocular foveation to photogrammetry and an implementation of it for anaglyph imaging. Foveating stereoscopic images provides several advantages bandwidth and hardware resources related to real-time processing and data transmission as well as visualization of images with large datasets [13].
In log-polar sampled images, lines are distorted in a non-linear way, and their distances are not preserved. To overcome this difficulty, the geometric properties of lines in log-polar coordinates have been studied, and efficient computational methods have been derived [14]. Converting from a log-polar plot to a Cartesian grid can be performed using computer software with a set of equations so that the location of a pixel in the log-polar space will match up to its location in the Cartesian grid. This method allows for a single image that will show both the far field and the near field, with some errors. It has also been shown that log-polar foveation and multiscale local spectral analysis can be regarded as similar processes, taking place in conjugated domains, and being related through a Fourier transform [15].
A wavelet-based scalable foveated video coding system was developed to assist foveation on the visually important components in a video sequence. By using an adaptive frame prediction algorithm, better frame prediction was achieved while controlling error propagation [16]. A biologically motivated algorithm was developed to select visually-salient regions of interest in video streams for multiply foveated video compression, wherein regions were selected based on low-level visual cues followed by a dynamic foveation filter that increasingly blurred every frame, based on its distance from salient locations [17]. An approach approximating the spatially variant properties of the human visual system was developed to maximize the sampling efficiency, information throughput, and bandwidth savings of the foveated system [18]. A three-channel imaging system which simultaneously captures multiple images having different magnifications and FOVs on an image sensor was developed permitting different image processing algorithms to be implemented on different segments of an image sensor [19].
It was shown that an array of dissimilar lenslets, as opposed to identical lenslets, is capable of emulating a single conventional lens and providing high-resolution super-resolved imaging with significant reduction in track length [20]. A similar result was obtained using a planar array of identical cameras combined with a prism array to achieve super-resolution reconstruction of a mosaicked image. Such an approach offers enhanced capability of achieving large foveal ratios from compact, low-cost imaging systems [21]. Recently, a novel approach to foveated imaging was developed based on dual-aperture optics that superimposes two images on a single sensor, thus attaining pronounced foveation with reduced optical complexity. With each image capturing the scene at a different magnification, the system can simultaneously process a wide field of view with high acuity in the central region and achieve enhanced object tracking and recognition over a wider field of view [22].
1.3. Motivation for Present Work
The motivation for the work presented herein is to develop optical systems for mounting on weapon and UAV platforms to detect and track humans and vehicles of interest for applications such as homeland, border, and coastal security. The goal is to develop real-time processing with high resolution video streams by utilizing foveation approaches to assess scene information through multiple channels and track targets over the full range of possible scales and viewpoints, without significant loss of ability to classify the object being fixated upon. The implemented tracking and classification algorithms must be robust against scale, rotation, and viewpoint changes, and be valid for both static and moving platforms. This paper integrates preliminary versions of our work presented and published in conference proceedings [23,24]. Here, we provide further details and additional results on our approach to foveated imaging.
This paper is structured as follows. Section 2 presents a brief overview of the characteristics of the raptor eye which motivates the development of an adaptable foveated imaging system. Section 3 and Section 4 address various aspects related to optical and electronic approaches to foveated imaging, respectively, and presents a framework for further development and analysis. Finally, Section 5 presents conclusions and directions for future work in this area, with an emphasis on combining hardware and software approaches.
2. Raptor Eye Characteristics
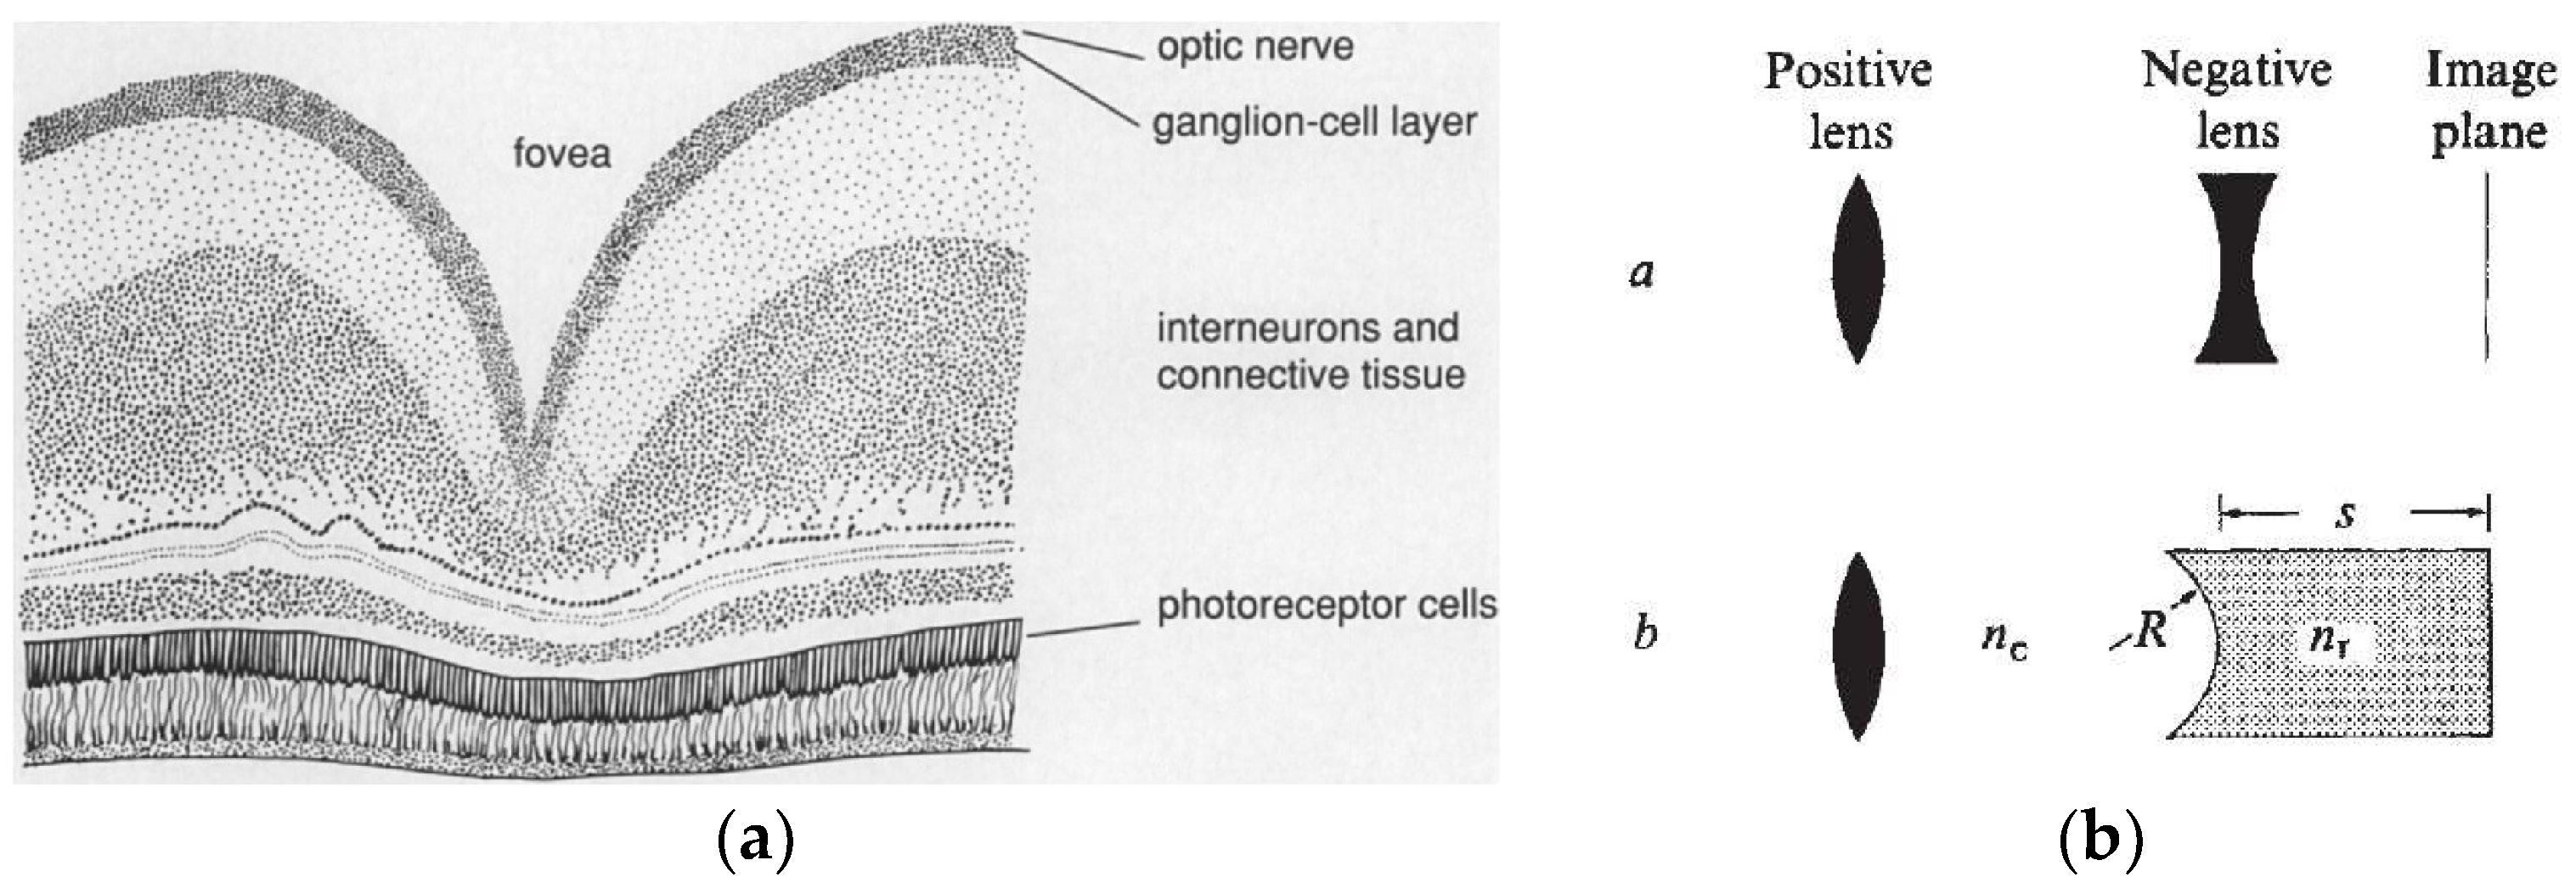
Foveation in biological systems is the result of small localized depressions on the surface of the retina as shown in Figure 1. These depressions naturally only affect a small range of field angles within the FOV of an eye because the lens of the eye acts to localize the ray bundles in the region close to the retina. This depression in the fovea of the raptors acts like a small, powerful negative element placed close to the imaging plane. This may be thought of as a telephoto lens where the negative element allows the focal length of the lens to be longer than the total track length of the lens, also shown in Figure 1. The longer focal length corresponds to a magnification of the object on the image plane in this region [25].
The cross-section of retinal tissue from a bird’s eye, shown in Figure 1a, presents the layered organization of the cells wherein the photosensitive rods and cones are located near the back of the retina [26]. The optic nerve and several layers of interneurons lie in front of the receptor cells, and light passes through the overlying tissue to reach the light-sensitive layer. The deep cleft in the retina is a fovea, a region of high visual acuity. At the surface of the fovea, light is refracted in a pattern that tends to magnify the image projected on the photoreceptor cells.
In the raptor eye, there exists a concave portion of the foveal pit which functions as a negative lens which, together with the positive power of the cornea and lens, acts like the telephoto optical system of Figure 1b. The magnification of the system is given by [2]
where and are the refractive indices of the medium to the left and right of the spherical cavity respectively, is the radius of curvature of the surface, and the distance from the apex of the spherical surface to the image plane.
Raptors have two foveae located in the side and forward regions of their FOV as shown in Figure 2. These foveae have different depths, which in turn correspond to different visual acuity in each of these regions. The forward looking fovea is the shallower of the two and is primarily used for focusing on near objects. Far away objects are viewed with the deep fovea located in the side region of the raptor eye FOV. The logic behind the placement of the shallow and deep foveae is related to the spiral flight pattern and hunting methods of raptors [27].
Dual foveas in each eye allow the bird to see clearly along more than one visual axis. The axes for the frontally directed foveas lie within a narrow band of binocular vision. The additional foveas provide good monocular acuity at angles where the human eye offers only vague peripheral vision.
The biological motivation for multiple foveated regions is clear. At one time or another, a predator such as a raptor must be able to view both near and far objects keenly. In a designed system, implementing such a feature in an application specific manner could also see uses. For instance, a forward-looking wide FOV camera on a vehicle may need to observe distant objects such as other vehicles as well as be able to acutely measure and interpret objects and patterns on the ground. The dual foveation exhibited by many raptor eyes motivates us, more generally, to consider a movable or adaptable deep foveation region, which will enable target tracking, etc.
3. Optical Approach to Foveated Imaging
The optical approach to foveated imaging is covered in the following sub-sections, which cover an introduction to optical foveation, and sequential modeling in Zemax®.
3.1. Optical Considerations
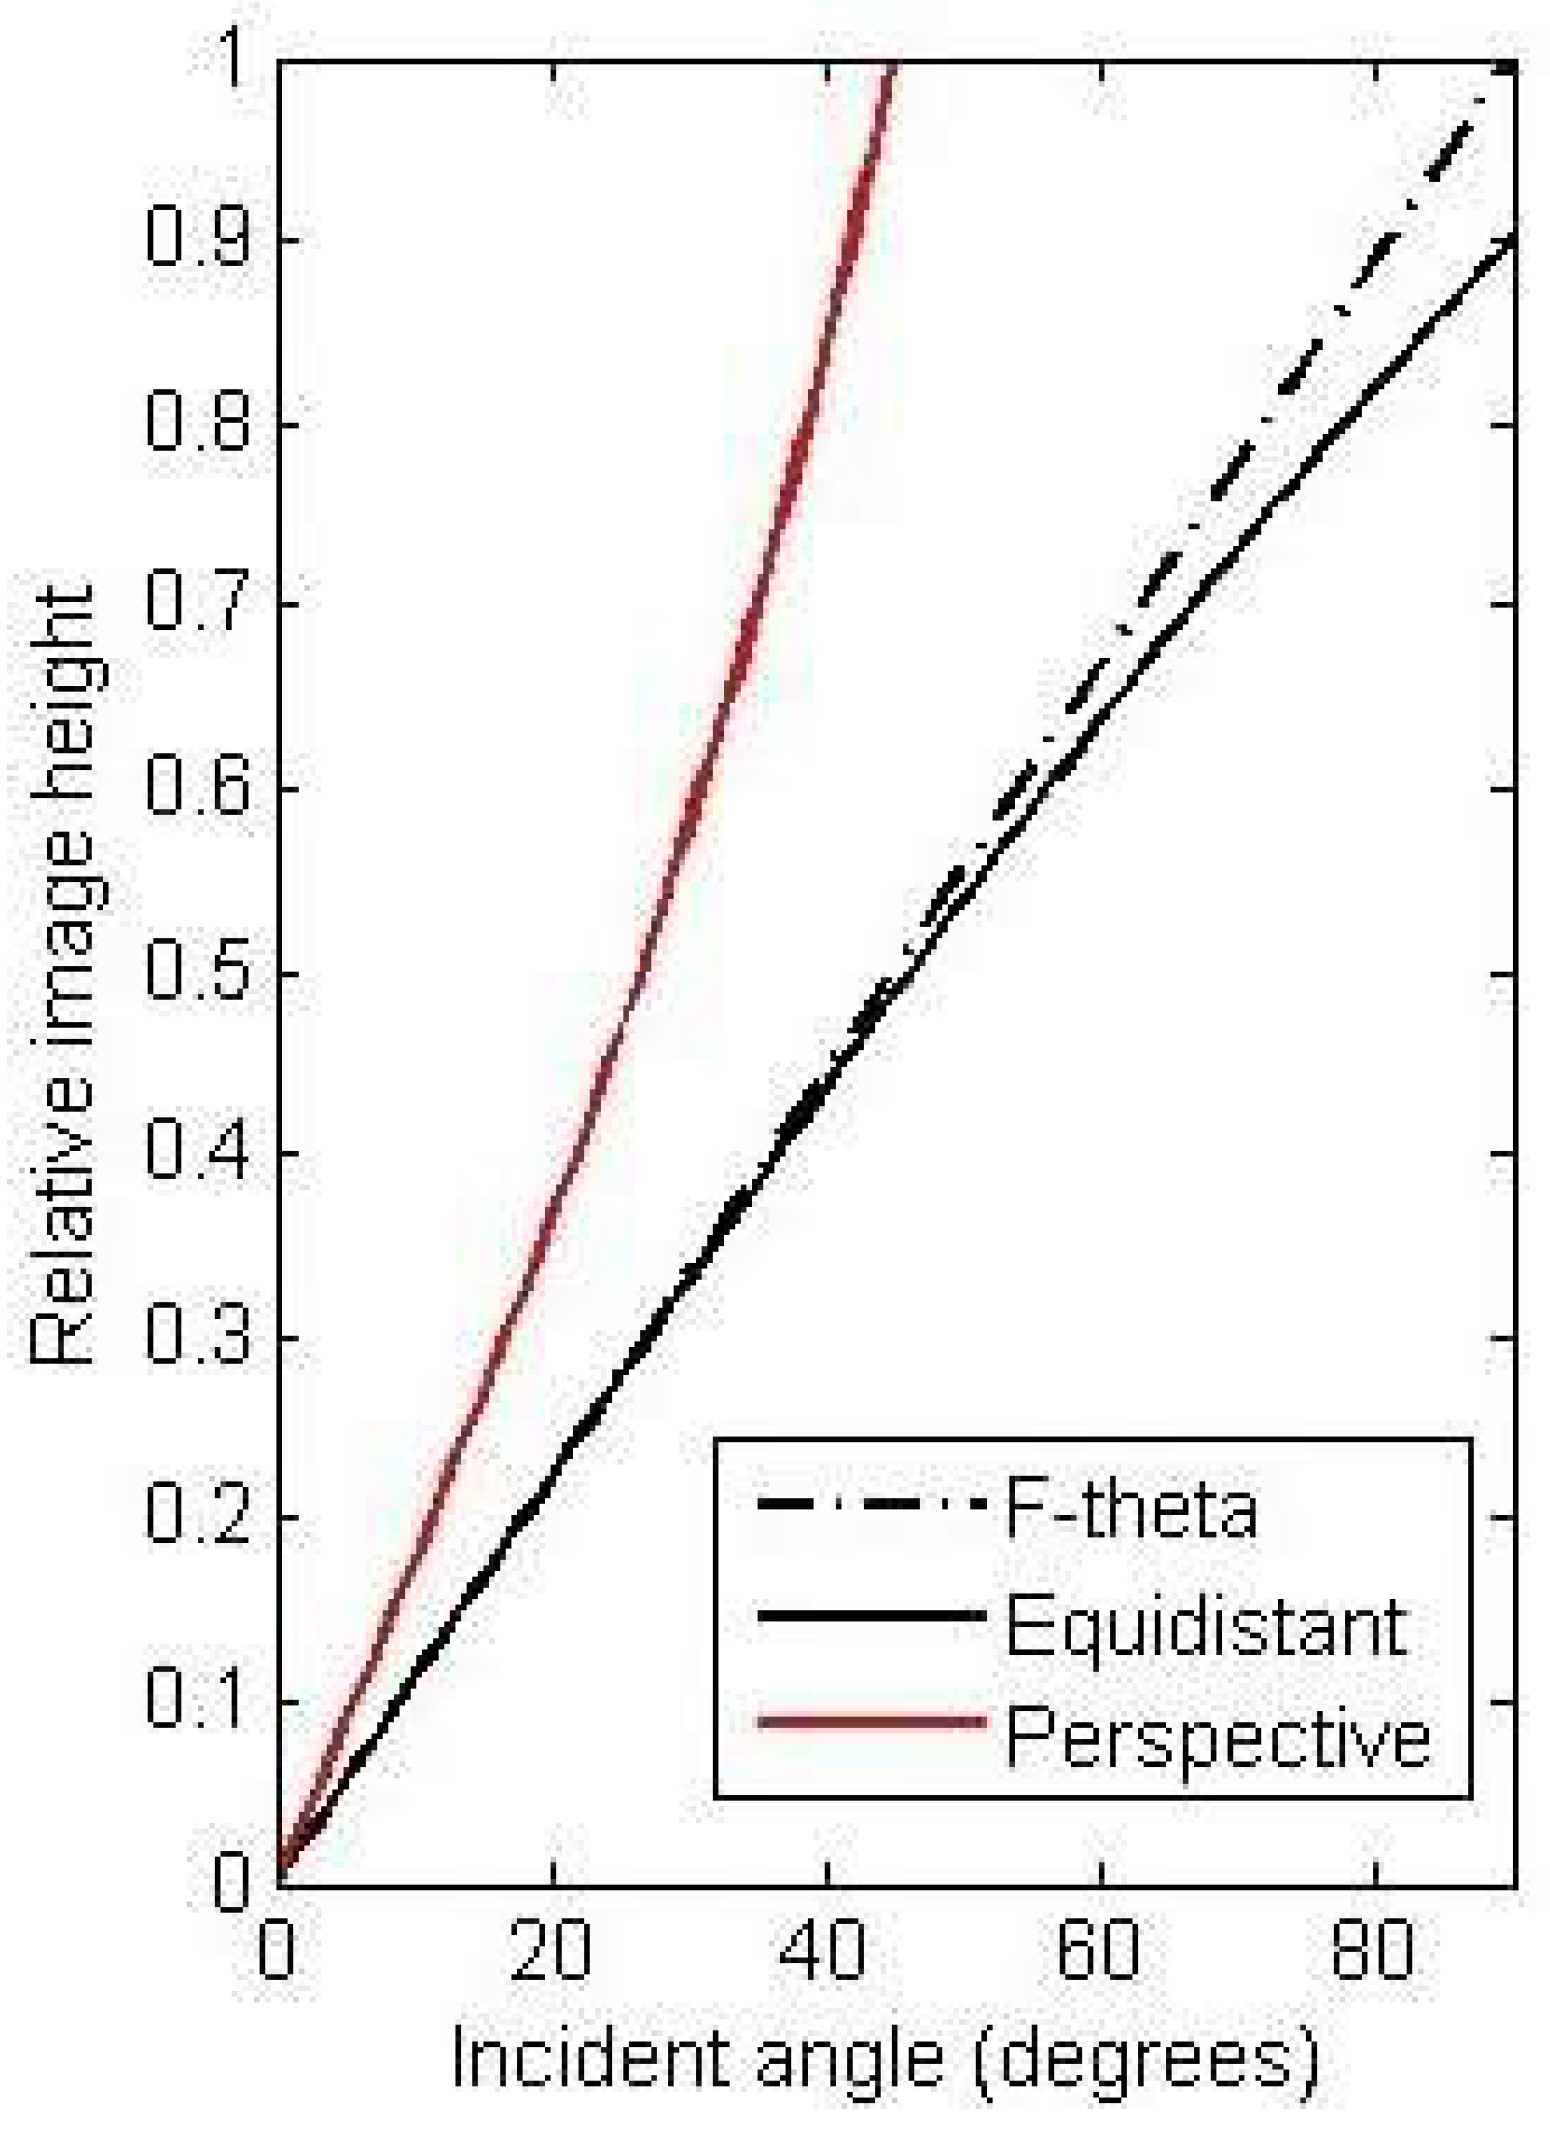
Foveated imaging, broadly, involves spatially variant imaging around one or more fixation points [28]. The information content locally within an image in a foveated system may be primarily characterized by the effective magnification at that location normalized to some maximum value, usually at the fixation point. Effective magnification may be alternatively described by distortion curves of an optical system. Distortion is defined as the deviation of the real image height on the image plane from the theoretically ideal image height, both of which are determined by effective focal length. Figure 3 shows a plot of common projections relating image height to field angle.
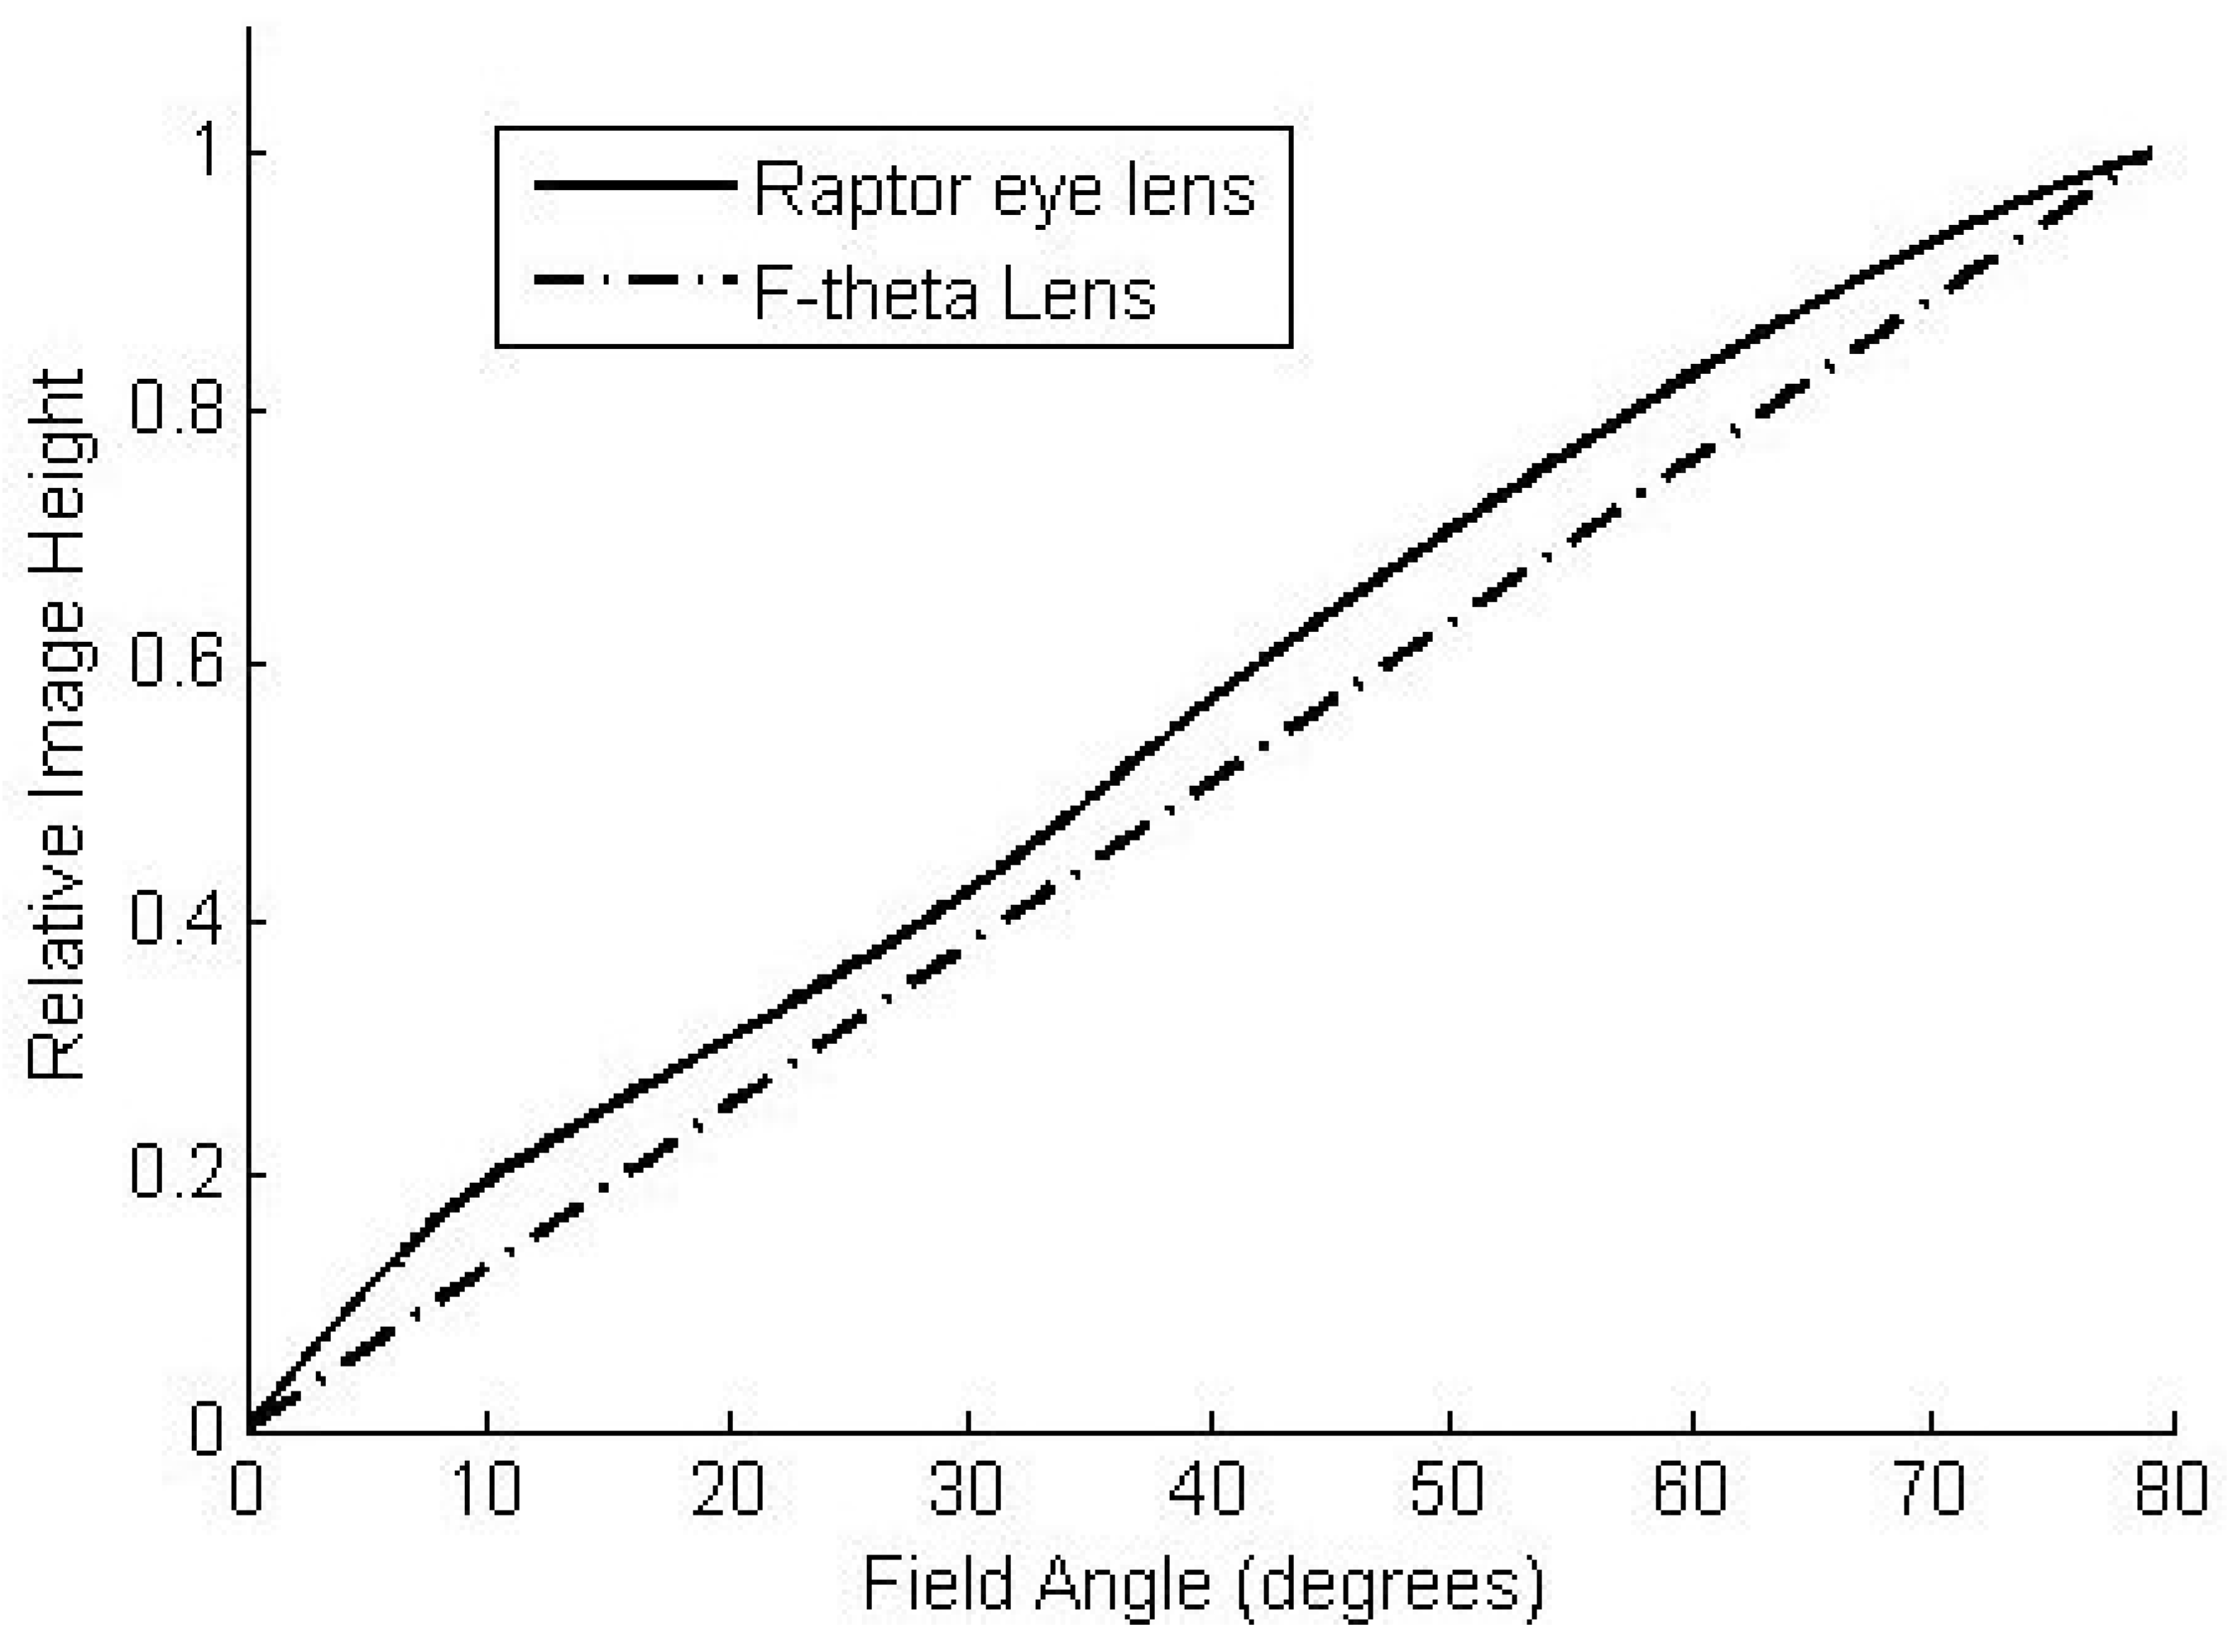
Ideal image height follows a linear relationship between the field angle in object space and the image height on the detector. In an afocal system, there is a linear mapping between angles in object and image space respectively. Figure 4 shows a plot of one such target projection against an “ideal” F-theta projection. This was derived using plots of raptor acuity as a function of field angle. All optical systems deviate from the ideal case to some degree, and distortion is an aberration that is to be minimized or placed within some acceptable bounds [29].
Distortion, , in the range of a few percent is a typical value for imaging systems. Although distortion can have a few different definitions, for the purpose of this work we define distortion as follows, where is the real image height, is the focal length of the system on axis, is the field angle, and is the real focal length of the system for field angle :
From this, we see that positive distortion corresponds to a focal length longer than the on-axis length and negative distortion corresponds to a focal length smaller than the on axis focal length. For wide angle optical systems, the distortion is necessarily negative and large in magnitude to accommodate all the field angles on the imaging detector. This requires a “shrinking” of the image in those fields.
3.2. Lens Design in Sequential Mode
As a test bed for the raptor eye projection, an afocal optical system was proposed for use in the field in either rifle mounted or spotting applications. The term “afocal” refers to the fact that these systems condition the collected light rays for imaging by the human eye and therefore do not produce an image as their output. These systems do often have one or more intermediate image planes contained somewhere between the first and last optics.
Afocal systems are typically comprised of a long focal length objective lens and a relatively short focal length eyepiece, both of which may consist of one or more individual lenses. The ratio between the focal length of the objective and the focal length of the eyepiece is the magnification of the system. The exit pupil for these systems is placed outside the lens system and is designed to be placed in the same location as the pupil of the user. Since the pupil of the user acts as a limiting aperture, the exit pupil is typically constrained to be around 7 mm in diameter to avoid wasting light. Furthermore, the distance from the rear surface of the optical system and the exit pupil is referred to as eye-relief as it is the distance between the user’s eye and the optical system when the system is in use. The apparent field of view (AFOV) is the field of view as perceived by the user when their eye is properly aligned with the exit pupil of the optical system. This has a maximum value that is easily determined geometrically using
where is the eye-relief and is the aperture of the rearmost optic in the eyepiece.
It was decided that the final product should have a wide apparent field of view, as in the raptor eye. Therefore, for the sake of simplifying the problem, a spotting scope design was favored over the riflescope, because riflescopes require large eye-relief to account for the recoil of the gun after shooting. This constraint on the eye-relief coupled with a large apparent field of view necessitates large optics in the eyepiece, as per the equation above. On the other hand, a spotting scope may have minimal eye relief and is therefore easier and less costly to build with a large apparent field of view. A projection function for ultra-wide-angle lenses has been developed where the central portion of the field of view of a spotting scope has different magnification from that of the periphery in order to maintain a wide-angle view while maximizing visibility in the central region [30].
Further simplifying the design process, we sought to incorporate an eyepiece which was already available off the shelf. A short focal length coupled with a large aperture increases the number of aberrations in an optical system. An eyepiece which is well corrected for spherical, comatic, and chromatic aberrations and field curvature can incorporate as many as eight or more lenses. A wide variety of well corrected eyepieces for telescopes are available from vendors. An Erfle eyepiece, shown in Figure 5, is a well-known solution with a wide apparent field of view [29]. This reduces the complexity of the optical design problem and moves the focus toward the development of an objective lens which incorporates our raptor eye projection.
The field of view of the system was narrowed to more easily accommodate a large magnification with the custom distortion curve. For a system with minimum distortion, the magnification across the field of view is roughly equal to the ratio of the apparent field of view from the eyepiece and the actual field of view of the objective lens. In such systems, the field of view of the objective must be less than that of the eyepiece or demagnification occurs. Of course, in the scenario of a custom distortion curve, local regions of high magnification could be obtained. However, such regions would require large variations in the distortion pattern as it is a “give-take” scenario. That is, each region of high magnification must be compensated with demagnification in some other region of the field of view to maintain an average magnification corresponding to the ratio of the apparent field of view and the actual field of view of the system. After establishing a method for the design of an optical system with the desired characteristics for a narrow field of view, the same approach can be extended to a wider field of view system with some modifications if necessary.
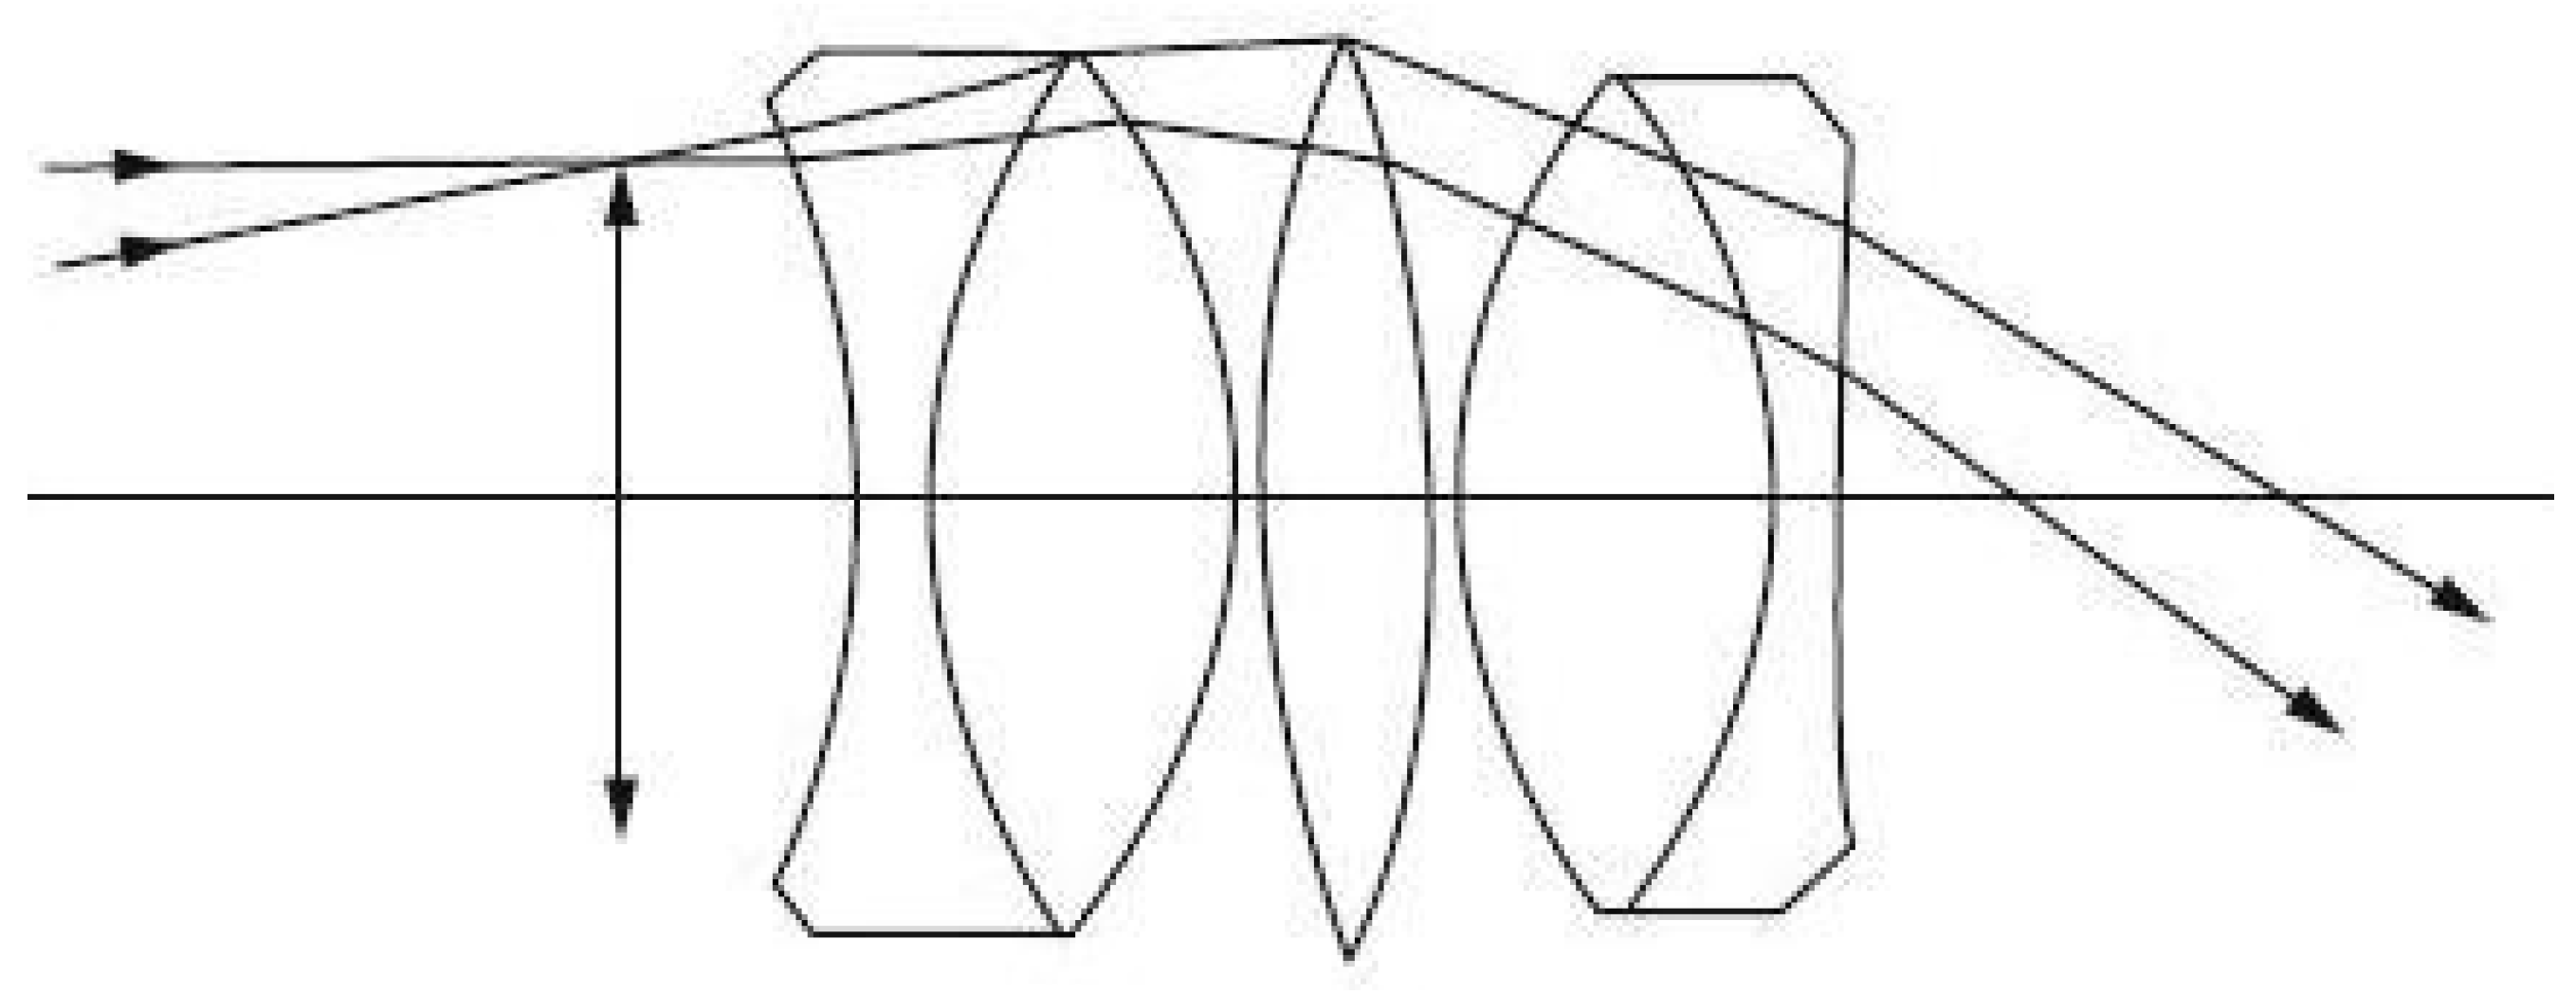
A similar optical design for a small spotting scope with an axially located foveal region was presented and discussed [31,32]. Their objective lens design is shown in the Figure 6, along with an accompanying spot diagram. Note that the scale of the spot diagram is 4 mm and the performance of this system is not particularly good, although it is difficult to tell without the ray fan plots. Note also the large exit angles of the extreme rays on the second and eighth surfaces. These large angles contribute to the spherical aberration contribution from each surface. In this design, as with others, two aspheric surfaces are employed before and after the aperture stop of the system. In this manner, the focal length is locally lengthened on the left side of the aperture stop and the field curvature is compensated for by the aspheric surface on the right side of the stop. The controlled variation of the distortion curve of such a design can be attributed in part to the small aperture stop of the system. This causes the entrance pupil to translate across the surface of the front lens, ensuring that a given field experiences only the local lens curvature. This means that for a highly aspheric surface, such as the one in the figure, two fields of view may “see” vastly different powers of the same front optic.
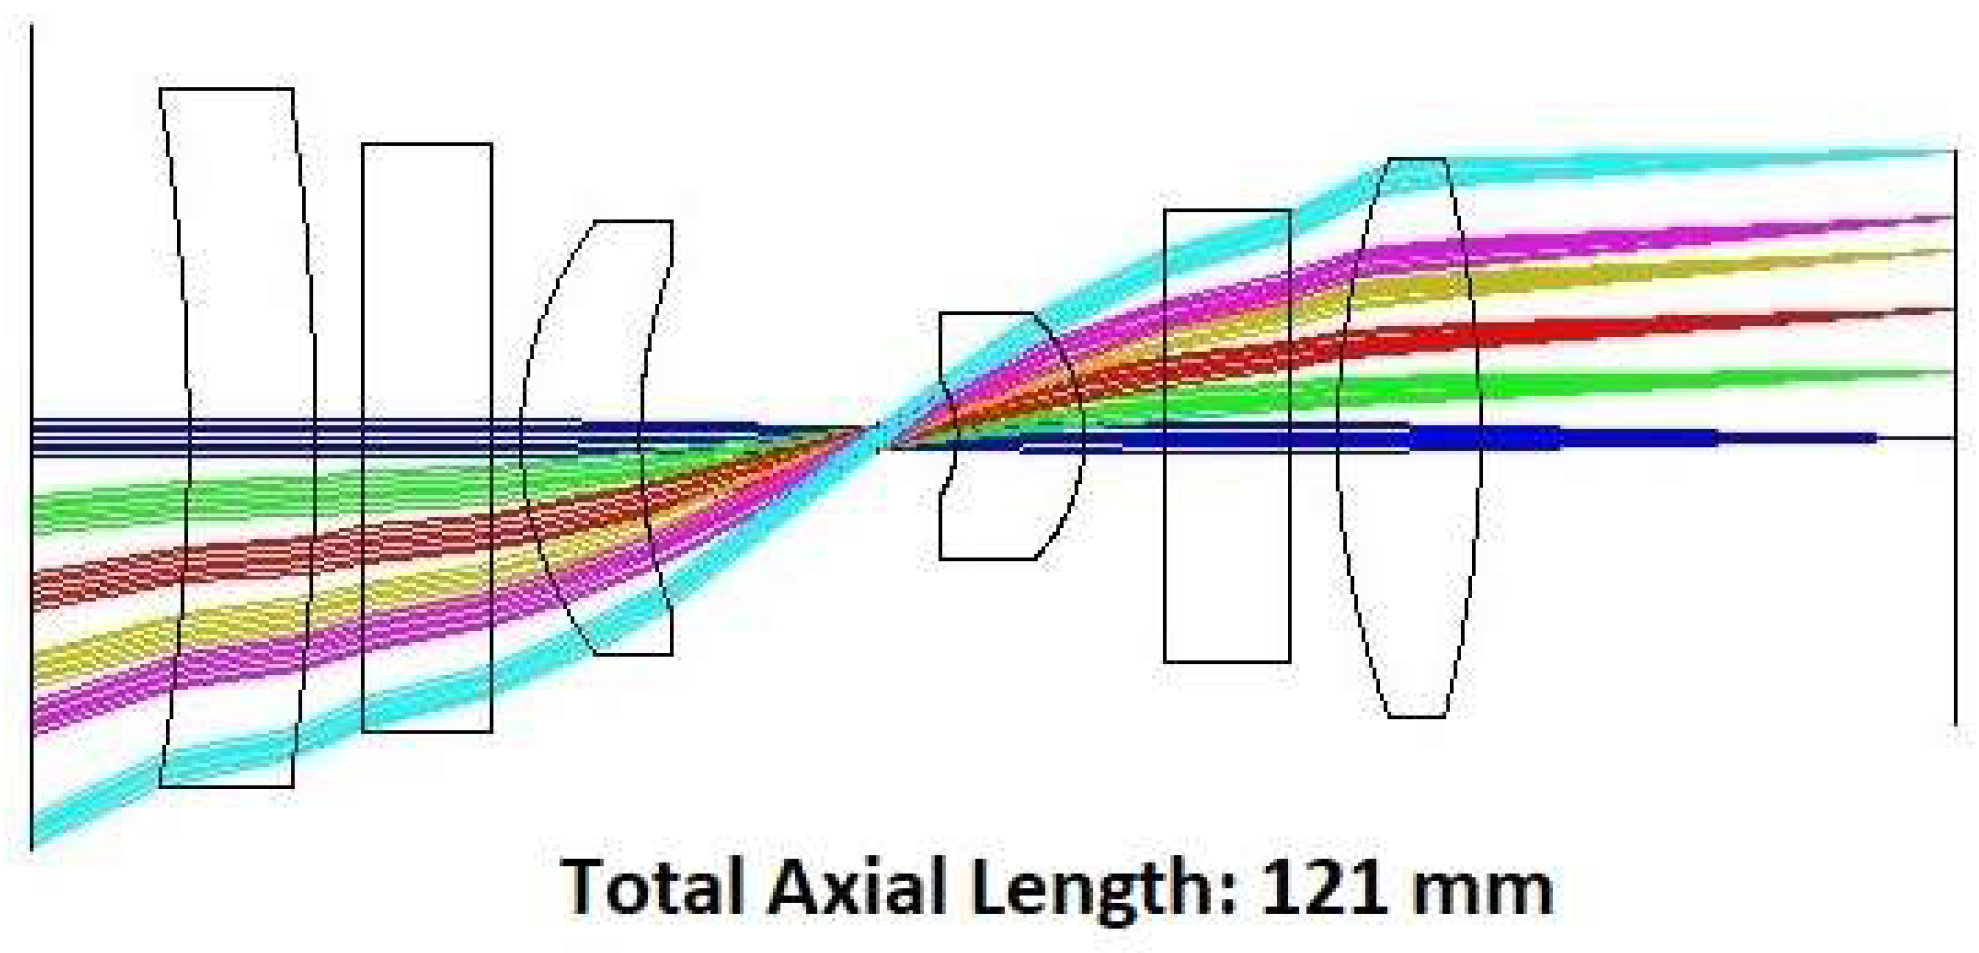
After exploring research in similar optical systems, it was decided that a four-lens system with the aperture stop in the middle would be a suitable starting point for the design of an objective. Having run some tests with a four-lens objective, it was decided that more degrees of freedom were necessary to reduce aberration and converge upon the desired solution. Hence, a six-element objective was run through a Zemax macro. These macros have access to many of the low-level features offered in Zemax and act as a powerful tool in lens development. While the macro developed for the raptor eye system plays the key role in acquiring the custom distortion pattern sought after, a good first order model is required as a starting point for the system. The macro does not design the system by itself and without a good starting point as it can easily converge on unrealistic or all around bad solutions. The starting point for this optimization is shown in Figure 7.
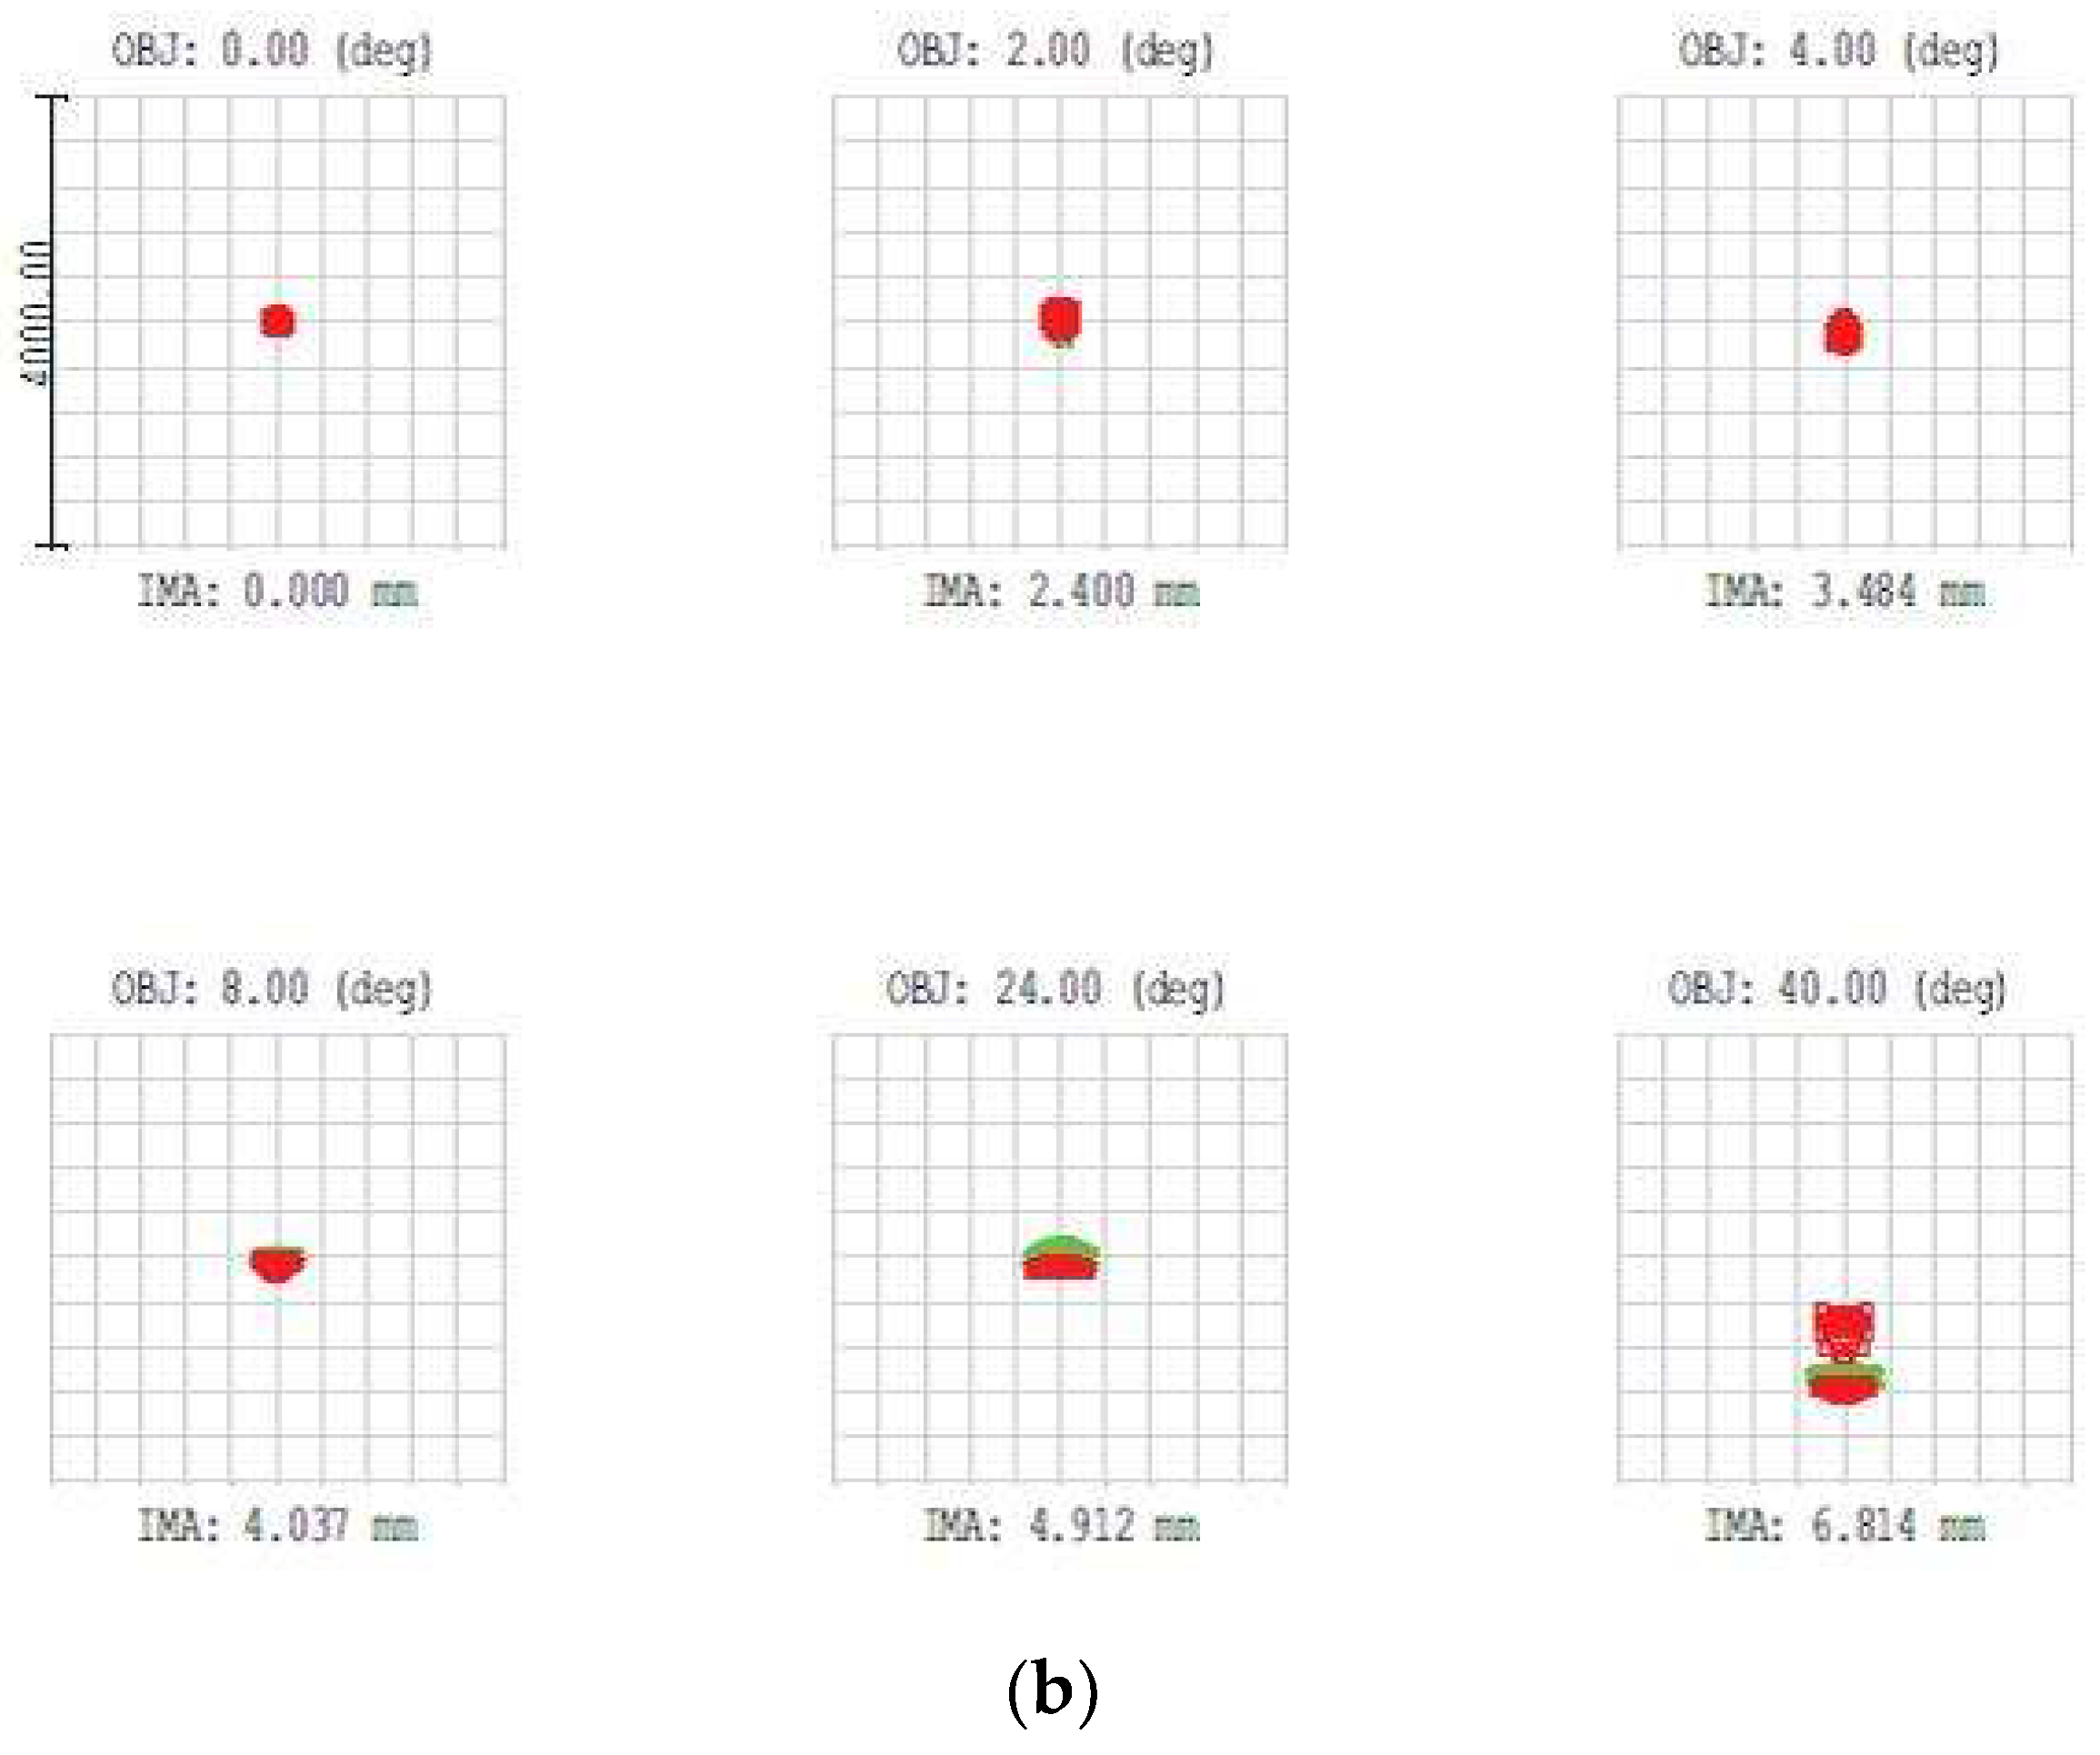
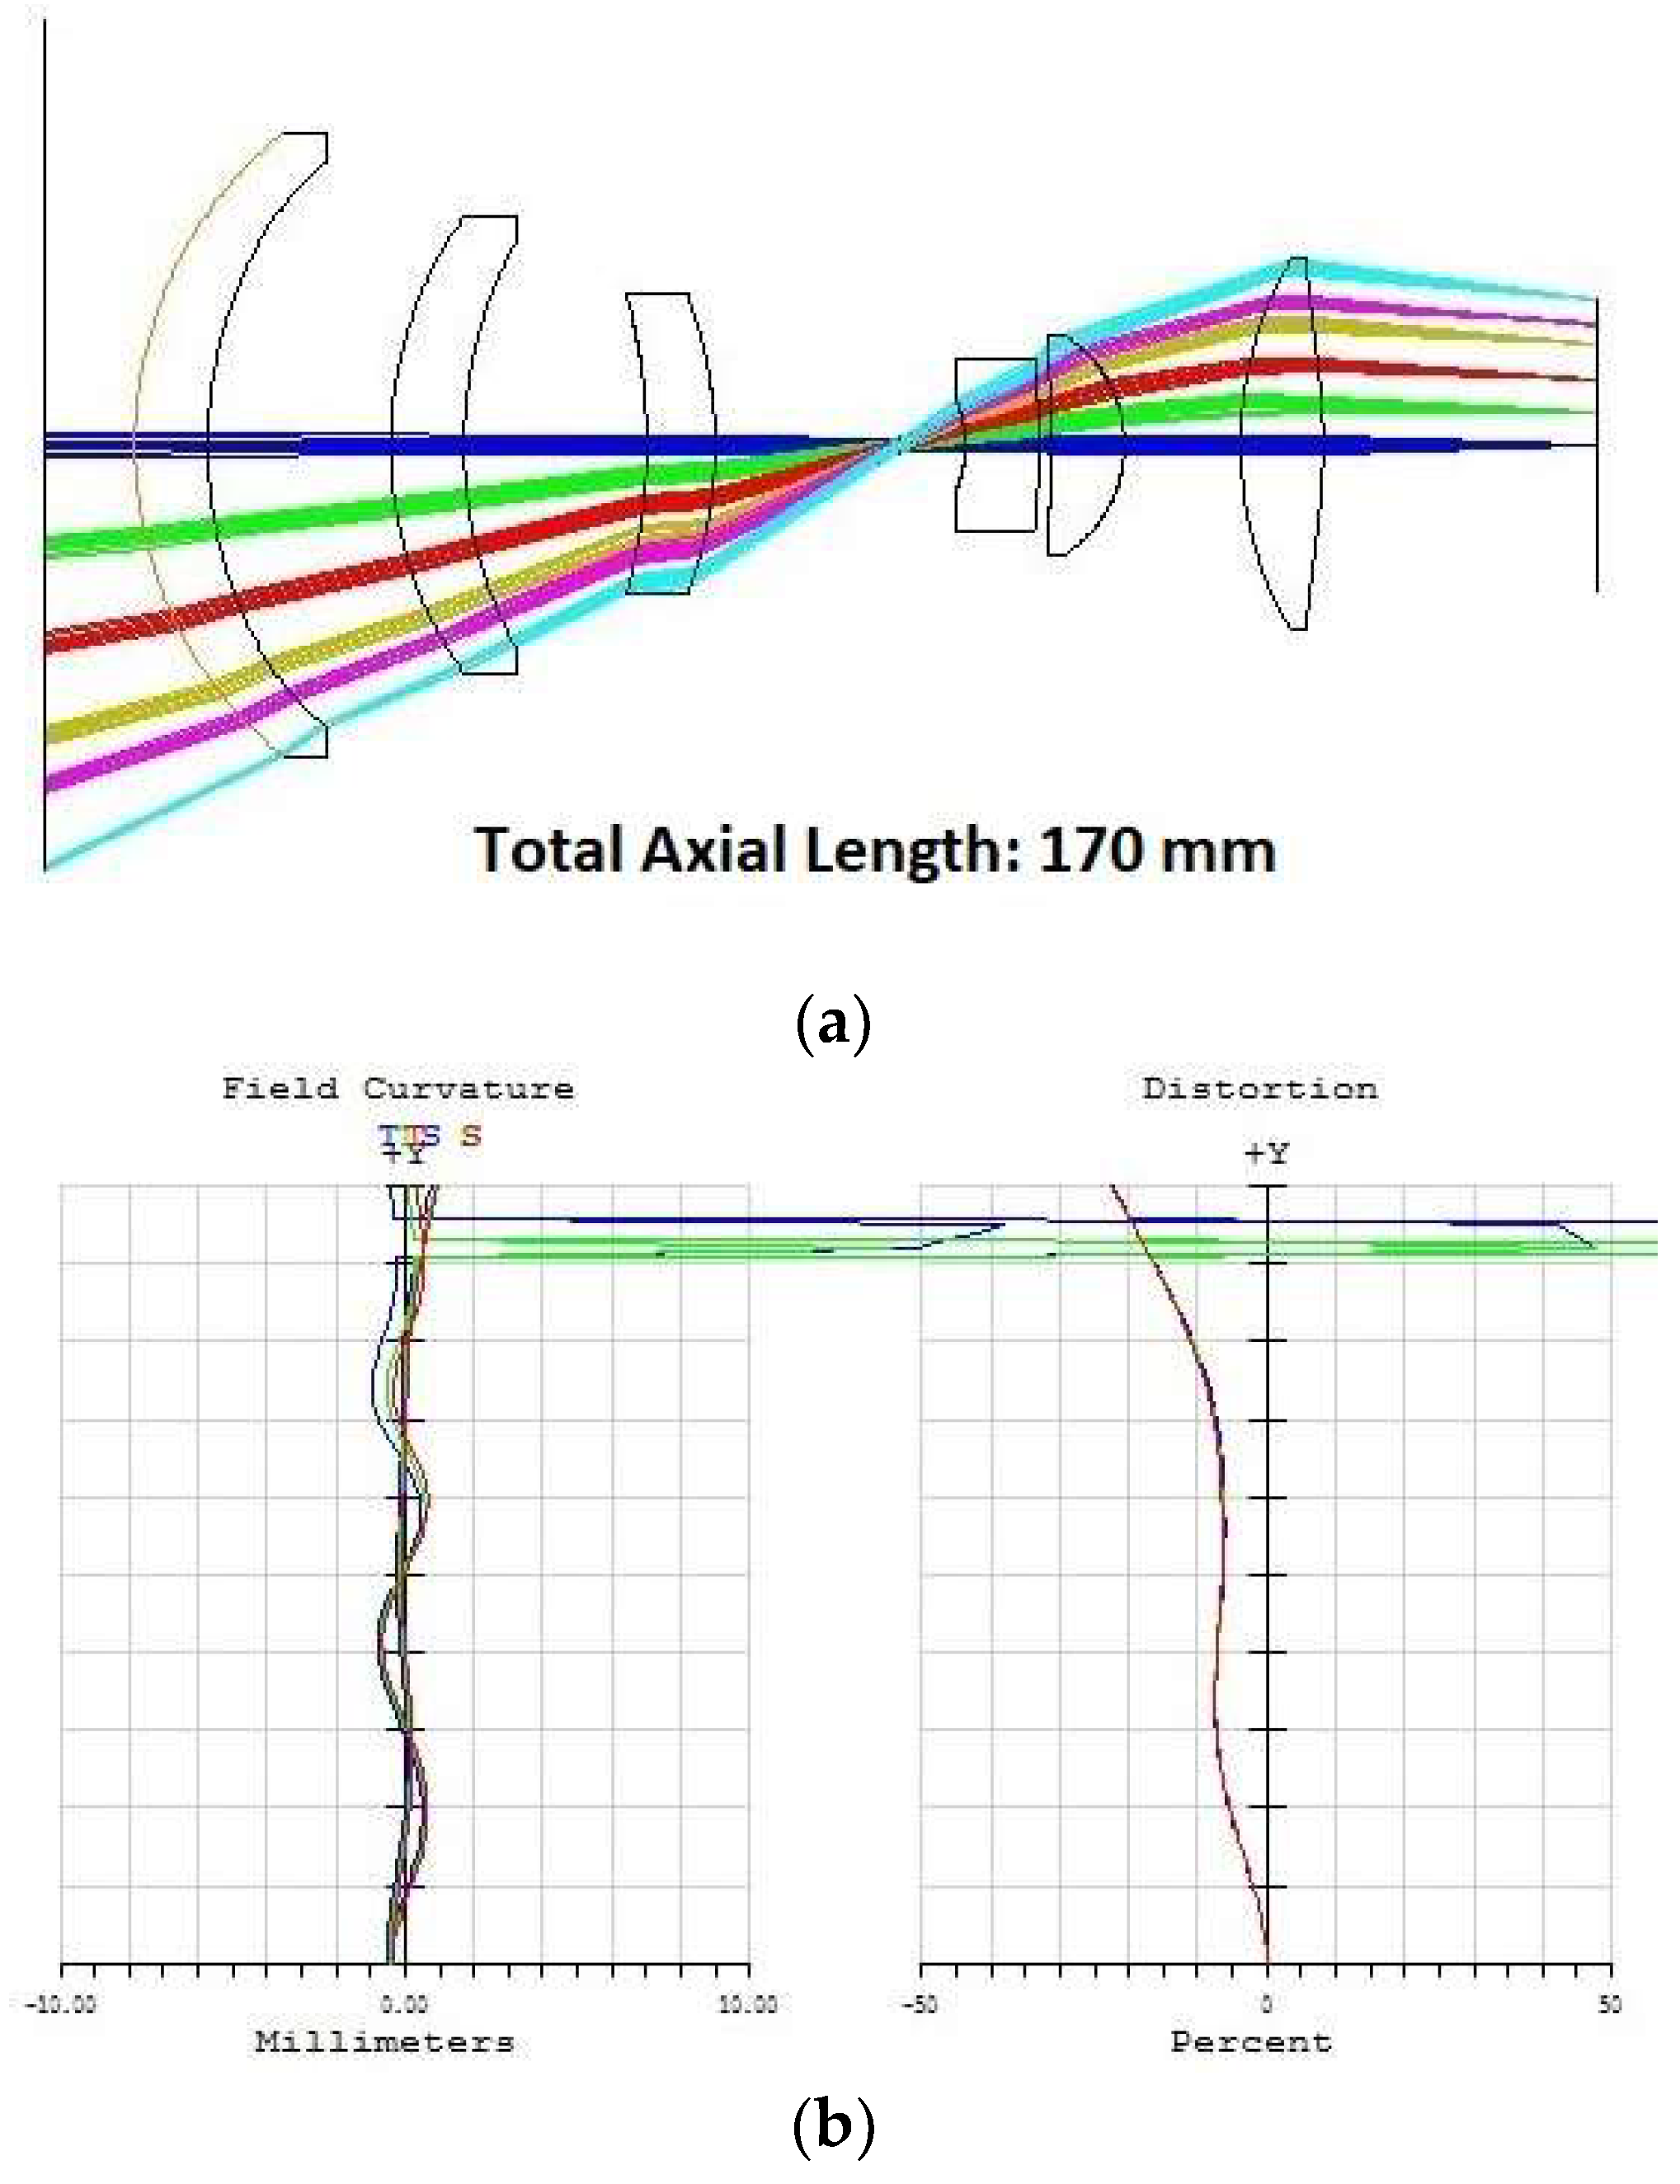
The macro developed for use with the raptor eye projection was iterative on several levels. The main portion of the macro runs five times, and the nested portion inside of that runs 20 times. For each iteration of the nested portion of the code, a piecewise polynomial is used to determine the target distortion for each of 18 field coordinates at three wavelengths each. The target distortion is weighted by the remaining number of iterations and the difference between the current distortion at that field coordinate and wavelength and the desired coordinate. Once the distortion and field curvature targets are updated a damped least squares optimization is run, followed by a hammer optimization. This is repeated 20 times to converge upon the target distortion curve. Subsequently, the main for-loop is invoked and the distortion curve is scaled up by a set amount while the same shape is maintained. It was found that this method converged more readily on a solution with the intermediate “low spot” in the distortion curve. Immediately setting the targets at the full-scale distortion would result in a flat curve in that region. This macro simultaneously defines edge and center thickness parameters, as well as first order parameters such as effective focal length. Figure 8 shows a result of the optimization procedure with the corresponding distortion plot.
3.3. Issues Related to Optical Approach to Foveated Imaging
Large nonlinearities in the distortion plots represent large changes in the information content in regions of an image. Whereas distortion is an acceptable quality in foveating lens systems, other aberrations are undesirable and affect image quality. It is difficult to induce large nonlinearities in the distortion profile without introducing other undesirable aberrations such as coma or astigmatism.
In general, the foveation induces spatially constant blur throughout the area outside the foveal zone. The blurring of an image is the result of the convolution of the point spread function of the optical system with the object-space input. The transition region between the central region of the simulated image and the area outside the foveal zone has nonuniform blur. Correcting the spatially variant blur induced by the foveating optic is critical. Two types of blur occur: one due to aberration (such as lack of focus), and the second due to motion and time variation. Deblurring approaches often incorporate iterative methods with a variety of different techniques to more quickly converge on an acceptable solution. It must be said, however, that the final solution of these algorithms can never be as clear as the original uncorrupted image [33]. Balancing the amount of acceptable image blur within particular regions of the FOV and the magnification of the foveated region is a design tradeoff. Solutions have been suggested for solving image blur due to object or camera motion using an underexposed image and an image with the desired exposure time. The underexposed image has excessive amounts of noise but is not corrupted by the blur from motion. The data contained within this image are then used to help solve the deblurring problem in the image with the correct exposure time [34].
4. Electronic Approach to Foveated Imaging
The purely optical approach to foveating has several drawbacks including static location of fixation points in the field of view of the imaging system, inability to dynamically adjust foveation parameters, and complexity of the optical system.
Electronic foveation involves downsampling an input image using software on the backend of a traditional image capture system or even as a means to further augment the optical systems outlined in Section 3. This eliminates many of the drawbacks of the optical approach with the downside of increased processing complexity in the front end of the processing system. This could be mitigated with dedicated hardware for the foveating preprocessing system. Furthermore, electronic foveation allows for arbitrary arrangement of receptive fields in the downsampling step [35,36], which is somewhat similar to the processing in the raptor’s brain.
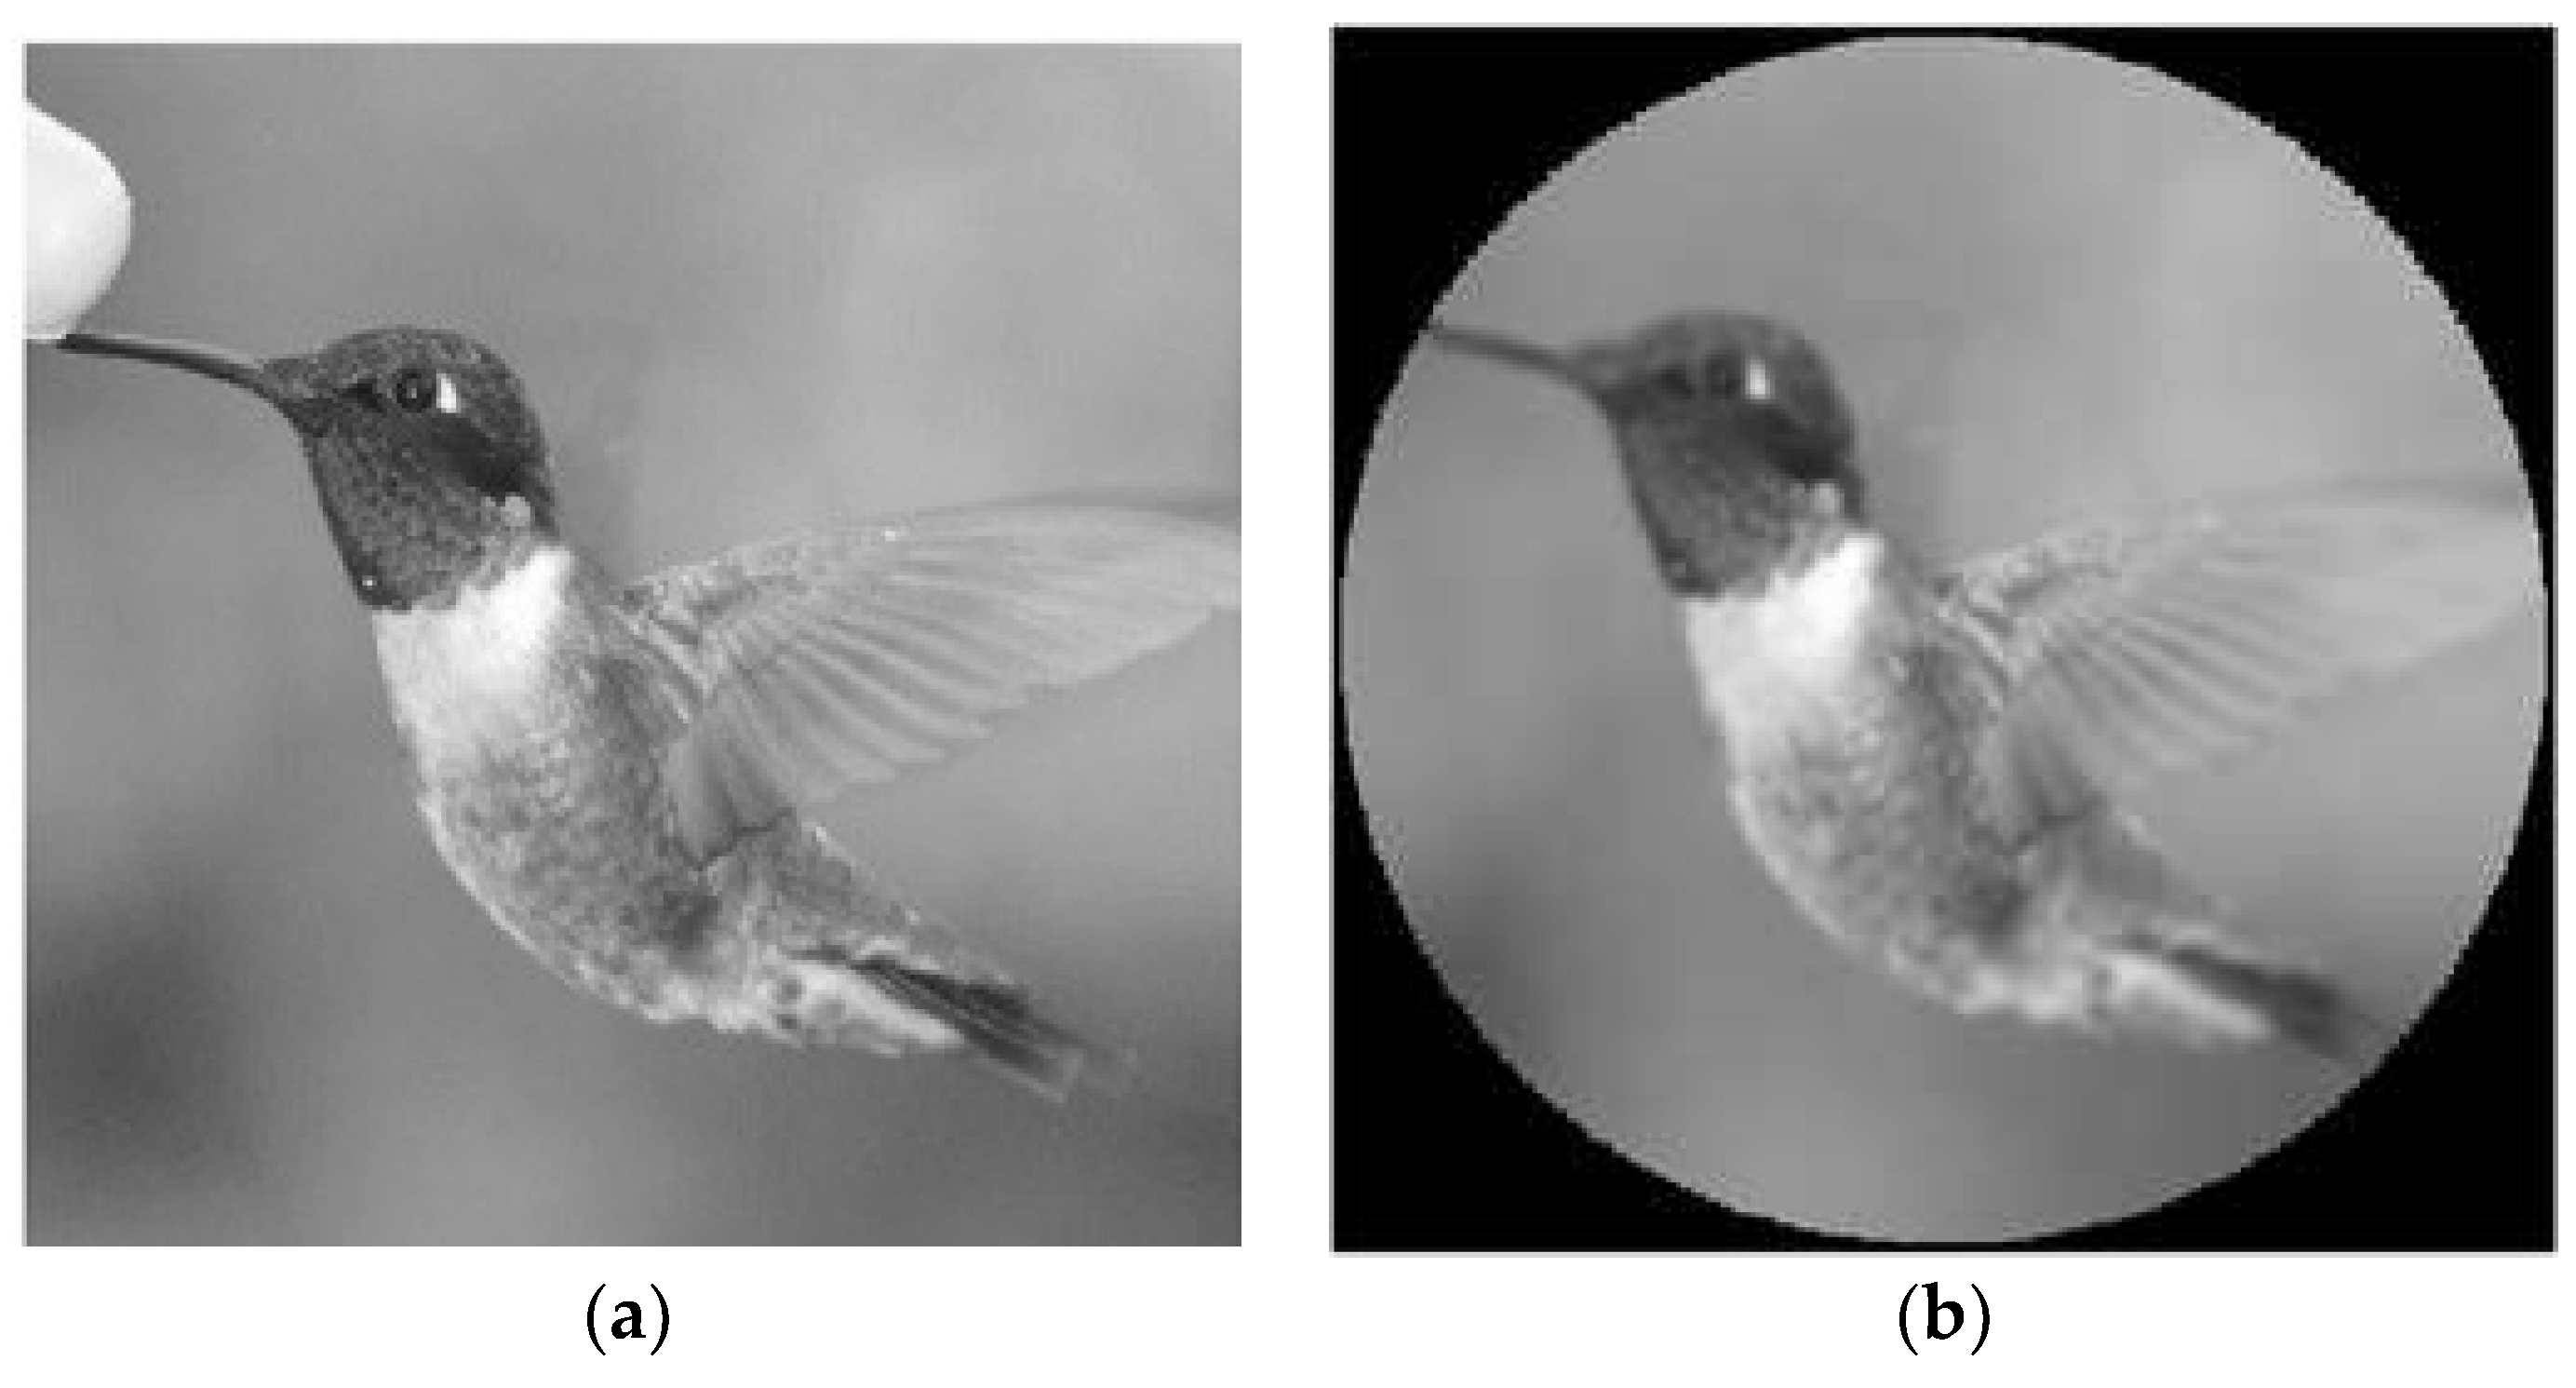
Electronic foveation is discussed in the following sub-sections covering the problem of scale, receptive field layout, and our approach to downsampling. Figure 9 illustrates the effect of a foveating transform on an input image from the open source Caltech 256 database [37].
4.1. Scale Issues in Foveated Image Processing
Image processing applications seeking to identify targets of interest within a field of view have an intrinsic problem of scale [38,39,40]. Scale in this context refers to the size of the object as recorded by the image acquisition system. With no a priori information regarding expected scale of the objects of interest, all scales must be searched for independently [39]. Recent approaches to this problem involve the generation of a scale space, whereby an input image is decomposed into multiple levels of scale each of which is searched for constant sized objects of interest. For efficiency, this is typically done using a cascade approach with Gaussian or Haar filters.
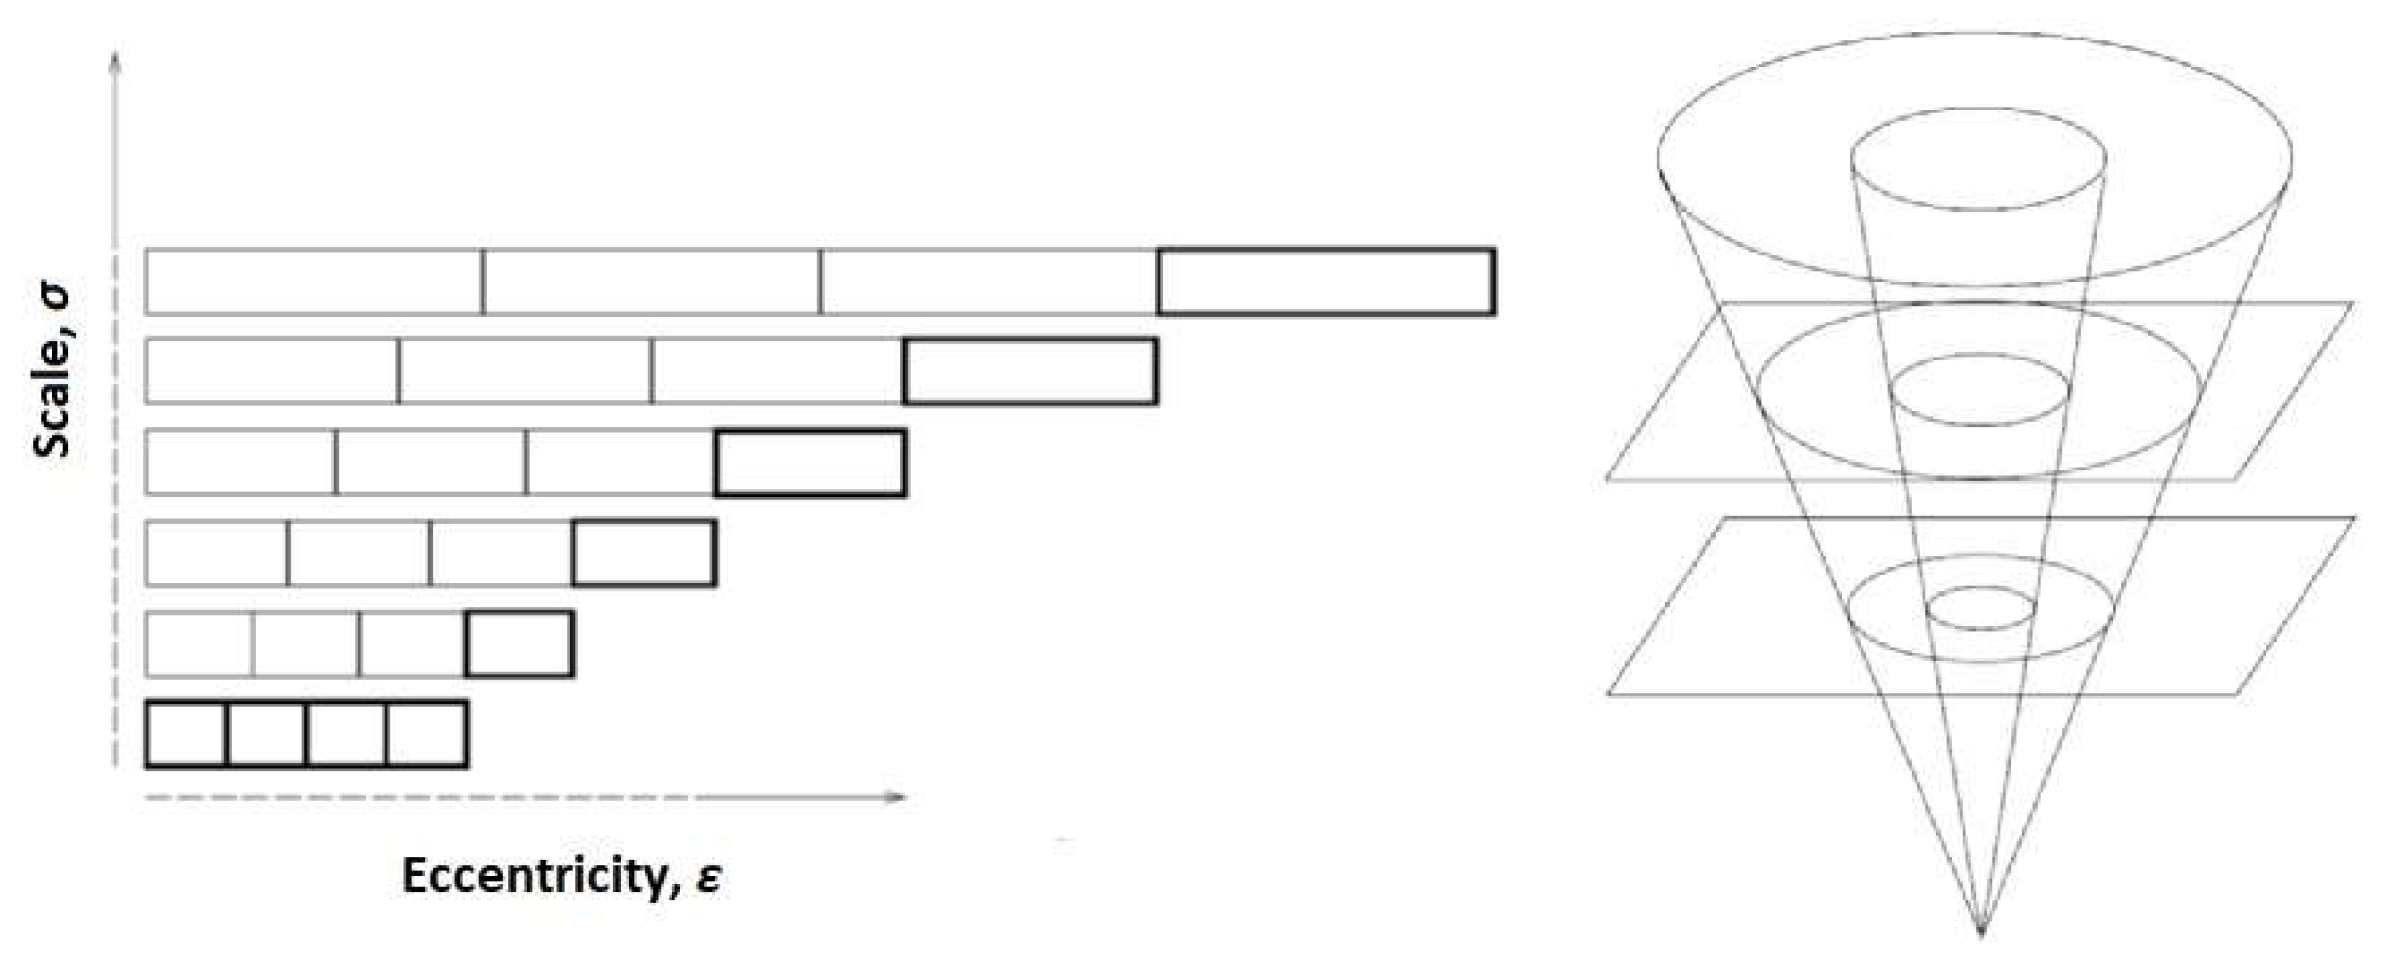
Foveated approaches differ from space invariant approaches in that the spatial support of each scale in the derived scale space increases with larger scale. Figure 10 illustrates this varying support [41]. The log-polar transform represents the outer shell of a foveal scale space that may then be derived from the log-polar image. The log-polar transform has been used in correlation based approached for object recognition with some success [42]. In receptive field foveation, scale refers to the size of the receptive fields. In traditional imaging applications with space invariant receptive fields (pixels), the native scale correlates to the size of the pixel and relates to real-world object height through the focal length of the imaging system.
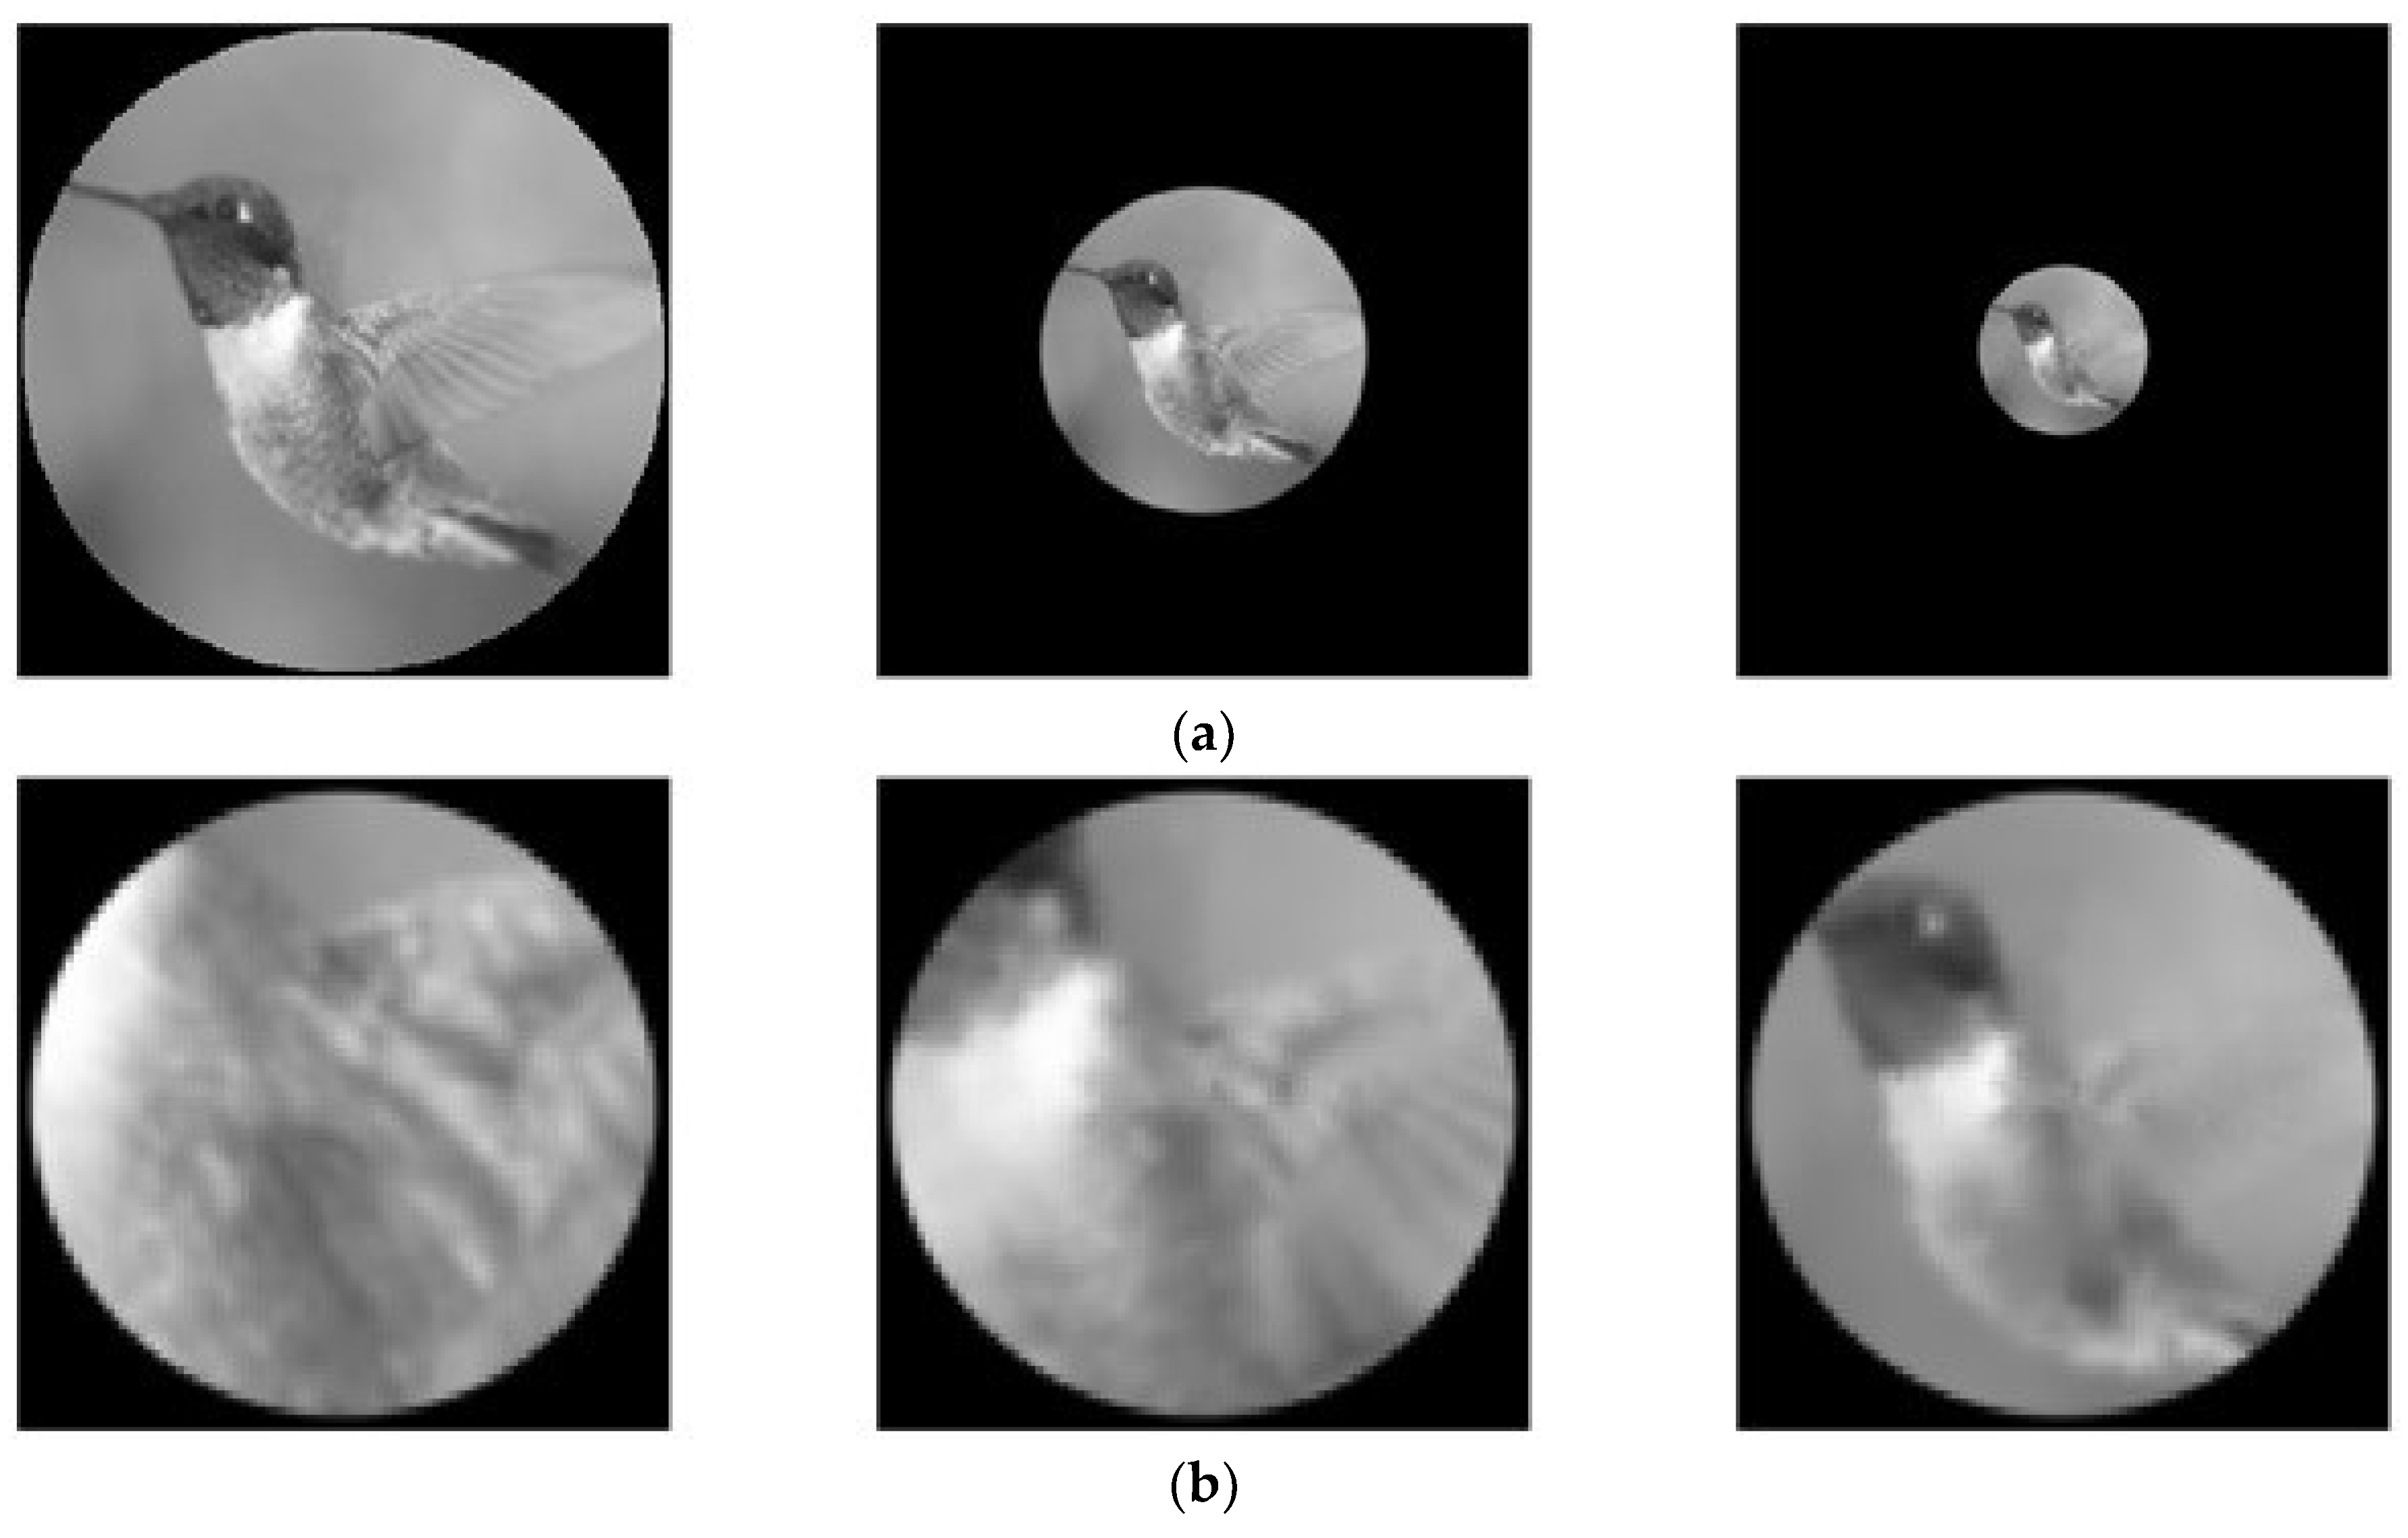
Generating a foveal scale space implicitly prioritizes “near” scales over “far” scales [39,41]. That is, the scale space where one would expect near objects to appear would have larger receptive fields and correspondingly larger support. In this framework, the information lost through the foveal compression is essentially “missing pixels” from the different levels of scale. By generating a foveal scale space, the high priority scale content of a scene is extracted from the raw pixel input. With no a priori information about the scene, the priority of the content is simply inversely proportional to some distance measure from the current fixation point. In a case where a target has already been identified or is currently being tracked, there is a priori information about the scene. In this case, the fixation point can follow the object of interest at any particular scale while nearer scales are still observed and searched with full support. Figure 11 illustrates some scale levels from a foveal scale space derived using the log-polar transform [24].
4.2. Receptive Field Layout
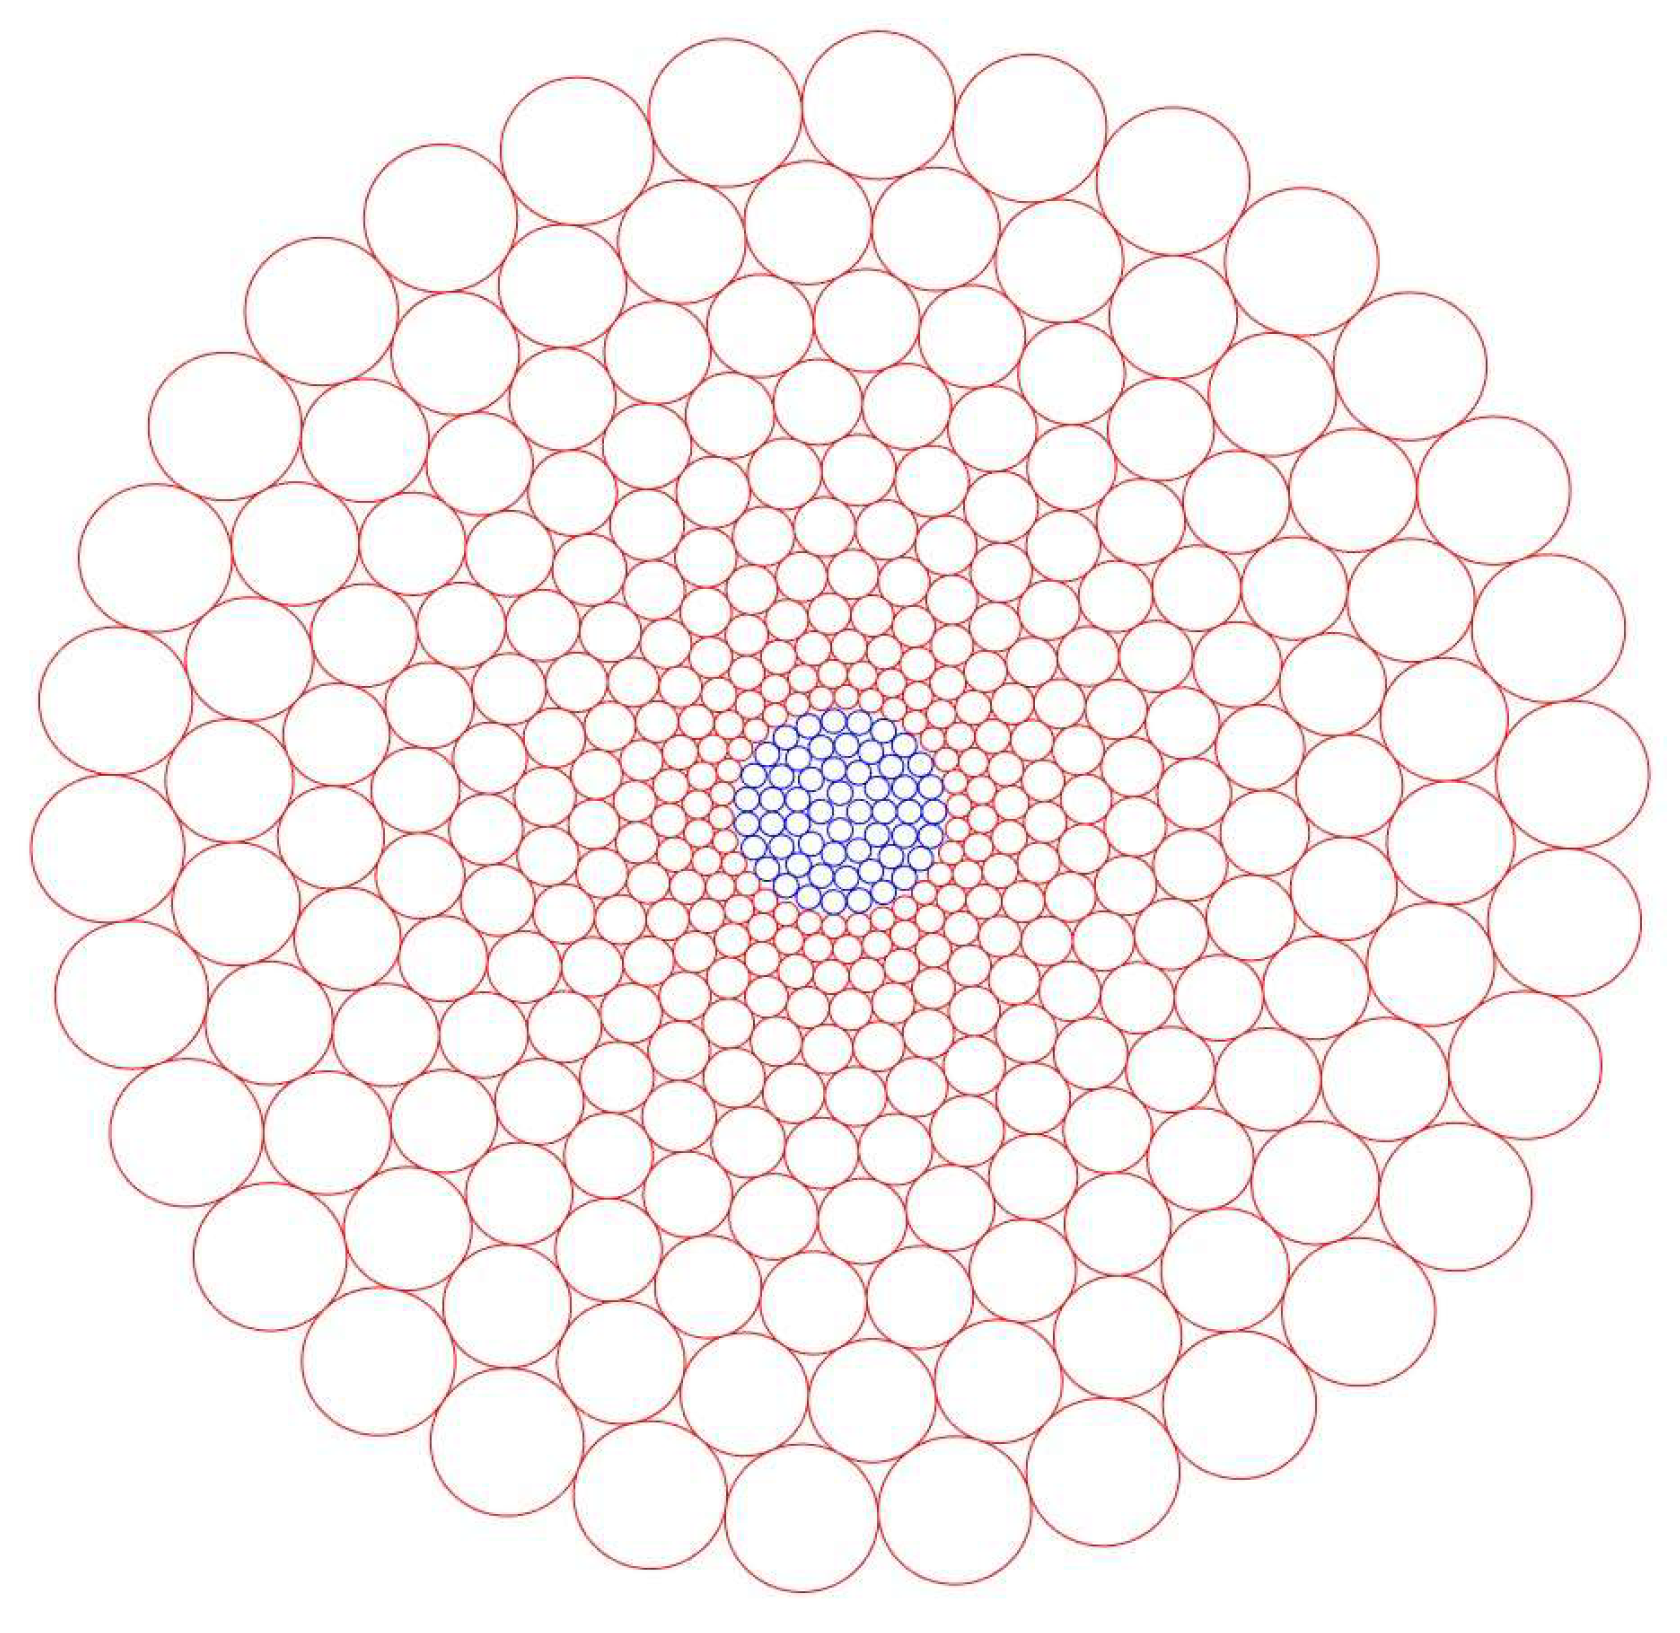
The receptive field model for foveation follows biologically motivated models where the support of cells in the retina have overlapping support with Gaussian profiles. This equates to placing Gaussian mask functions on an image in a desired pattern in order to downsample the image to produce an output with lower dimensionality [43]. Biologically motivated models from human vision follow the log-polar layout where the receptive field density decreases radially and the spatial support of each receptive field increases linearly with eccentricity or distance from the foveal center. This differs from the bi-foveated vision of raptors in that it does not account for multiple foveae in the eye of the raptor. By introducing multiple channels of foveated downsampling, each following a desired high-resolution receptive field, the content from disjointed regions in the image may be maintained. The log-polar transform using Gaussian receptive fields is just one pattern of receptive field layout and is wholly determined by three parameters: number of wedges, minimum receptive field size, and overlap of the receptive fields. Figure 12 illustrates this layout of receptive fields. Alternatively, a Cartesian layout may be used to simplify post transform processing.
In either choice of receptive field layout, it is desirable to generate a scale space where each scale has constant relation between pixels at that scale. This could be done either by first maximally downsampling the input image with the minimum number of Gaussian receptive fields required to generate the desired scale space and then deriving the scale space from that reduced image or by generating each level of the scale space individually from the original input image. Owing to the irregularity of the placement of the receptive fields, the latter option is less suitable for image processing applications due to artifacts in the derived scale space. This is because the centers of the desired Gaussian receptive fields are not aligned throughout the image.
Generating the foveal scale space directly from the input image requires a greater number of operations to be performed on the relatively large number of input pixels, but if done in a parallel fashion in hardware, could still serve to generate a low dimensional scale space suitable for fast sequential operations. Given the input resolution requirements of modern state-of-the-art detectors, the benefits of generating a foveal scale space only become clear when dealing with very high-resolution input images. This is because the sliding window approach to detection requires a ‘scale slice’ to be at least as large and preferably larger than resolution of the detection window.
The direct Cartesian approach to foveated downsampling is appealing due to the output being readily compatible with modern detectors—that is, it is already a Cartesian image. With the log-polar method, it is necessary to interpolate the pixel space in the log-polar scale space domain back onto a Cartesian grid or develop more complex methods for handling irregularly packed pixels.
4.3. Foveated Downsampling
Computational approaches to foveated downsampling must be fast enough to warrant application of foveation as opposed to more traditional convolution approaches to scale space generation. Real-time operation may be implemented in hardware using field programmable gate array (FPGA) technology. The downsampling approach can be considered to be a form of foveated image compression.
Since the foveation operation is linear, a sparse matrix transform may be used where each row of the transformation matrix consists of coefficients pertaining to each individual Gaussian receptive field. This transformation matrix is very sparse but of very large dimensionality. The number of columns in the transformation matrix corresponds to the number of pixels in the input image (typically in the millions), and the number of rows corresponds to the number of receptive fields in the output (typically in the thousands). In the direct Cartesian approach to foveation, the number of receptive fields is simply the number of desired scales times the number of receptive fields in each scale.
The mathematical formulation of this transform is implemented as matrix multiplication where the number of columns in the transformation matrix, , is equal to the number of pixels in the input image and the number of rows in the transform matrix is equal to the sum of the number of the receptive fields (RFs), each corresponding to a pixel in the peripheral and foveal regions of the transformed image. This is shown in Equation (4), where is the input or Cartesian image vector and is the output image vector.
Figure 13 shows the structure of the transform matrix as it relates to the two regions in the output vector, peripheral and foveal respectively. Each Gaussian RF has support across the entire image, but most of these values are very small. To increase the sparsity of the transformation matrix and greatly reduce the required storage size and computation time of the transform, this matrix is implemented using a sparse matrix construction by thresholding the values of each Gaussian RF and setting the coefficients below the desired threshold to zero.
Feature detection requires searching for desired features at each level of scale [34,36].This could be done natively in the transformed domain consisting of peripheral and foveal regions using different sized feature detection masks or it could be done by transforming the image into a series of Cartesian-like images each corresponding to different levels of scale representation as in the standard implementation of scale space feature detection. This paper takes the latter approach and a method was developed to perform diffusion for this layout of RFs (for the current effort, the diffusion will be isotropic, but this approach will enable future exploration of anisotropic diffusion, possibly better suited to specific targets) While a closed form solution for diffusion in the peripheral and foveal regions could be implemented, this implementation of the transform matrix does not incorporate a closed form solution for the locations of the RFs foveal region. Due to the lower dimensionality of the transformed domain, it is desirable to perform the diffusion operation natively in that domain. Equation (5) shows the desired operation where a foveal image is derived from a base foveal image by iterative multiplication of some diffusion matrix, and where is the derived foveal image, is the base foveal image, is the diffusion matrix, and is the number of multiplications:
To derive one level of scale from another in the foveal domain, a diffusion matrix is defined by computing the inner product between two transform matrices, each at different levels of scale, or minimum RF size. This approximates inverting the first operation with the transpose of the transformation matrix and applying the second transformation matrix. The inner product computes the overlap of each of the second transformation matrix’s RFs with each RF of the first transformation matrix. The resultant diffusion matrix is square and maps a log polar domain image into another log polar domain image of equal size. Equation (6) shows the method of computation of this diffusion matrix, where and are the first and second transform matrices, respectively. The difference between and , which themselves are the minimum RF sizes for each transformation matrix, defines the size of the step through scale space that will realize. The operation ‘rownorm {·}’ forces the rows of the step matrix to have elements which sum to 1.
Figure 14 shows the sparsity of the diffusion matrix. Blue values in this figure correspond to nonzero entries in the diffusion matrix, and white values are areas containing 0 valued elements. This matrix is square and has a large number of elements, but the sparse nature of the matrix allows for rapid implementation of the matrix multiplication. Extraction of the foveal region of each log polar scale space image is done by applying the inverse of only the foveal section of the log polar transformation matrix. The foveal region of the transformation matrix is roughly orthogonal and the inverse is approximated as the transpose of the foveal section of the transformation matrix. This is done after each diffusion operation and results in a number of slices of the scale space representation of the original Cartesian image where the support of each slice is limited by the support of the foveal region corresponding to the slice in the log polar domain. The result is a number of slices each with an equal number of pixels and each with increasing spatial support which is related to resolution.
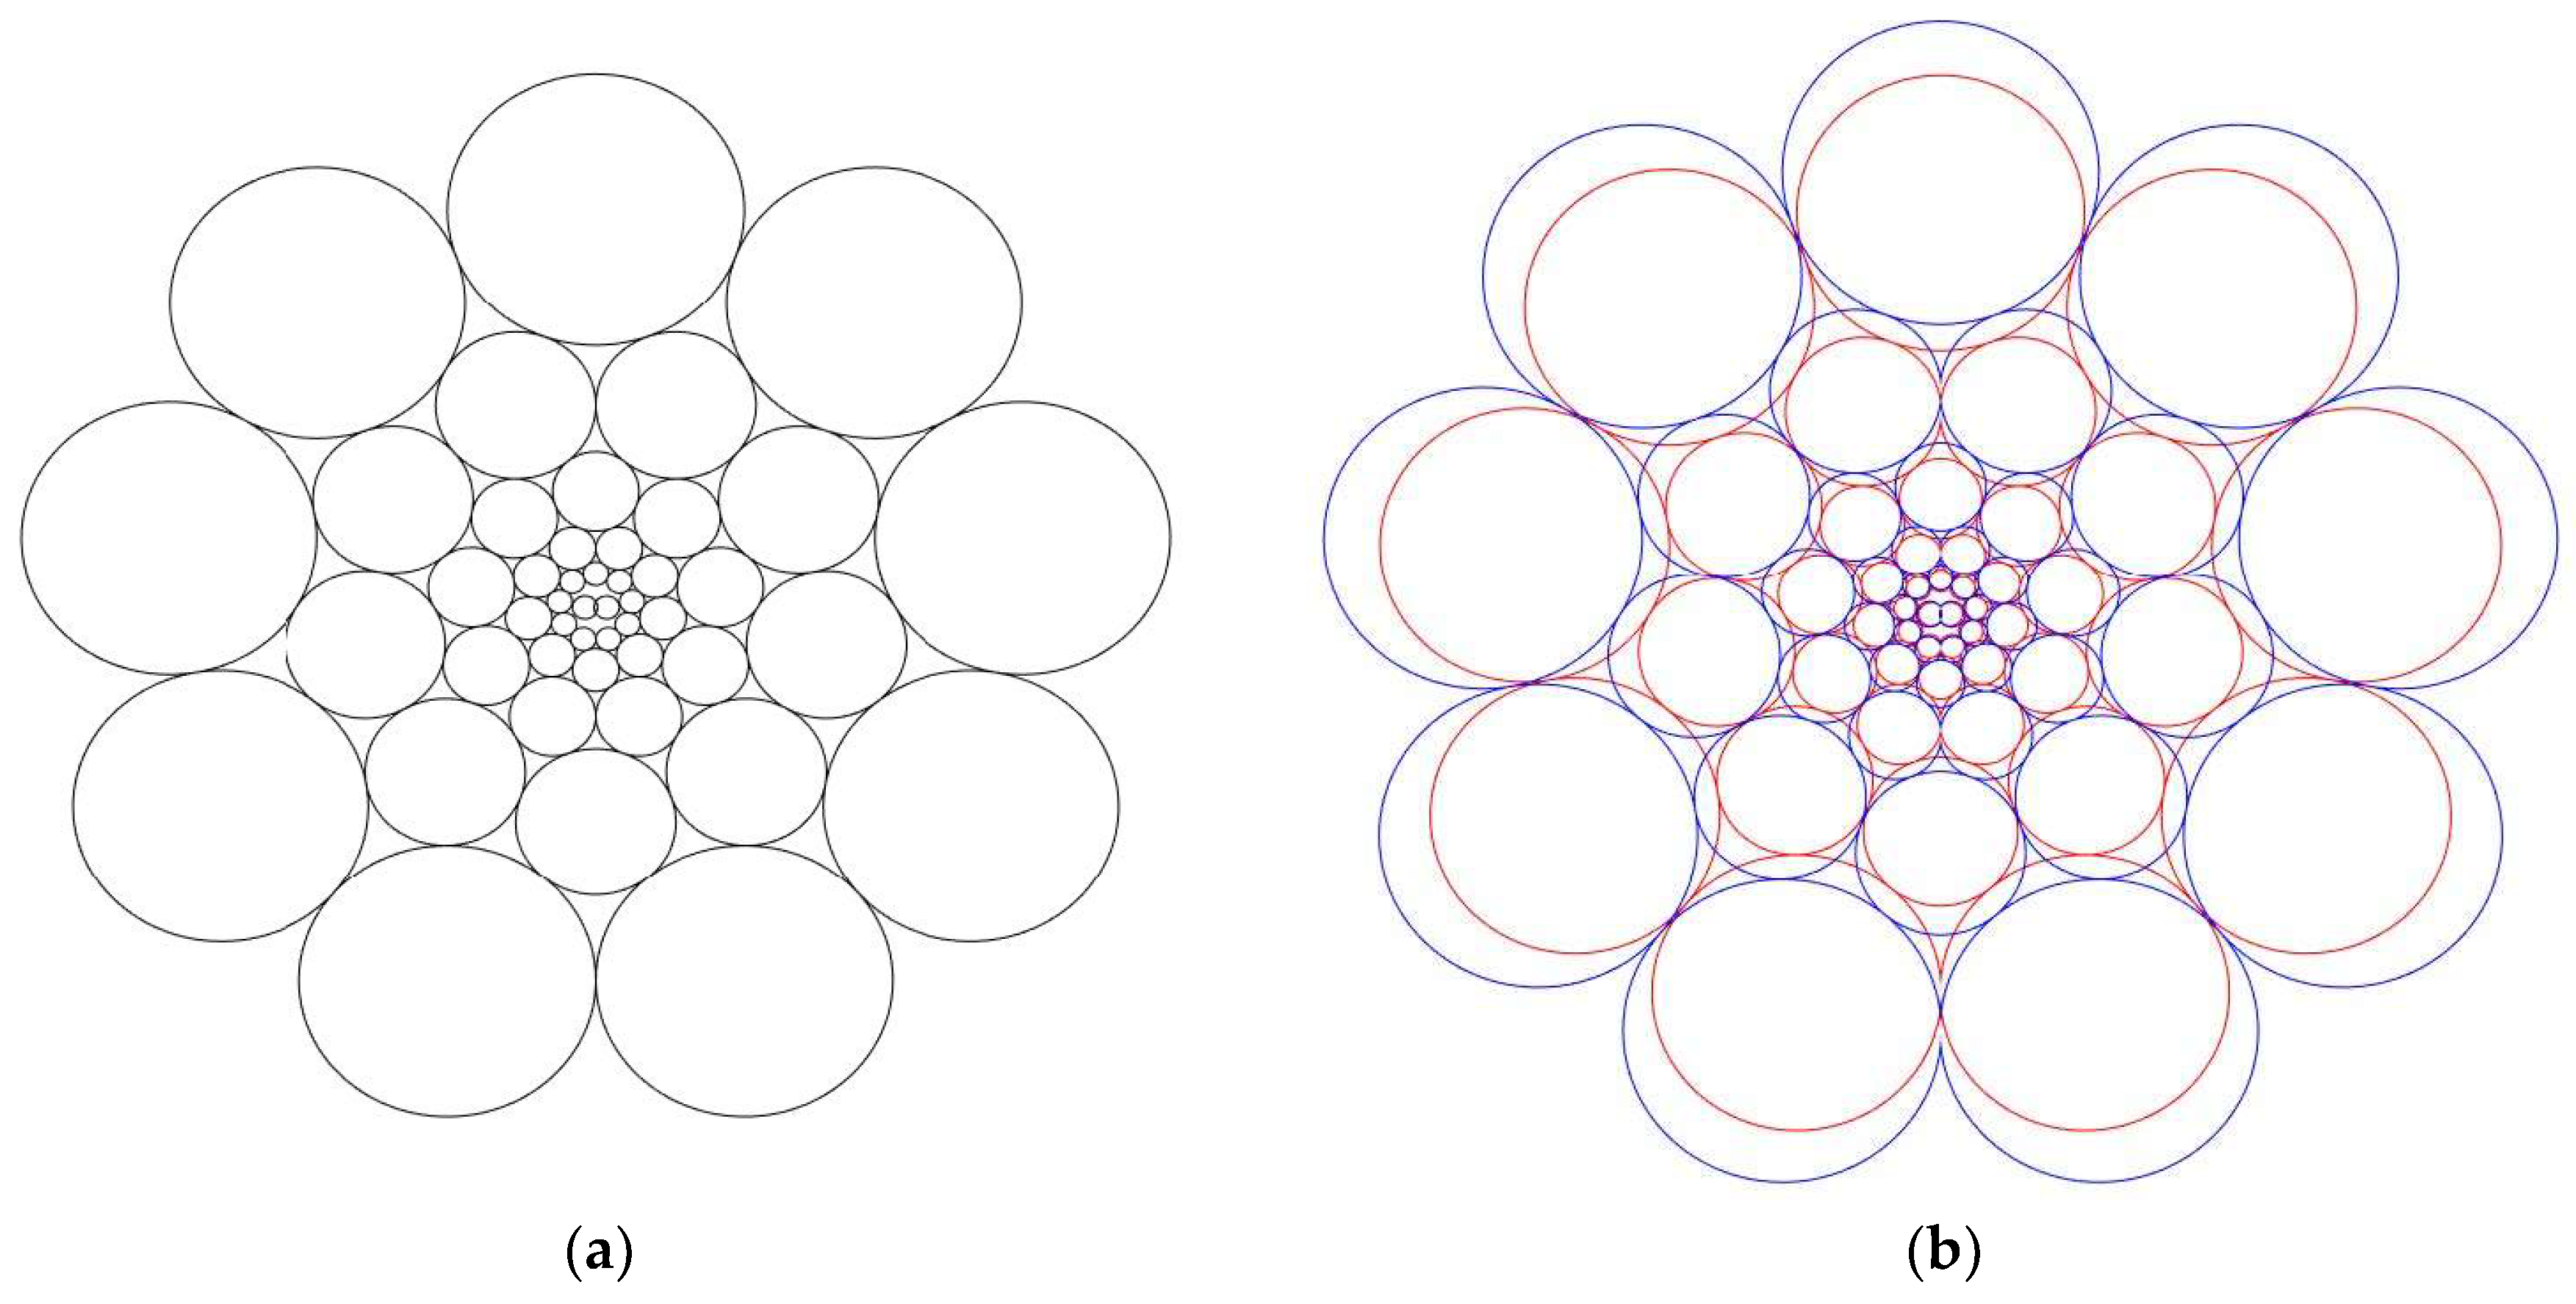
The fact that the second transformation matrix maps the image into a lower scale representation relative to the first transformation matrix means that the diameter of the foveal region in the lower scale log polar image is larger than the diameter of the foveal region in the first log polar image. The nature of the computation of the centers of each RF in the foveal region means that each region contains the same number of RFs. Accordingly, there is an implicit shift within the log polar domain and zeros are introduced along the outer border of the periphery shrinking the support of the log polar representation with each subsequent diffusion operation. Figure 15 illustrates the overlap between two transformations with different minimum RF sizes. Figure 15a shows the layout of RFs with some minimum RF size and number of wedges. These values were chosen to make the concept easier to visualize and in practice the number of wedges in the transform would be much larger. Figure 15b shows two overlapping transforms. The circles corresponding to each RF are colored differently for each transform to help contrast the two separate RF layouts. The only difference between these two transformations is that the minimum RF size for the transformation corresponding to the blue transform is slightly larger than the minimum RF size for the other transform. This is necessary to achieve the additional benefit of scaling or shrinking the image with each application of the diffusion matrix, which in turn is necessary to increase the support of the foveal region pixels upon each application of the diffusion matrix.
Computation of the transformation matrices takes time but must only be done once in a case where the foveation parameters are fixed (another reason this approach was considered). The matrix can then be applied to the image in time which is typically on the order of a few milliseconds. Steering of the fixation point can then be done by translating the input image prior to application of the transformation matrix. The vector output by the transformation operation must then be reshaped into a three-dimensional scale space corresponding to the parameters of the transformation. The result is a number of equal size scale space slices that may then be operated on to search for the desired objects of interest.
4.4. Issues Related to Electronic Approach to Foveated Imaging
Electronic foveated imaging has potential for use in practical applications, particularly where a large depth of scale is required and scenes have fixed geometry. For example, in automotive pedestrian detection it is necessary to identify “large” scale pedestrians near the vehicle as well as “small” scale pedestrians at a distance but close to the road. If using a common imaging sensor with a regular grid of pixels and setting the pixel pitch to match the necessary sampling for detection of the most distant pedestrian of interest, there will be many pixels residing in regions of the image where such high-resolution information is unnecessary. This is an example application where electronic foveation could be extremely useful as a preprocessing method to reduce the bit rate of information streaming from a video capture system that would otherwise be too large to process in real time sequentially.
Hurdles in applying electronic foveation to video streams include developing hardware capable of performing the transform in real time to high-resolution video streams. Once that is achieved, the foveation parameters may be tuned to ensure that the resultant bit rate is compatible with the back end sequential processing capabilities of the embedded system
5. Conclusions
Foveation in image processing is a promising field of research. Loosening the restrictions of a space invariant system means that resolution parameters can be optimized based on processing capabilities and goals without total loss of vision capabilities. Foveating only in the optical front end is challenging due to the cost and complexity of hardware as well as design issues related to image quality. Electronic foveation seems like a promising complimentary method capable of reducing bit rate while maintaining a usable depth of scale. Foveation parameters should be optimized based on the application of interest. Using such an adaptable foveation approach (as opposed to a fixed dual foveation system like a raptor eye), a system with optimal parameters would dynamically change foveation parameters while tracking an object of interest to minimize excess information in the post-foveation bit stream.
A relevant application of the raptor eye characteristics is the concept of foveated vision to allow efficient multi-scale processing of a large scene, and the ability to perform target detection and tracking within a polar coordinate frame. Such a concept could be integrated into and enhance the accuracy of real time stereo-vision pedestrian detection algorithms [44].
Recently, a hybrid bionic image sensor (HBIS) was developed in which features of planar and curved artificial compound eyes as well as foveated vision are integrated to achieve FOV extension, super resolution of ROI, and a large foveal ratio [45]. In addition, Risley prisms having accurate and fast beam were employed to imitate the movement of the fovea and generate sub-pixel shifts of sub-images for super-resolution reconstruction.
This paper has addressed important aspects related to foveated imaging from the perspectives of optics and electronics. While each approach has its own advantages and disadvantages, it is believed that a combination of both techniques will further spur the development of more versatile and flexible foveated imaging systems in the future.
Author Contributions
R.M.N. and T.J.K. conceived the concept, developed the approach, and performed the simulations; T.F.R. and M.J.T. provided logistical support and assisted with data analysis; all authors participated in data interpretation; R.M.N. wrote the first draft of the paper, and the other authors contributed to its final form.
Funding
This work was supported by the US Army Armament Research, Development and Engineering Center (ARDEC) Joint Service Small Arms Program (JSSAP) through Contract Number N00024-12-D-6404 (Delivery Order 0275). DISTRIBUTION STATEMENT A applies: Approved for Public Release. Distribution is Unlimited.
Acknowledgments
We appreciate the assistance of Aaron Long in writing the computer programs and assisting with the data analysis.
Conflicts of Interest
The authors declare no conflict of interest. The funding sponsors had no role in the design of the study; in the collection, analyses, or interpretation of data; in the writing of the manuscript, and in the decision to publish the results.
References
- Locket, N.A. Problems of deep foveas. Aust. N. Z. J. Ophthalmol. 1992, 20, 281–295. [Google Scholar] [CrossRef] [PubMed] [Green Version]
- Snyder, A.W.; Miller, W.H. Telephoto lens system of falconiform eyes. Nature 1978, 275, 127–129. [Google Scholar] [CrossRef] [PubMed]
- Reymond, L. Spatial visual-acuity of the eagle Aquila-Audax: A behavioral, optical and anatomical investigation. Vis. Res. 1985, 25, 1477–1491. [Google Scholar] [CrossRef]
- Klemas, V.V. Remote sensing and navigation in the animal world: An overview. Sens. Rev. 2013, 33, 3–13. [Google Scholar] [CrossRef]
- Murphy, C.J.; Howland, H.C. Owl eyes: Accommodation, corneal curvature and refractive state. J. Comp. Physiol. 1983, 151, 277–284. [Google Scholar] [CrossRef]
- Melnyk, P.B.; Messner, R.A. Biologically motivated composite image sensor for deep-field target tracking. In Proceedings of the SPIE Conference on Vision Geometry XV, San Jose, CA, USA, 28 January–1 February 2007; pp. 649905-1–649905-8. [Google Scholar]
- Curatu, G.; Harvey, J.E. Lens design and system optimization for foveated imaging. In Proceedings of the SPIE Conference on Current Developments in Lens Design and Optical Engineering IX, San Diego, CA, USA, 10–14 August 2008; pp. 70600P-1–70600P-9. [Google Scholar]
- Du, X.; Chang, J.; Zhang, Y.; Wang, X.; Zhang, B.; Gao, L.; Xiao, L. Design of a dynamic dual-foveated imaging system. Opt. Express 2015, 23, 26032–26040. [Google Scholar] [CrossRef] [PubMed]
- McCarley, P.L.; Massie, M.A.; Curzan, J.P. Large format variable spatial acuity superpixel imaging: Visible and infrared systems applications. In Proceedings of the SPIE Conference on Infrared Technology and Applications XXX, Orlando, FL, USA, 12–16 April 2004; pp. 361–369. [Google Scholar]
- McCarley, P.L.; Massie, M.A.; Curzan, J.P. Foveating infrared image sensors. In Proceedings of the SPIE Conference on Infrared Systems and Photoelectronic Technology II, San Diego, CA, USA, 26–30 August 2007; pp. 666002-1–666002-14. [Google Scholar]
- Bryant, K.R. Foveated optics. In Proceedings of the SPIE Conference on Advanced Optics for Defense Applications: UV through LWIR, Baltimore, MD, USA, 17–19 April 2016; pp. 982216-1–982216-11. [Google Scholar]
- Thibault, S. Enhanced surveillance system based on panomorph panoramic lenses. In Proceedings of the SPIE Conference on Optics and Photonics in Global Homeland Security III, Orlando, FL, USA, 9–13 April 2007; pp. 65400E-1–65400E-8. [Google Scholar]
- Ҫöltekin, A.; Haggrén, H. Stereo foveation. Photogramm. J. Finl. 2006, 20, 45–53. [Google Scholar]
- Schindler, K. Geometry and construction of straight lines in log-polar images. Comput. Vis. Image Underst. 2006, 103, 196–207. [Google Scholar] [CrossRef] [Green Version]
- Tabernero, A.; Portilla, J.; Navarro, R. Duality of log-polar image representations in the space and spatial-frequency domains. IEEE Trans. Signal Process. 1999, 47, 2469–2479. [Google Scholar] [CrossRef] [Green Version]
- Wang, Z.; Lu, L.; Bovik, A.C. Foveation scalable video coding with automatic fixation selection. IEEE Trans. Image Process. 2003, 12, 243–254. [Google Scholar] [CrossRef] [PubMed] [Green Version]
- Itti, L. Automatic foveation for video compression using a neurobiological model of visual attention. IEEE Trans. Image Process. 2004, 13, 1304–1318. [Google Scholar] [CrossRef] [PubMed]
- Hua, H.; Liu, S. Dual-sensor foveated imaging system. Appl. Opt. 2008, 47, 317–327. [Google Scholar] [CrossRef] [PubMed]
- Belay, G.Y.; Ottevaere, H.; Meuret, Y.; Vervaeke, M.; Van Erps, J.; Thienpont, H. Demonstration of a multichannel, multiresolution imaging system. Appl. Opt. 2013, 52, 6081–6089. [Google Scholar] [CrossRef] [PubMed]
- Carles, G.; Muyo, G.; Bustin, N.; Wood, A.; Harvey, A.R. Compact multi-aperture imaging with high angular resolution. J. Opt. Soc. Am. A 2015, 32, 411–419. [Google Scholar] [CrossRef] [PubMed]
- Carles, G.; Chen, S.; Bustin, N.; Downing, J.; McCall, D.; Wood, A.; Harvey, A.R. Multi-aperture foveated imaging. Opt. Lett. 2016, 41, 1869–1872. [Google Scholar] [CrossRef] [PubMed]
- Carles, G.; Babington, J.; Wood, A.; Ralph, J.F.; Harvey, A.R. Superimposed multi-resolution imaging. Opt. Express 2017, 25, 33043–33055. [Google Scholar] [CrossRef]
- Long, A.D.; Narayanan, R.M.; Kane, T.J.; Rice, T.F.; Tauber, M.J. Analysis and implementation of the foveated vision of the raptor eye. In Proceedings of the SPIE Conference on Image Sensing Technologies: Materials, Devices, Systems, and Applications III, Baltimore, MD, USA, 20–21 April 2016; pp. 98540T-1–98540T-9. [Google Scholar]
- Long, A.D.; Narayanan, R.M.; Kane, T.J.; Rice, T.F.; Tauber, M.J. Foveal scale space generation with the log-polar transform. In Proceedings of the SPIE Conference on Image Sensing Technologies: Materials, Devices, Systems, and Applications IV, Anaheim, CA, USA, 12–13 April 2017; pp. 1020910-1–1020910-8. [Google Scholar]
- Walls, G.L. Significance of the foveal depression. Arch. Ophthalmol. 1937, 18, 912–919. [Google Scholar] [CrossRef]
- Waldvogel, J.A. The bird’s eye view. Am. Sci. 1990, 78, 342–353. [Google Scholar]
- Tucker, V. The deep fovea, sideways vision and spiral flight paths in raptors. J. Exp. Biol. 2000, 203, 3745–3754. [Google Scholar] [PubMed]
- Traver, V.J.; Bernardino, A. A review of log-polar imaging for visual perception in robotics. Rob. Auton. Syst. 2010, 58, 378–398. [Google Scholar] [CrossRef]
- Kingslake, R.; Johnson, R.B. Lens Design Fundamentals; Academic Press: Burlington, MA, USA, 2010; pp. 501–512. [Google Scholar]
- Samy, A.M.; Gao, Z. Fovea-stereographic: A projection function for ultra-wide-angle cameras. Opt. Eng. 2015, 54, 045104-1–045104-8. [Google Scholar] [CrossRef]
- Shimizu, S.; Hashizume, T. Development of micro wide angle fovea lens–Lens design and production of prototype. IEEJ J. Ind. Appl. 2013, 2, 55–60. [Google Scholar]
- Shimizu, S.; Tanzawa, Y.; Hashizume, T. Development of wide angle fovea telescope. IEEJ J. Ind. Appl. 2014, 3, 368–373. [Google Scholar]
- Nagy, J.G.; O’Leary, D.P. Restoring images degraded by spatially variant blur. SIAM J. Sci. Comput. 1988, 19, 1063–1082. [Google Scholar] [CrossRef]
- Šorel, M.; Šroubek, F. Space-variant deblurring using one blurred and one underexposed image. In Proceedings of the 16th IEEE International Conference on Image Processing (ICIP’09), Cairo, Egypt, 7–10 November 2009; pp. 157–160. [Google Scholar]
- Araujo, H.; Dias, J.M. An introduction to the log-polar mapping. In Proceedings of the 2nd IEEE Workshop on Cybernetic Vision, Sao Carlos, Brazil, 9–11 December 1996; pp. 139–144. [Google Scholar]
- Bolduc, M.; Levine, M.D. A review of biologically motivated space-variant data reduction models for robotic vision. Comput. Vis. Image Underst. 1998, 69, 170–184. [Google Scholar] [CrossRef]
- Griffin, G.; Holub, A.; Perona, P. Caltech-256 Object Category Dataset; California Institute of Technology Technical Report 7694; California Institute of Technology: Pasadena, CA, USA, 2007. [Google Scholar]
- Koenderink, J.J. The structure of images. Biol. Cybern. 1984, 50, 363–370. [Google Scholar] [CrossRef] [PubMed]
- Lindeberg, T. Scale-space theory: A basic tool for analyzing structures at different scales. J. Appl. Stat. 1994, 21, 225–270. [Google Scholar] [CrossRef]
- Witkin, A. Scale-space filtering: A new approach to multi-scale description. In Proceedings of the IEEE International Conference on Acoustics, Speech, and Signal Processing (ICASSP’84), San Diego, CA, USA, 19–21 March 1984; Volume 9, pp. 150–153. [Google Scholar]
- Lindeberg, T.; Florack, L. Foveal Scale-Space and the Linear Increase of Receptive Field Size as a Function of Eccentricity; KTH Royal Institute of Technology Technical Report ISRN KTH NA/P-94/27-SE; KTH Royal Institute of Technology: Stockholm, Sweden, 1994. [Google Scholar]
- Matungka, R.; Zheng, Y.F.; Ewing, R.L. 2D invariant object recognition using log-polar transform. In Proceedings of the 7th World Congress on Intelligent Control and Automation (WCICA 2008), Chongqing, China, 25–27 June 2008; pp. 223–228. [Google Scholar]
- Pamplona, D.; Bernardino, A. Smooth foveal vision with Gaussian receptive fields. In Proceedings of the 9th IEEE-RAS International Conference on Humanoid Robots, Paris, France, 7–10 December 2009; pp. 223–229. [Google Scholar]
- Chambers, D.R.; Flannigan, C.; Wheeler, B. High-accuracy real-time pedestrian detection system using 2D and 3D features. In Proceedings of the SPIE Conference on Three-Dimensional Imaging, Visualization, and Display 2012, Baltimore, MD, USA, 24–25 April 2012; pp. 83840G-1–83840G-11. [Google Scholar]
- Hao, Q.; Wang, Z.; Cao, J.; Zhang, F. A hybrid bionic image sensor achieving FOV extension and foveated imaging. Sensors 2018, 18, 1042. [Google Scholar] [CrossRef] [PubMed]
Figure 1.
(a) Microscope image of a fovea wherein the deep “v”-shape acts as a negative element in the lens system [19]; (b) Model of a telephoto lens system and a modification to illustrate its similarity to the fovea wherein the negative lens is replaced by a spherical (concave) surface [2].

Figure 2.
(a) Schematic of a generic raptor head showing the locations of the two foveae in the eye. The line of sight for the deep fovea is shown. The line of sight for the shallow fovea is pointed forward toward the beak of the raptor [27]; (b) Visual acuity as measured for a Chilean Eagle. The labeled regions of relatively higher acuity are the result of the foveae in the raptor eye. Human eyes have only one central peak [27].
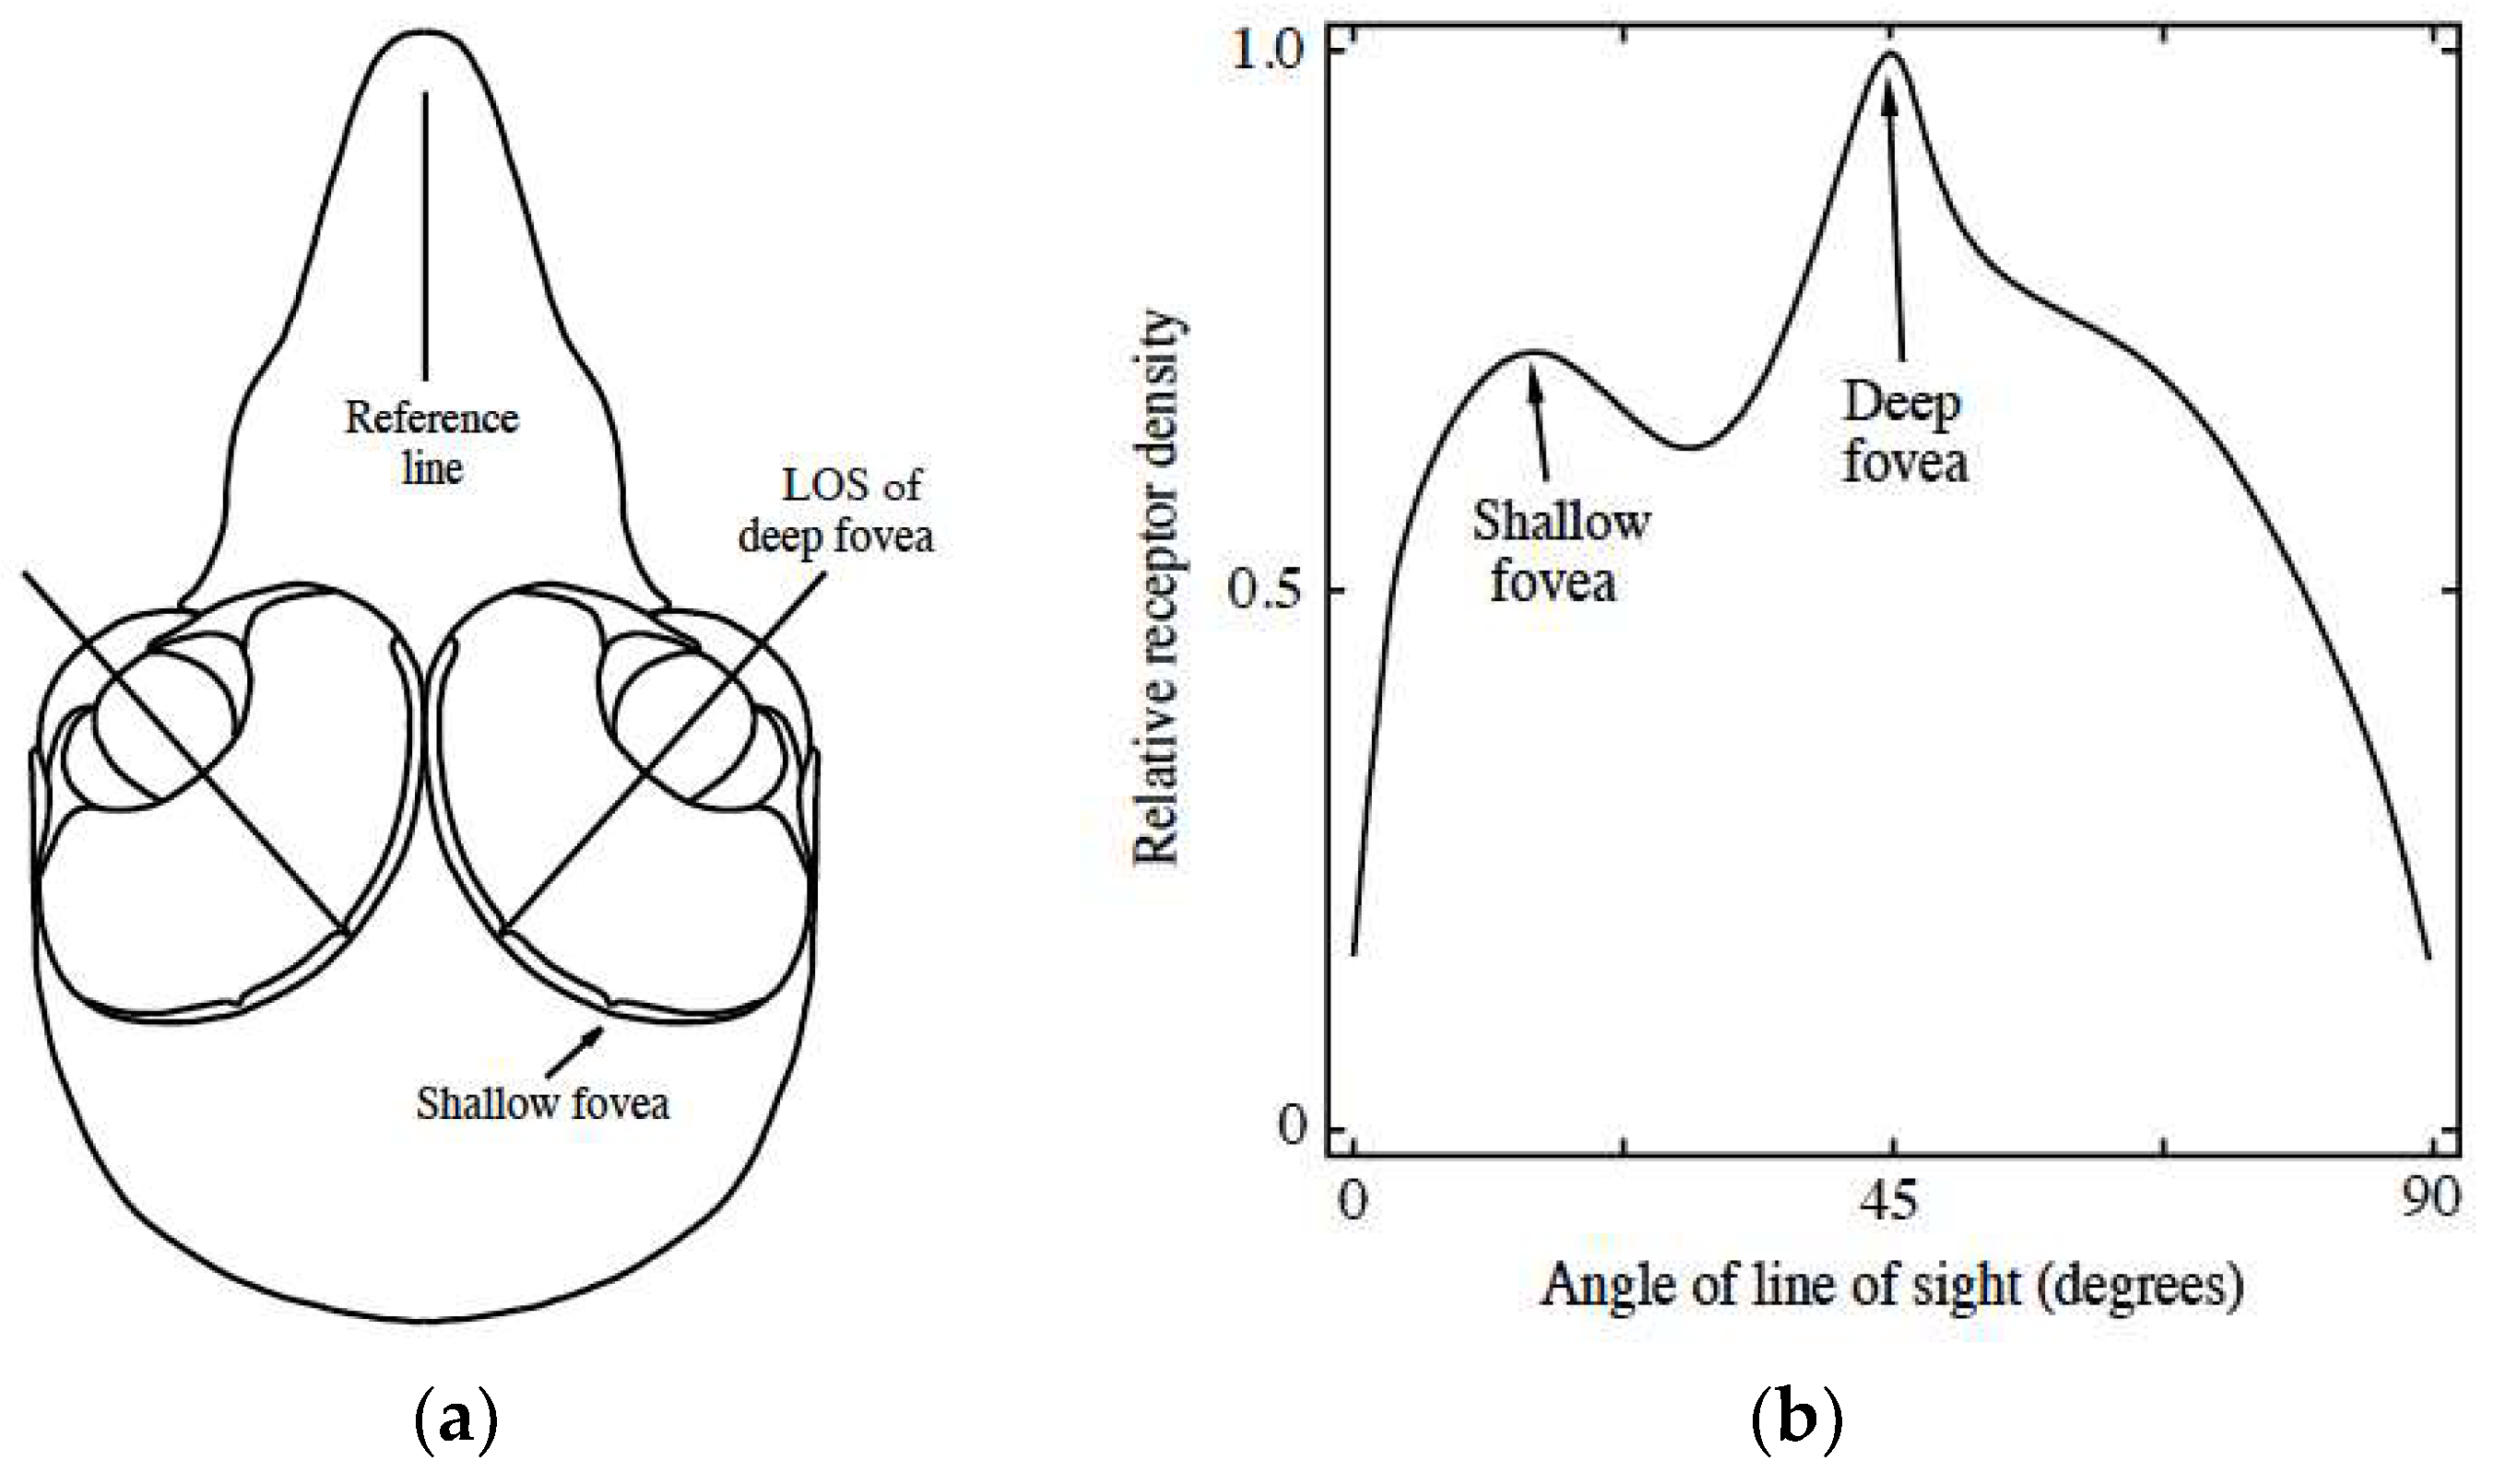
Figure 3.
Plot of common projections used in optical systems displayed as image height vs. field angle.
Figure 3.
Plot of common projections used in optical systems displayed as image height vs. field angle.

Figure 4.
Modeled raptor eye projection compared to an F-theta model, displayed as image height vs. field angle.
Figure 4.
Modeled raptor eye projection compared to an F-theta model, displayed as image height vs. field angle.

Figure 5.
Construction of an Erfle eyepiece [29].
Figure 5.
Construction of an Erfle eyepiece [29].

Figure 6.
(a) Wide-angle foveated objective presented by Shimizu, et al. [32]; (b) Corresponding spot diagram for a number of field positions. Full scale on each subplot is 4 mm.
Figure 6.
(a) Wide-angle foveated objective presented by Shimizu, et al. [32]; (b) Corresponding spot diagram for a number of field positions. Full scale on each subplot is 4 mm.


Figure 7.
Starting point for spotting scope objective optimization.

Figure 8.
(a) Result of the iterative optimization process; (b) Resultant field curvature and distortion curves.
Figure 8.
(a) Result of the iterative optimization process; (b) Resultant field curvature and distortion curves.

Figure 9.
Example of foveated image. (a) Input (full-resolution) image; (b) Foveated image using log-polar receptive field layout.
Figure 9.
Example of foveated image. (a) Input (full-resolution) image; (b) Foveated image using log-polar receptive field layout.

Figure 10.
Illustration of varying spatial support across scales in foveal scale space [41].
Figure 10.
Illustration of varying spatial support across scales in foveal scale space [41].

Figure 11.
Illustration of a foveal scale space generated using the log-polar transform. (a) Image in “native” cartesian coordinates wherein the shrinking of the image from left to right illustrates how it moves towards the center of the image through scale space; (b) Foveal region corresponding to images in (a) showing how the support of the foveal region grows with increasing scale.

Figure 12.
Log-polar layout of receptive fields with the periphery colored red and fovea colored blue.
Figure 12.
Log-polar layout of receptive fields with the periphery colored red and fovea colored blue.

Figure 13.
Illustration of the organization of a log-polar foveating transformation matrix.
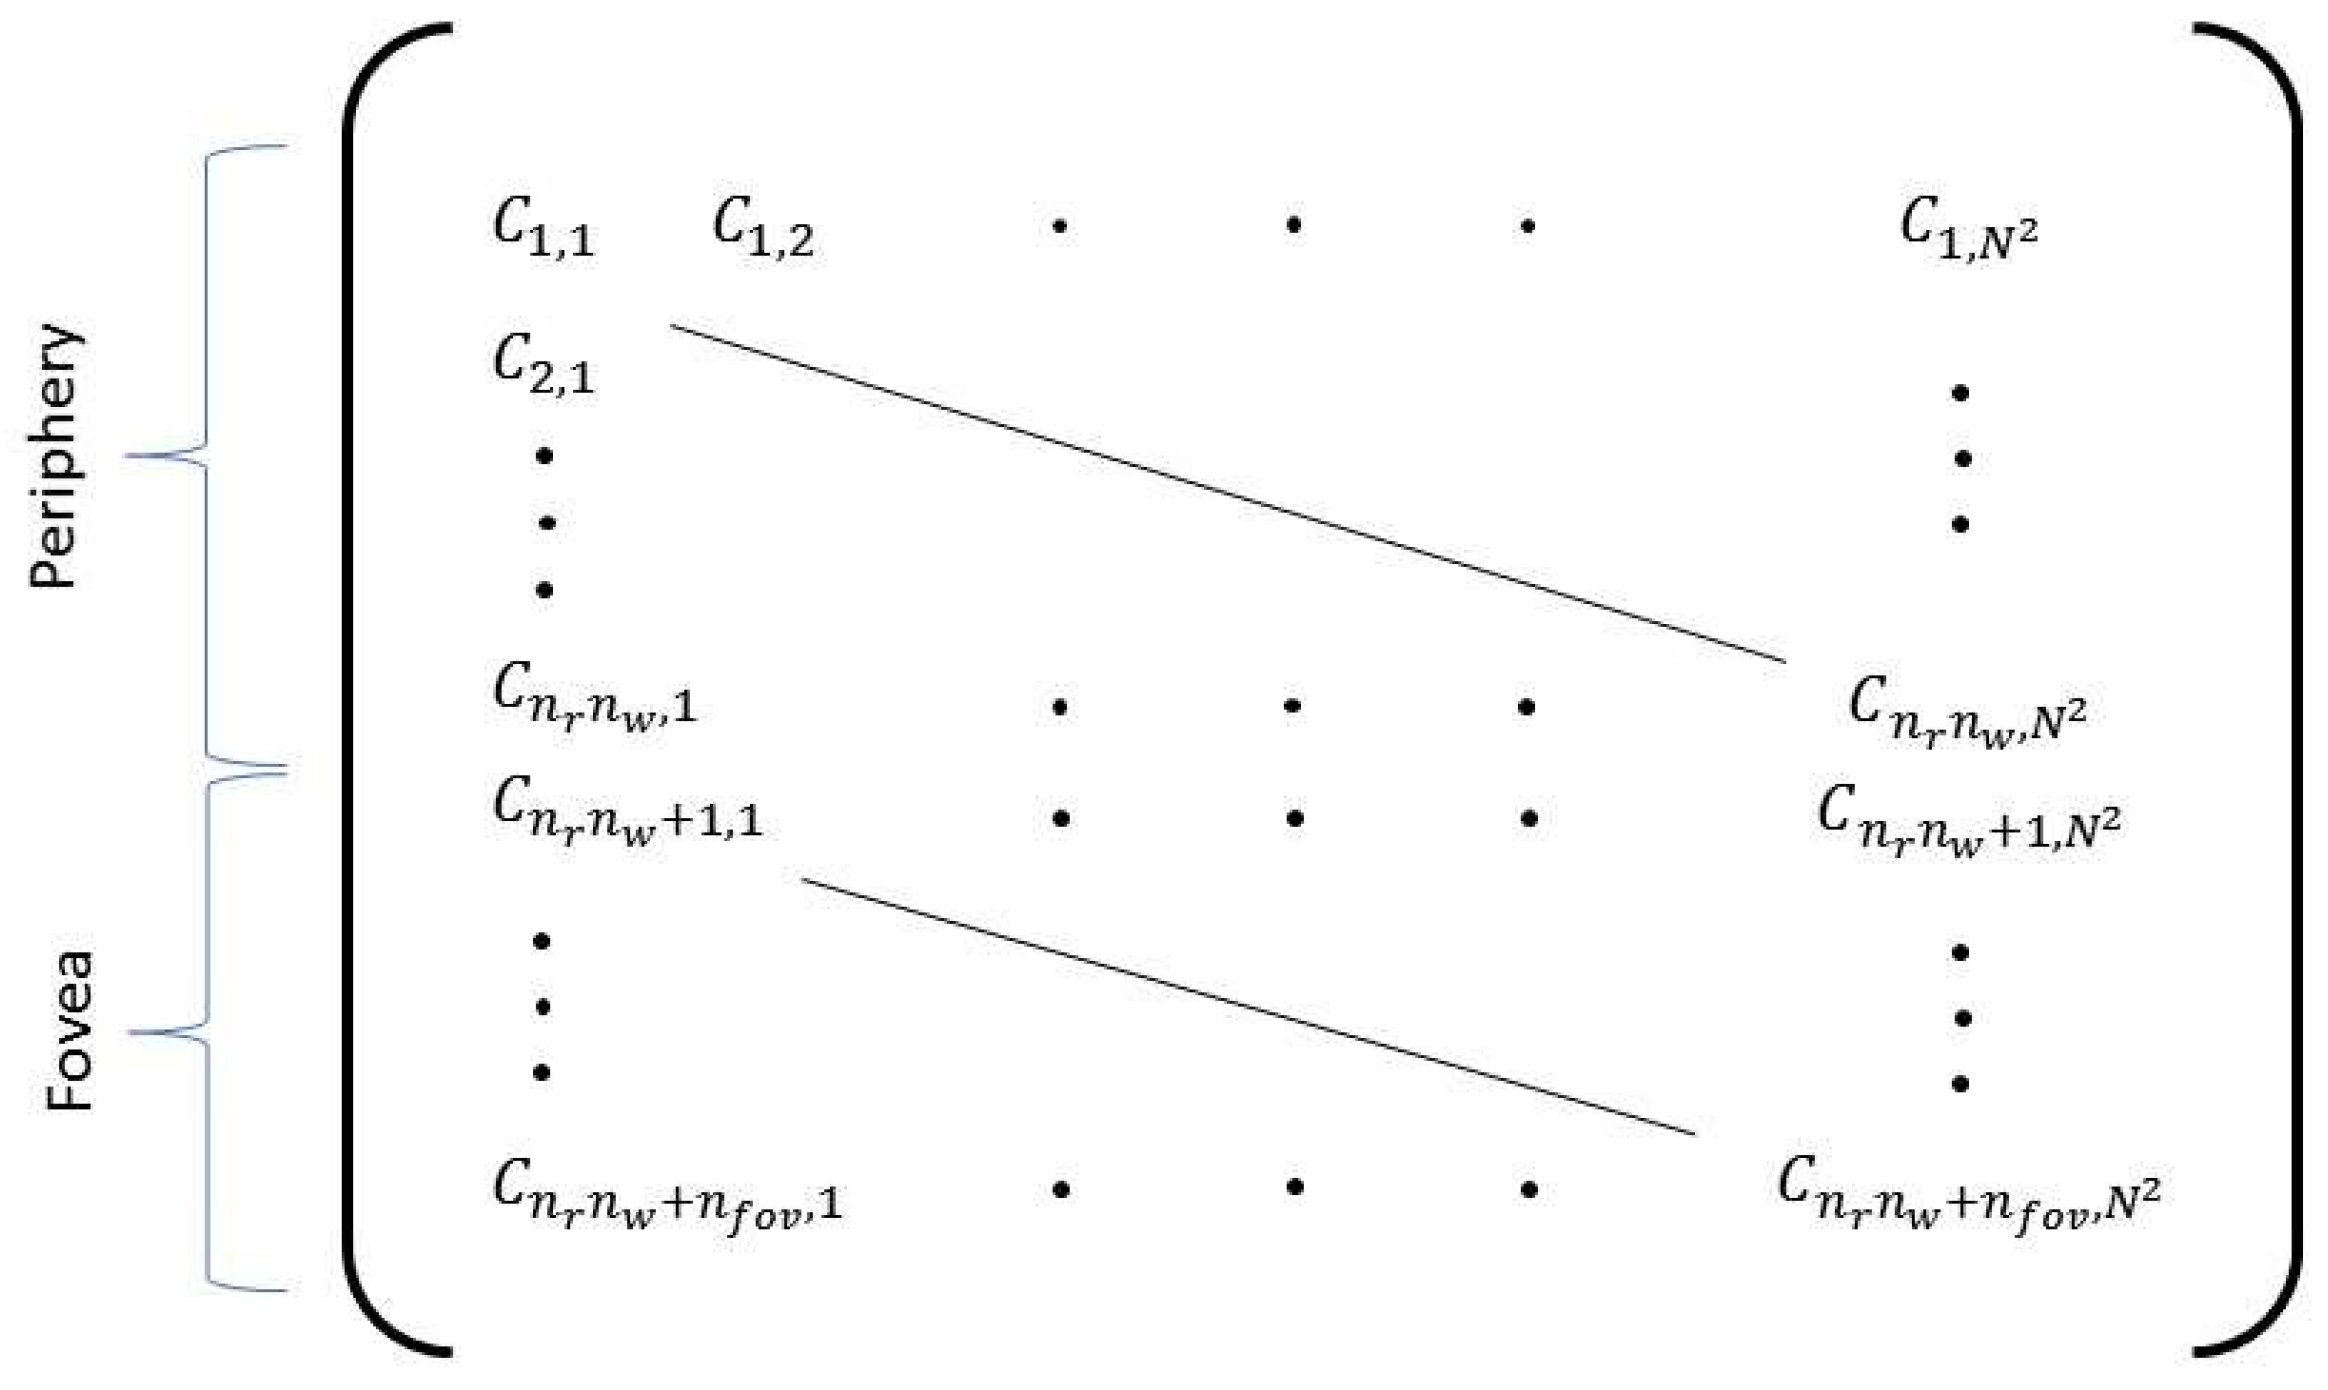
Figure 14.
Illustration of the sparse structure of the transform matrix. Blue areas correspond to non-zero coefficients.
Figure 14.
Illustration of the sparse structure of the transform matrix. Blue areas correspond to non-zero coefficients.
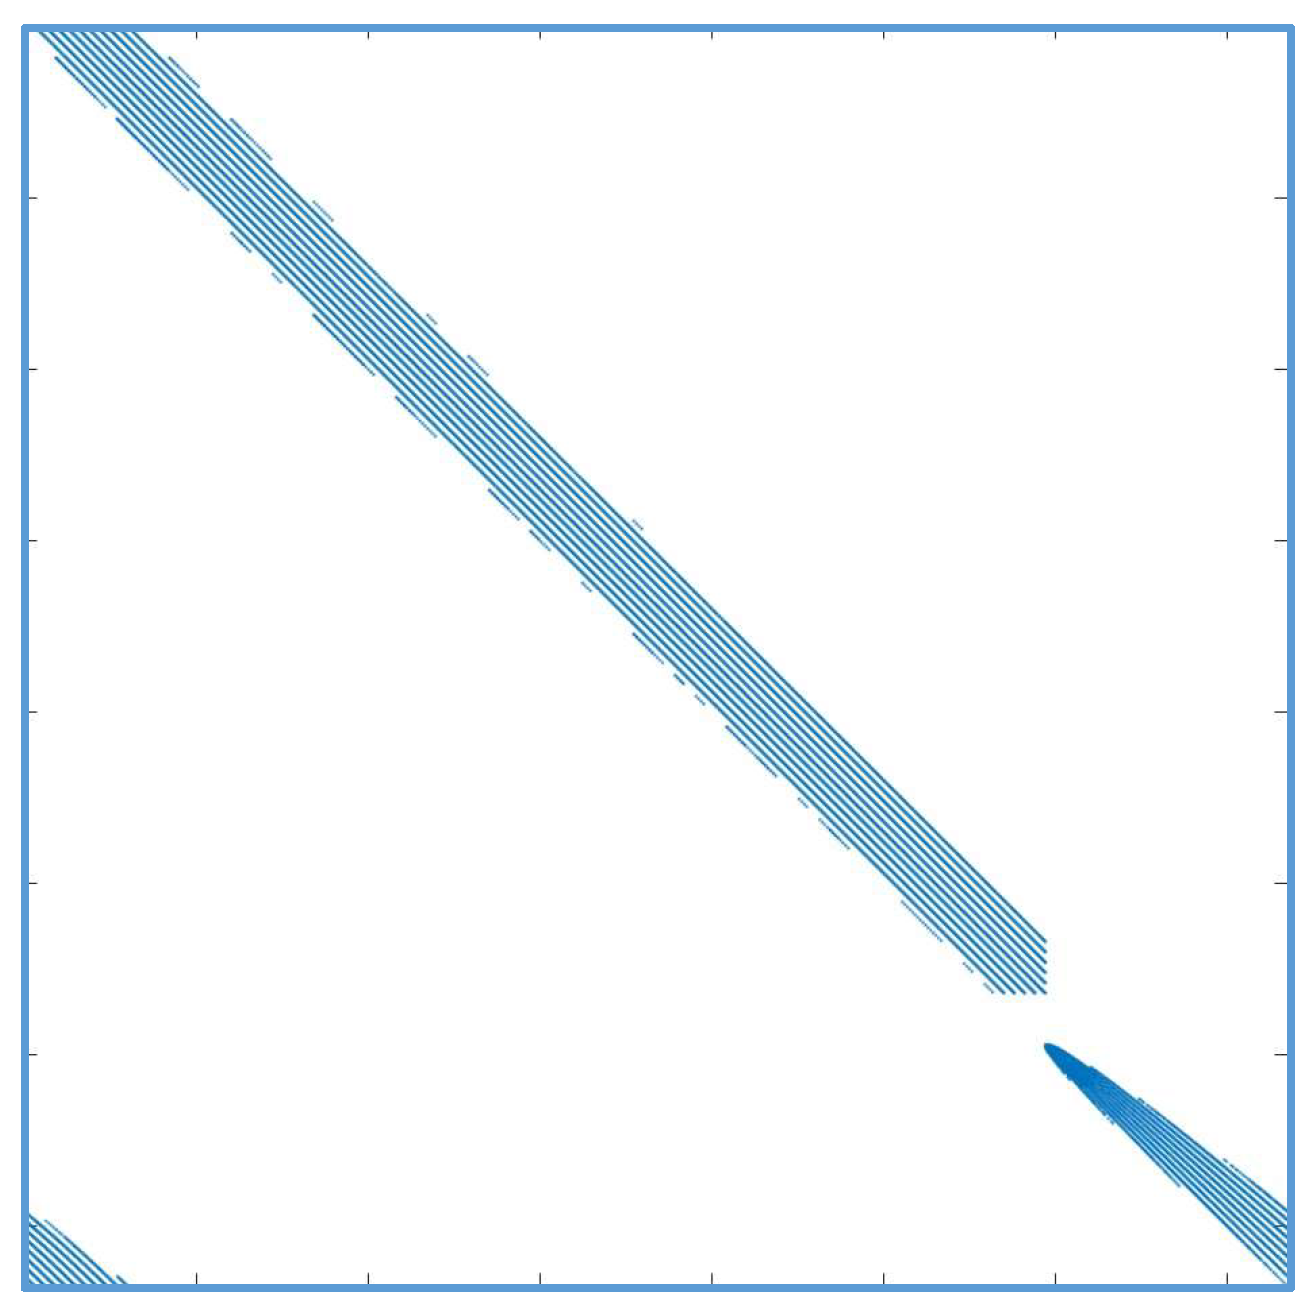
Figure 15.
(a) Illustration of the layout of receptive fields (RFs) for a transformation with a small number of wedges; (b) Same transformation shown in (a) (in red) with an additional transformation (in blue) whose only difference is an increase in the minimum RF size relative to that of the red transform. This illustrates the increase in the spatial support of the foveal region from one transform to the other.

© 2018 by the authors. Licensee MDPI, Basel, Switzerland. This article is an open access article distributed under the terms and conditions of the Creative Commons Attribution (CC BY) license (http://creativecommons.org/licenses/by/4.0/).
Share and Cite
MDPI and ACS Style
Narayanan, R.M.; Kane, T.J.; Rice, T.F.; Tauber, M.J. Considerations and Framework for Foveated Imaging Systems †. Photonics 2018, 5, 18. https://doi.org/10.3390/photonics5030018
AMA Style
Narayanan RM, Kane TJ, Rice TF, Tauber MJ. Considerations and Framework for Foveated Imaging Systems †. Photonics. 2018; 5(3):18. https://doi.org/10.3390/photonics5030018
Chicago/Turabian StyleNarayanan, Ram M., Timothy J. Kane, Terence F. Rice, and Michael J. Tauber. 2018. "Considerations and Framework for Foveated Imaging Systems †" Photonics 5, no. 3: 18. https://doi.org/10.3390/photonics5030018
Note that from the first issue of 2016, this journal uses article numbers instead of page numbers. See further details here.