Super-Oscillatory Metalens at Terahertz for Enhanced Focusing with Reduced Side Lobes


1
Antennas Group-TERALAB, Universidad Pública de Navarra, Campus Arrosadia, Pamplona 31006, Spain
2
School of Engineering, Newcastle University, Newcastle Upon Tyne NE1 7RU, UK
3
Institute of Smart Cities, Public University of Navarra, 31006 Pamplona, Spain
*
Author to whom correspondence should be addressed.
Photonics 2018, 5(4), 56; https://doi.org/10.3390/photonics5040056
Submission received: 27 October 2018
/
Revised: 16 November 2018
/
Accepted: 29 November 2018
/
Published: 5 December 2018
(This article belongs to the Special Issue Terahertz Photonics)
Abstract
:In this paper, we design and numerically demonstrate an ultra-thin super-oscillatory metalens with a resolution below the diffraction limit. The zones of the lens are implemented using metasurface concepts with hexagonal unit cells. This way, the transparency and, hence, efficiency is optimized, compared to the conventional transparent–opaque zoning approach that introduces, inevitably, a high reflection in the opaque regions. Furthermore, a novel two-step optimization technique, based on evolutionary algorithms, is developed to reduce the side lobes and boost the intensity at the focus. After the design process, we demonstrate that the metalens is able to generate a focal spot of 0.46λ0 (1.4 times below the resolution limit) at the design focal length of 10λ0 with reduced side lobes (the side lobe level being approximately −11 dB). The metalens is optimized at 0.327 THz, and has been validated with numerical simulations.
1. Introduction
For any conventional imaging instrument, the fine features of an object are permanently lost in the image, due to the diffraction of light. Small details scatter light mostly into evanescent waves that exponentially decay away from the object and, thus, cannot be captured by the device [1]. To overcome this diffraction limit, novel concepts have been proposed in the last years, such as metamaterials and metasurfaces [2,3,4], dielectric particles [5,6,7], and solid immersion lenses [8], to name a few. Within this realm, super-oscillatory devices have demonstrated their potential in imaging applications with an improved spatial resolution.
Super-oscillations were first introduced at the end of the last century to describe a phenomenon in which a band-limited signal can contain localized field variations with oscillations faster than those of the highest Fourier components of their spectrum [9], as explained in Appendix A.1 below. In optics, the term super-oscillation refers to a near-destructive interference with fast phase variations and high local momenta in a small intensity region [10]. Recently, this phenomenon has been applied to improve the performance of imaging systems by implementing super-oscillatory lenses (SOLs) with subwavelength spatial resolution, defeating the diffraction limit [2,10,11,12,13,14,15,16].
Traditionally, SOLs are planar, multi-annular, and radial focusing devices composed of alternating transparent and opaque concentric rings, usually designed applying optimization techniques, such as genetic algorithms and vector designs [11,12,13]. The optical super-oscillation is controlled by tailoring the interference between the diffracted beams produced by each annular aperture [14]. The main drawback of this procedure is that it gives rise to high amplitude side lobes that reduce the intensity of the subwavelength focal spot generated at the output [10]. Moreover, despite the fact that there is no physical limit regarding the size of the focal spot along the transversal axes, it has been demonstrated that the efficiency of a SOL is dramatically reduced as the resolution is increased [15].
Since they were introduced several years ago, metamaterials (and metasurfaces as their 2D version) have opened new avenues to synthesize and control wave propagation. Metamaterials have been demonstrated within a wide spectral range, from microwaves to optical frequencies, influencing other fields, like acoustics and mechanics, and giving rise to exciting applications. In particular, the field of lenses has greatly benefited from the introduction of metamaterials and metasurfaces since the beginning of the topic and, nowadays, a high variety of focusing devices with exotic performance have been demonstrated [17,18,19,20].
Inspired by the features of metamaterials and metasurfaces, in this work, we propose and demonstrate, both analytically and numerically, a binary SOL designed by alternating semitransparent concentric rings filled with two different metamaterial unit cells. Three objectives are pursued: (i) enhancement of the efficiency by reducing the reflection at the input and, therefore, increase the amplitude at the focus; (ii) reducing the side lobes; and (iii) keeping a narrow focal spot below the diffraction limit, taken as 0.65λ0 with λ0 as the operation wavelength, considering the Rayleigh criterion—see [1] and Appendix A.2 in this manuscript. To accomplish this, an advanced version of the binary particle swarm optimization (BPSO) algorithm, based on [21], is developed (described in detail in Appendix A.3). The designed SOL is then implemented using only two different unit cells at the operation frequency of f0 = 0.327 THz (λ0 = 917 µm). An increased amplitude of the focal spot and reduced side lobes are obtained with the proposed structure, compared to conventional SOLs based on opaque–transparent zones, without affecting its performance in terms of the subwavelength resolution of the focal spot, with a width of 0.44λ0 and 0.50λ0 along the x and y axis, respectively.
In this way, we continue the path started in the last few years to improve the SOL performance by implementing new algorithms or combining them with metasurface concepts. In fact, very recently, a new algorithm to design super-oscillatory devices able to optimize the main-side lobe intensity ratio has been reported, obtaining resolutions between 0.50λ0 and 0.25λ0 [22]. Compared with this work, our algorithm is more complex, but can develop solutions with a similar resolution, providing, simultaneously, the actual geometry that fulfills the prescribed field distribution profile. In [23], broadband imaging with a resolution approximately 0.64 times the Rayleigh criterion in the visible range was obtained using metasurface unit cells. However, the phase difference between the zones was fixed at π rad, deterring the transmittance and overall efficiency. It is noteworthy that our lens shows a comparable resolution, but with a higher transmittance efficiency. In [24], a new class of super-oscillation waveform was proposed to obtain lower side lobes, as low as 15 dB below the main spot, at the expense of having a diffraction-limited focus. Our work, in contrast, shows higher side lobes (11 dB below the main beam), but the main spot is not diffraction limited.
As can be seen from this brief state-of-the-art review, one key aspect to obtain a practical super-oscillatory device is the ability of obtaining a subdiffraction main focus with high intensity, while keeping low side lobes. This work tries to summarize all these aspects, combining the use of metasurfaces to get higher the efficiency and a smart design process to obtain, at the same time, the desired field profile with low side lobes.
2. Design and Analytical Results
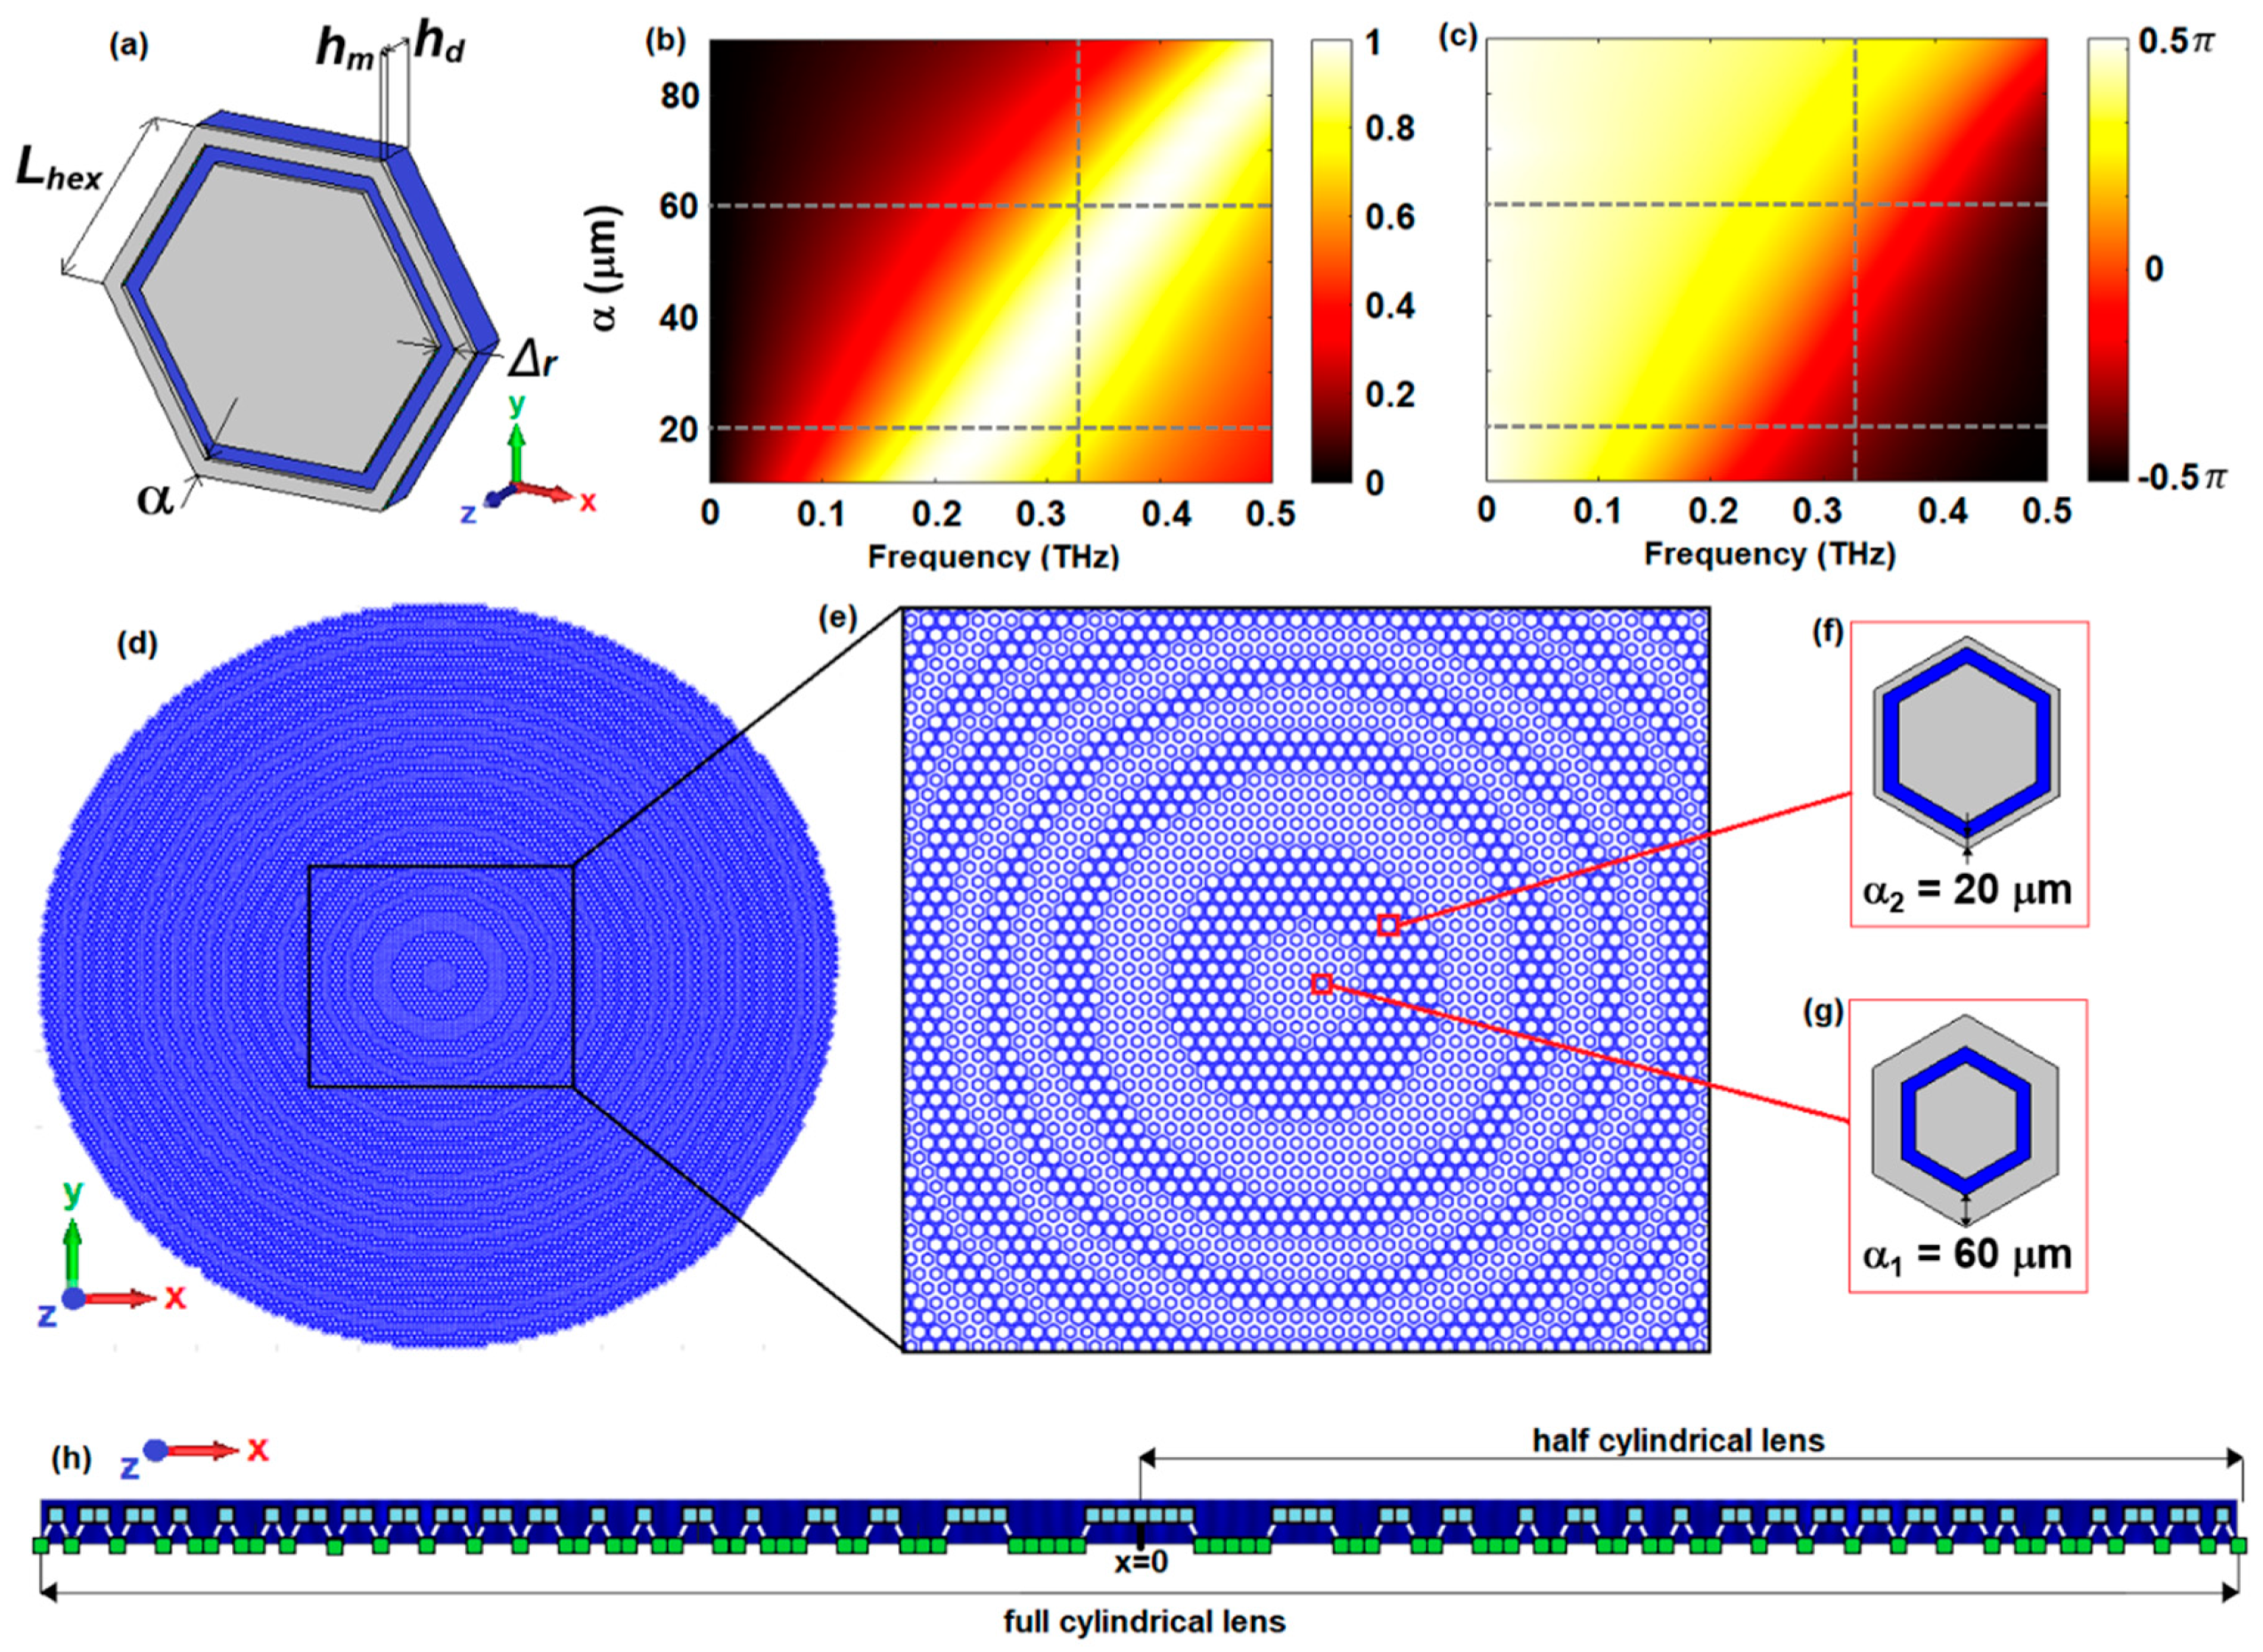
As mentioned in the introduction, to create different optical paths for the even and odd zones, two different unit cells are used; see schematic in Figure 1a. Both are hexagonal ring slots with side length Lhex carved on a copper metallic film with conductivity σ = 5.8 × 10⁷ S/m and thickness hm = 0.6 µm (0.65 × 10⁻³λ0), laying on a polypropylene slab with relative permittivity ɛr = 2.25 and thickness hd = 35 µm (0.038λ0). Note that, for simplicity, we used the DC nominal conductivity of copper, although, in the terahertz band, this nominal value is usually lower due to granularity, etc.
Before engineering the unit cells for the even and odd zones, a preliminary analytical study is carried out using the Huygens–Fresnel principle, considering homogeneous isotropic materials for the different regions of a cylindrical SOL, while imposing a focal length (FL) value of 10λ0. From these results (shown in Appendix A.4), it is found that a phase difference of at least π/6 rad between even and odd zones is necessary for the BPSO algorithm to converge and generate the focal spot at the design FL. In addition, since our aim is to increase the amplitude at the focus, both unit cells must be carefully engineered to ensure a high transmittance at the operation frequency. To achieve this, both the magnitude and phase of the transmission coefficient must be adjusted by varying the geometrical parameters of the unit cell. For simplicity, here, only the external radius of the hexagonal slot (α) is modified, as we found that tuning this parameter is enough to achieve a satisfactory performance.
The design is done using the frequency domain solver of the commercial software CST Microwave Studio®. Unit cell boundary conditions are applied on the transverse plane and open boundaries along z (see coordinate axis in Figure 1a). The structure is illuminated with the fundamental TE00 mode of a Floquet port, which corresponds to a vertically polarized plane wave (Ey), considering only normal incidence. With this setup, the contour maps of the magnitude and phase of the transmission coefficient as a function of α and frequency are calculated and shown in Figure 1b,c, respectively. As observed, the phase of the unit cells can be tuned from −π/2 to π/2 rad within the spectral range under study. Note that the phase excursion does not cover the complete −π to π rad range, as required in a graded index lens design for instance. To increase the phase excursion, one could either increase the frequency range or change the unit cell such that this requirement is fulfilled. However, this is not an issue in the proposed SOL that only requires two unit cells with a small phase difference of π/6 between them. Hence, from these results, we can determine the slot width of each unit cell, taking into account the two design conditions mentioned above, to get the highest possible transmittance and a phase difference larger than π/6 rad at the design frequency of f0 = 0.327 THz (highlighted with a vertical dashed gray line in Figure 1b,c). The selected unit cells correspond to the designs with α1 = 60 µm (0.065λ0) and α2 = 20 µm (0.022λ0), which have a relatively high transmission coefficient of 0.8 and a phase of 0.12π and 0.28π, respectively, resulting in a phase difference of 0.16π, fulfilling both requirements. Both solutions have been highlighted with horizontal dashed gray lines in Figure 1b,c.
Once the unit cells have been selected, the SOL design is carried out by implementing a modified BPSO algorithm [6] (see Appendix A.3 for a description of the method and the parameters involved). In our calculations, we consider the following constants: Vmax = 6, as suggested in [25], to set a limit and prevent further exploration after the population has converged; c1 = c2 = 2, to give equal weight to the social and the cognitive components; and w ∈ [0.4, 0.6], considering a time-varying inertial weight starting from 0.6, and decreasing proportionally after each iteration. The maximum number of iterations is set to 2000. In addition, a swarm of 100 particles is considered, each of them being a vector with 72 components. In order to reduce the computational burden, a cylindrical lens is first designed, and its near-field distribution at the operation frequency is calculated analytically with the Huygens–Fresnel approximation [19,20]. Isotropic point sources, with magnitude and phase taken from the selected unit cells, are placed at each of the 72 positions with a separation of 350 µm (0.381λ0).
The optimization of the SOL is done in two steps; see Figure 2. In a first stage, an adapted weighted sinc is used as the goal function to get the desired profile of the target power distribution along the x-axis at z = FL = 10λ0, starting with a random unit cell distribution [13]. The highest weight in the goal function is given to the focal spot. This makes the variance much bigger there than elsewhere, and the optimizer tries to reduce it, quickly developing a focus at the desired point, as shown in Figure 2b. The second step consists in reducing the power distribution of the side lobes with a new weighted exponential goal function. Another optimization process is launched using particles derived from the best combination found in the first step, and varying, then, one position between two consecutive particles. After applying this two-step process, the found global best solution is 111122222111122211221122212211221221221121121121121121121221221211211212, where “1” and “2” stand for unit cells of type 1 and 2 (α1 and α2), respectively. This vector is the unit cell distribution along the x-axis, from the center of the lens to its rightmost edge (the left-hand side is obtained by simply mirroring the array, making use of the lens symmetry). Thus, after this procedure, the cylindrical metalens has a total length along the transversal x axis of D ≈ 54λ0.
The analytical normalized power distribution, obtained by applying the Huygens–Fresnel technique to the solution derived from our algorithm, is shown in Figure 2c. As observed there, a clear focus appears at FL = 9.816λ0, very near the designed value of FL = 10λ0. From the power distribution along the x-axis at z = FL, depicted in Figure 3a, we see that the value of full width at half-maximum (FWHM, defined as the distance at which the power distribution has been reduced to half its maximum) in the transversal x direction is FWHMx = 0.36λ0, which is well below the diffraction limit (0.65λ0).
In the next step, we implement a spherical lens by simply applying rotation symmetry to the cylindrical lens solution, obtaining radial zones. As before, we compute, first, the near-field distribution with the Huygens–Fresnel approach. The normalized power profile along both x- and y-axes at FL is represented in Figure 3b (both curves are identical). The focus, in this case, appears at FL = 9.16λ0, and has a FWHM = 0.46λ0 both along x and y directions, also below the diffraction limit.
To verify that the focal spot generated in the spherical lens is, indeed, super-oscillatory, we analyze the behavior of the local wavenumber, klocal. According to the definition of super-oscillation [14], klocal is equal to the phase gradient (klocal = ∇Ψ), where Ψ is computed as Ψ = arg{E(r0)·E(ri)}, the function arg{a} represents the argument of a complex number a, and E(r0)·E(ri) is the scalar product of the electric field vector at points r0 and ri; r0 is the reference point with coordinates (0, 0, FL), and ri has coordinates (x, y, FL). In the super-oscillatory region, klocal should be larger than the highest wavenumber component (k0 = 2π/λ0, in free space). We use the center of the lens as a reference point to calculate the phase of the electric field along the x-axis at the focus (z = FL). As shown in Figure 4, there are regions where the phase rapidly oscillates, and klocal is much larger than k0, demonstrating that the operation is based on super-oscillations. Moreover, these regions correspond to the electric field intensity minima, which is also a characteristic of super-oscillatory devices.
3. Simulation Results
The transient solver of commercial software CST Microwave Studio® is used to evaluate the performance of the full metalens. The center of each unit cell is placed at the coordinates of the source points obtained in the Huygens–Fresnel analysis. A schematic of the final design is shown in Figure 1d,e. The lens is illuminated using a plane wave under normal incidence assuming open boundary conditions in all directions. Moreover, magnetic and electric symmetries are applied on the yz-plane and xz-plane, respectively. A fine hexahedral mesh is used, with smallest and largest mesh cells of 17.8 μm (≈0.019λ0) and 60 μm (≈0.07λ0), respectively.
The simulation results of the power distribution on the E-plane (yz), H-plane (xz), and xy-plane (at z = FL), for the designed SOL at the operation frequency of 0.327 THz, are shown in Figure 5 (right column), along with the analytical results of the spherical lens obtained with the Huygens–Fresnel method (left column). As observed, the agreement between both results is qualitatively good, although there are some differences, probably due to the simplifications assumed in the analytical models to speed up the analysis.
To better compare these results, a summary of the metalenses’ performance is shown in Table 1. There, the values of the cylindrical SOL are also included for completeness. For the simulated spherical SOL, the subwavelength focal spot is numerically found at a distance of 8.77 mm (9.56λ0), which is near the designed value (10λ0) with a transversal resolution of FWHMx = 0.44λ0 and FWHMy = 0.5λ0 along the x- and y-axis, respectively. Note that these values are below the diffraction limit (0.65λ0). Low side lobes are obtained in all cases, with a magnitude of the highest side lobe approximately 10% below of the main lobe in the simulated SOL. With respect to the depth of focus (DOF, defined as the distance along the z-axis where the power distribution has decayed half its maximum from the FL), the simulated spherical SOL shows a bigger value than the analytical spherical SOL (1.51λ0 and 1.28λ0, respectively). This is an expected result because of the higher accuracy of the numerical analysis, done using the physical unit cells (taken from Figure 1). To compare, further, the focusing performance, the power enhancement (defined as the power amplitude at the FL with and without the SOL) is smaller in the numerical simulation. This can be explained by considering that, in contrast to the analytical calculation, in the simulated model, both material loss and diffraction effects are considered. Finally, it can be noted that the focus ellipticity (defined as the ratio between FWHMx and FWHMy) is very close to unity in both spherical lenses, which means an almost spherical focal spot in the xy plane.
4. Conclusions
In this work, we have engineered and evaluated, both analytically and numerically, a THz binary super-oscillatory metalens, with the aim to improve the magnitude of the focal spot and achieve, at the same time, a reduction of its side lobes. As a result, an ultrathin metalens with thickness around 0.04λ0 has been demonstrated at 0.327 THz. A new algorithm, based on a two-step variation of the BPSO, has been developed to enhance the intensity at the focus, and mitigate the side lobe level. The solution obtained shows super-resolution with reduced side lobes and a large enhancement while allowing a spherical focus, with ellipticity close to unity. Both the analytically and numerically calculated spherical lens create a subwavelength focal spot near the prescribed FL, sharper than 0.5λ0, beating the Rayleigh diffraction limit (0.65λ0). Moreover, there are no significant side lobes (around 10% of the central peak power), with a power enhancement at the FL of more than 16 dB.
Author Contributions
Conceptualization, S.L., V.P.-P. and M.B.; methodology, S.L., V.P.-P. and M.B.; software, S.L.; validation, S.L., V.P.-P.; formal analysis, S.L.; investigation, S.L., V.P.-P. and M.B.; resources, M.B.; data curation, S.L.; writing—original draft preparation, S.L.; writing—review and editing, S.L., V.P.-P. and M.B.; visualization, S.L., V.P.-P. and M.B.; supervision, V.P.-P. and M.B.; project administration, M.B.; funding acquisition, M.B.
Funding
This research was funded by the Spanish Ministerio de Economía y Competitividad with European Union Fondo Europeo de Desarrollo Regional (FEDER) funds, grant number TEC2014-51902-C2-2-R.
Acknowledgments
V.P.-P. is supported by the Newcastle University (Newcastle University Research Fellow).
Conflicts of Interest
The authors declare no conflict of interest. The funders had no role in the design of the study; in the collection, analyses, or interpretation of data; in the writing of the manuscript, or in the decision to publish the results.
Appendix A
Appendix A.1. The Concept of Super-Oscillation
Formally, a SOL is a structured lens able to achieve subwavelength focusing, providing two major advantages: (i) far-field super-resolution without near-field evanescent waves, and (ii) it is a planar focusing device, facilitating its integration in compact systems. The key feature of the super-oscillatory functions is that although they are “band-limited”, they can oscillate at a much higher rate than the highest Fourier component. This can be better understood with the example shown in Figure A1. There, it is observed that in a very narrow zone, the super-oscillating function f(x) oscillates at a frequency almost 9 times higher (n = 43.6) than its highest Fourier component (n = 5), where n in this case is an integer accounting for the index of the different Fourier harmonics.
Figure A1.
Example of a super-oscillatory function, f(x), in red. Its highest harmonic fhighest (n = 5) is represented in blue. In a narrow interval around x = 0, f(x) is approximated by the function fapp.
Figure A1.
Example of a super-oscillatory function, f(x), in red. Its highest harmonic fhighest (n = 5) is represented in blue. In a narrow interval around x = 0, f(x) is approximated by the function fapp.

Appendix A.2. Rayleigh Resolution Limit
The conventional resolution limit is defined as the minimum distance that allows distinguishing two point-source objects close to each other. This resolution limit, or diffraction limit, is expressed following diverse criteria that differ on the definition they use for “two objects being resolvable from each other”, although the differences are usually small. The Rayleigh criterion is expressed as
where res is the Rayleigh resolution limit, n is the refractive index of the medium where the sources and the lens are embedded (typically n = 1), and the angle θ is related to the focal length FL and the external radius of the lens, ri, through the equation tan(θ) = ri/FL. Considering our design, the Rayleigh criterion for the diffraction limit is res = 0.65λ0.
Appendix A.3. Implemented BPSO Algorithm
The SOL design is carried out by implementing a BPSO method, which imitates the behavior of a swarm of bees [6]. The different bees or “particles” that conform the swarm, use two principles: (a) principle of communication, which means that all particles communicate its positions to all others; and (b) principle of learning, according to which each particle learns its best position, so far, and moves towards it. For particle i, its position at time step t is denoted by Xi(t), and its velocity is denoted by Vi(t) that describes its speed and direction. Each particle has a memory that saves the personal best position found until then, Pi(t) and the algorithm also saves the best global swarm position, G(t).
Once the algorithm is run, at each iteration, the position and velocity of each particle is updated following the next methodology: the vectors Pi(t) − Xi(t), G(t) − Xi(t), and Vi(t), are calculated for each particle. Then, the particle is moved parallel to those three vectors towards its new updated position, denoted as Xi(t + 1). To do it, a weighted sum of the three vectors is applied to Xi(t) to get the updated position and velocity of the particle, using the next equations:
As it can be seen, there are five variables used to weigh the sum: c1 and c2, which are known as the cognitive and the social factor respectively; w known as the inertial weight; and r1 and r2, which are random uniformly distributed values between 0 and 1. The velocity vector will be a real number between [−Vmax, Vmax]. Since the particle’s position is a binary N-dimensional vector, it must be updated following Equation (1), restricted to binary (0 or 1) values, following the strategy of [16]. The decision to take 0 or 1 is implemented using the sigmoid limiting transformation.
The algorithm was implemented using the R2017b version of MATLAB®. For the purposes of this study, it was developed originally and without dependence on any of the existing libraries, adapting and developing the ideas found in the original PSO algorithm. The program was run in a computer with the following characteristics: one octa-core processor i7-6700k CPU @ 4 GHz, 64 GB of RAM DDR4-2400 MHz, SSD 512 GB and graphic card Gigabyte GeForce GTX 1070 Ti 8 GB GDDR5. The running time using 72 lossless source points (half a cylindrical lens), considering around 4000 iterations (2000 iterations for each one of the two algorithm steps), is approximately 5400 s. Regarding the computational burden, if a quarter of a spherical lens would be considered instead, the number of source points would sum up more than 4400, increasing the computational time to more than 60 times higher.
Appendix A.4. The Need of a Minimum Phase Difference between Unit Cells
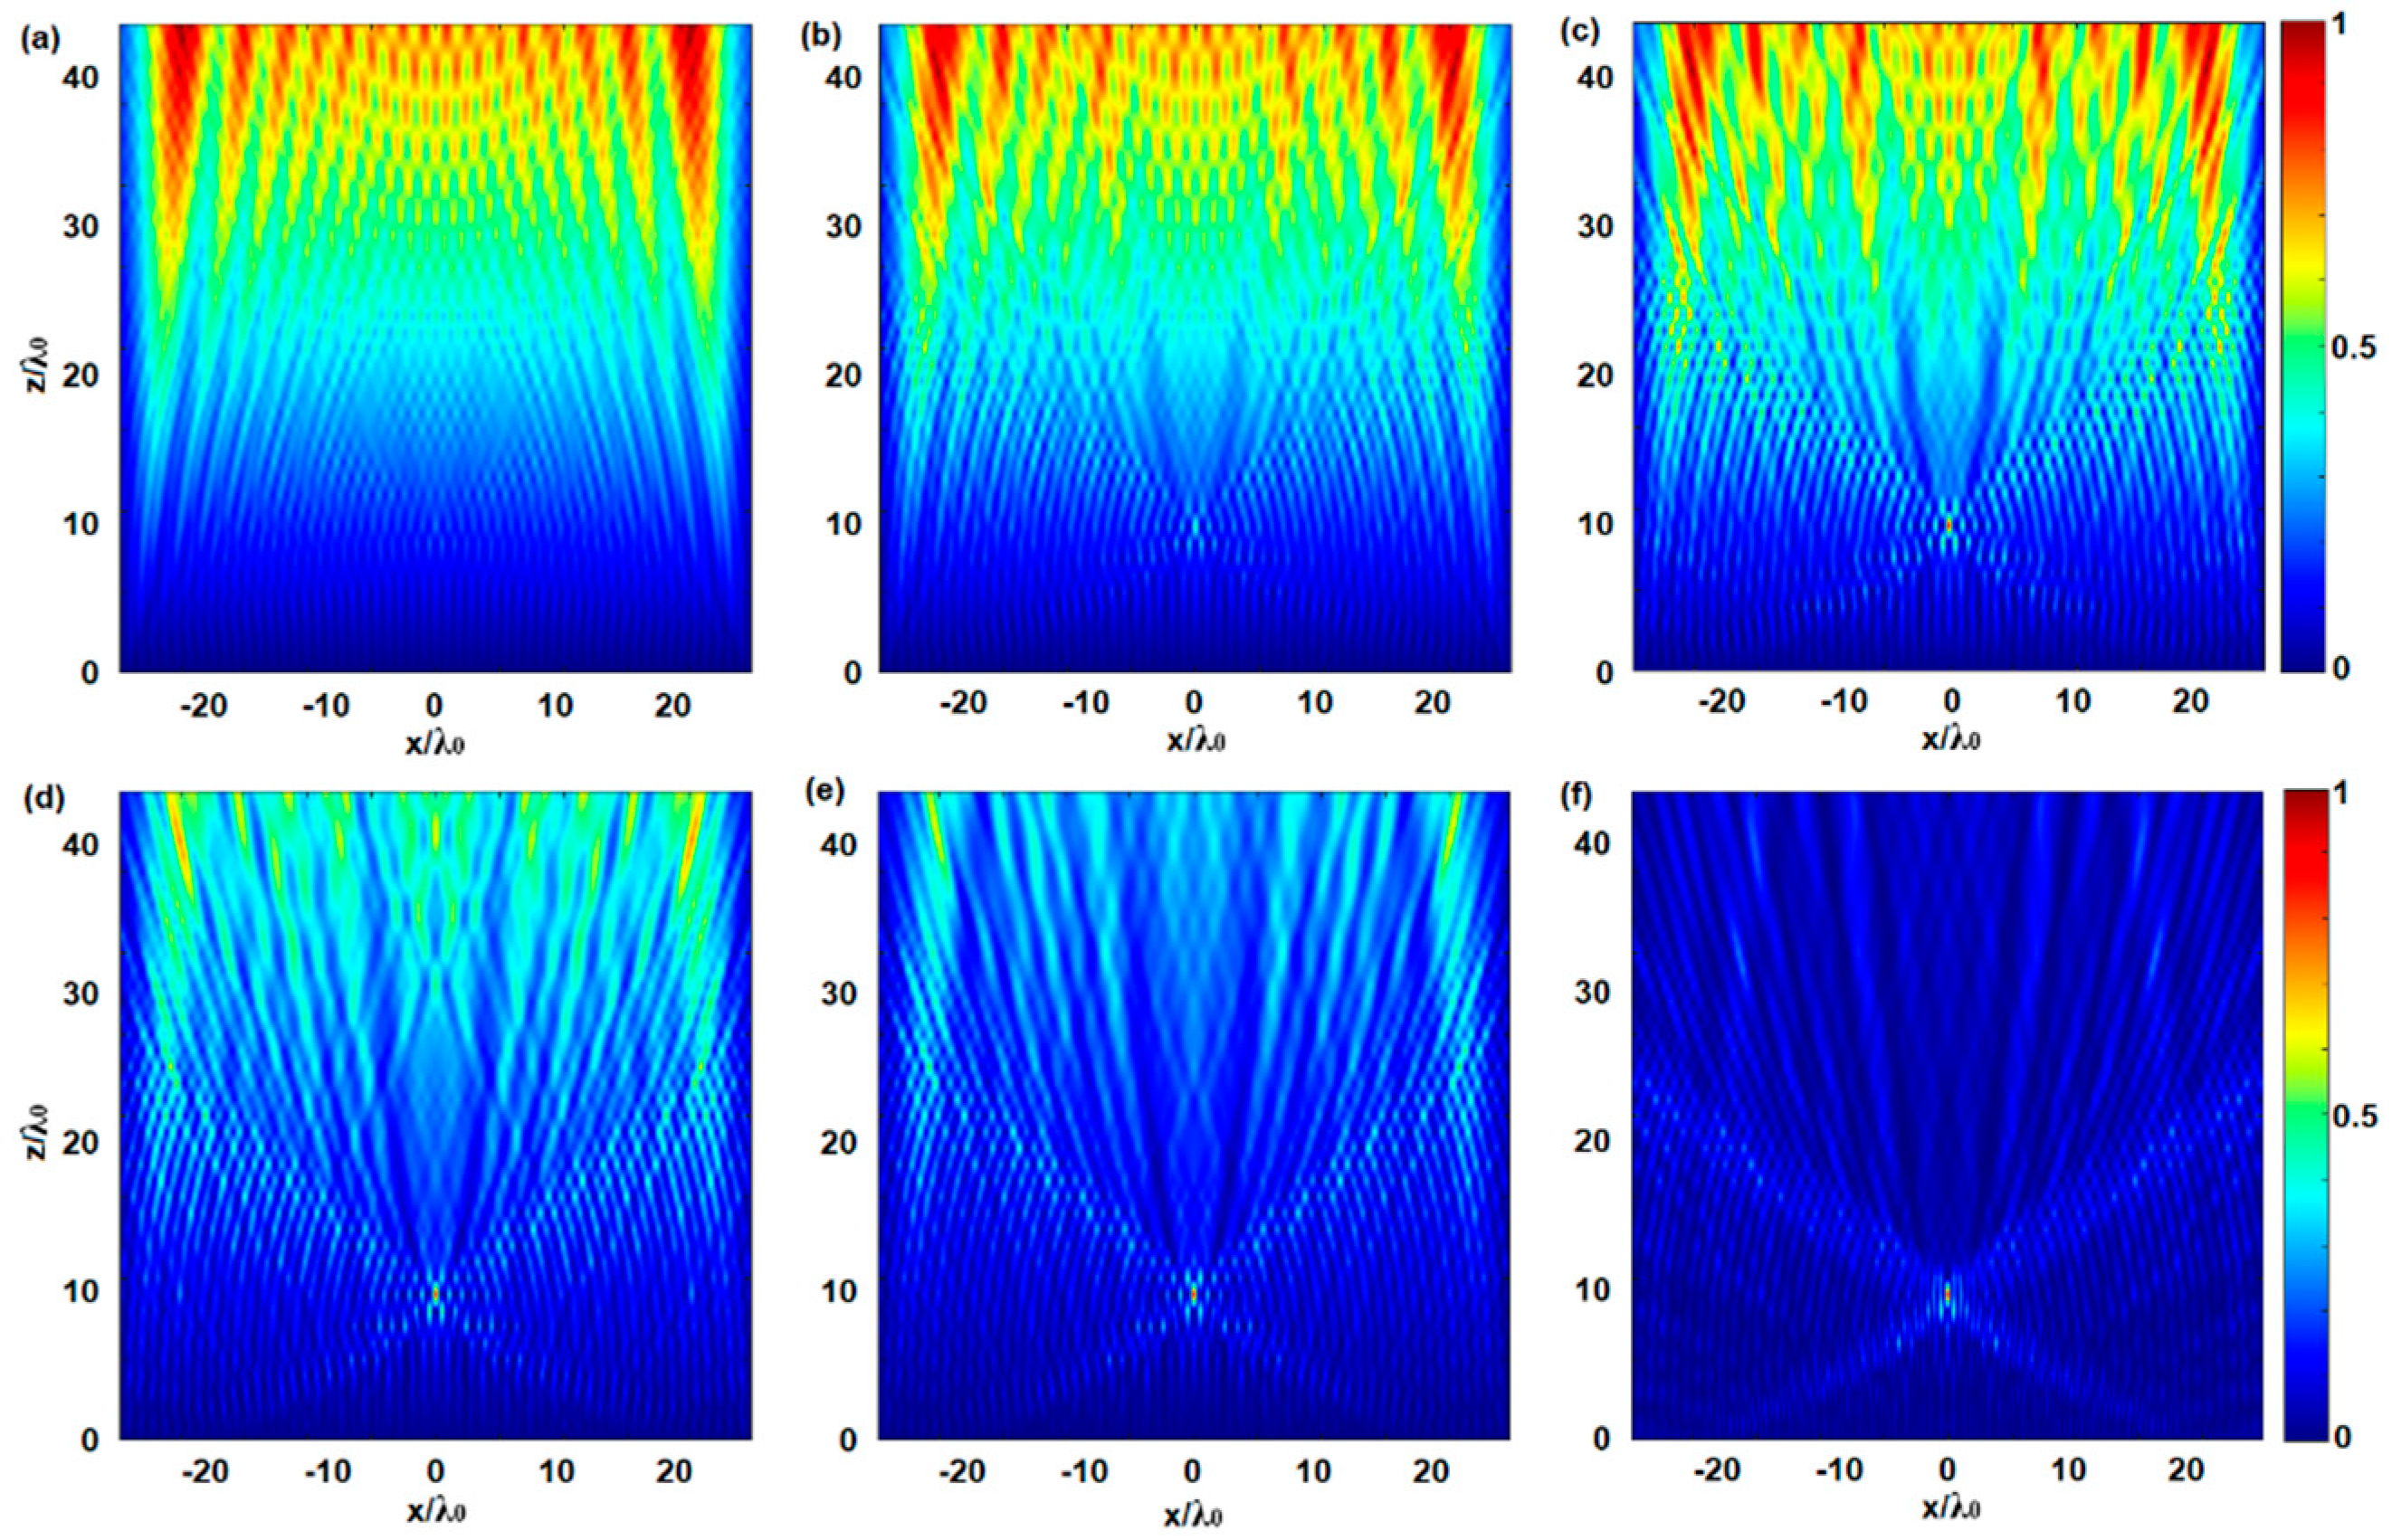
A set of preliminary tests was carried out to determine which parameters of the unit cells would allow our algorithm to converge to a better solution. The results obtained (see Figure A2) showed that a phase difference of at least π/6 rad between the transmission coefficient of the even and odd zones was necessary to obtain a high energy subwavelength focus at the output.
Figure A2.
Maps showing the normalized power distribution in the xz-plane considering a phase difference between the even and odd zones unit cells (in rads) of (a) π/90; (b) π/22; (c) π/11; (d) π/7.5; (e) π/6; (f) π/2.5. The transmission coefficient magnitude is set to 0.8.
Figure A2.
Maps showing the normalized power distribution in the xz-plane considering a phase difference between the even and odd zones unit cells (in rads) of (a) π/90; (b) π/22; (c) π/11; (d) π/7.5; (e) π/6; (f) π/2.5. The transmission coefficient magnitude is set to 0.8.

References
- Born, M.; Wolf, E. Principles Of Optics, 7th ed.; Cambridge University Press: New York, NY, USA, 1999. [Google Scholar]
- Huang, K.; Qin, F.; Liu, H.; Ye, H.; Qiu, C.W.; Hong, M.; Luk’yanchuk, B.; Teng, J. Planar Diffractive Lenses: Fundamentals, Functionalities, and Applications. Adv. Mater. 2018, 30, 1–22. [Google Scholar] [CrossRef] [PubMed]
- Scheuer, J. Metasurfaces-based holography and beam shaping: Engineering the phase profile of light. Nanophotonics 2017, 6, 137–152. [Google Scholar] [CrossRef]
- Fang, N.; Lee, H.; Sun, C.; Zhang, X. Sub-diffraction-limited optical imaging with a silver superlens. Science 2005, 308, 534–537. [Google Scholar] [CrossRef] [PubMed]
- Lee, J.Y.; Hong, B.H.; Kim, W.Y.; Min, S.K.; Kim, Y.; Jouravlev, M.V.; Bose, R.; Kim, K.S.; Hwang, I.-C.; Kaufman, L.J.; et al. Near-field focusing and magnification through self-assembled nanoscale spherical lenses. Nature 2009, 460, 498–501. [Google Scholar] [CrossRef]
- Wang, Z.; Guo, W.; Li, L.; Luk’yanchuk, B.; Khan, A.; Liu, Z.; Chen, Z.; Hong, M. Optical virtual imaging at 50 nm lateral resolution with a white-light nanoscope. Nat. Commun. 2011, 2, 218. [Google Scholar] [CrossRef] [PubMed] [Green Version]
- Pacheco-Peña, V.; Beruete, M.; Minin, I.V.; Minin, O.V. Terajets produced by dielectric cuboids. Appl. Phys. Lett. 2014, 105, 084102. [Google Scholar] [CrossRef] [Green Version]
- Mansfield, S.M.; Kino, G.S. Solid immersion microscope. Appl. Phys. Lett. 1990, 57, 2615. [Google Scholar] [CrossRef]
- Leggett, A.J. How the result of a measurement of a component of the spin of a spin -1/2 particle can turn out to be 100. Phys. Rev. Lett. 1988, 60, 1351–1354. [Google Scholar] [CrossRef]
- Huang, F.M.; Zheludev, N.I. Super-resolution without evanescent waves. Nano Lett. 2009, 9, 1249–1254. [Google Scholar] [CrossRef]
- Rogers, E.T.F.; Lindberg, J.; Roy, T.; Savo, S.; Chad, J.E.; Dennis, M.R.; Zheludev, N.I. A super-oscillatory lens optical microscope for subwavelength imaging. Nat. Mater. 2012, 11, 432–435. [Google Scholar] [CrossRef]
- Yuan, G.H.; Rogers, E.T.; Zheludev, N.I. Achromatic super-oscillatory lenses with sub-wavelength focusing. Light Sci. Appl. 2017, 6, e17036. [Google Scholar] [CrossRef] [PubMed]
- Liu, T.; Tan, J.; Liu, J.; Wang, H. Vectorial design of super-oscillatory lens. Opt. Express 2013, 21, 15090–15101. [Google Scholar] [CrossRef] [PubMed]
- Chen, G.; Wu, Z.; Yu, A.; Zhang, K.; Wu, J.; Dai, L.; Wen, Z.; He, Y.; Zhang, Z.; Jiang, S.; et al. Planar binary-phase lens for super-oscillatory optical hollow needles. Sci. Rep. 2017, 7, 1–10. [Google Scholar] [CrossRef] [PubMed]
- Rogers, E.T.F.; Zheludev, N.I. Optical super-oscillations: Sub-wavelength light focusing and super-resolution imaging. J. Opt. 2013, 15, 094008. [Google Scholar] [CrossRef]
- Huang, K.; Ye, H.; Teng, J.; Yeo, S.P.; Luk’yanchuk, B.; Qiu, C.-W. Optimization-free superoscillatory lens using phase and amplitude masks. Laser Photon. Rev. 2014, 8, 152–157. [Google Scholar] [CrossRef]
- Tseng, M.L.; Hsiao, H.H.; Chu, C.H.; Chen, M.K.; Sun, G.; Liu, A.Q.; Tsai, D.P. Metalenses: Advances and Applications. Adv. Opt. Mater. 2018, 6, 1–16. [Google Scholar] [CrossRef]
- Pacheco-Peña, V.; Engheta, N.; Kuznetsov, S.; Gentselev, A.; Beruete, M. Experimental Realization of an Epsilon-Near-Zero Graded-Index Metalens at Terahertz Frequencies. Phys. Rev. Appl. 2017, 8, 034036. [Google Scholar] [CrossRef]
- Orazbayev, B.; Beruete, M.; Pacheco-Peña, V.; Crespo, G.; Teniente, J.; Navarro-Cía, M. Soret Fishnet Metalens Antenna. Sci. Rep. 2015, 4, 9988. [Google Scholar] [CrossRef] [Green Version]
- Pacheco-Peña, V.; Orazbayev, B.; Torres, V.; Beruete, M.; Navarro-Cía, M. Ultra-compact planoconcave zoned metallic lens based on the fishnet metamaterial. Appl. Phys. Lett. 2013, 103, 183507. [Google Scholar] [CrossRef] [Green Version]
- Jin, N.; Rahmat-Samii, Y. Advances in Particle Swarm Optimization for Antenna Designs: Real-Number, Binary, Single-Objective and Multiobjective Implementations. IEEE Trans. Antennas Propag. 2007, 55, 556–567. [Google Scholar] [CrossRef]
- Rogers, K.S.; Bourdakos, K.N.; Yuan, G.H.; Mahajan, S.; Rogers, E.T.F. Optimising superoscillatory spots for far-field super-resolution imaging. Opt. Express 2018, 26, 8095. [Google Scholar] [CrossRef] [PubMed]
- Li, Z.; Zhang, T.; Wang, Y.; Kong, W.; Zhang, J.; Huang, Y.; Wang, C.; Li, X.; Pu, M.; Luo, X. Achromatic Broadband Super-Resolution Imaging by Super-Oscillatory Metasurface. Laser Photonics Rev. 2018, 12, 1800064. [Google Scholar] [CrossRef]
- Dong, X.H.; Wong, A.M.H.; Kim, M.; Eleftheriades, G.V. Superresolution far-field imaging of complex objects using reduced superoscillating ripples. Optica 2017, 4, 1126. [Google Scholar] [CrossRef]
- Kennedy, J.; Eberhart, R.C. A discrete binary version of the particle swarm algorithm. In Proceedings of the 1997 IEEE International Conference on Systems, Man, and Cybernetics, Computational Cybernetics and Simulation, Orlando, FL, USA, 12–15 October 1997; Volume 5, pp. 4104–4108. [Google Scholar]
Figure 1.
(a) Hexagonal unit cell proposed along with its geometrical parameters: Lhex = 200 µm, α varying from 20 to 80 µm, Δr = 30 µm, metal thickness hm = 0.6 µm, dielectric height hd = 35 µm. The metallic material (in grey) is copper, and the dielectric substrate (in blue) is polypropylene. (b) Normalized magnitude and (c) phase (in radians) maps of the transmission coefficient of the unit cell as a function of the parameter α and frequency. (d) Full metalens schematic and (e) zoomed view of the metalens central zones. In (f,g) are shown the unit cells of the even and odd zones, respectively. (h) Diagram showing the unit cell distribution of the designed cylindrical lens. Green and cyan squares represent a unit cell of type (f) or (g) respectively. For representation purposes, they have been shifted vertically, although, in the designed lens, they are all aligned along the x axis. The dark blue background is included only to enhance the contrast and help visualization.

Figure 2.
Normalized power distribution after (a) random start; (b) end of 1st step; and (c) end of 2nd step.
Figure 2.
Normalized power distribution after (a) random start; (b) end of 1st step; and (c) end of 2nd step.

Figure 3.
(a) Numerical results of the normalized power distribution along the x-axis at z = FL = 9.816λ0 for the cylindrical super-oscillatory lens (SOL). (b) Idem for the spherical SOL along both x and y-axes at z = FL = 9.162λ0.
Figure 3.
(a) Numerical results of the normalized power distribution along the x-axis at z = FL = 9.816λ0 for the cylindrical super-oscillatory lens (SOL). (b) Idem for the spherical SOL along both x and y-axes at z = FL = 9.162λ0.

Figure 4.
(a) Phase distribution in radians at z = FL = 9.162λ0, using the central point as phase reference. (b) Local wavenumber-vector distribution (blue) where the peaks indicate the super-oscillatory regions, and electric field intensity (dotted red) along radial direction, normalized to the maximum.

Figure 5.
Normalized power distribution on the xz-plane (a,d), yz-plane (b,e), and xy-plane (c,f), for both the simulated spherical lens (right column) and the analytical spherical lens (left column). The xy-plane is obtained at z = FL, with FL = 9.56λ0 in the simulated lens, and FL = 9.16λ0 in the analytical lens; the xz-plane is the H-plane, and the yz-plane is the E-plane.


Table 1.
Summary of the focusing properties of the studied SOL.
| Cylindrical SOL (Analytical) | Spherical SOL (Analytical) | Spherical SOL (Simulation) | |
|---|---|---|---|
| FL | 10λ0 | 9.16λ0 | 9.56λ0 |
| FWHMx | 0.36λ0 | 0.46λ0 | 0.44λ0 |
| FWHMy | - | 0.46λ0 | 0.5λ0 |
| Enhancement | - | 18.4 dB | 16.6 dB |
| Ellipticity | - | 1 | 0.88 |
| Depth of Focus | 1.14λ0 | 1.28λ0 | 1.51λ0 |
© 2018 by the authors. Licensee MDPI, Basel, Switzerland. This article is an open access article distributed under the terms and conditions of the Creative Commons Attribution (CC BY) license (http://creativecommons.org/licenses/by/4.0/).
Share and Cite
MDPI and ACS Style
Legaria, S.; Pacheco-Peña, V.; Beruete, M. Super-Oscillatory Metalens at Terahertz for Enhanced Focusing with Reduced Side Lobes. Photonics 2018, 5, 56. https://doi.org/10.3390/photonics5040056
AMA Style
Legaria S, Pacheco-Peña V, Beruete M. Super-Oscillatory Metalens at Terahertz for Enhanced Focusing with Reduced Side Lobes. Photonics. 2018; 5(4):56. https://doi.org/10.3390/photonics5040056
Chicago/Turabian StyleLegaria, Santiago, Victor Pacheco-Peña, and Miguel Beruete. 2018. "Super-Oscillatory Metalens at Terahertz for Enhanced Focusing with Reduced Side Lobes" Photonics 5, no. 4: 56. https://doi.org/10.3390/photonics5040056
Note that from the first issue of 2016, this journal uses article numbers instead of page numbers. See further details here.