Surface Plasmon Resonance Sensor Based on Polymer Liquid-Core Fiber for Refractive Index Detection


1
School of Control Engineering, Northeastern University at Qinhuangdao, Qinhuangdao 066000, China
2
College of Information Science and Engineering, Northeastern University, Shenyang 110004, China
3
Hebei Key Laboratory of Micro-Nano Precision Optical Sensing and Measurement Technology, Qinhuangdao 066004, China
*
Author to whom correspondence should be addressed.
Photonics 2020, 7(4), 123; https://doi.org/10.3390/photonics7040123
Submission received: 27 October 2020
/
Revised: 27 November 2020
/
Accepted: 30 November 2020
/
Published: 3 December 2020
(This article belongs to the Special Issue Optical Fiber Grating Sensing Technology and Application)
Abstract
:In this work, a surface plasmon resonance (SPR) sensor based on a novel liquid-core polymer optical fiber (POF) is proposed and numerically analyzed for refractive index (RI) detection. The polytetrafluoroethylene (PTFE) fiber is selected as the platform for SPR sensing. We combine the PTFE-based POF with the liquid-core structure by introducing a hole filled with analyte into the fiber center. The hole also acts as the fiber core to guide the incident light. This design helps to realize the detection of solutions with low RI values (around 1.33), while keeping the distinguished sensing characteristics of the liquid-core structure. Two side air holes are introduced into the cladding and a thin silver film protected by a titanium dioxide layer is plated on the wall of one air hole, which helps to control the mode coupling. In order to optimize the design of this sensor, the impacts of parameters such as metal layer thicknesses and the central hole radius are investigated using the full-vector finite element method (FEM). After optimization, our design shows a wavelength interrogation sensitivity reaching up to 16,750 nm/RIU and an average full-width at half-maximum (FWHM) of 42.86 nm in the RI range of 1.325–1.35.
1. Introduction
When electromagnetic waves and density waves from free electrons at the metal–dielectric interface become coupled, a so-called surface plasmon resonance (SPR) is stimulated, generating the surface plasmon polariton (SPP), which is extremely sensitive to the surrounding refractive index (RI) change. In 1993, the first optical fiber sensor based on the SPR effect was introduced by Jorgenson and Yee [1]. Since then, because of their unique characters, such as their capability for remote sensing, label-free detection, and their all-fiber configuration [2,3,4], these kinds of sensing devices have attracted great interest. So far, a variety of SPR sensors have been proposed for environmental RI detection, which can be mainly divided into prism-based [5,6,7] and optical-fiber-based [8,9,10] designs. Extremely high sensitivity (beyond 105 nm/RIU [11]) can be achieved by prism-based sensing systems, but their drawbacks, such as their heavy size, low mechanical strength, and costly interrogation, still need to be addressed. By contrast, optical-fiber-based SPR sensors possess the advantages of miniaturization, low cost, as well as high sensitivity. The key point in the design of such sensors is to ensure interaction between the photons and the surface electrons. For this purpose, commonly applied methods include partly or wholly removing the cladding [12,13] and depositing a metal film on the polishing surface, which can lead to leakage of the core mode energy and generation of the SPR. Other approaches take advantage of fibers with special microstructures and excite the SPR using the inner metal coating of the fibers, such as hollow fibers (HFs) [14], photonic crystal fibers (PCFs) [15], and multi-hole fibers [16]. Among various fiber structures, the liquid-core structure (created by pouring high RI analyte into a central hole in a fiber and using it as the core to guide the light, i.e., a HF) stands out due to its advantages, such as its simple structure, high sensitivity, and ease with which its excites the SPR.
However, liquid-core SPR sensors based on normal silica fibers also have some drawbacks. For example, they can only be used to detect liquids with a high RI. The stimulation of the SPR mainly relies on the evanescent waves generated by the total internal reflection (TIR). To meet the TIR condition, the analyte RI in the central hole needs to be higher than that of the silica cladding (around 1.45). However, for biochemical and environmental monitoring, detection often operates in a water-based solution, which has a relatively lower RI (around 1.33) compared with the fiber cladding. Some previous studies have made efforts to solve this problem. Biswas et al. [17] and Duan et al. [14] combined the liquid-core design with the PCF design. Both of their studies showed high linearity in the low RI range. However, these approaches have the drawback of limited sensitivity (2151 and 5653.57 nm/RIU, respectively). Liu et al. [18] proposed a novel multi-microfluidic-channel fiber SPR sensor, which also achieved an RI detection result of close to 1.33. However, their sensor mainly works in the visible waveband, which partially accounts for its relatively low sensitivity.
The use of optical fibers made out of different materials may be another possible solution. In this paper, we propose and analyze a special SPR sensor based on a polytetrafluoroethylene (PTEF) polymer optical fiber (POF) with a liquid-core structure. The design poses a novel modification to conventional silica-based liquid-core (HF) SPR sensors. A high RI liquid core and a low RI polymer cladding act together to confine and guide the light. On one hand, this design makes it possible for the sensor to generate evanescent waves when the RI of the liquid core is near 1.33. On the other hand, the incident light is directly guided in the analyte, potentially increasing the sensitivity. Additionally, we place two large side air holes in the cladding but coat the active material on the inner walls of only one of them. This will lead to a special limitation on the field distribution of the SPP modes, helping to control the interaction between the active material and the core modes. After adjusting the structure parameters, the proposed sensor can achieve both high sensitivity and a narrow full-width at half-maximum (FWHM) value in the near-infrared wavebands.
2. Materials and Methods
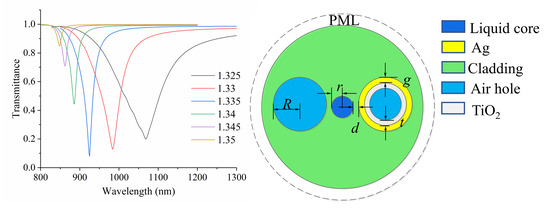
Figure 1 shows three-dimensional (3D) and cross-sectional views of the proposed sensor. Two identical air holes are symmetrically arranged on both sides of the core. Ag, depicted by a thin yellow layer in Figure 1b, is coated on the walls of only one hole. The TiO2 layer covering the Ag film not only protects the Ag from oxidation, but also contributes to the resonance modulation [19]. Deposition on both sides may cause unnecessarily large resonance loss; therefore, we chose a unilateral coating. As Figure 1 illustrates, the radii of the liquid core and the side air holes, the thicknesses of the Ag and TiO2 films, and the distance between the central and side holes are defined as r, R, g, t, and d, respectively. L represents the length of the sensor. In numerical analysis, a circular perfectly matched layer (PML) is arranged at the outermost point to eliminate the effect of scattered light. The material used for the polymer fiber is PTFE, the RI of which is around 1.3. Therefore, the proposed structure can satisfy the TIR condition when the RI of the liquid core is close to that of water. The good transparency of PTFE in the near-infrared waveband has been proven by others [20]. Owing to technology advances, certain techniques could be used to fabricate our special sensor described above. A previous study [21] reported the fabrication of a PTFE-based POF based on the stacking method. Another study [22] also proposed experimental methods in detail for the fabrication of micro-structured POFs, mainly using the draw method under special pressure and temperature control conditions. By applying tight control measures on the heat transfer and tension, it is possible to produce the proposed fiber using the stack-and-draw method. The formation of the liquid core requires use of the selective pouring method, which can be achieved using femtosecond-laser-assisted selective infiltration [23]. The Ag coating can be done using a combination of wet chemistry deposition [24] and selective pouring [23,25] techniques. Using fusion splicing, we first fully blocked the end of the fiber with a section of single-mode fiber (SMF). Then, the femtosecond-laser-drilling technique was used to open the required air hole. After this, wet chemistry deposition was applied to complete the selective Ag coating process.
As for the coating of TiO2, we considered applying the atomic layer deposition (ALD) technique. ALD is a vapor-phase deposition method. Because of the cyclic and self-saturating nature of its reaction, the ALD shows excellent conformality over complicated structures and precise thickness control ability at the Angstrom level [26]. By using ALD, [27] performed TiO2 layer deposition on Ag nanorods under mild conditions (around 80 °C, completely tolerable for our fiber and Ag layer). On the other hand, the application of the thin-film vapor deposition on the inner walls of a micro-structured optical fiber has also been proven feasible [28]. Based on the above studies, the TiO2 inner coating process was designed. By taking advantage of the air hole opened for the Ag deposition, the gaseous precursors were alternately pulsed into the air hole, causing a reaction and forming the thin TiO2 layer. The thickness was precisely controlled via the numbers of the cycle.
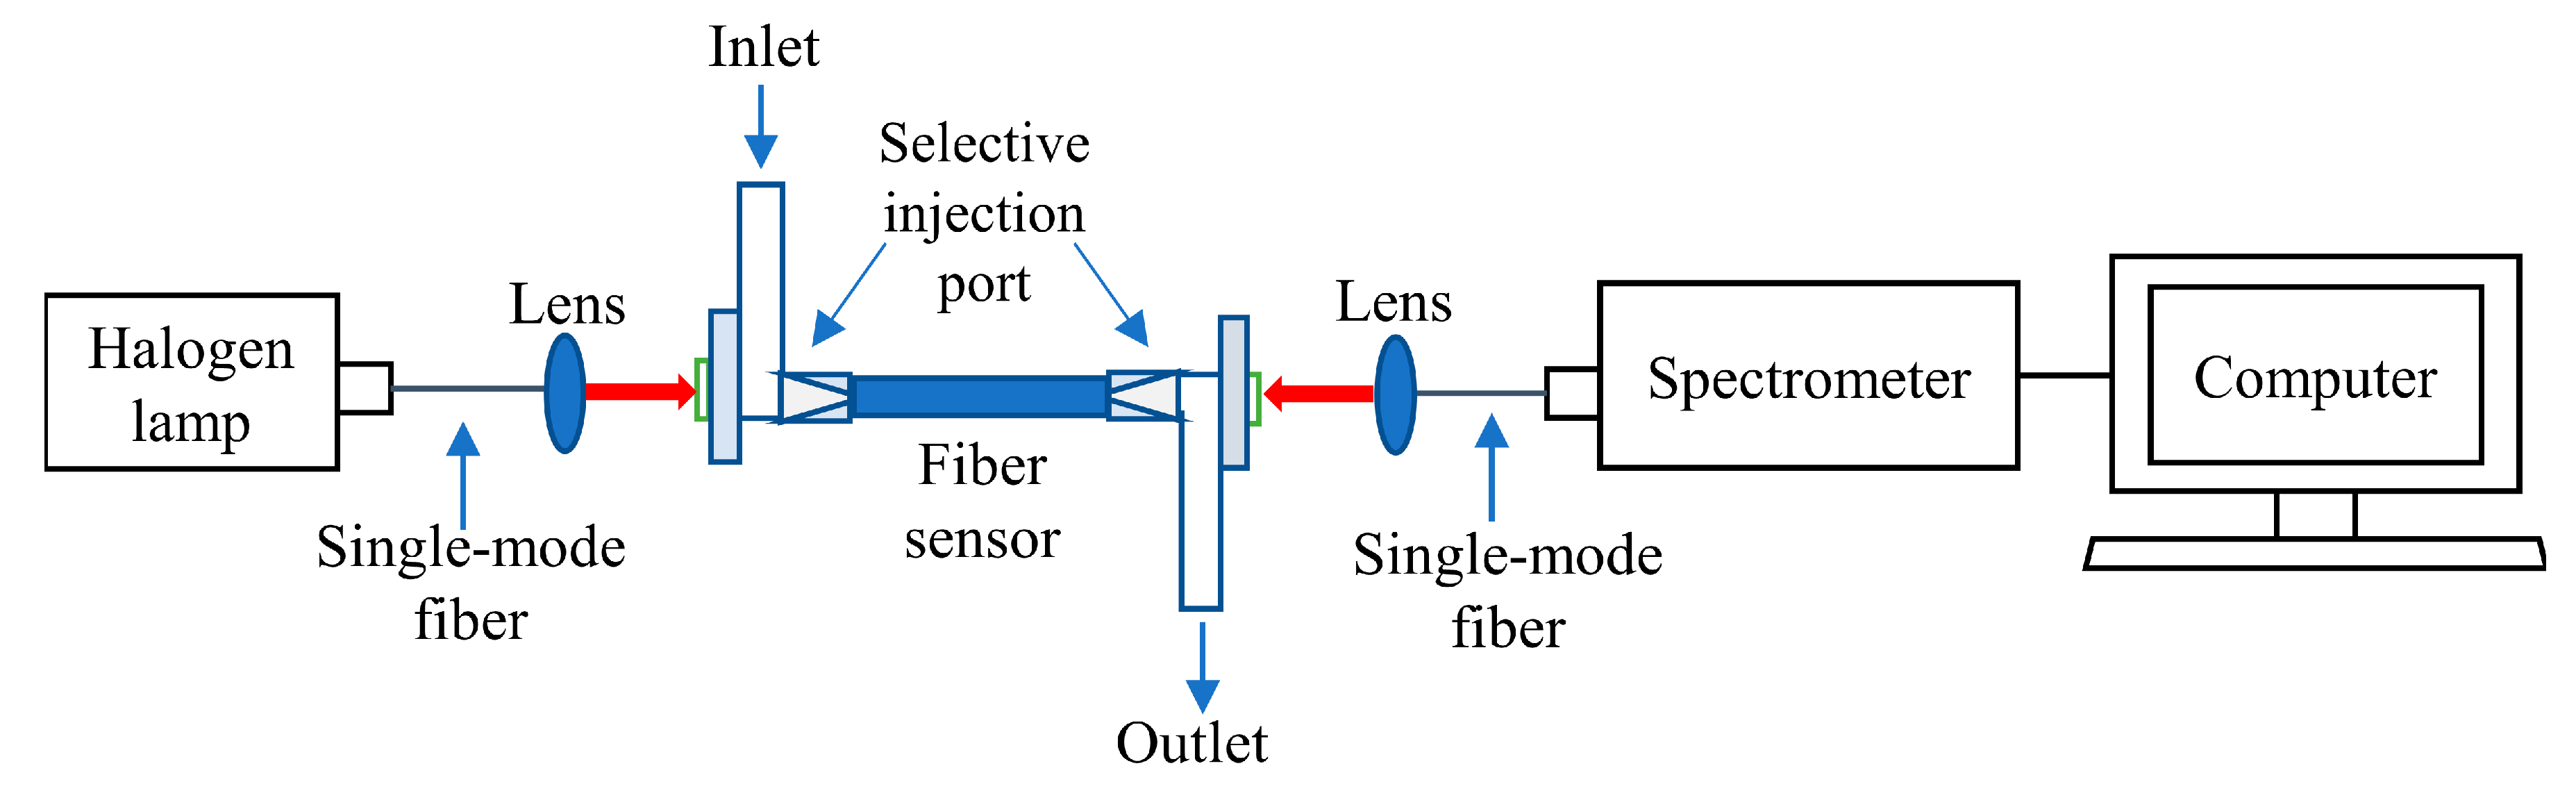
The possible experimental setup of the proposed sensing system is illustrated in Figure 2 [19]. By using a peristaltic pump, the liquid sensing medium could be poured into the central microfluidic channel through the selective injection port. The broadband source generated by the halogen lamp was launched into the sensor through free-space coupling [29]. The transmission spectra were measured using a spectrometer. The dispersion characteristics of the Ag and TiO2 layers are incorporated in simulation according to the experimental data from Babar and Weaver [30] and Siefke et al. [31], respectively. The RI of the PTFE in the corresponding waveband was fitted by Sellmeier equations [20]:
where A, Bi, and Ci are the Sellmeier coefficients. Here, A = 1.517, B1 = 0.184, B2 = 1, C1 = 0.016 μm2, and C2 = 104.66 μm2, according to [20]. Additionally, λ is the operating wavelength in the micrometer. The simulation was conducted using COMSOL Multiphysics based on the finite element method (FEM). Mode analysis was performed on the x-y plane, i.e., the cross-section plane, as shown in Figure 1b. After discretizing the cross-section plane into triangular domain elements, Maxwell’s equations were applied to each element. The calculation model contained 68,434 domain elements, 6662 boundary elements, and 479,279 degrees of freedom. The final global solution was obtained by combining all of these solutions. The complex effective refractive index (neff) of the different modes was also derived from the above, the imaginary part of which represents the loss of light energy. Therefore, the transmittance can be calculated by [32]:
where the operator imag (•) extracts the imaginary part of the neff and L is the length of the sensor. From this expression, we can observe that L only affects the intensity of the transmittance, which we fixed to 5 mm in our study. By setting corresponding parameters and doing a sweep over the wavelength, we obtained the curves of the transmittance spectrum.
3. Results
The simulation results of the coupling characters of our sensor are shown in Figure 3. Only one obvious resonance can be observed, which happens between the x-polarized HE11 (HE11x) mode (Figure 3d) and fundamental SPP modes (Figure 3e). Figure 3b clearly shows that the curve of Re(neff), i.e., the real part of the neff, of the fundamental SPP mode and the HE11x mode become intersected. According to the coupling mode theory (CMT), this causes the resonance between the HE11x and the fundamental SPP. On the contrary, the transmittance of the y-polarized HE11 (HE11y) mode (Figure 3c) shows no significant change in the corresponding waveband, as shown in Figure 3a. This means the HE11y mode barely interacts with the active layer. This phenomenon can be explained by our unique design. Because of the large radii ratio between the air hole and the liquid core, in the area near to the fiber core the metal layer is composed of a straight segment perpendicular to the x-axis. Noting that the mode field of the fundamental SPP is also limited near the core (Figure 4a), this makes the resonance of the proposed design similar to that of the side-polished fiber SPR sensor. According to [19,35], only the x-polarized mode could interact with the active layer effectively under such circumstances. In the proposed structure, cylindrical active material layers produce multi-order SPP modes. Several low-order SPP modes are illustrated in Figure 4. We can observe that the Re(neff) of these modes is decreased while their orders are increased. These low-order modes also have Re(neff) values close to those of the core modes. According to the CMT, it is possible for them to interact with the core modes and deform the spectrum.
However, as a result of the large radius of the air hole, the fields of these modes are distant from the core. As shown in Figure 4b–h, the possible field overlaps between these SPP modes and the core modes are small. Only the fundamental SPP mode has a large field overlap with the core modes (Figure 4a). As for the higher-order SPP modes, following the regularity observed, they will have a lower Re(neff), which means they will not be able to satisfy the phase-matching condition. In conclusion, other than the fundamental mode, these SPP modes have almost no chance of resonating with the core modes. Based on this observation and the analysis above, we find that the transmittance spectra of the sensor will be dominated by the interaction between the HE11x and the fundamental SPP mode. Hence, we will focus on this resonance in the following discussion.
4. Discussion
4.1. Evaluation of Ag Thickness on Sensing Performance
The active layer directly affects the coupling effect. Since its material has been assessed as Ag, the thickness of the metal membrane is our main concern. The parameter range we investigated was preliminarily determined to 30–70 nm (the other parameters are fixed: t = 70 nm, d = 0.8 μm, r = 3 μm, R = 20 μm, analyte RI = 1.34).
Figure 5a plots the calculated transmittance of the system with different values of g. As Figure 5b illustrates, both the sensitivity and FWHM of the spectra become small with the increasing thickness of the Ag membrane. There is also a blue shift of the phase-matching point (Figure 5a). We infer that with the increase of g, the neff of the SPP mode will drop. Thus, the phase-matching point will shift to a shorter waveband. Additionally, the penetration depth of the evanescent wave will be reduced along with the blue shift, resulting in a weaker resonance. This also accounts for the decreased sensitivity and FWHM, which was caused by the blue shift and is also in accordance with a previous study [8].
When the Ag thickness is 30 nm, the sensitivity of the sensor reaches its maximum, but the corresponding FWHM exceeds 120 nm. A similar contradiction occurs when the thickness is 70 nm, whereby the FWHM is optimal but the sensitivity is minimal. To obtain an acceptable level of performance, we optimized this parameter to 60 nm according to the principle for FOM maximization.
4.2. Evaluation of Effect of TiO2 Thickness on Sensing Performance
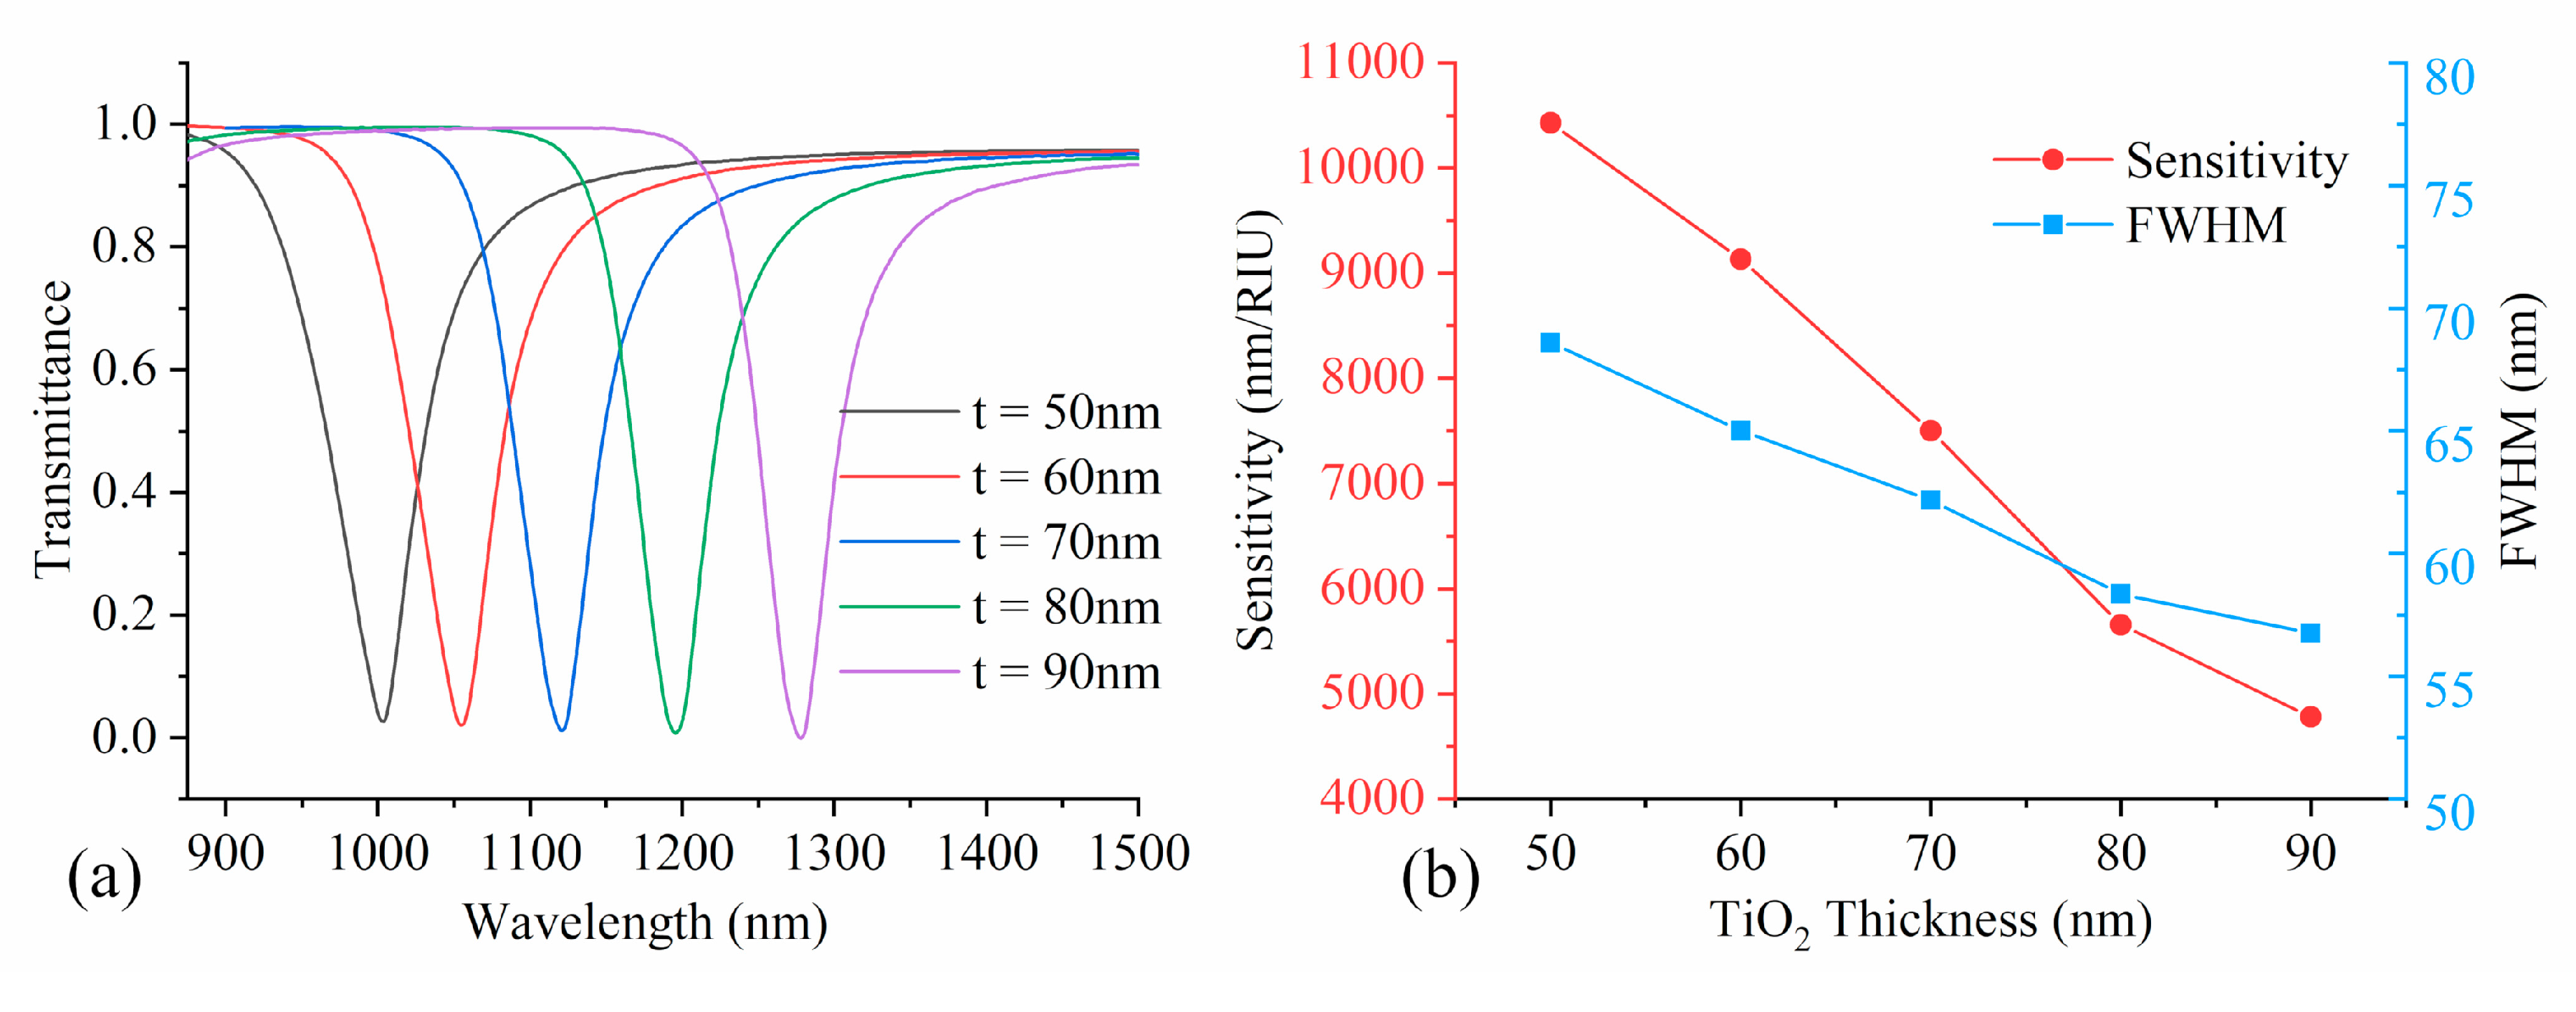
We now focus on the effect of the TiO2 layer thickness (the other parameters are fixed: g = 40 nm, d = 0.8 μm, r = 3 μm, R = 20 μm, analyte RI = 1.34). As Figure 6a depicts, we can observe the red shift of spectra when the TiO2 layer grows thicker. At the same time, both the sensitivity and FWHM decrease (Figure 6b). As in the analysis above, we can infer that the neff of the SPP mode would increase along with t, causing the red shift of the spectra. As for the decrease in sensitivity and FWHM, we can observe an energy transfer from the SPP of Ag (Figure 7a) to that of TiO2 (Figure 7b) when t increases. While the total loss almost remains the same (the transmittance at the resonance wavelength does not obviously change), the thickening of the TiO2 layer seems to strengthen its SPP and reduce the intensity of the resonance between the Ag layer and the core mode. Moreover, the SPP of the TiO2 layer is distributed at the interface between the metal layer and the air, making no contribution to the sensing. Hence, with increasing t, the sensitivity will significantly drop and the FWHM will become narrower. The optimal t we chose was 50 nm, which maximizes the FOM.
4.3. Evaluation of Effect of Central Hole Radius on Sensing Performance
We finally explore the impact of the liquid core radius (the other parameters are fixed: g = 40 nm, t = 50 nm, d = 1 μm, R = 18 μm, analyte RI = 1.34). The results are shown in Figure 8. From Figure 8a, we can observe an increase in the transmittance at the phase-matching points, along with an increase of r. In this process, the FWHM decreases and the sensitivity continues to increase, as illustrated in Figure 8b. When r is small, the field area of the core mode is also small. As a result, the core mode becomes impressionable and easily influenced by resonance, leading to the extension of the resonance waveband and a large FWHM. The susceptibility of the core mode should also lead to greater sensitivity. However, the amount of analyte in the central hole is small in this circumstance, which limits the efficiency of the resonance and causes low sensitivity. Accompanied by the increase of r, the sensitivity would first obviously increase because the analyte increases. Then, as a result of the trade-off between the increased analyte and increased mode stability, the sensitivity would increase relatively slowly. A bigger core could transfer more light energy, which would also lead to an increment in the transmittance at the resonance wavelength. The final value of r was determined to be 3.5 μm to maximize the FOM.
4.4. Sensing Performance with Optimal Parameters
After simulating the performance of the proposed sensor with the optimal parameters, we plotted the transmittance spectra in Figure 9a, as the analyte RI changed from 1.325 to 1.35. Based on this result, we performed an exponential fitting to the relation between the resonance wavelength and the analyte RI, as illustrated in Figure 9b. The results show that the sensor has a reliable exponential response (R2 = 0.9984) and resolution reaching up to 5.97 × 10⁻⁶ RIU in this RI range, guaranteeing its high precision in applications such as biomass sensing. From Figure 10, we can observe that our sensor has high sensitivity, reaching up to 16,750 nm/RIU when applied to the low RI solution. As the analyte’s RI grows higher, there is a blue shift in the resonance wavelength, which is in accordance with the results for other liquid-core sensors [14,19]. With the increasing RI, the sensitivity decreases and the FWHM becomes narrower. Similar to the discussion for g, this phenomenon is caused by the blue shift of the phase-matching point. In the liquid-core sensor, when the analyte RI increases, the neff of the core mode will also increase, causing the blue shift of the phase-matching point. The penetration depth of the incident light will drop in the shorter wavebands, which makes it difficult for the resonance to detect and follow the change in analyte RI. Therefore, as the analyte RI increases, the sensitivity will drop, while the resonance waveband will narrow and FWHM will decrease. In Figure 9a, the transmittance at the resonance wavelength goes through a cycle of falling and rising. It first drops with the increment of RI and reaches its minimum at RI = 1.335, then increases along with the increasing analyte RI. The reason for this could be that the neff values of the core mode and the SPP mode are closest at analyte RI = 1.335. This will produce the strongest coupling, therefore causing the lowest transmittance, which is similar to [19]. We list all of the optimal parameters in Table 1 and offer a sensing performance comparison between our design and other studies in Table 2. As shown in Table 2, the SPR sensors based on silica HFs (liquid-core structure) generally show higher sensitivity in the high RI range. In contrast, our design achieves both high sensitivity and a large FOM in the low RI range, offering a new solution for low RI detection.
5. Conclusions
The properties of the SPR sensor based on a novel liquid-core polymer fiber are numerically investigated and discussed in this paper. Two side air holes are introduced into the cladding of the PTFE-based POF to manipulate the resonance. Ag is deposited onto the inner walls of one side air hole with the protection of TiO2 to excite the SPR. The incident light is directly guided in the analyte, potentially improving the sensitivity of the sensor. After applying the optimized parameters, the sensor obtains a maximal wavelength interrogation sensitivity of 16,750 nm/RIU, an average FWHM of 42.86 nm, and an average FOM of 310.6 RIU−1. Due to the restrictions of the TIR condition, the traditional liquid-core fiber SPR sensor is more suitable for high RI medium sensing, such as glycerine. Some previous studies have tried to make modifications to the liquid-core design and have achieved low RI detection, but have also faced some drawbacks regarding certain aspects. Compared with these studies, our design is characterized by well-rounded properties, including high sensitivity, narrow FWHM, as well as a proper RI detection range. The proposed sensor is also experimentally feasible with current mature techniques. Considering all of the above points, we regard it as a candidate with great potential, which could be integrated into a lab-on-fiber sensing system.
Author Contributions
Conceptualization, X.S. and X.J.; methodology, Q.G.; software, X.J.; validation, X.S., X.J., and G.S.; formal analysis, X.J.; resources, X.J.; writing—original draft preparation, X.S.; writing—review and editing, G.S.; visualization, X.J.; supervision, G.S.; project administration, G.S.; funding acquisition, X.J. All authors have read and agreed to the published version of the manuscript.
Funding
This research was funded by the Natural Science Foundation of Hebei Province (Grant No. F2018501063), the Fundamental Research Funds for the Central Universities Key Scientific Research Guidance Project (Grant No. N2023005), and the Hebei Province Science and Technology Plan Key Research Development Project Funds (Grant No. 18273902D).
Conflicts of Interest
The authors declare no conflict of interest.
References
- Jorgenson, R.C.; Yee, S.S. A fiber-optic chemical sensor based on surface plasmon resonance. Sens. Actuators B Chem. 1993, 12, 213–220. [Google Scholar] [CrossRef]
- Scarano, S.; Mariani, S.; Minunni, M. SPR-Based Affinity Biosensors as Innovative Analytical Devices. J. Light. Technol. 2015, 33, 3374–3384. [Google Scholar] [CrossRef]
- Mishra, S.K.; Gupta, B.D. Surface Plasmon Resonance-Based Fiber Optic Chlorine Gas Sensor Utilizing Indium-Oxide-Doped Tin Oxide Film. J. Light. Technol. 2015, 33, 2770–2776. [Google Scholar] [CrossRef]
- Tripathi, S.M.; Bock, W.J.; Mikulic, P.; Chinnappan, R.; Ng, A.; Tolba, M.; Zourob, M. Long period grating based biosensor for the detection of Escherichia coli bacteria. Biosens. Bioelectron. 2012, 35, 308–312. [Google Scholar] [CrossRef]
- Kumar, R.; Kushwaha, A.S.; Srivastava, M.; Mishra, H.; Srivastava, S.K. Enhancement in sensitivity of graphene-based zinc oxide assisted bimetallic surface plasmon resonance (SPR) biosensor. Appl. Phys. A 2018, 124, 235. [Google Scholar] [CrossRef]
- Wu, L.; Jia, Y.; Jiang, L.; Guo, J.; Dai, X.; Xiang, Y.; Fan, D. Sensitivity Improved SPR Biosensor Based on the MoS2/Graphene–Aluminum Hybrid Structure. J. Light. Technol. 2017, 35, 82–87. [Google Scholar] [CrossRef]
- Shibayama, J.; Takeuchi, T.; Goto, N.; Yamauchi, J.; Nakano, H. Numerical Investigation of a Kretschmann-Type Surface Plasmon Resonance Waveguide Sensor. J. Light. Technol. 2007, 25, 2605–2611. [Google Scholar] [CrossRef] [Green Version]
- Jing, J.-Y.; Li, S.-Y.; Wang, X.-Z.; Zhu, Q.; Meng, F.-L.; Wang, Q. A D-type fiber based symmetrical long-range surface plasmon resonance sensor with high quality factor. Measurement 2019, 140, 395–406. [Google Scholar] [CrossRef]
- Haque, E.; Hossain, M.A.; Ahmed, F.; Namihira, Y. Surface Plasmon Resonance Sensor Based on Modified D -Shaped Photonic Crystal Fiber for Wider Range of Refractive Index Detection. IEEE Sens. J. 2018, 18, 8287–8293. [Google Scholar] [CrossRef]
- Zhao, L.; Han, H.; Lian, Y.; Luan, N.; Liu, J. Theoretical analysis of all-solid D-type photonic crystal fiber based plasmonic sensor for refractive index and temperature sensing. Opt. Fiber Technol. 2019, 50, 165–171. [Google Scholar] [CrossRef]
- Lam, W.W.; Chu, L.H.; Wong, C.L.; Zhang, Y.T. A surface plasmon resonance system for the measurement of glucose in aqueous solution. Sens. Actuators B Chem. 2005, 105, 138–143. [Google Scholar] [CrossRef]
- Aray, A.; Saghafifar, H.; Soltanolkotabi, M. Calculation of Dispersion Relation and Single Mode Operation in Surface Plasmon Resonance Based Fiber Optic Refractive Index Sensors. J. Light. Technol. 2016, 34, 2782–2788. [Google Scholar] [CrossRef]
- Wang, X.; Zhao, C.; Wang, Y.; Shen, C.; Dong, X. A Highly Sensitive Fibre-Optic Nano-Displacement Sensor Based on Surface Plasmon Resonance. J. Light. Technol. 2016, 34, 2324–2330. [Google Scholar] [CrossRef]
- Duan, L.; Yang, X.; Lu, Y.; Yao, J. Hollow-fiber-based surface plasmon resonance sensor with large refractive index detection range and high linearity. Appl. Opt. 2017, 56, 9907–9912. [Google Scholar] [CrossRef]
- Mahfuz, M.A.; Mollah, M.A.; Momota, M.R.; Paul, A.K.; Masud, A.; Akter, S.; Hasan, M.R. Highly sensitive photonic crystal fiber plasmonic biosensor: Design and analysis. Opt. Mater. Amst. 2019, 90, 315–321. [Google Scholar] [CrossRef]
- Gao, D.; Guan, C.; Wen, Y.; Zhong, X.; Yuan, L. Multi-hole fiber based surface plasmon resonance sensor operated at near-infrared wavelengths. Opt. Commun. 2014, 313, 94–98. [Google Scholar] [CrossRef]
- Biswas, T.; Chattopadhyay, R.; Bhadra, S.K. Plasmonic hollow-core photonic band gap fiber for efficient sensing of biofluids. J. Opt. 2014, 16, 45001. [Google Scholar] [CrossRef]
- Liu, Z.; Yang, X.; Zhang, Y.; Zhang, Y.; Zhu, Z.; Yang, X.; Zhang, J.; Yang, J.; Yuan, L. Hollow fiber SPR sensor available for microfluidic chip. Sens. Actuators B Chem. 2018, 265, 211–216. [Google Scholar] [CrossRef]
- De, M.; Singh, V.K. Analysis of a highly sensitive flat fiber plasmonic refractive index sensor. Appl. Opt. 2020, 59, 380–388. [Google Scholar] [CrossRef]
- Yang, M.K.; French, R.H.; Tokarsky, E.W. Optical properties of Teflon® AF amorphous fluoropolymers. J. Micro/Nanolithogr. MEMS MOEMS 2008, 7, 1–9. [Google Scholar] [CrossRef]
- Goto, M.; Quema, A.; Takahashi, H.; Ono, S.; Sarukura, N. Teflon Photonic Crystal Fiber as Terahertz Waveguide. Jpn. J. Appl. Phys. 2004, 43, L317–L319. [Google Scholar] [CrossRef]
- Arrospide, E.; Durana, G.; Azkune, M.; Aldabaldetreku, G.; Bikandi, I.; Ruiz-Rubio, L.; Zubia, J. Polymers beyond standard optical fibres—Fabrication of microstructured polymer optical fibres. Polym. Int. 2018, 67, 1155–1163. [Google Scholar] [CrossRef]
- Wang, Y.; Liao, C.R.; Wang, D.N. Femtosecond laser-assisted selective infiltration of microstructured optical fibers. Opt. Express 2010, 18, 18056–18060. [Google Scholar] [CrossRef] [PubMed] [Green Version]
- Liu, B.-H.; Jiang, Y.-X.; Zhu, X.-S.; Tang, X.-L.; Shi, Y.-W. Hollow fiber surface plasmon resonance sensor for the detection of liquid with high refractive index. Opt. Express 2013, 21, 32349–32357. [Google Scholar] [CrossRef] [PubMed]
- Yang, X.; Lu, Y.; Liu, B.; Yao, J. Design of a Tunable Single-Polarization Photonic Crystal Fiber Filter With Silver-Coated and Liquid-Filled Air Holes. IEEE Photonics J. 2017, 9, 1–8. [Google Scholar] [CrossRef]
- Johnson, R.W.; Hultqvist, A.; Bent, S.F. A brief review of atomic layer deposition: From fundamentals to applications. Mater. Today 2014, 17, 236–246. [Google Scholar] [CrossRef]
- Ma, L.; Huang, Y.; Hou, M.; Xie, Z.; Zhang, Z. Ag Nanorods Coated with Ultrathin TiO2 Shells as Stable and Recyclable SERS Substrates. Sci. Rep. 2015, 5, 15442. [Google Scholar] [CrossRef] [Green Version]
- Zuo, Y.; Yu, W.; Liu, C.; Cheng, X.; Qiao, R.; Liang, J.; Zhou, X.; Wang, J.; Wu, M.; Zhao, Y.; et al. Optical fibres with embedded two-dimensional materials for ultrahigh nonlinearity. Nat. Nanotechnol. 2020. [Google Scholar] [CrossRef]
- Zheng, D.; Li, Y.; Chen, E.; Li, B.; Kong, D.; Li, W.; Wu, J. Free-space to few-mode-fiber coupling under atmospheric turbulence. Opt. Express 2016, 24, 18739–18744. [Google Scholar] [CrossRef]
- Babar, S.; Weaver, J.H. Optical constants of Cu, Ag, and Au revisited. Appl. Opt. 2015, 54, 477–481. [Google Scholar] [CrossRef]
- Siefke, T.; Kroker, S.; Pfeiffer, K.; Puffky, O.; Dietrich, K.; Franta, D.; Ohlídal, I.; Szeghalmi, A.; Kley, E.-B.; Tünnermann, A. Materials Pushing the Application Limits of Wire Grid Polarizers further into the Deep Ultraviolet Spectral Range. Adv. Opt. Mater. 2016, 4, 1780–1786. [Google Scholar] [CrossRef]
- Dong, J.; Zhang, Y.; Wang, Y.; Yang, F.; Hu, S.; Chen, Y.; Zhu, W.; Qiu, W.; Guan, H.; Lu, H.; et al. Side-polished few-mode fiber based surface plasmon resonance biosensor. Opt. Express 2019, 27, 11348–11360. [Google Scholar] [CrossRef] [PubMed]
- Momota, M.R.; Hasan, M.R. Hollow-core silver coated photonic crystal fiber plasmonic sensor. Opt. Mater. Amst. 2018, 76, 287–294. [Google Scholar] [CrossRef]
- Hassani, A.; Skorobogatiy, M. Design criteria for microstructured-optical-fiber-based surface-plasmon-resonance sensors. J. Opt. Soc. Am. B 2007, 24, 1423–1429. [Google Scholar] [CrossRef]
- Zha, F.; Li, J.; Sun, P.; Ma, H. Highly sensitive selectively coated D-shape photonic crystal fibers for surface plasmon resonance sensing. Phys. Lett. A 2019, 383, 1825–1830. [Google Scholar] [CrossRef]
- Zhao, X.; Zhang, X.; Zhu, X.-S.; Shi, Y.-W. Long-range surface plasmon resonance sensor based on the GK570/Ag coated hollow fiber with an asymmetric layer structure. Opt. Express 2019, 27, 9550–9560. [Google Scholar] [CrossRef]
- Zhang, S.; Li, J.; Li, S. Design and numerical analysis of a novel dual-polarized refractive index sensor based on D-shaped photonic crystal fiber. Metrologia 2018, 55, 828–839. [Google Scholar] [CrossRef]
- Luan, N.; Yao, J. High Refractive Index Surface Plasmon Resonance Sensor Based on a Silver Wire Filled Hollow Fiber. IEEE Photonics J. 2016, 8, 1–9. [Google Scholar] [CrossRef]
Figure 1.
Three-dimensional (3D) (a) and cross-sectional (b) views of the proposed device. The outer diameter of the cladding is fixed to 125 μm and the thickness of the PML is 4 μm.
Figure 1.
Three-dimensional (3D) (a) and cross-sectional (b) views of the proposed device. The outer diameter of the cladding is fixed to 125 μm and the thickness of the PML is 4 μm.

Figure 2.
The system schematic designed for the experiment of the proposed sensor. The light path is constructed by the single-mode fiber (SMF) and the lens.
Figure 2.
The system schematic designed for the experiment of the proposed sensor. The light path is constructed by the single-mode fiber (SMF) and the lens.

Figure 3.
(a) The transmittances of the two core modes of the sensor. (b) Dispersion relations of the core modes and the fundamental surface plasmon polariton (SPP) mode for the proposed sensor. Re(neff) is the real part of the effective refractive index of modes (neff). (c–f) Electric field distribution of the different modes. The black arrows are the indicators of the polarization direction. (c) Y-polarized HE11 (HE11y) mode. (d) X-polarized HE11 (HE11x) mode. (e) Fundamental SPP mode. (f) Resonance between the HE11x and the SPP. The simulation parameters are: analyte RI = 1.33, r = 3μm, R = 20 μm, g = 40 nm, t = 50 nm, and d = 1 μm.

Figure 4.
(a–h) Electric field distribution and the real part of the effective refractive index Re(neff) for low-order surface plasmon polariton (SPP) modes at the wavelength of 1.1 μm, from the fundamental order (a) to the 7th order (h) successively. The red arrows are the indicators of the polarization direction. The simulation parameters are the same as in Figure 3.

Figure 5.
(a) The resonance spectra of the proposed sensor with the variation of the Ag layer thickness g. (b) The full-width at half-maximum (FWHM) and sensitivity of the sensor under the different values of g. The figure of merit (FOM) values along with the increases of g: 70.9, 120.6, 144.9, 188.8, and 170.7.

Figure 6.
(a) The resonance spectra of the proposed sensor with different TiO2 layer thickness t. (b) The full-width at half-maximum (FWHM) and sensitivity of the sensor under the different values of t. The figure of merit (FOM) values along with the increases of t: 152.1, 140.4, 120.7, 96.8, and 84.3.

Figure 7.
The curve of the electric field intensity along the x-axis (the origin of the coordinates is situated at the center of the core). Insets: (a,b) represent the electric field distributions around the liquid core when t = 50 nm and 90 nm, respectively.
Figure 7.
The curve of the electric field intensity along the x-axis (the origin of the coordinates is situated at the center of the core). Insets: (a,b) represent the electric field distributions around the liquid core when t = 50 nm and 90 nm, respectively.

Figure 8.
(a) The resonance spectra of the proposed sensor with different central hole radii r. (b) The full-width at half-maximum (FWHM) and sensitivity of the sensor under different values of r. The figure of merit (FOM) values along with the increases of r: 65.6, 146.9, 239.1, 315.7, and 312.2.
Figure 8.
(a) The resonance spectra of the proposed sensor with different central hole radii r. (b) The full-width at half-maximum (FWHM) and sensitivity of the sensor under different values of r. The figure of merit (FOM) values along with the increases of r: 65.6, 146.9, 239.1, 315.7, and 312.2.

Figure 9.
(a) The resonance spectra of the proposed sensor with different analyte RI values. (b) The relationship between resonance wavelength and the changing RI values. The simulation parameters are: r = 3.5 μm, R = 20 μm, g = 60 nm, t = 50 nm, d = 1 μm.
Figure 9.
(a) The resonance spectra of the proposed sensor with different analyte RI values. (b) The relationship between resonance wavelength and the changing RI values. The simulation parameters are: r = 3.5 μm, R = 20 μm, g = 60 nm, t = 50 nm, d = 1 μm.

Figure 10.
Sensitivity and full-width at half-maximum (FWHM) values with optimized parameters in the RI range of 1.325 to 1.35.
Figure 10.
Sensitivity and full-width at half-maximum (FWHM) values with optimized parameters in the RI range of 1.325 to 1.35.


Table 1.
Optimized parameters for our design.
| Parameters | Value | Parameters | Value |
|---|---|---|---|
| g | 60 nm | R | 20 μm |
| t | 50 nm | d | 1 μm |
| r | 3.5 μm | L | 5 mm |
Table 2.
Comparison of the sensing performance of the proposed sensor with other designs.
| Ref. | Configuration | RI Range | Sensitivity (nm/RIU) | Figure of Merit (FOM) (RIU−1) |
|---|---|---|---|---|
| [32] | Side-polished multi-mode fiber | 1.394–1.404 | Up to 4796 | Up to 46.1 |
| [24] | Inner Ag-coated hollow fiber | 1.509–1.763 | 2185–6607 | - |
| [36] | GK570/Ag-coated hollow fiber | 1.4772–1.5116 | 3470–12511 | 105.9–113.9 |
| [37] | Au-coated D-shaped PCF 1 | 1.26–1.36 | Up to 11039 | - |
| [38] | Silver-wire-filled hollow fiber | 1.47–1.52 | 4200–16200 | - |
| [8] | Symmetrical long-range SPR 2 | 1.33–1.38 | 3500.6 | Up to 107.5 |
| This work | Liquid-core PTFE-based POF 3 | 1.325–1.35 | 2653–16750 | 178.3–450.4 |
1 Photonic crystal fiber (PCF). 2 Surface plasmon resonance (SPR). 3 Polymer optical fiber (POF).
Publisher’s Note: MDPI stays neutral with regard to jurisdictional claims in published maps and institutional affiliations. |
© 2020 by the authors. Licensee MDPI, Basel, Switzerland. This article is an open access article distributed under the terms and conditions of the Creative Commons Attribution (CC BY) license (http://creativecommons.org/licenses/by/4.0/).
Share and Cite
MDPI and ACS Style
Shui, X.; Gu, Q.; Jiang, X.; Si, G. Surface Plasmon Resonance Sensor Based on Polymer Liquid-Core Fiber for Refractive Index Detection. Photonics 2020, 7, 123. https://doi.org/10.3390/photonics7040123
AMA Style
Shui X, Gu Q, Jiang X, Si G. Surface Plasmon Resonance Sensor Based on Polymer Liquid-Core Fiber for Refractive Index Detection. Photonics. 2020; 7(4):123. https://doi.org/10.3390/photonics7040123
Chicago/Turabian StyleShui, Xuqing, Qiongchan Gu, Xiaoxiao Jiang, and Guangyuan Si. 2020. "Surface Plasmon Resonance Sensor Based on Polymer Liquid-Core Fiber for Refractive Index Detection" Photonics 7, no. 4: 123. https://doi.org/10.3390/photonics7040123
Note that from the first issue of 2016, this journal uses article numbers instead of page numbers. See further details here.