Improving Calibration Strategy for LIBS Heavy Metals Analysis in Agriculture Applications

 ,
,  , ,
, ,  , and
, and
Abstract
:1. Introduction
2. Experimental Technique
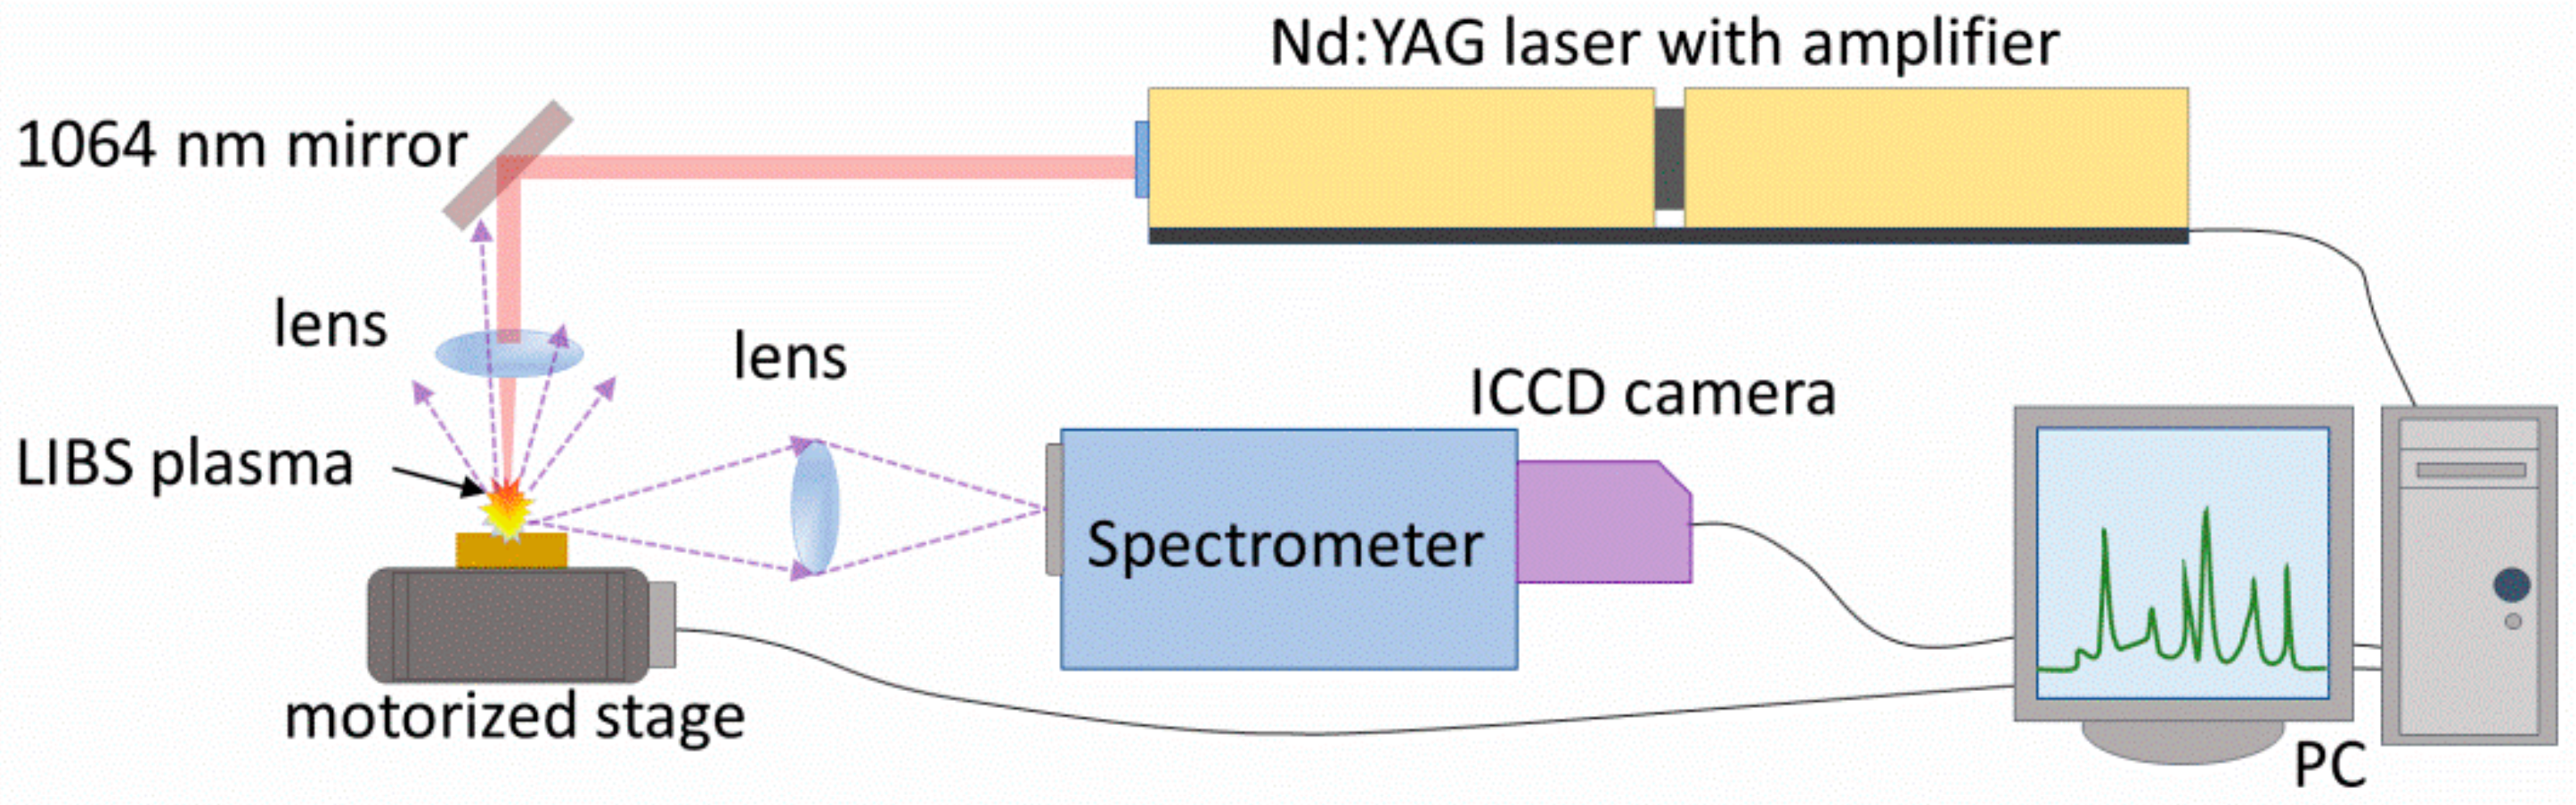
2.1. Laser-Induced Breakdown Spectroscopy Setup
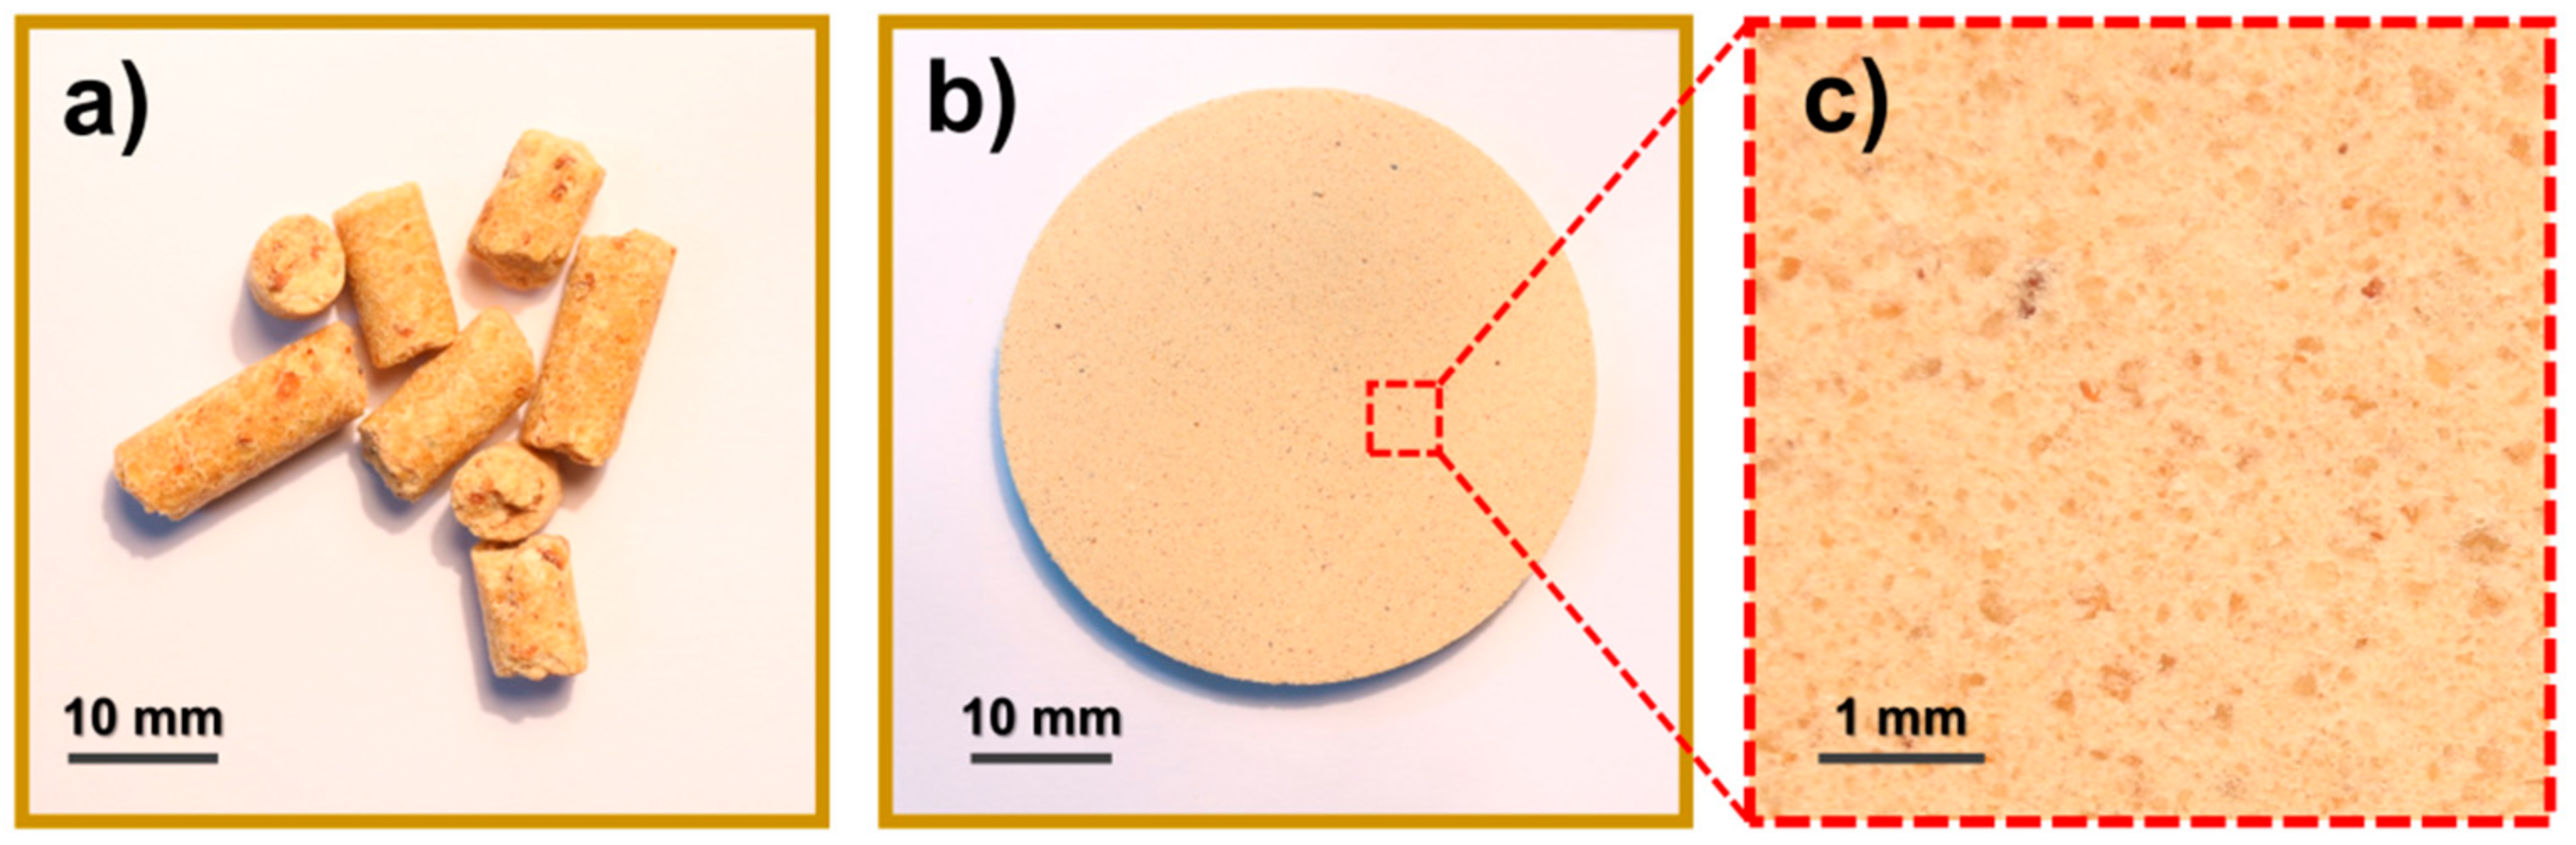
2.2. Samples
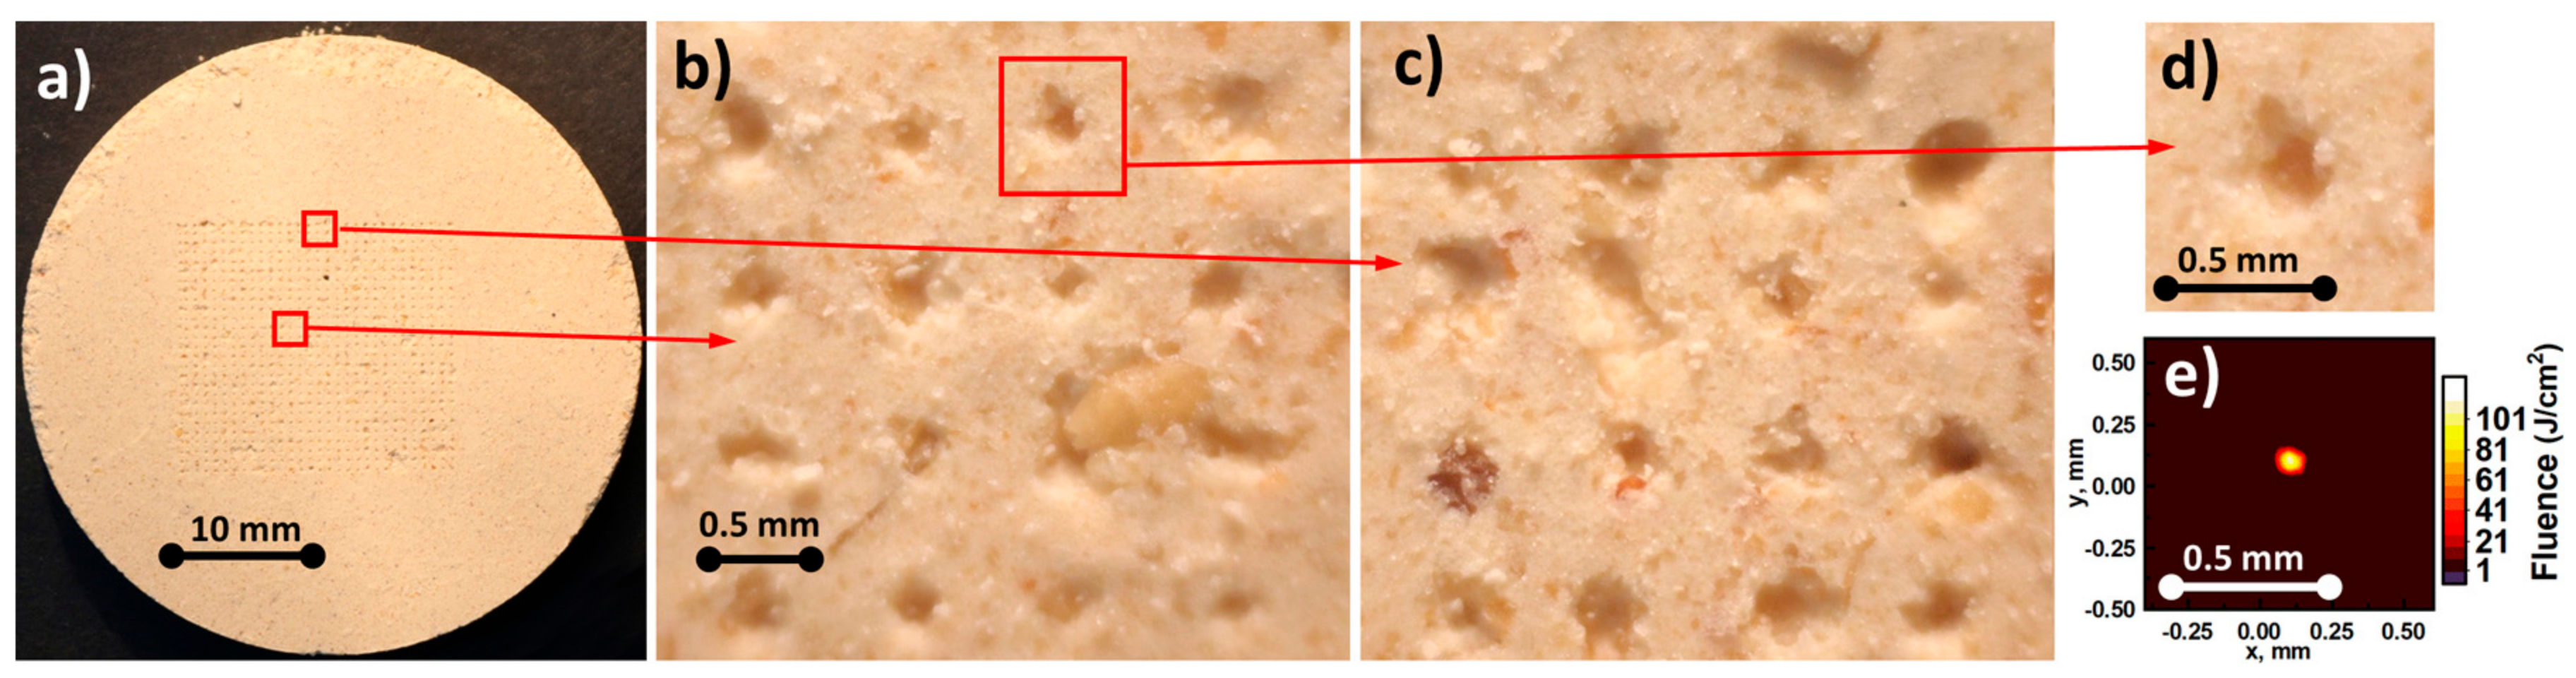
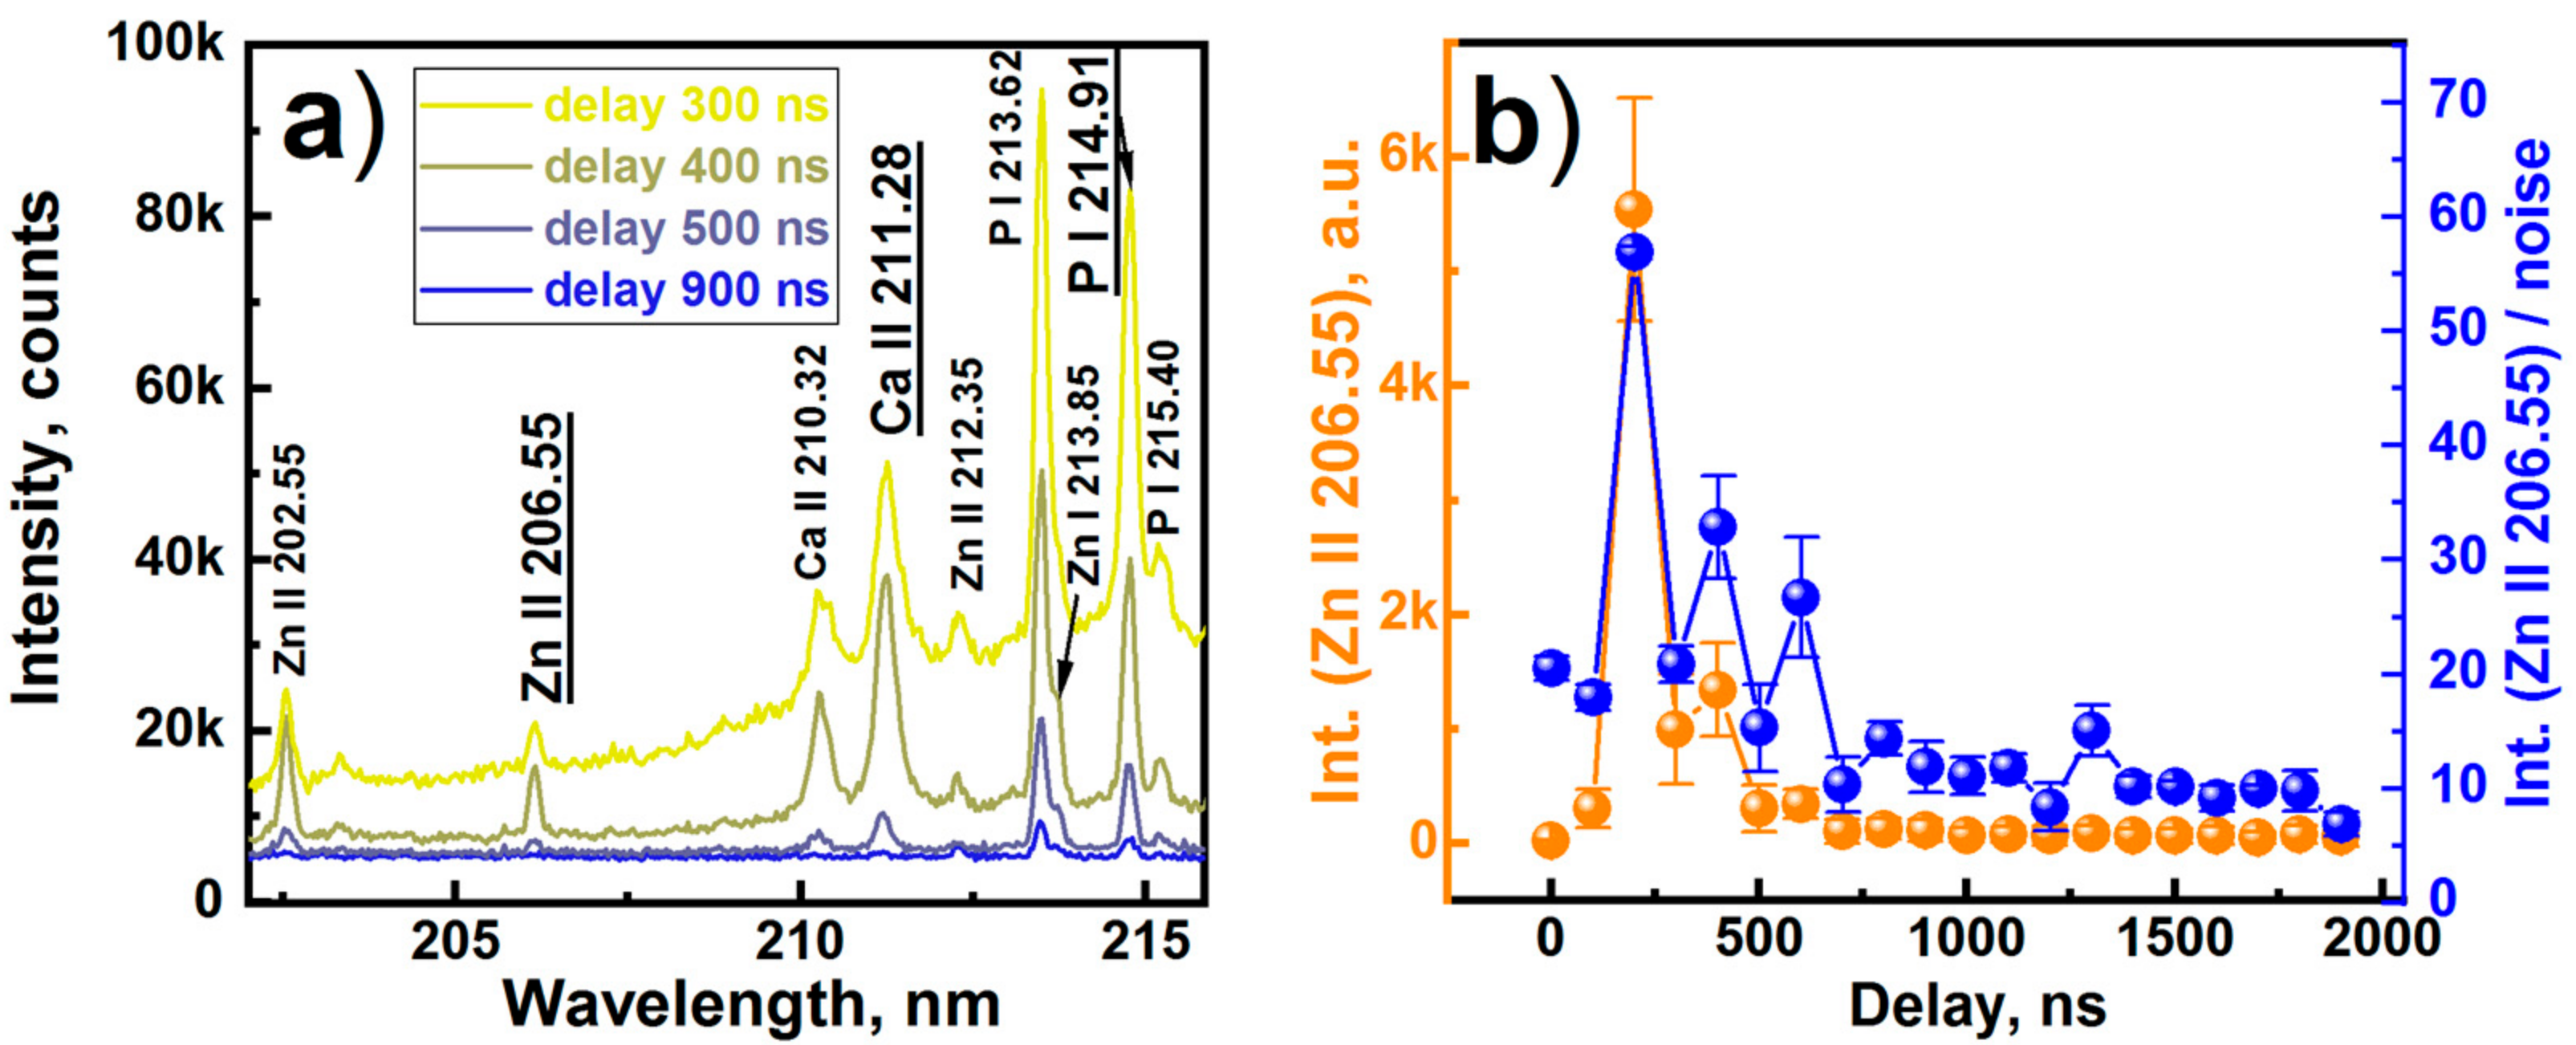
3. Results
4. Conclusions
Author Contributions
Funding
Institutional Review Board Statement
Informed Consent Statement
Data Availability Statement
Conflicts of Interest
References
- Alonso, J.I.G.; Marchante-Gayón, J.M.; Moldovan, M. New developments in food analysis by ICP-MS. In Handbook of Mineral Elements in Food; de la Guardia, M., Garrigues, S., Eds.; Wlley Blackwell: West Sussex, UK, 2015; pp. 239–262. [Google Scholar] [CrossRef]
- Marcinkowska, M.; Barałkiewicz, D. Multielemental speciation analysis by advanced hyphenated technique—HPLC/ICP-MS: A review. Talanta 2016, 161, 177–204. [Google Scholar] [CrossRef]
- Aceto, M.; Abollino, O.; Bruzzoniti, M.C.; Mentasti, E.; Sarzanini, C.; Malandrino, M. Determination of metals in wine with atomic spectroscopy (flame-AAS, GF-AAS and ICP-AES); a review. Food Addit. Contam. 2002, 19, 126–133. [Google Scholar] [CrossRef]
- Katerinopoulou, K.; Kontogeorgos, A.; Salmas, C.E.; Patakas, A.; Ladavos, A. Geographical Origin Authentication of Agri-Food Products: A Review. Foods 2020, 9, 489. [Google Scholar] [CrossRef] [PubMed]
- Byers, H.L.; McHenry, L.J.; Grundl, T.J. XRF techniques to quantify heavy metals in vegetables at low detection limits. Food Chem. X 2019, 1, 100001. [Google Scholar] [CrossRef]
- Soodan, R.K.; Pakade, Y.B.; Nagpal, A.; Katnoria, J.K. Analytical techniques for estimation of heavy metals in soil ecosystem: A tabulated review. Talanta 2014, 125, 405–410. [Google Scholar] [CrossRef]
- Bueno Guerra, M.B.; Adame, A.; de Almeida, E.; Arantes de Carvalho, G.G.; Stolf Brasil, M.A.; Santos, D., Jr.; Krug, F.J. Direct analysis of plant leaves by EDXRF and LIBS: Microsampling strategies and cross-validation. J. Anal. At. Spectrom. 2015, 30, 1646–1654. [Google Scholar] [CrossRef]
- Hahn, D.W.; Omenetto, N. Laser-Induced Breakdown Spectroscopy (LIBS), Part II: Review of Instrumental and Methodological Approaches to Material Analysis and Applications to Different Fields. Appl. Spectrosc. 2012, 66, 347–419. [Google Scholar] [CrossRef] [PubMed]
- Harmon, R.S.; Russo, R.E.; Hark, R.R. Applications of laser-induced breakdown spectroscopy for geochemical and environmental analysis: A comprehensive review. Spectrochim. Acta B At. Spectrosc. 2013, 87, 11–26. [Google Scholar] [CrossRef]
- Markiewicz-Keszycka, M.; Cama-Moncunill, X.; Casado-Gavalda, M.P.; Dixit, Y.; Cama-Moncunill, R.; Cullen, P.J.; Sullivan, C. Laser-induced breakdown spectroscopy (LIBS) for food analysis: A review. Trends Food Sci. Technol. 2017, 65, 80–93. [Google Scholar] [CrossRef]
- Sezer, B.; Bilge, G.; Boyaci, I.H. Capabilities and limitations of LIBS in food analysis. TrAC Trends Anal. Chem. 2017, 97, 345–353. [Google Scholar] [CrossRef]
- Lednev, V.N.; Sdvizhenskii, P.A.; Grishin, M.Y.; Stavertiy, A.Y.; Tretyakov, R.S.; Asyutin, R.D.; Pershina, S.M. Laser Welding Spot Diagnostics by Laser-Induced Breakdown Spectrometry. Phys. Wave Phenom. 2021, 29, 221–228. [Google Scholar] [CrossRef]
- Galbács, G. A critical review of recent progress in analytical laser-induced breakdown spectroscopy. Anal. Bioanal. Chem. 2015, 407, 7537–7562. [Google Scholar] [CrossRef] [PubMed]
- Crocombe, R. Portable Spectroscopy. Appl. Spectrosc. 2018, 72, 1701–1751. [Google Scholar] [CrossRef] [PubMed]
- Gaudiuso, R.; Melikechi, N.; Abdel-Salam, Z.A.; Harith, M.A.; Palleschi, V.; Motto-Ros, V.; Busser, B. Laser-induced breakdown spectroscopy for human and animal health: A review. Spectrochim. Acta B At. Spectrosc. 2019, 152, 123–148. [Google Scholar] [CrossRef]
- Senesi, G.S.; Harmon, R.S.; Hark, R.R. Field-portable and handheld laser-induced breakdown spectroscopy: Historical review, current status and future prospects. Spectrochim. Acta B At. Spectrosc. 2021, 175, 106013. [Google Scholar] [CrossRef]
- Pershin, S.M.; Lednev, V.N.; Bunkin, A.F. Laser ablation of alloys: Selective evaporation model. Phys. Wave Phenom. 2011, 19, 261–274. [Google Scholar] [CrossRef]
- Elmasry, G.; Kamruzzaman, M.; Sun, D.-W.; Allen, P. Principles and Applications of Hyperspectral Imaging in Quality Evaluation of Agro-Food Products: A Review. Crit. Rev. Food Sci. Nutr. 2012, 52, 999–1023. [Google Scholar] [CrossRef]
- Santos, D.; Nunes, L.C.; de Carvalho, G.G.A.; Gomes, M.D.S.; de Souza, P.F.; Leme, F.D.O.; dos Santos, L.G.C.; Krug, F.J. Laser-induced breakdown spectroscopy for analysis of plant materials: A review. Spectrochim. Acta B At. Spectrosc. 2012, 71, 3–13. [Google Scholar] [CrossRef]
- Peng, J.; Liu, F.; Zhou, F.; Song, K.; Zhang, C.; Ye, L.; He, Y. Challenging applications for multi-element analysis by laser-induced breakdown spectroscopy in agriculture: A review. TrAC Trends Anal. Chem. 2016, 85, 260–272. [Google Scholar] [CrossRef]
- Peruchi, L.C.; Nunes, L.C.; de Carvalho, G.G.A.; Guerra, M.B.B.; de Almeida, E.; Rufini, I.A.; Santos, D.; Krug, F.J. Determination of inorganic nutrients in wheat flour by laser-induced breakdown spectroscopy and energy dispersive X-ray fluorescence spectrometry. Spectrochim. Acta B At. Spectrosc. 2014, 100, 129–136. [Google Scholar] [CrossRef]
- Bilge, G.; Sezer, B.; Eseller, K.E.; Berberoğlu, H.; Köksel, H.; Boyacı, İ.H. Determination of Ca addition to the wheat flour by using laser-induced breakdown spectroscopy (LIBS). Eur. Food Res. Technol. 2016, 242, 1685–1692. [Google Scholar] [CrossRef]
- Juvé, V.; Portelli, R.; Boueri, M.; Baudelet, M.; Yu, J. Space-resolved analysis of trace elements in fresh vegetables using ultraviolet nanosecond laser-induced breakdown spectroscopy. Spectrochim. Acta B At. Spectrosc. 2008, 63, 1047–1053. [Google Scholar] [CrossRef]
- Beldjilali, S.; Yip, W.L.; Hermann, J.; Baba-Hamed, T.; Belasri, A. Investigation of plasmas produced by laser ablation using single and double pulses for food analysis demonstrated by probing potato skins. Anal. Bioanal. Chem. 2011, 400, 2173. [Google Scholar] [CrossRef] [PubMed]
- Lei, W.Q.; El Haddad, J.; Motto-Ros, V.; Gilon-Delepine, N.; Stankova, A.; Ma, Q.L.; Bai, X.S.; Zheng, L.J.; Zeng, H.P.; Yu, J. Comparative measurements of mineral elements in milk powders with laser-induced breakdown spectroscopy and inductively coupled plasma atomic emission spectroscopy. Anal. Bioanal. Chem. 2011, 400, 3303–3313. [Google Scholar] [CrossRef] [PubMed]
- Abdel-Salam, Z.; Al Sharnoubi, J.; Harith, M.A. Qualitative evaluation of maternal milk and commercial infant formulas via LIBS. Talanta 2013, 115, 422–426. [Google Scholar] [CrossRef] [PubMed]
- Zhao, M.; Markiewicz-Keszycka, M.; Beattie, R.J.; Casado-Gavalda, M.P.; Cama-Moncunill, X.; O’Donnell, C.P.; Cullen, P.J.; Sullivan, C. Quantification of calcium in infant formula using laser-induced breakdown spectroscopy (LIBS), Fourier transform mid-infrared (FT-IR) and Raman spectroscopy combined with chemometrics including data fusion. Food Chem. 2020, 320, 126639. [Google Scholar] [CrossRef] [PubMed]
- Moncayo, S.; Manzoor, S.; Rosales, J.D.; Anzano, J.; Caceres, J.O. Qualitative and quantitative analysis of milk for the detection of adulteration by Laser Induced Breakdown Spectroscopy (LIBS). Food Chem. 2017, 232, 322–328. [Google Scholar] [CrossRef] [Green Version]
- Bilge, G.; Boyacı, İ.H.; Eseller, K.E.; Tamer, U.; Çakır, S. Analysis of bakery products by laser-induced breakdown spectroscopy. Food Chem. 2015, 181, 186–190. [Google Scholar] [CrossRef]
- Mbesse Kongbonga, Y.G.; Ghalila, H.; Onana, M.B.; Ben Lakhdar, Z. Classification of vegetable oils based on their concentration of saturated fatty acids using laser induced breakdown spectroscopy (LIBS). Food Chem. 2014, 147, 327–331. [Google Scholar] [CrossRef]
- Moncayo, S.; Rosales, J.D.; Izquierdo-Hornillos, R.; Anzano, J.; Caceres, J.O. Classification of red wine based on its protected designation of origin (PDO) using Laser-induced Breakdown Spectroscopy (LIBS). Talanta 2016, 158, 185–191. [Google Scholar] [CrossRef]
- Beldjilali, S.; Borivent, D.; Mercadier, L.; Mothe, E.; Clair, G.; Hermann, J. Evaluation of minor element concentrations in potatoes using laser-induced breakdown spectroscopy. Spectrochim. Acta B At. Spectrosc. 2010, 65, 727–733. [Google Scholar] [CrossRef]
- Chen, C.-T.; Banaru, D.; Sarnet, T.; Hermann, J. Two-step procedure for trace element analysis in food via calibration-free laser-induced breakdown spectroscopy. Spectrochim. Acta B At. Spectrosc. 2018, 150, 77–85. [Google Scholar] [CrossRef] [Green Version]
- Zhang, H.; Wang, S.; Li, D.; Zhang, Y.; Hu, J.; Wang, L. Edible Gelatin Diagnosis Using Laser-Induced Breakdown Spectroscopy and Partial Least Square Assisted Support Vector Machine. Sensors 2019, 19, 4225. [Google Scholar] [CrossRef] [PubMed] [Green Version]
- Tognoni, E.; Cristoforetti, G.; Legnaioli, S.; Palleschi, V. Calibration-Free Laser-Induced Breakdown Spectroscopy: State of the art. Spectrochim. Acta B At. Spectrosc. 2010, 65, 1–14. [Google Scholar] [CrossRef]
- Kim, G.; Kwak, J.; Choi, J.; Park, K. Detection of Nutrient Elements and Contamination by Pesticides in Spinach and Rice Samples Using Laser-Induced Breakdown Spectroscopy (LIBS). Agric. Food Chem. 2012, 60, 718–724. [Google Scholar] [CrossRef] [PubMed]
- Bilge, G.; Velioglu, H.M.; Sezer, B.; Eseller, K.E.; Boyaci, I.H. Identification of meat species by using laser-induced breakdown spectroscopy. Meat Sci. 2016, 119, 118–122. [Google Scholar] [CrossRef] [PubMed]
- Nunes, L.C.; Batista Braga, J.W.; Trevizan, L.C.; Florêncio de Souza, P.; Arantes de Carvalho, G.G.; Júnior, D.S.; Poppi, R.J.; Krug, F.J. Optimization and validation of a LIBS method for the determination of macro and micronutrients in sugar cane leaves. J. Anal. At. Spectrom. 2010, 25, 1453–1460. [Google Scholar] [CrossRef]
- Galiová, M.; Kaiser, J.; Novotný, K.; Hartl, M.; Kizek, R.; Babula, P. Utilization of laser-assisted analytical methods for monitoring of lead and nutrition elements distribution in fresh and dried Capsicum annuum l. leaves. Microsc. Res. Tech. 2011, 74, 845–852. [Google Scholar] [CrossRef] [PubMed]
- Erler, A.; Riebe, D.; Beitz, T.; Löhmannsröben, H.-G.; Gebbers, R. Soil Nutrient Detection for Precision Agriculture Using Handheld Laser-Induced Breakdown Spectroscopy (LIBS) and Multivariate Regression Methods (PLSR, Lasso and GPR). Sensors 2020, 20, 418. [Google Scholar] [CrossRef] [Green Version]
- Lednev, V.; Pershin, S.M.; Bunkin, A.F. Laser beam profile influence on LIBS analytical capabilities: Single vs. multimode beam. J. Anal. At. Spectrom. 2010, 25, 1745. [Google Scholar] [CrossRef] [Green Version]
- The Thermo Scientific ARL 9900 Instrument, (n.d.). Available online: https://www.thermofisher.com/order/catalog/product/IQLAAHGABMFAAJMABT (accessed on 6 December 2021).
- Gornushkin, S.I.; Gornushkin, I.B.; Anzano, J.M.; Smith, B.W.; Winefordner, J.D. Effective Normalization Technique for Correction of Matrix Effects in Laser-Induced Breakdown Spectroscopy Detection of Magnesium in Powdered Samples. Appl. Spectrosc. 2002, 56, 433–436. [Google Scholar] [CrossRef]
- Guezenoc, J.; Gallet-Budynek, A.; Bousquet, B. Critical review and advices on spectral-based normalization methods for LIBS quantitative analysis. Spectrochim. Acta B At. Spectrosc. 2019, 160, 105688. [Google Scholar] [CrossRef]


| Sample | K | Ca | Mg | Zn | Na | Pb |
|---|---|---|---|---|---|---|
| sample1 | 1.67 | 1.0500 | 0.0849 | 0.0645 | 0.0058 | 0.00487 |
| sample2 | 1.70 | 1.0600 | 0.0812 | 0.0395 | 0.0057 | 0.00260 |
| sample3 | 1.69 | 1.0600 | 0.0820 | 0.0520 | 0.0051 | 0.00387 |
| sample4 | 1.68 | 1.0300 | 0.0822 | 0.0270 | 0.0047 | 0.00103 |
| sample5 | 1.72 | 1.0400 | 0.0792 | 0.0195 | 0.0049 | 0.0061 |
| sample6 (raw material) | 1.71 | 1.0500 | 0.0826 | 0.0170 | 0.0059 | <0.0002 |
Publisher’s Note: MDPI stays neutral with regard to jurisdictional claims in published maps and institutional affiliations. |
© 2021 by the authors. Licensee MDPI, Basel, Switzerland. This article is an open access article distributed under the terms and conditions of the Creative Commons Attribution (CC BY) license (https://creativecommons.org/licenses/by/4.0/).
Share and Cite
Lednev, V.N.; Sdvizhenskii, P.A.; Grishin, M.Y.; Nikitin, E.A.; Gudkov, S.V.; Pershin, S.M. Improving Calibration Strategy for LIBS Heavy Metals Analysis in Agriculture Applications. Photonics 2021, 8, 563. https://doi.org/10.3390/photonics8120563
Lednev VN, Sdvizhenskii PA, Grishin MY, Nikitin EA, Gudkov SV, Pershin SM. Improving Calibration Strategy for LIBS Heavy Metals Analysis in Agriculture Applications. Photonics. 2021; 8(12):563. https://doi.org/10.3390/photonics8120563
Chicago/Turabian StyleLednev, Vasily N., Pavel A. Sdvizhenskii, Mikhail Y. Grishin, Evgeny A. Nikitin, Sergey V. Gudkov, and Sergey M. Pershin. 2021. "Improving Calibration Strategy for LIBS Heavy Metals Analysis in Agriculture Applications" Photonics 8, no. 12: 563. https://doi.org/10.3390/photonics8120563