Article

Design and Optimization of Surface Plasmon Resonance Spectroscopy for Optical Constant Characterization and Potential Sensing Application: Theoretical and Experimental Approaches

by
Wan Mohd Ebtisyam Mustaqim Mohd Daniyal
1,
Yap Wing Fen
1,2,*,
Jaafar Abdullah
1,
Amir Reza Sadrolhosseini
3 and
Mohd Adzir Mahdi
4
1
Functional Devices Laboratory, Institute of Advanced Technology, Universiti Putra Malaysia, UPM Serdang 43400, Selangor, Malaysia
2
Department of Physics, Faculty of Science, Universiti Putra Malaysia, UPM Serdang 43400, Selangor, Malaysia
3
Magneto-Plasmonic Lab, Laser and Plasma Research Institute, Shahid Beheshti University, Tehran 1983969411, Iran
4
Wireless and Photonics Networks, Faculty of Engineering, Universiti Putra Malaysia, UPM Serdang 43400, Selangor, Malaysia
*
Author to whom correspondence should be addressed.
Photonics 2021, 8(9), 361; https://doi.org/10.3390/photonics8090361
Submission received: 4 July 2021 / Revised: 30 July 2021 / Accepted: 2 August 2021 / Published: 29 August 2021

Abstract

:
The best surface plasmon resonance (SPR) signal can be generated based on several factors that include the excitation wavelength, the type of metal used, and the thickness of the metal layer. In this study, the aforementioned factors have been investigated to obtain the best SPR signal. The excitation wavelength of 633 nm and gold metal with thickness of 50 nm were required to generate the SPR signal before the SPR was used for optical constant characterization by fitting of experimental results to the theoretical data. The employed strategy has good agreement with the theoretical value where the real part refractive index, n value, of the gold thin film was 0.1245 while the value for the imaginary part, k, was 3.6812 with 47.7 nm thickness. Besides that, the optical characterization of nanocrystalline cellulose (NCC)-based thin film has also been demonstrated. The n and k values found for this thin film were 1.4240 and 0.2520, respectively, with optimal thickness of 9.5 nm. Interestingly when the NCC-based thin film was exposed to copper ion solution with n value of 1.3333 and k value of 0.0060 to 0.0070 with various concentrations (0.01–10 ppm), a clear change of the refractive index value was observed. This result suggests that the NCC-based thin film has high potential for copper ion sensing using SPR with a sensitivity of 8.0052°/RIU.

1. Introduction

Surface plasmon resonance (SPR) is a collective oscillation of electrons that can be generated by light [1,2]. This oscillation occurs at the interface between metal and dielectric material and can be observed using various configurations and the most common configuration is the Kretschmann configuration as shown in Figure 1. This configuration has been used in most practical applications such as clinical diagnostic, gas sensor, biological sensing, and chemical sensing [3,4,5,6,7,8,9,10,11,12,13,14]. Theoretically in the Kretschmann configuration, the SPR can be generated using the basic principles of physics. The light beam that passes through two different media with a higher to lower refractive index will be totally reflected if the incident angle is higher than the critical angle. The electromagnetic field component of the incident light will penetrate through the prism and reach the interface between the metal and dielectric medium to excite the free electron on the metal surface if the metal layer is thin enough [15,16,17,18,19,20,21,22]. As a result, the electron is excited and plasmon wave is formed that propagates along the metal surface. The plasmon wave is the sensing component that interacts optically with the metal surfaces. At specific angle, when the momentum of the plasmon wave is equivalent to the incident light, resonance occurs and the intensity of the reflected light decreases [23,24,25,26,27]. The plasmon wave is the sensing component of SPR and very sensitive towards the changes of the thin film surrounding properties that includes the excitation wavelength, type of metal used, and the thickness of the metal layer [28,29,30]. Changes of these properties will change the reflectance curve and will affect the sensitivity, full width half maximum (FWHM), and the accuracy of the SPR, curve which are important parameters to define the performance of the SPR. In this study, the surrounding properties to generate SPR have been investigated using a simulation and automatic fitting program that has been developed using the Matlab program to achieve the best SPR signal.
SPR is an optical technique that has many advantages that include being cost-effective, and having linear properties, low mass, and fast measurement [31,32,33,34,35,36,37,38,39]. One of the most important findings in SPR is the introduction of the active layer on the surface of the metal thin film. Since the past decades, a wide range of materials have been exploited to be used as an active layer to improve the sensitivity of the SPR and most of the studies only focused on the target analyte’s adsorption uptake performance for potential sensing applications [40,41,42,43,44,45,46,47,48,49,50,51,52,53,54,55]. Other important information that can be investigated using SPR is the refractive index value of the active layer. The refractive index value of the active layer is very crucial as it can provide information regarding the intermolecular interactions in liquid mixtures [56,57,58,59,60]. To the best of our knowledge, SPR has not yet been used to study the refractive index value of nanocrystalline cellulose (NCC) and graphene oxide (GO) composite. The NCC-based active layer has high potential to improve the SPR sensitivity owing to the excellent properties for metal ion adsorption [61,62]. The optical properties of the NCC-based thin film can provide information on the intermolecular interactions with metal ions for sensing applications. Hence in this present work, SPR has been used to study the optical properties of NCC-based thin film and the changes of the optical properties after interaction with copper ion also was investigated.

2. Theory

To generate an SPR signal, the incident light must first be in a transverse magnetic mode as the electric field is perpendicular to the metal thin film. The electric field of the light source can be described by [63]:
E = E o ( x + i z ) e i ( k x ω t ) e k | z |
where Eo is the amplitude, x and z are the unit vectors, k is the wave vector, and ω are the angular optical frequency of the electrical field. When total internal reflection occurs, the evanescent wave will excite the free electrons that exist on the surface of the thin film forming a surface plasmon that propagates along the surface of the thin film. The wave vector for the surface plasmon, Ksp can be described by the following equation [64]:
K s p = ω c ( ε 1 ε 2 ε 1 + ε 2 )
where ω is the frequency, c is the velocity of light, ε1 is the complex dielectric constant for the surface active, and ε2 is the complex dielectric constant for the dielectric media. The dielectric constant can also be described by:
ε = n 2
Using Equation (3), Equation (2) then can be rewritten as:
K s p = ω c ( n 1 2 n 2 2 n 1 2 + n 2 2 )
where n1 and n2, is the refractive index of gold layer and sample layer respectively. On the other hand, the component of the incident light vector that is parallel to the prism/metal interface, Kx can be described as [65]:
K x = ( ω c ) n p sin θ S P R
where np is the refractive index of the prism. SPR then can be generated when the wave vector for the surface plasmon is equal to the incident light vector and can be described by [66]:
K s p = K x
with
( n 1 2 n 2 2 n 1 2 + n 2 2 ) = n p sin θ S P R
The coupling of these two wave vectors, Ksp and Kx result in a sharp dip of the reflectance at a resonance angle, θSPR. The SPR optical sensor works by detecting the changes of the thin film surface refractive index. Thus, the refractive index of the sample layer is [67]:
n 2 = n 1 2 n p 2 sin 2 θ S P R n 1 2 n p 2 sin 2 θ S P R
In accordance with the boundary conditions for the electrical and magnetic fields at the interfaces between multilayers, the reflection coefficient, r, can be expressed as [68]:
r = m 21 + m 22 γ 2 m 11 γ 0 m 12 γ 2 γ 0 m 21 + m 22 γ 2 + m 11 γ 0 + m 12 γ 2 γ 0
mij are the matrix transfer element with thickness, d given by [69]:
m = ( cos δ i sin δ γ 1 i γ 1 sin δ cos δ )
where,
γ 1 = n 1 cos θ 1 ε 0 μ 0   and   δ = 2 π λ d n 1 cos θ 1
The reflectivity of the multilayer system, R, is defined as the ratio of the energy reflected at the surface to the energy of the incident and can be expressed as [70]:
R = r r *
where it is the function of the thickness and refractive index of both metal and sample layer.

3. Materials and Methods

3.1. Surface Plasmon Resonance (SPR) Optimization

Based on theoretical equations in Section 2, a simulation and automatic fitting program has been developed using the Matlab program. The simulation was used to investigate the optimal condition to generate an SPR signal. As the SPR signal is very sensitive towards the surrounding properties, the simulation was used to determine the optimum surrounding condition to generate an SPR signal that includes the type of light source, type of metal, and thickness of the metal used.

3.2. Preparation of Thin Film

After the SPR simulation, thin films were prepared to be studied using SPR. In this study, two thin films were prepared, i.e., gold thin film and NCC based thin film. The gold thin film was prepared using a glass substrate of 0.13–0.16 mm thickness and area of 24 mm × 24. Gold layer was deposited on top of the glass substrate using SC7640 sputter coater (Quorum Technologies, West Sussex, UK).
To prepare the NCC-based thin film, the NCC-based composite solution was initially prepared by mixing 1 mL of NCC that was modified using hexadecyltrimethylammonium bromide, with 1 mL of graphene oxide [71]. All chemicals were analytical grade and deionized water was used during the preparation of the NCC-based composite solution. The NCC-based composite solution was deposited on top of the gold thin film using the spin coating technique. About 1 mL of the solution was dropped at the center of the gold thin film using a micropipette and spun for 30 s at 6000 rpm by a P-6708D spin coater machine (Inc. Medical Devices, Indianapolis, IN, USA) to a homogenous NCC based thin film.

3.3. Surface Plasmon Resonance

After the evaluation of the SPR signal, the SPR setup was designed and prepared in the laboratory as shown in Figure 2. The SPR setup then was used to obtain the SPR curve of the gold thin film and the NCC-based thin film. The thin film was placed between the prism and the dielectric medium. Then, deionized water and copper ion solution with different concentrations was injected before the SPR signal was recorded [72].

3.4. Fitting Experimental to Theoretical

After the SPR experiment, the reflectance curve was analyzed to investigate the optical properties of the gold thin film, copper ion solution, and NCC-based thin film. The reflectance curve for the gold thin film in contact with deionized water was first fitted to the theoretical data. Using Equation (7), the refractive index of gold thin film was determined by taking the refractive index of deionized water as 1.3333 [31]. To investigate the refractive index value of copper ion solution, the reflectance curve for the gold thin film in contact with copper ion solution was fitted. The obtained refractive index value of the gold thin film was used to further determine the optical properties of copper ion using the same equation.
Then, the reflectance curve for the NCC-based thin film in contact with deionized water and copper ion solution was fitted to investigate the optical properties and the changes after in contact with copper ion at different concentrations. The refractive index value for the NCC-based thin film was calculated using Equation (8). The thickness of the thin film was calculated using the reflection coefficient, r from Equation (9).

4. Results and Discussion

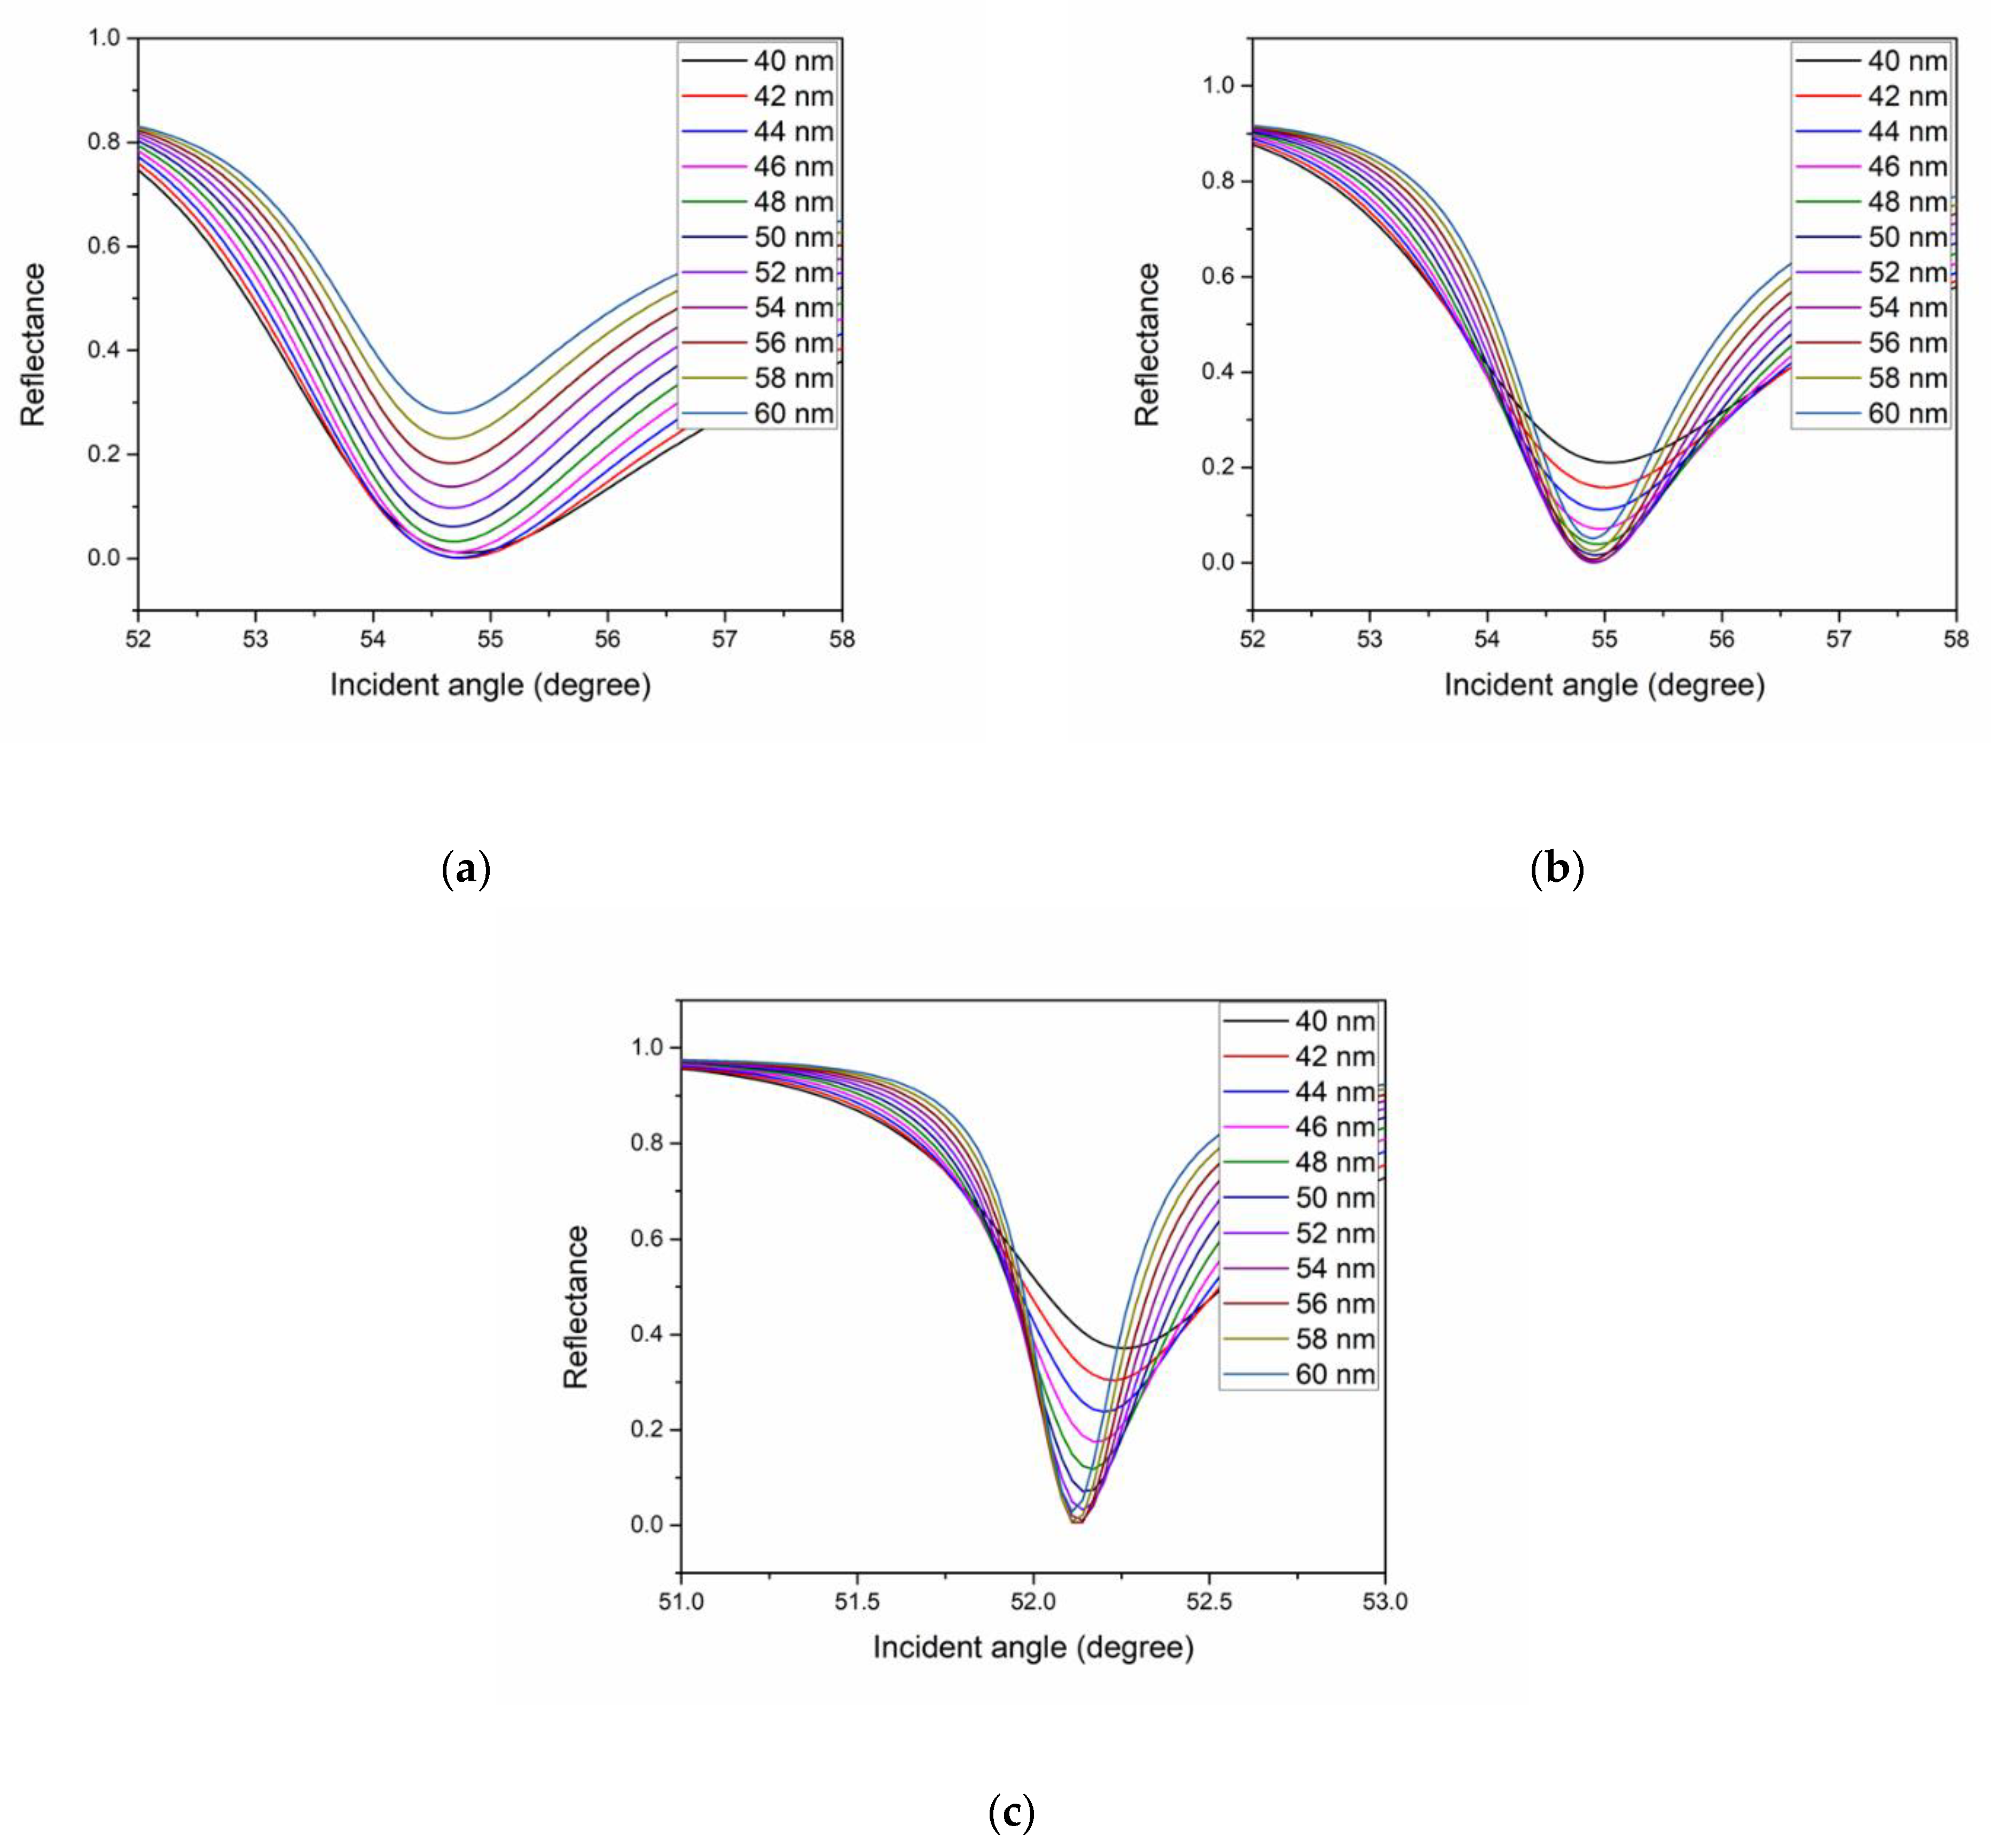
4.1. Simulation of SPR Signal

Prior to the SPR simulation, the refractive index of copper, gold, and silver were obtained from previous study [73,74]. The refractive index of metal is one of the critical parameters that will affect the SPR signal performance. The real part and imaginary part of the refractive index as a function of wavelength for all three metals are shown in Figure 3a,b respectively. All three metals have different characteristics of refractive index. From the figures, the real part of the refractive index for copper and gold decrease exponentially with the increase of wavelength from 400 nm to 650 nm while silver only decreases gradually. For the imaginary part of the refractive index, all three metals show the same characteristics where the value increases with increasing wavelength.
To obtain the best SPR signal, different light sources and metals were first evaluated through the simulation program that was developed using Matlab based on the theory from Section 2. Using different light sources and the value of refractive index for each metals obtained previously, the SPR signal can be simulated to select the best light sources and best metal to generate SPR signal. The thickness of all metals was kept fixed at 50 nm before the investigation was carried out. Figure 4a,c shows the comparison of SPR signal between copper, gold, and silver respectively using air as the dielectric media and light sources of different wavelength, i.e., blue light (436 nm), violet light (441 nm), green light (546 nm), yellow light (589 nm), and red light (650 nm). It can be observed that SPR signal can be obtained using a green, yellow, and red light source for both copper and gold while for silver, the SPR signal can be obtained using a blue, violet, green, yellow, and red light source. On the other hand, the SPR signal changed when water was used as the dielectric media. Only yellow and red light sources were able to generate an SPR signal for both copper and gold while for silver, the SPR signal can be generated using green, yellow, and red light source as shown in Figure 5a,c respectively. Besides that, blue and violet light sources are not feasible in generating an SPR signal for all three metals. SPR refers to the electromagnetic response that occurs when plasmons are oscillating with the same frequency to the incident light. The existence of surface plasmon on a metal dielectric interface is confined to the wavelengths longer than the critical wavelength, which depends on the plasma frequency and is specific to the metal. The frequency of the incidence light must be equal to the natural frequency of the material or resonance will not occur; thus, SPR signal can be seen was not generated at some wavelengths for each metal [75]. Moreover, the SPR curve also can be observed to shift further to the right when water was used as the dielectric media. SPR is very sensitive towards the changes of the refractive index near the surface of the metal. Thus, changes of the dielectric media from air to water greatly affect the SPR signal owing to the refractive index value, i.e., 1.0003 and 1.3333 for air and water respectively [76]. Furthermore, the use of a higher wavelength is more favorable in generating the SPR signal owing to the appreciable effect of the width of SPR signal [77]. From this simulation, the red-light source has been selected as it is the best light source to generate an SPR signal for all three metal thin films.
To obtain the best SPR signal, one of the parameters that needs to be optimized is the wavelength of the light source. To determine a more accurate wavelength of the light source to generate the best SPR signal, the wavelength in the red-light range (613–653 nm) was used to simulate the SPR signal for all three metal thin films. The best SPR signal was determined by the lowest reflectance minimum and a smaller value of full width half maximum (FWHM). To obtain the FWHM value, the width of the SPR curve at half of the maximum value was calculated as shown in Figure 6. Then, the accuracy of the SPR signal was calculated using the inverse of the FWHM [78].
From the simulation, the optimal SPR signal using copper thin film can be obtained at 653 nm where the FWHM value was the lowest at approximately 2.2° thus, gives the highest accuracy. At 613 nm to 643 nm, the FWHM increased from 3.2° to 2.5° while the lowest reflectance minimum also increased as shown in Figure 7a. Moving on to the gold thin film, the generated SPR signal using a light source with a wavelength of 613 nm and 623 nm has the highest FWHM value at approximately 2.5° and 2.3°, respectively. The FWHM and accuracy of the reflectance curve do not change when a light source with a wavelength of 633, 643, and 653 nm was used. The calculated FWHM value for these wavelengths was 2.2°. Besides that, at 633 nm the SPR signal has the lowest reflectance compared to at 643 and 653 nm as shown in Figure 7b. For the silver thin film, the lowest reflectance minimum for all wavelengths does not show any significant change as shown in Figure 7c. Moreover, only a slight difference is identified in the calculated FWHM value of the reflectance curve for all ranges of wavelength. From 613 nm until 633 nm, the calculated FWHM value was 0.5° while at 643 until 653 nm, 0.4° was obtained. The calculated FWHM value and accuracy for all three metal thin films are recorded in Table 1.
Another parameter that needs to be optimized to obtain the best SPR signal for maximum sensitivity is the thickness of the metal thin film. The optimization of the reflectance minimum and FWHM value of the reflectance curve can be achieved by selecting the appropriate thickness of the metals. Different thickness from 40 nm to 60 nm was used to investigate the SPR signal for all three metal thin films at the 633 nm wavelength light source. For the copper thin film, the lowest reflectance minimum of the reflectance curve can be obtained at 44 nm thickness as shown in Figure 8a. It can also be observed that at higher thickness, the reflectance minimum gradually decreases. The FWHM value of the SPR signal for the copper thin film also was the lowest at 44 nm thickness at approximately 3.1°. For the gold thin film, the best SPR signal can be obtained around 50 nm where the reflectance minimum was the lowest as shown in Figure 8b. The FWHM value calculated at 50 nm was also the lowest approximately 2.1° that gives higher accuracy compared to other thicknesses. On the other hand, the best SPR signal using silver thin film can be obtained around 52 nm where the reflectance minimum and the FWHM were the lowest around 0.4° as shown in Figure 8c.
From the simulation results, the red light of 633 nm wavelength has been proven to be the most appropriate light source to generate SPR. For metal selection, copper is not favorable to generate SPR owing to its optical properties that give a higher reflectance minimum and high FWHM value of the reflectance curve, hence decreasing the accuracy of the SPR in sensing application. The SPR signal is the best for both gold and silver thin films. However, silver has poor chemical stability and less inert compared to the gold that limits its application. Therefore, the most favorable metal to generate SPR is gold that gives a low reflectance minimum and smaller width of the reflectance curve [77]. Besides that, gold is also inert and has higher chemical stability that gives advantages for wider application.

4.2. Analysis of Thin Films Properties

Gold thin film has been used to generate SPR using water as the dielectric medium at room temperature. The experimental SPR signal then was fitted to obtain the information on the thin film properties as shown in Figure 9. According to the fitted SPR signal, the optical properties of the prepared gold thin film for the real part, n and imaginary part, k refractive index was 0.1245 and 3.6812, respectively. The thickness of the gold layer was also determined from the fitting where 47.7 nm thickness was revealed.
The SPR signal of the gold thin film in contact with copper ion at low concentration has also been investigated. This result was also fitted to analyze the optical properties of the copper ion solution. From the fitting result, the k value for the copper ion at 0.1 ppm found was 0.0060. At 0.5 ppm, the k value increases to 0.0070 and the value remains the same until 10 ppm. This result has a good agreement with the previous study where the n value of copper ion at low concentration is almost equal to the deionized water refractive index at room temperature, i.e., 1.3333 [76].
The SPR experiment then continued using the NCC-based thin film. The SPR experiment using NCC-based thin film with deionized water was first carried out to investigate the optical properties. The obtained reflectance curve then was fitted as shown in Figure 10. The fitting of the SPR curve reveals that the refractive index of the NCC based thin film was 1.4240 and 0.2520 for n and k respectively. This refractive index value has a good agreement with the refractive index of NCC from the previous study, i.e., 1.499 [79].
In further analysis of the SPR results, the thickness of the NCC-based layer was also investigated. The fitting of the SPR curve reveals that the NCC-based layer has a thickness of 9.5 nm. The effect of the NCC-based layer thickness towards the SPR signal can be demonstrated as shown in Figure 11. A thinner NCC-based layer will give a lower FWHM value and sharper SPR curve that has higher accuracy in the determination of resonance angle but the binding interaction with copper ion might be minimal thus reducing the sensitivity of the SPR sensor. For a thicker sensing layer, although more interaction with copper ion can be achieved, a higher FWHM value and broader SPR curve have lower accuracy that can reduce the SPR sensor’s effectiveness [80]. Hence, by considering both factors, i.e., the binding interaction of copper ion with the NCC based layer, and to obtain the best SPR result for resonance angle determination and better detection accuracy, the optimal thickness of the sensing layer was fixed around 9 to 10 nm. The FWHM value and the accuracy of the SPR curve for each thickness were recorded in Table 2.
Then, the SPR experiment for the NCC-based thin film was carried out using copper ion solution. The obtained refractive index value for the gold thin film and copper ion was used to investigate the optical properties of NCC-based thin film through the fitting procedure. The curves presented in Figure 12 show the fitting of the SPR curve for NCC-based thin film in contact with copper ion solution. The refractive index of the NCC-based thin film increased from 1.424 to 1.457 for the n while the value of k decreased from 0.252 to 0.192 after in contact with copper ion at 0.01 ppm. Interestingly, the refractive index of the NCC-based thin film changes gradually for both n and k when a higher concentration of copper ion was used, as shown in Figure 13a,b respectively. Changes in the refractive index might be due to the chemical interaction of the NCC-based thin film with copper ion thus. The refractive index of the NCC-based thin film remains the same when in contact with copper ion above 0.5 ppm due to the saturation of copper ion on the surface of the NCC-based thin film [81]. The refractive index value and the thickness of the NCC-based thin film is recorded in Table 3. The thickness of the NCC-based thin film after interaction with copper ion was also investigated. The thickness of the NCC-based thin film gradually increased after being in contact with the copper ion that was believed due to the interaction that causes changes of the thin film surface. The thickness remains the same at around 11 nm when in contact with copper ion from 0.5 ppm to 10 ppm after the thin film reaches saturation.
After the analysis of the refractive index, determination of the resonance angle for the SPR result was also carried out. The resonance angle was obtained by measuring the angle of the minimum reflectance curve. The changes of the resonance angle, Δθ was calculated using the resonance angle of the NCC-based thin film in contact with deionized water as the reference. The result obtained then can be used to examine the sensitivity of the SPR. The sensitivity, S is a key performance parameter for a sensor and can be defined as [82,83,84,85]:
S = Δ θ Δ n
Figure 14 shows the Δθ against Δn for the NCC based thin film in contact with copper ion from 0.01 until 0.5 ppm. The calculated slope for the plotted graph was 8.0052°/RIU which represents the S with a correlation coefficient, R2 of 0.99. From this result, the NCC-based thin film has good sensitivity for potential copper ion detection.

5. Conclusions

In this research, the excitation wavelength of 633 nm and gold metal with thickness of 50 nm has been demonstrated to be the optimal condition to generate the best SPR signal. The SPR has also successfully been applied for optical characterization and has good agreement with the theoretical value where the real part refractive index, n and imaginary part, k for the gold thin film were 0.1245 and 3.6812, respectively, with 47.7 nm thickness. Moreover, the optical constant for NCC-based thin film has also been investigated. The n and k values found for the NCC-based thin film were 1.4240 and 0.2520, respectively, with optimal thickness of 9.5 nm. When the NCC-based thin film was exposed to copper ion solution with n value of 1.3333 and k value of 0.0060 to 0.0070 from 0.01–10 ppm, a clear change of the refractive index value was observed. The studies of the NCC-based thin film shows that it has a good sensitivity of 8.0052°/RIU for copper ion sensing using SPR.

Author Contributions

Conceptualization, Y.W.F.; methodology, Y.W.F. and W.M.E.M.M.D.; validation, Y.W.F., J.A. and M.A.M.; formal analysis, W.M.E.M.M.D.; investigation, W.M.E.M.M.D.; data curation, W.M.E.M.M.D. and A.R.S.; writing—original draft preparation, W.M.E.M.M.D.; writing—review and editing, Y.W.F.; supervision, Y.W.F., J.A. and M.A.M. All authors have read and agreed to the published version of the manuscript.

Funding

This research work was funded by the Ministry of Education, Malaysia, through the Fundamental Research Grant Scheme (FRGS/1/2019/STG02/UPM/02/1).

Institutional Review Board Statement

Not applicable.

Informed Consent Statement

Not applicable.

Data Availability Statement

Not applicable.

Conflicts of Interest

The authors declare no conflict of interest.

References

  1. Kravets, V.G.; Kabashin, A.V.; Barnes, W.L.; Grigorenko, A.N. Plasmonic surface lattice resonances: A review of properties and applications. Chem. Rev. 2018, 118, 5912–5951. [Google Scholar] [CrossRef] [PubMed]
  2. Mukhtar, W.M.; Susthitha Menon, P.; Shaari, S.; Malek, M.Z.A.; Abdullah, A.M. Angle shifting in surface plasmon resonance: Experimental and theoretical verification. J. Phys. Conf. Ser. 2013, 431, 012028. [Google Scholar] [CrossRef]
  3. Usman, F.; Ojur, J.; Yousif, A.; Cheng, K. Structural characterization and optical constants of p-toluene sulfonic acid doped polyaniline and its composites of chitosan and reduced graphene-oxide. Integr. Med. Res. 2019, 9, 1468–1476. [Google Scholar] [CrossRef]
  4. Omar, N.A.S.; Fen, Y.W.; Saleviter, S.; Daniyal, W.M.E.M.M.; Anas, N.A.A.; Ramdzan, N.S.M.; Roshidi, M.D.A. Development of a graphene-based surface plasmon resonance optical sensor chip for potential biomedical application. Materials 2019, 12, 1928. [Google Scholar] [CrossRef] [PubMed] [Green Version]
  5. Gerislioglu, B.; Dong, L.; Ahmadivand, A.; Hu, H.; Nordlander, P.; Halas, N.J. Monolithic metal dimer-on-film structure: New plasmonic properties introduced by the underlying metal. Nano Lett. 2020, 20, 2087–2093. [Google Scholar] [CrossRef]
  6. Mansouri, M.; Fathi, F.; Jalili, R.; Shoeibie, S.; Dastmalchi, S.; Khataee, A.; Rashidi, M.R. SPR enhanced DNA biosensor for sensitive detection of donkey meat adulteration. Food Chem. 2020, 331, 127163–127172. [Google Scholar] [CrossRef]
  7. Firdous, S.; Anwar, S.; Rafya, R. Development of surface plasmon resonance (SPR) biosensors for use in the diagnostics of malignant and infectious diseases. Laser Phys. Lett. 2018, 15, 18–23. [Google Scholar] [CrossRef]
  8. Rosddi, N.N.M.; Fen, Y.W.; Anas, N.A.A.; Omar, N.A.S.; Ramdzan, N.S.M.; Daniyal, W.M.E.M.M. Cationically modified nanocrystalline cellulose/carboxyl-functionalized graphene quantum dots nanocomposite thin film: Characterization and potential sensing application. Crystals 2020, 10, 875. [Google Scholar] [CrossRef]
  9. Kamaruddin, N.H.; Bakar, A.A.A.; Yaacob, M.H.; Mahdi, M.A.; Zan, M.S.D.; Shaari, S. Enhancement of chitosan-graphene oxide SPR sensor with a multi-metallic layers of Au-Ag-Au nanostructure for lead(II) ion detection. Appl. Surf. Sci. 2016, 361, 177–184. [Google Scholar] [CrossRef]
  10. Moon, J.; Kang, T.; Oh, S.; Hong, S.; Yi, J. In situ sensing of metal ion adsorption to a thiolated surface using surface plasmon resonance spectroscopy. J. Colloid Interface Sci. 2006, 298, 543–549. [Google Scholar] [CrossRef] [PubMed]
  11. Eddin, F.B.K.; Fen, Y.W.; Omar, N.A.S.; Liew, J.Y.C.; Daniyal, W.M.E.M.M. Femtomolar detection of dopamine using surface plasmon resonance sensor based on chitosan/graphene quantum dots thin film. Spectrochim. Acta A Mol. Biomol. Spectrosc. 2021, 263, 120202. [Google Scholar] [CrossRef]
  12. Ock, K.; Jang, G.; Roh, Y.; Kim, S.; Kim, J.; Koh, K. Optical detection of Cu2+ ion using a SQ-dye containing polymeric thin-film on Au surface. Microchem. J. 2001, 70, 301–305. [Google Scholar] [CrossRef] [Green Version]
  13. Abdallah, T.; Abdalla, S.; Negm, S.; Talaat, H. Surface plasmons resonance technique for the detection of nicotine in cigarette smoke. Sens. Actuators A Phys. 2003, 102, 234–239. [Google Scholar] [CrossRef]
  14. Rezabakhsh, A.; Rahbarghazi, R.; Fathi, F. Surface plasmon resonance biosensors for detection of Alzheimer’s biomarkers; an effective step in early and accurate diagnosis. Biosens. Bioelectron. 2020, 167, 112511–112523. [Google Scholar] [CrossRef] [PubMed]
  15. Anas, N.A.A.; Fen, Y.W.; Omar, N.A.S.; Daniyal, W.M.E.M.M.; Ramdzan, N.S.M.; Saleviter, S. Development of graphene quantum dots-based optical sensor for toxic metal ion detection. Sensors 2019, 19, 3850. [Google Scholar] [CrossRef] [PubMed] [Green Version]
  16. Ciminelli, C.; Campanella, C.M.; Olio, F.D.; Campanella, C.E.; Armenise, M.N. Label-free optical resonant sensors for biochemical applications. Prog. Quantum Electron. 2013, 37, 51–107. [Google Scholar] [CrossRef]
  17. Sun, R.J.; Huang, H.J.; Hsiao, C.N.; Lin, Y.W.; Liao, B.H.; Chou Chau, Y.F.; Chiang, H.P. Reusable TiN substrate for surface plasmon resonance heterodyne phase interrogation sensor. Nanomaterials 2020, 10, 1325. [Google Scholar] [CrossRef]
  18. Wang, L.; Li, T.; Du, Y.; Chen, C.; Li, B.; Zhou, M.; Dong, S. Au NPs-enhanced surface plasmon resonance for sensitive detection of mercury(II) ions. Biosens. Bioelectron. 2010, 25, 2622–2626. [Google Scholar] [CrossRef]
  19. Lee, K.S.; Son, J.M.; Jeong, D.Y.; Lee, T.S.; Kim, W.M. Resolution enhancement in surface plasmon resonance sensor based on waveguide coupled mode by combining a bimetallic approach. Sensors 2010, 10, 11390–11399. [Google Scholar] [CrossRef] [Green Version]
  20. Chang, C.C.; Lin, S.; Wei, S.C.; Chen, C.Y.; Lin, C.W. An amplified surface plasmon resonance “turn-on” sensor for mercury ion using gold nanoparticles. Biosens. Bioelectron. 2011, 30, 235–240. [Google Scholar] [CrossRef]
  21. Fauzi, N.I.M.; Fen, Y.W.; Omar, N.A.S.; Saleviter, S.; Daniyal, W.M.E.M.M.; Hashim, H.S.; Nasrullah, M. Nanostructured chitosan/maghemite composites thin film for potential optical detection of mercury ion by surface plasmon resonance investigation. Polymers 2020, 12, 1497. [Google Scholar] [CrossRef] [PubMed]
  22. Wu, F.; Thomas, P.A.; Kravets, V.G.; Arola, H.O.; Soikkeli, M.; Iljin, K.; Kim, G.; Kim, M.; Shin, H.S.; Andreeva, D.V.; et al. Layered material platform for surface plasmon resonance biosensing. Sci. Rep. 2019, 9, 20286. [Google Scholar] [CrossRef] [Green Version]
  23. Zhang, P.; Chen, Y.P.; Wang, W.; Shen, Y.; Guo, J.S. Surface plasmon resonance for water pollutant detection and water process analysis. Trends Anal. Chem. 2016, 85, 153–165. [Google Scholar] [CrossRef]
  24. Zhang, Y.; Xu, M.; Wang, Y.; Toledo, F.; Zhou, F. Studies of metal ion binding by apo-metallothioneins attached onto preformed self-assembled monolayers using a highly sensitive surface plasmon resonance spectrometer. Sens. Actuators B Chem. 2007, 123, 784–792. [Google Scholar] [CrossRef] [Green Version]
  25. Shaban, M.; Hady, A.G.A.; Serry, M. A new sensor for heavy metals detection in aqueous media. IEEE Sens. J. 2014, 14, 436–441. [Google Scholar] [CrossRef]
  26. Zijlstra, P.; Paulo, P.M.R.; Yu, K.; Xu, Q.H.; Orrit, M. Chemical interface damping in single gold nanorods and its near elimination by tip-specific functionalization. Angew. Chemie Int. Ed. 2012, 51, 8352–8355. [Google Scholar] [CrossRef] [PubMed]
  27. Kim, S.-H.; Han, S.-K.; Jang, G.-S.; Koh, K.-N.; Kang, S.-W.; Keum, S.-R.; Yoon, C.-M. Surface plasmon resonance study on the interaction of a dithiosquarylium dye with metal ions. Dyes Pigm. 2000, 44, 169–173. [Google Scholar] [CrossRef]
  28. Panta, Y.M.; Liu, J.; Cheney, M.A.; Joo, S.W.; Qian, S. Ultrasensitive detection of mercury (II) ions using electrochemical surface plasmon resonance with magnetohydrodynamic convection. J. Colloid Interface Sci. 2009, 333, 485–490. [Google Scholar] [CrossRef] [PubMed]
  29. Daniyal, W.M.E.M.M.; Fen, Y.W.; Abdullah, J.; Saleviter, S.; Omar, N.A.S. Preparation and characterization of hexadecyltrimethylammonium bromide modified nanocrystalline cellulose/graphene oxide composite thin film and its potential in sensing copper ion using surface plasmon resonance technique. Optik 2018, 173, 71–77. [Google Scholar] [CrossRef]
  30. Wang, C.; Zhang, C.; Zhao, Y.; Yan, X.; Cao, P. Poisoning Effect of SO2 on honeycomb cordierite-based Mn–Ce/Al2O3 catalysts for NO reduction with NH3 at low temperature. Appl. Sci. 2018, 8, 95. [Google Scholar] [CrossRef] [Green Version]
  31. Fen, Y.W.; Yunus, W.M.M.; Talib, Z.A. Analysis of Pb(II) ion sensing by crosslinked chitosan thin film using surface plasmon resonance spectroscopy. Optik 2013, 124, 126–133. [Google Scholar] [CrossRef]
  32. Hong, S.; Kang, T.; Moon, J.; Oh, S.; Yi, J. Surface plasmon resonance analysis of aqueous copper ions with amino-terminated self-assembled monolayers. Colloid Surf. A Physicochem. Eng. Asp. 2007, 292, 264–270. [Google Scholar] [CrossRef]
  33. Raj, D.R.; Prasanth, S.; Vineeshkumar, T.V.; Sudarsanakumar, C. Surface plasmon resonance based fiber optic sensor for mercury detection using gold nanoparticles PVA hybrid. Opt. Commun. 2016, 367, 102–107. [Google Scholar]
  34. Eddin, F.B.K.; Fen, Y.W. The principle of nanomaterials based surface plasmon resonance biosensors and its potential for dopamine detection. Molecules 2020, 25, 2769. [Google Scholar] [CrossRef] [PubMed]
  35. Chah, S.; Yi, J.; Zare, R.N. Surface plasmon resonance analysis of aqueous mercuric ions. Sensors Actuators B Chem. 2004, 99, 216–222. [Google Scholar] [CrossRef]
  36. Yu, J.C.C.; Lai, E.P.C.; Sadeghi, S. Surface plasmon resonance sensor for Hg(II) detection by binding interactions with polypyrrole and 2-mercaptobenzothiazole. Sens. Actuators B Chem. 2004, 101, 236–241. [Google Scholar] [CrossRef]
  37. Lee, S.M.; Kang, S.W.; Kim, D.U.; Cui, J.Z.; Kim, S.H. Effect of metal ions on the absorption spectra and surface plasmon resonance of an azacrown indoaniline dye. Dyes Pigm. 2001, 49, 109–115. [Google Scholar] [CrossRef]
  38. Hur, Y.; Ock, K.; Kim, K.; Jin, S.; Gal, Y.; Kim, J.; Kim, S.; Koh, K. Surface plasmon resonance study on enhanced refractive index change of an Ag+ ion-sensing membrane containing dithiosquarylium dye. Anal. Chim. Acta 2002, 460, 133–139. [Google Scholar] [CrossRef]
  39. Forzani, E.S.; Zhang, H.; Chen, W.; Tao, N. Detection of heavy metal ions in drinking water using a high-resolution differential surface plasmon resonance sensor. Environ. Sci. Technol. 2005, 39, 1257–1262. [Google Scholar] [CrossRef]
  40. Chau, Y.C.; Wang, C.; Shen, L.; Lim, C.M.; Chao, C.C.; Huang, H.J.; Lin, C.; Kumara, N.T.R.N. Simultaneous realization of high sensing sensitivity and tunability in plasmonic nanostructures arrays. Sci. Rep. 2017, 7, 16817. [Google Scholar] [CrossRef] [Green Version]
  41. Pelossof, G.; Tel-Vered, R.; Willner, I. Amplified surface plasmon resonance and electrochemical detection of Pb2+ ions using the Pb2+-dependent DNAzyme and hemin/G-quadruplex as a label. Anal. Chem. 2012, 84, 3703–3709. [Google Scholar] [CrossRef] [PubMed]
  42. Kim, E.J.; Chung, B.H.; Lee, H.J. Parts per trillion detection of Ni(II) ions by nanoparticle-enhanced surface plasmon resonance. Anal. Chem. 2012, 84, 10091–10096. [Google Scholar] [CrossRef]
  43. May, L.M.; Russell, D.A. Novel determination of cadmium ions using an enzyme self-assembled monolayer with surface plasmon resonance. Anal. Chim. Acta 2003, 500, 119–125. [Google Scholar] [CrossRef]
  44. Lin, T.J.; Chung, M.F. Detection of cadmium by a fiber-optic biosensor based on localized surface plasmon resonance. Biosens. Bioelectron. 2009, 24, 1213–1218. [Google Scholar] [CrossRef]
  45. Wang, S.; Forzani, E.S.; Tao, N. Detection of heavy metal ions in water by high-resolution surface plasmon resonance spectroscopy combined with anodic stripping voltammetry. Anal. Chem. 2007, 79, 4427–4432. [Google Scholar] [CrossRef] [PubMed]
  46. Verma, R.; Gupta, B.D. Detection of heavy metal ions in contaminated water by surface plasmon resonance based optical fibre sensor using conducting polymer and chitosan. Food Chem. 2015, 166, 568–575. [Google Scholar] [CrossRef]
  47. Eum, N.-S.; Lee, S.-H.; Lee, D.-R.; Kwon, D.-K.; Shin, J.-K.; Kim, J.-H.; Kang, S.-W. K+-ion sensing using surface plasmon resonance by NIR light source. Sens. Actuators B Chem. 2003, 96, 446–450. [Google Scholar] [CrossRef]
  48. Zainuddin, N.H.; Fen, Y.W.; Alwahib, A.A.; Yaacob, M.H.; Bidin, N.; Omar, N.A.S.; Mahdi, M.A. Detection of adulterated honey by surface plasmon resonance optical sensor. Optik 2018, 168, 134–139. [Google Scholar] [CrossRef]
  49. Fen, Y.W.; Yunus, W.M.M.; Moksin, M.M.; Talib, Z.A.; Yusof, N.A. Surface plasmon resonance optical sensor for mercury ion detection by crosslinked chitosan thin film. J. Optoelectron. Adv. Mater. 2011, 13, 279–285. [Google Scholar]
  50. Kumar, P.; Kim, K.-H.; Bansal, V.; Lazarides, T.; Kumar, N. Progress in the sensing techniques for heavy metal ions using nanomaterials. J. Ind. Eng. Chem. 2017, 54, 30–43. [Google Scholar] [CrossRef]
  51. Dhayal, M.; Ratner, D.M. XPS and SPR analysis of glycoarray surface density. Langmuir 2009, 25, 2181–2187. [Google Scholar] [CrossRef] [Green Version]
  52. Martinis, E.M.; Wuilloud, R.G. Enhanced spectrophotometric detection of Hg in water samples by surface plasmon resonance of Au nanoparticles after preconcentration with vortex-assisted liquid-liquid microextraction. Spectrochim. Acta A Mol. Biomol. Spectrosc. 2016, 167, 111–115. [Google Scholar] [CrossRef]
  53. Wu, C.M.; Lin, L.Y. Utilization of albumin-based sensor chips for the detection of metal content and characterization of metal-protein interaction by surface plasmon resonance. Sens. Actuators B Chem. 2005, 110, 231–238. [Google Scholar] [CrossRef]
  54. Yao, F.; He, J.; Li, X.; Zou, H.; Yuan, Z. Studies of interaction of copper and zinc ions with Alzheimer’s Aβ(1-16) using surface plasmon resonance spectrometer. Sens. Actuators B Chem. 2012, 161, 886–891. [Google Scholar] [CrossRef]
  55. Fahnestock, K.J.; Manesse, M.; McIlwee, H.A.; Schauer, C.L.; Boukherroub, R.; Szunerits, S. Selective detection of hexachromium ions by localized surface plasmon resonance measurements using gold nanoparticles/chitosan composite interfaces. Analyst 2009, 134, 881–886. [Google Scholar] [CrossRef]
  56. Roshidi, M.D.A.; Fen, Y.W.; Daniyal, W.M.E.M.M.; Omar, N.A.S.; Zulholinda, M. Structural and optical properties of chitosan–poly(amidoamine) dendrimer composite thin film for potential sensing Pb2+ using an optical spectroscopy. Optik 2019, 185, 351–358. [Google Scholar] [CrossRef]
  57. Cennamo, N.; Massarotti, D.; Galatus, R.; Conte, L.; Zeni, L. Performance Comparison of Two Sensors Based on Surface Plasmon Resonance in a Plastic Optical Fiber. Sensors 2013, 13, 721–735. [Google Scholar] [CrossRef]
  58. Qiu, G.Y.; Law, A.H.L.; Ng, S.P.; Wu, C.M.L. Label-free detection of lead(II) ion using differential phase modulated localized surface plasmon resonance sensors. Procedia Eng. 2016, 168, 533–536. [Google Scholar] [CrossRef]
  59. Castillo, J.; Chirinos, J.; Gutiérrez, H.; La Cruz, M. Surface plasmon resonance sensor based on golden nanoparticles and cold vapour generation technique for the detection of mercury in aqueous samples. Opt. Laser Technol. 2017, 94, 34–39. [Google Scholar] [CrossRef]
  60. Daniyal, W.M.E.M.M.; Fen, Y.W.; Abdullah, J.; Hashim, H.S.; Fauzi, N.I.M.; Chanlek, N.; Mahdi, M.A. X-ray photoelectron study on gold/nanocrystalline cellulose-graphene oxide thin film as surface plasmon resonance active layer for metal ion detection. Thin Solid Films 2020, 713, 138340–138350. [Google Scholar] [CrossRef]
  61. Amjadi, M.; Shokri, R.; Hallaj, T. A new turn-off fluorescence probe based on graphene quantum dots for detection of Au(III) ion. Spectrochim. Acta A Mol. Biomol. Spectrosc. 2016, 153, 619–624. [Google Scholar] [CrossRef]
  62. Balandin, A.A. Thermal properties of graphene and nanostructured carbon materials. Nat. Mater. 2011, 10, 569–581. [Google Scholar] [CrossRef] [Green Version]
  63. Omar, N.A.S.; Fen, Y.W.; Saleviter, S.; Kamil, Y.M.; Daniyal, W.M.E.M.M.; Abdullah, J.; Mahdi, M.A. Experimental evaluation on surface plasmon resonance sensor performance based on sensitive hyperbranched polymer nanocomposite thin films. Sensors Actuators A Phys. 2020, 303, 111830–111840. [Google Scholar] [CrossRef]
  64. Daghestani, H.N.; Day, B.W. Theory and applications of surface plasmon resonance, resonant mirror, resonant waveguide grating, and dual polarization interferometry biosensors. Sensors 2010, 10, 9630–9646. [Google Scholar] [CrossRef]
  65. Jana, J.; Ganguly, M.; Pal, T. Enlightening surface plasmon resonance effect of metal nanoparticles for practical spectroscopic application. RSC Adv. 2016, 6, 86174–86211. [Google Scholar] [CrossRef]
  66. Liu, C.; Liu, Q.; Hu, X. SPR phase detection for measuring the thickness of thin metal films. Opt. Express 2014, 22, 7574–7580. [Google Scholar] [CrossRef]
  67. Fen, Y.W.; Yunus, W.M.M. Utilization of chitosan-based sensor thin films for the detection of lead ion by surface plasmon resonance optical sensor. IEEE Sens. J. 2013, 13, 1413–1418. [Google Scholar] [CrossRef]
  68. Shushama, K.N.; Rana, M.M.; Inum, R.; Hossain, M.B. Sensitivity enhancement of graphene coated surface plasmon resonance biosensor. Opt. Quantum Electron. 2017, 49, 381. [Google Scholar] [CrossRef]
  69. Yue, C.; Qin, Z.; Lang, Y.; Liu, Q. Determination of thin metal film’s thickness and optical constants based on SPR phase detection by simulated annealing particle swarm optimization. Opt. Commun. 2019, 430, 238–245. [Google Scholar] [CrossRef]
  70. Hasib, M.H.H.; Nur, J.N.; Rizal, C.; Shushama, K.N. Improved transition metal dichalcogenides-based surface plasmon resonance biosensors. Condens. Matter 2019, 4, 49. [Google Scholar] [CrossRef] [Green Version]
  71. Abitbol, T.; Marway, H.; Cranston, E.D. Surface modification of cellulose nanocrystals with cetyltrimethylammonium bromide. Nord. Pulp Pap. Res. J. 2014, 29, 46–57. [Google Scholar] [CrossRef]
  72. Fen, Y.W.; Yunus, W.M.M.; Talib, Z.A.; Yusof, N.A. Development of surface plasmon resonance sensor for determining zinc ion using novel active nanolayers as probe. Spectrochim. Acta A Mol. Biomol. Spectrosc. 2015, 134, 48–52. [Google Scholar] [CrossRef]
  73. Babar, S.; Weaver, J.H. Optical constants of Cu, Ag, and Au revisited. Appl. Opt. 2015, 54, 477–481. [Google Scholar] [CrossRef]
  74. Johnson, P.B.; Christy, R.W. Optical constant of the nobel metals. Phys. Rev. B 1972, 6, 4370–4379. [Google Scholar] [CrossRef]
  75. Homola, J. Surface Plasmon Resonance Based Sensors; Springer Series on Chemical Sensors and Biosensors; Springer: Berlin/Heidelberg, Germany, 2006; Volume 4, pp. 3–44. [Google Scholar]
  76. Kedenburg, S.; Vieweg, M.; Gissibl, T.; Giessen, H. Linear refractive index and absorption measurements of nonlinear optical liquids in the visible and near-infrared spectral region. Opt. Mat. Express 2012, 2, 1588–1611. [Google Scholar] [CrossRef]
  77. Usman, F.; Dennis, J.O.; Seong, K.C.; Ahmed, A.Y.; Ferrell, T.L.; Fen, Y.W.; Sadrolhosseini, A.R.; Ayodele, O.B.; Meriaudeau, F.; Saidu, A. Enhanced sensitivity of surface plasmon resonance biosensor functionalized with doped polyaniline composites for the detection of low-concentration acetone vapour. J. Sensors 2019, 2019, 5786105. [Google Scholar] [CrossRef] [Green Version]
  78. Zynio, S.A.; Samoylov, A.V.; Surovtseva, E.R.; Mirsky, V.M.; Shirshov, Y.M. Bimetallic layers increase sensitivity of affinity sensors based on surface plasmon resonance. Sensors 2002, 2, 62–70. [Google Scholar] [CrossRef] [Green Version]
  79. Landry, V.; Alemdar, A.; Blanchet, P. Nanocrystalline cellulose: Morphological, physical, and mechanical properties. For. Prod. J. 2011, 61, 104–112. [Google Scholar] [CrossRef]
  80. Anas, N.A.A.; Fen, Y.W.; Yusof, N.A.; Omar, N.A.S.; Daniyal, W.M.E.M.M.; Ramdzan, N.S.M. Highly sensitive surface plasmon resonance optical detection of ferric ion using CTAB/hydroxylated graphene quantum dots thin film. J. Appl. Phys. 2020, 128, 083105. [Google Scholar] [CrossRef]
  81. Saleviter, S.; Fen, Y.W.; Daniyal, W.M.E.M.M.; Abdullah, J.; Sadrolhosseini, A.R.; Omar, N.A.S. Design and analysis of surface plasmon resonance optical sensor for determining cobalt ion based on chitosan-graphene oxide decorated quantum dots-modified gold active layer. Opt. Express 2019, 27, 32294–32307. [Google Scholar] [CrossRef]
  82. Fouad, S.; Sabri, N.; Jamal, Z.A.Z.; Poopalan, P. Surface plasmon resonance sensor sensitivity enhancement using gold-dielectric material. Int. J. Nanoelectron. Mater. 2017, 10, 147–156. [Google Scholar]
  83. Mudgal, N.; Saharia, A.; Agarwal, A.; Singh, G. ZnO and Bi-metallic (Ag–Au) layers based surface plasmon resonance (SPR) biosensor with BaTiO3 and graphene for biosensing applications. IETE J. Res. 2020, 1, 1–8. [Google Scholar] [CrossRef]
  84. Agarwal, S.; Giri, P.; Prajapati, Y.K.; Chakrabarti, P. Effect of surface roughness on the performance of optical spr sensor for sucrose detection: Fabrication, characterization, and simulation study. IEEE Sens. J. 2016, 16, 8865–8873. [Google Scholar] [CrossRef]
  85. Hoseinian, M.S.; Bolorizadeh, M.A. Design and simulation of a highly sensitive SPR optical fiber sensor. Photonic Sens. 2019, 9, 33–42. [Google Scholar] [CrossRef] [Green Version]
Figure 1. Kretschmann configuration to generate the surface plasmon resonance (SPR) signal.
Photonics 08 00361 g001
Figure 2. Optical setup of surface plasmon resonance spectroscopy with nanocrystalline cellulose (NCC)-based thin film.
Photonics 08 00361 g002
Figure 3. (a) Real part and (b) imaginary part refractive index for copper, gold, and silver from 400–650 nm wavelength.
Photonics 08 00361 g003
Figure 4. SPR signal using different excitation wavelength for (a) copper, (b) gold, and (c) silver (thickness of 50 nm) in contact with air.
Photonics 08 00361 g004
Figure 5. SPR signal using different excitation wavelength for (a) copper, (b) gold, and (c) silver (thickness of 50 nm) in contact with water.
Photonics 08 00361 g005
Figure 6. The full width half maximum (FWHM) of the SPR curve.
Photonics 08 00361 g006
Figure 7. Optimization of the SPR signal based on different wavelengths of light sources for (a) copper, (b) gold, and (c) silver.
Photonics 08 00361 g007
Figure 8. Optimization of the SPR signal based on different thickness of (a) copper, (b) gold, and (c) silver in contact with water and excitation wavelength of 633 nm.
Photonics 08 00361 g008
Figure 9. Fitted SPR signal of the gold thin film in contact with deionized water and copper ion.
Photonics 08 00361 g009
Figure 10. Fitted data and experimental data of SPR signal for NCC-based sensing layer on gold thin film in contact with deionized water.
Photonics 08 00361 g010
Figure 11. Optimization of the SPR signal based on different thickness of NCC-based layer.
Photonics 08 00361 g011
Figure 12. Fitted data and experimental data of SPR signal for NCC-based thin film in contact with copper ion from 0.01–10 ppm.
Photonics 08 00361 g012
Figure 13. Refractive index of the NCC-based thin film (a) real part and (b) imaginary part at different concentrations.
Photonics 08 00361 g013
Figure 14. Sensitivity for the NCC-based thin film in contact with copper ion using SPR.
Photonics 08 00361 g014
Table 1. The FWHM and accuracy of copper, gold, and silver thin film at different wavelengths.
MetalWavelength (nm)FWHM (Degree)Accuracy (Degree−1)
Copper6133.20.31
6233.00.33
6332.80.36
6432.50.40
6532.20.45
Gold6132.50.40
6232.30.43
6332.20.45
6432.20.45
6532.20.45
Silver6130.52.0
6230.52.0
6330.52.0
6430.42.5
6530.42.5
Table 2. The FWHM and accuracy of NCC-based thin film at different thickness.
Thickness (nm)FWHM (Degree)Accuracy (Degree−1)
63.00.333
73.20.313
83.40.294
93.50.286
103.60.277
113.70.270
123.80.263
133.90.256
Table 3. Refractive index of the NCC-based layer in contact with deionized water and copper ion.
Concentration (ppm)Refractive Index of Sensing Layer After in Contact with Copper IonsThickness of NCC Based Layer (nm)
Real Part, nImaginary Part, k
01.4240.2529.5
0.011.4570.1929.7
0.051.4670.1739.9
0.081.4820.15510.3
0.11.4870.13610.5
0.51.5040.12311.0
11.5040.12311.0
51.5040.12311.0
101.5040.12311.0
Publisher’s Note: MDPI stays neutral with regard to jurisdictional claims in published maps and institutional affiliations.

