Thermal Stability Analysis of Surface Wave Assisted Bio-Photonic Sensor


1
Innovative Technologies Laboratories (ITL), King Abdullah University of Science and Technology (KAUST), Thuwal 23955, Saudi Arabia
2
ECE Department, Jaypee Institute of Information Technology, Noida 201309, India
*
Author to whom correspondence should be addressed.
Photonics 2022, 9(5), 324; https://doi.org/10.3390/photonics9050324
Submission received: 7 April 2022
/
Revised: 29 April 2022
/
Accepted: 30 April 2022
/
Published: 9 May 2022
Abstract
:In this paper, the thermal stability of a Bloch Surface Wave (BSW) assisted bio-photonic sensor is investigated. The structural analysis is carried out using the transfer matrix method (TMM). The design comprises a truncated one-dimensional photonic crystal (1D-PhC) structure along with a defective top layer. The structural parameters are optimized to excite a BSW at the top interface for an operating wavelength of 632.8 nm. The mode confinement is confirmed by using wavelength interrogation, angular interrogation and surface electric field profile. Further, the effect of thermal variation on BSW excitation angle and sensitivity is carried out. The analysis shows the average variations in excitation angle and sensitivity of about −0.00096 degree/ and 0.01046 (degree/RIU)/, respectively. Additionally, the analysis is also extended towards different lower wavelengths of 400 nm and 550 nm, which provides average variations in the excitation angles of about −0.0027 degree/, and 0.0016 degree/. This shows that the structural sensitivity response is more thermally stable at the lower wavelength range. Thus, showing its potential applications in designing thermally stable bio-photonic sensors.
1. Introduction
Surface wave based optical sensing devices are a prominent research area globally. The Surface Plasmon Polaritons (SPP) is a very prominent technique, which founds its applications in integrated photonic, healthcare monitoring, medical diagnostics, drug detection, and environmental monitoring [1,2,3,4]. It is also widely used as a label free biosensor to study molecular interactions along with their binding mechanism and wave-guiding applications. The most interesting and important features of SPR devices are their good sensitivity, instantaneous response, and label free detection [5,6,7,8]. However, its performance improvement is limited because of the higher absorption losses, hence lower sensitivity and figure-of-merit (FOM). The SPR can only be used to excite TM modes (longitudinal modes) with some specific momentum coupling technique (grating or prism). Moreover, operating wavelength tuning is also not possible in the SPR based devices. These problems can be alleviated by replacing the metallic top layer by a defect dielectric layer or 2D materials (i.e. Graphene, Transition-metal Dichalcogenides) on a truncated interface of a one-dimensional photonic crystal (1D-PhC) structure [9,10]. This leads to the excitation of plasmonic-like resonance mode called Bloch Surface Wave (BSW) or Optical Tamm States (OTS) at the interface of one-dimensional photonic crystals (1D-PhC) and a defect layer [11,12,13]. Excitation of Tamm Plasmon Polariton is not possible without a metallic layer; however, Optical Tamm state and Bloch surface mode can be excited using dielectric materials [12,14,15,16,17].
Recently, a number of optical sensors using surface waves have been proposed in the literature for biochemical sensing applications. Bijalwan et al. (2020) proposed a graphene and WSe (TMDC) material based structure and reported an average sensitivity of 163°/RIU (WSe) and 160°/RIU (graphene), respectively [18]. The PtSe TMDC-based sensor is also explored for RI-based sensing applications [19]. The authors reported a gold and silver assisted sensitivity of around 165°/RIU and 162°/RIU, respectively. A purely dielectric structure-based 1D-PhC surface wave sensor structure having a top dielectric defect layer as a cover is introduced for sensing purposes [20]. The authors monitored the shift in coupling angle by infiltrating various concentrations of hemoglobin at a top air–dielectric interface and reported an average sensitivity of 69°/RIU. Recently, in 2021 Gryga et al. [21] also proposed a purely dielectric based 1D-PhC surface wave sensor and reported a sensitivity of around 1456 nm/RIU for an analyte refractive index of 1.000–1.005. Some other surface wave based integrated optics devices such as waveguides [22,23], lenses [24,25], resonators [26,27] and interferometers [28] have also been realized.
The characteristic parameters (such as excitation angle, mode wavelength and sensitivity, etc.) of these devices are very sensitive to the thermal variation [29]. Yaremchuk et al. [30] studied the impact of temperature variation on SPR based sensor performance and reported a 0.23 degree change in excitation angle for a corresponding thermal variation from 100 K to 800 K. Moreover, the spectrum is also broadened, which deteriorate the accuracy of the sensor. A grating coupled SPR based sensor structure has been evaluated [31]. The authors reported a sensitivity variation of 0.002 ((degree/RIU)/) for gold metal in the temperature range of 300 K to 400 K. Similarly, an 88.7 pm/ sensitivity variation has also been reported for an optical Tamm state based sensor structure [32]. Most of the reported thermal studies have been performed on SPR based sensor structures and confirm the adverse impact on device performance. Less attention has been paid to the study of thermal effect on BSW based devices for most of the mentioned applications. Since temperature exhibits its prominent impact on the device performance, a detailed analysis is required to measure its impact on BSW excitation and the corresponding sensing application, specifically, for the devices in which only dielectrics are employed.
In this paper, a thermal stability analysis of a designed BSW assisted bio-photonic sensor is carried out. The structure comprises alternate dielectric layers of titanium dioxide (TiO) and silicon dioxide (SiO), which possess a photonic band-gap (PBG) centered on a 632.8 nm wavelength. A top defect layer of SiO is deliberately introduced to excite Bloch Surface modes at the interface. The detailed analysis is carried out to investigate the effect of varying surrounding temperatures on the excitation angle of BSW at a 632.8 nm wavelength. Further, the impact of thermal variation is also studied at a comparatively lower wavelengths of 550 nm and 400 nm, respectively. Finally, detailed temperature dependent sensitivity analysis at all three wavelengths is also carried out. The analysis exhibits that for a SiO and TiO material based structure, the BSW excitation angle variation is smaller for a higher wavelength range, whereas sensitivity response is more thermally stable at the lower wavelength range. Thus, showing its major potential applications in developing thermally stable biophotonic sensors. Additionally, the analysis can also be extended to design other thermally stable BSW based devices such as waveguides, filters and resonators.
2. Structure Design and Methods
A multilayer PhC structure is designed by considering alternate layers of material ‘A’ (high refractive index) and material ‘B’ (low refractive index) on glass substrate as shown in Figure 1a. The structure possesses periodicity in the ’y’ direction with defect layer ’D’ at the end for the confinement of BSW. The structure is designed considering a quarter wavelength Bragg stack having ni × di [33,34], where ni and di are the refractive index and physical thickness of ith layer, and o is the central reflected wavelength [35,36]. The phase thicknesses () of each layer is calculated by considering optical thickness (L), frequency (f) and angle of refraction () from each layer and is represented in Equation (1). The reflected electric field profile of the proposed design can be calculated by considering the summation of both forward and backward propagating fields. This can be represented by a Helmholtz equation as shown below in Equation (2) [11].
where A and B are the amplitudes of forward and backward propagating waves, ‘n’ is the layer number and k is the wavenumber. The structural parameters are optimized such that overall constructive interference occurs at the last layer.
This electric field is calculated for all the considered layers and the field components in reflected and transmitted waves are calculated. Since the Eigen value problem needs to be solved for a periodic structure, the Floquet theorem (Equation (3)) along with continuous boundary condition is imposed to formulate the Eigen value problem, which is given by Equation (4) [37,38].
where constant ‘K’ is known as the Bloch wave number, is the phase propagation constant, Mn is the matrix parameter to formulate the ‘M’ matrix in the TMM method and is the period of one stack. The solution of Equation (4) provides Eigen value (e). Thus, the dispersion relation for the proposed surface wave structure can be calculated and represented by Equation (5).
Here, the Bloch wave vector is a complex quantity, which results in both evanescent and propagating surface modes at the top interface. The structure optimizations and sensing analysis are carried-out using the transfer matrix method (TMM) [38,39]. The structural parameters such as layer thicknesses, refractive index contrast, and number of stacks are optimized to obtain the highest possible sensitivity at different central wavelengths of 632.8 nm, 550 nm and 400 nm, respectively. Suitable thermo-physical, experimentally verified values for , T) and , T) have been considered for the analysis. This gives a thickness of SiO and TiO to be around 128 nm and 85 nm, respectively for corresponding refractive indices of 1.46 and 2.2. The imaginary parts of the dielectric constant are also considered to be 0.0007i and 0.0001i for TiO and SiO, respectively for the consideration of the lossy nature of the dielectric material.
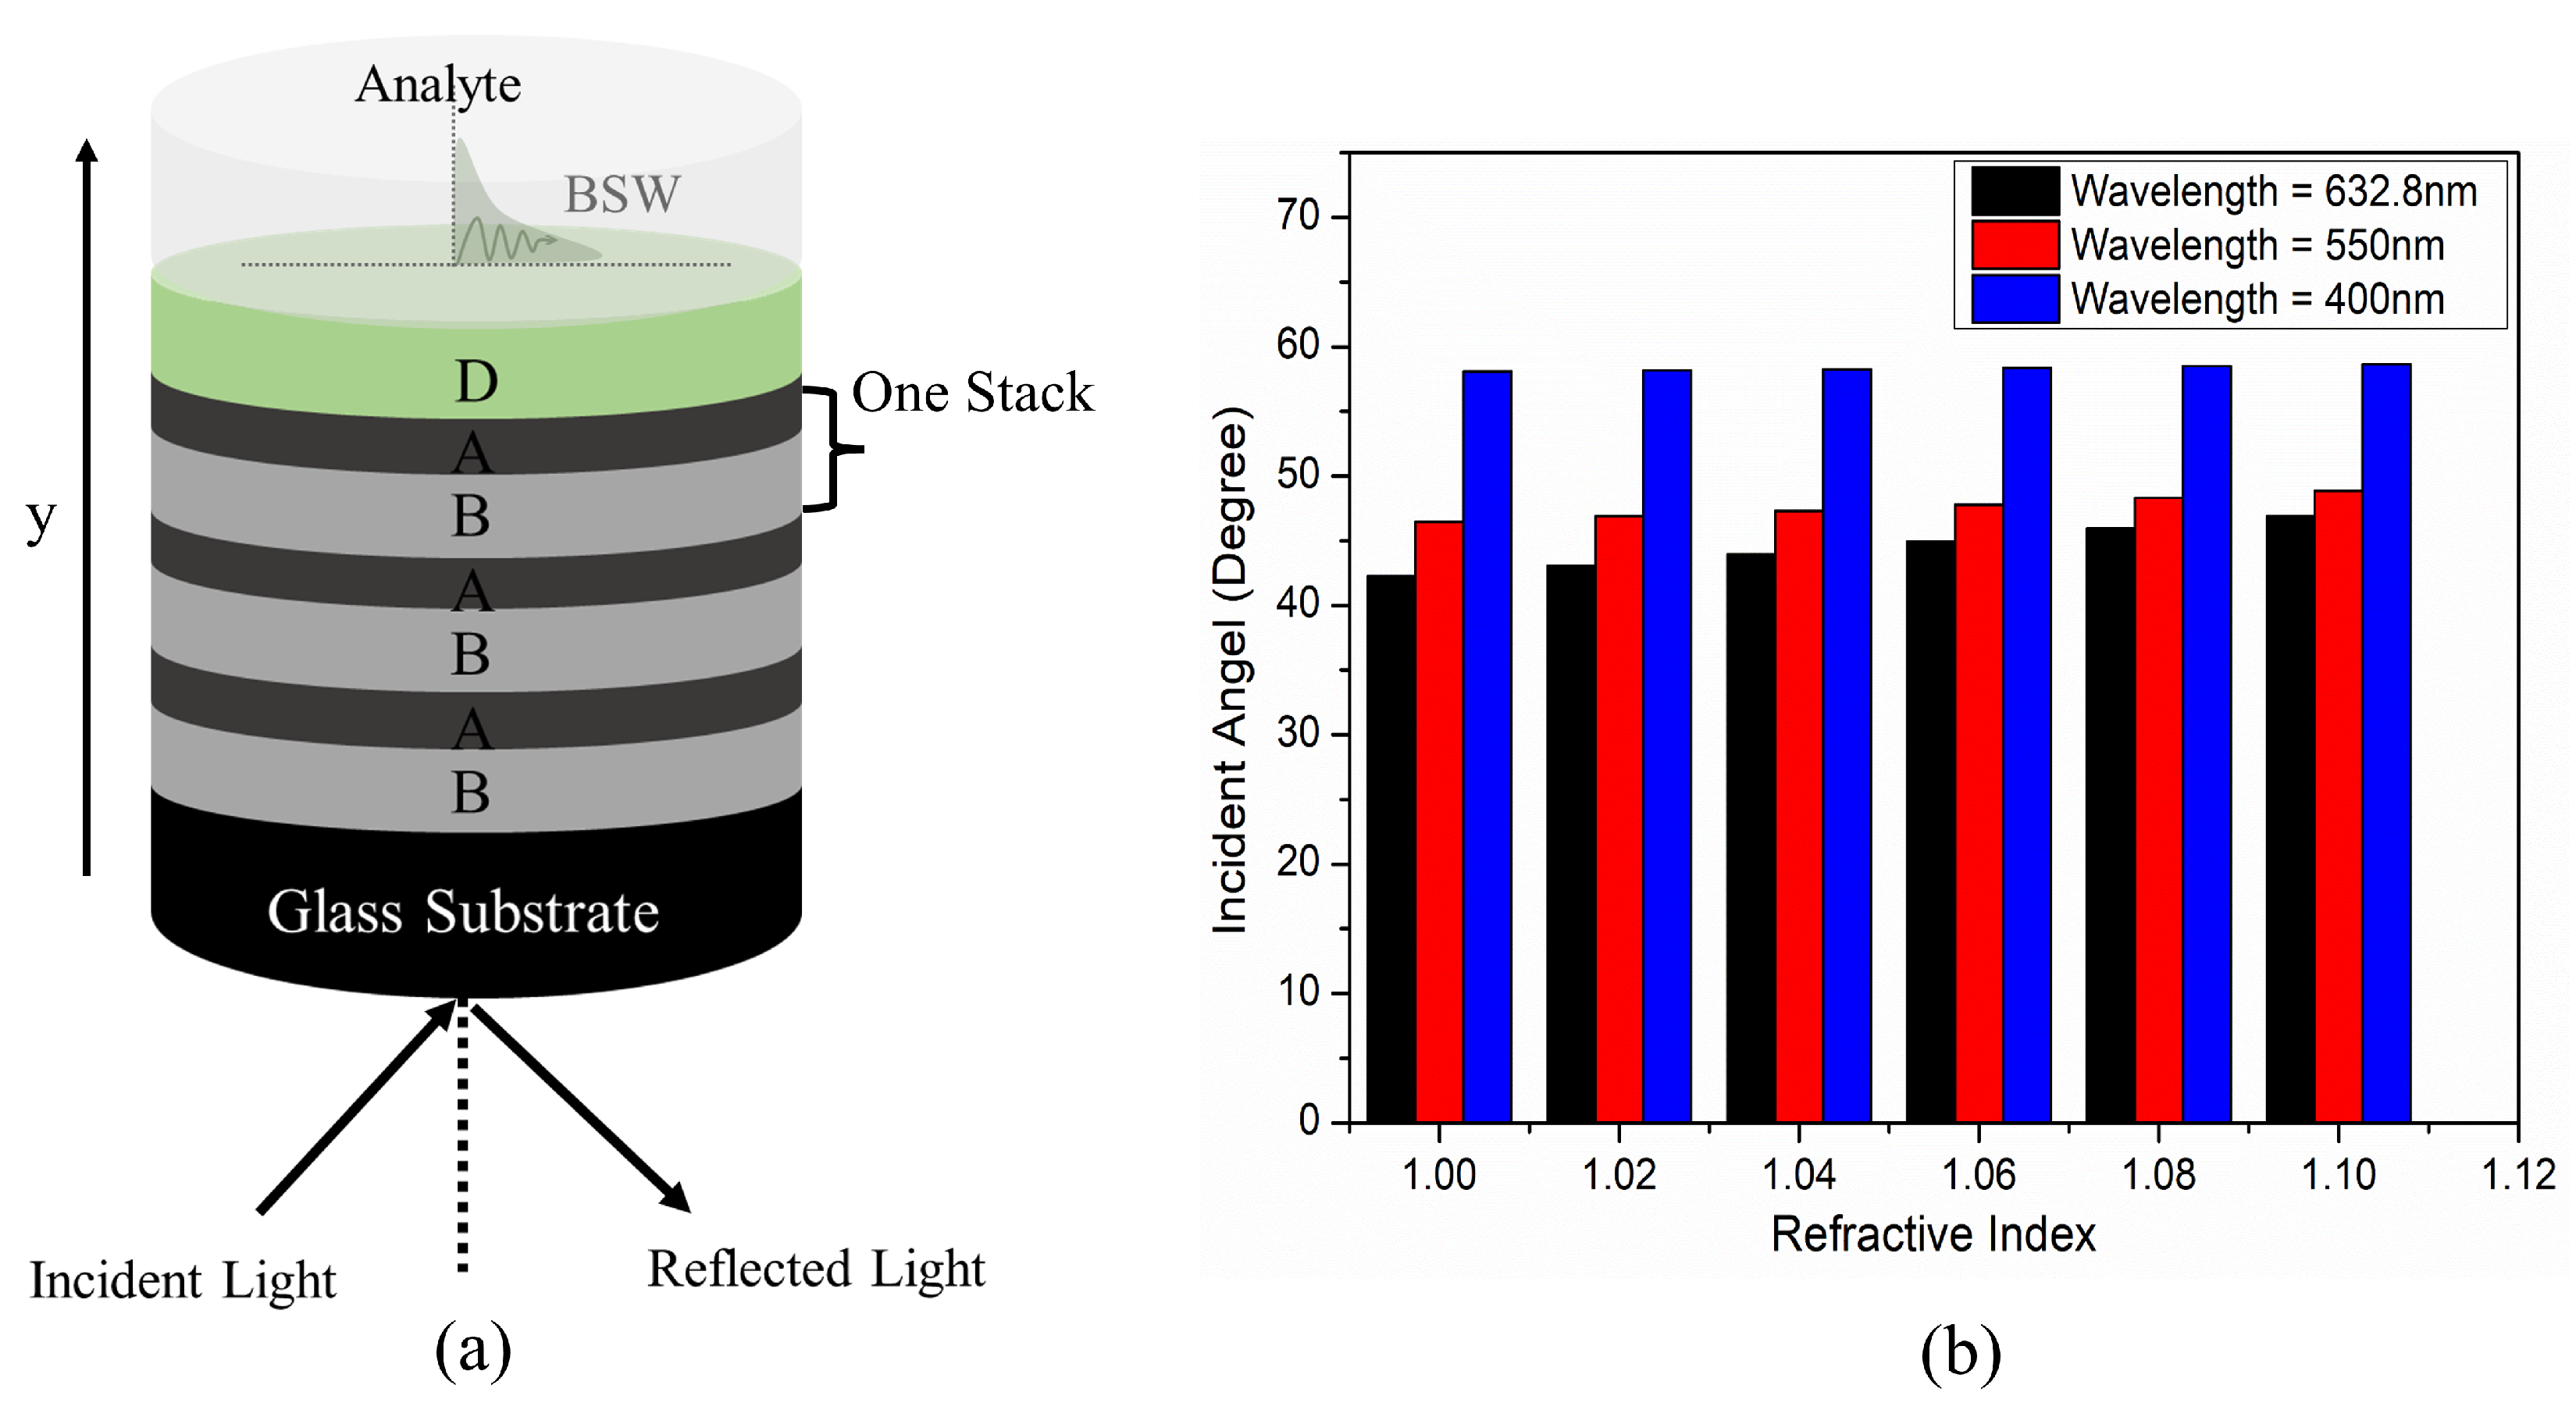
The defect layer thickness is also adjusted to generate optimized BSW. This results in the confinement of BSW at the excitation angle of 42.25 degrees, 46.48 degrees and 58.08 degrees at the corresponding operating wavelengths of 632.8 nm, 550 nm and 400 nm, respectively, as shown in Figure 1b. Here, the BSW has been excited for an optimized defect layer thickness of 165 nm for a six stacked 1D-PhC structure. The mode excitation has also been confirmed by wavelength interrogation and the surface electric filed profile. Here, the analysis is carried out to confirm the BSW excitation at 632.8 nm operating wavelength for Glass|(SiO,TiO)|SiO|air structure. Figure 2a represents the wavelength interrogation of excited BSW at an incident angle of 42.25 degrees. This clearly shows a strong dip in the reflection spectrum at 632.8 nm wavelength. The same has also been confirmed by seeing the electric field profile at the top interface. Figure 2b represents the spectral electric field distribution and mode confinement in the proposed structure for a defect layer thickness of 165 nm. Additionally, the confined modes are evanescent in nature, thus showing its potential applications in bio-photonic sensors.
Figure 3 represents the impact of thermal variations on the effective refractive index (n) of the considered structure. The n is calculated by considering the device parameters such as periodicity (), filling factor of each layer (F), and refractive indices of the low (n) and the high index (n) materials. Thus, n is calculated by Equation (6) [40].
where and are the filling factor (F = d/) of low and high refractive index layer along with and are the corresponding materials permittivity. The thermal variation will affect the material permittivity and thus results in change in the n of the structure. For a central wavelength of 632.8 nm, the calculated n comes to be around 1.82569, 1.82227, 1.82171, 1.82111 and 1.82055 for corresponding thermal variations of ( =) 5, 10, 15 and 20, respectively. The analysis has also been carried out to measure the n at lower wavelengths (550 nm and 400 nm) and the same trend has been observed. The comparative n analysis is represented in Figure 3 and summarized in Table 1.
3. Results and Discussions
In order to characterize the effect of thermal fluctuations on device performance, thermo-optic coefficient (TOC) and thermal expansion coefficient (TEC) of both SiO and TiO are considered. The TOC of titanium dioxide measured for coatings deposited by electron beam deposition is negative and equal to −1.7 × 10 K between 18 and 120 and corresponds to −3.04 × 10 K between 220 and 325 [41]. The TOC of silicon dioxide is positive with a value around 1 × 10 K [42]. The positive TOC of SiO implies that the rise in temperature will cause an increase in effective refractive index of the device. Since the TOC of both the materials is different and opposite in sign, this results in an overall decrease in the effective refractive index of devices. Besides the increase in the refractive index, the device heating also changes the effective optical path length due to positive thermal expansion coefficient. All these factors contribute to the shift in the excitation angle of BSW confinement. However, the refractive index change due to the thermal expansion coefficient is expected to be one order less compared to that of TOC. Thus, in the analysis, only the thermo-optic coefficients of both SiO and TiO are considered.
Figure 4a represents the effect of temperature variation on the reflection spectrum of Glass|(SiO,TiO)|SiO|air structure. The increase in device temperature causes a blue shift in the excitation angle required to confine BSW at the same incident wavelength of 632.8 nm. This is because of the decrease in the overall effective refractive index of the device. This also affects the overall reflection intensity. Figure 4b represents the dependency of excitation angle and normalized reflectance Rn (=R/R0) as a function of (= T − Tamb). Here, R0 is the reflection intensity for an ambient temperature of 25 ( = 0). This clearly indicates that the increase in device temperature leads to a decrease in both required excitation angle (at fixed incident wavelength) and reflection intensity. This is because of the decrease in effective refractive index, which leads to a change in the phase thickness. Thus, the phase matching condition would be satisfied at a lower excitation angle. From the linear fit, we obtain the slope = −0.000745/ for normalized reflection and = −0.00096 degree/ for excitation angle along with coefficients of determination R of around 0.9924 and 1, respectively.
Since incident wavelength also affects the device performance [20], therefore, thermal analysis is also carried out for lower incident wavelengths of 550 nm and 400 nm as well and shown in Figure 5. The decrease in incident wavelength also confines the BSW at the top interface but at different incident angles. Therefore, BSW excitation is observed at 46.48 degrees and 58.08 degrees for corresponding operating wavelengths of 550 nm and 400 nm, respectively. Additionally, this leads to higher thermal instability in the required excitation angle. The temperature dependent variation in excitation angle comes to be around −0.0027 and −0.0016 along with coefficients of determination R of around 0.9998 and 0.9997 for an incident wavelength of 400 nm and 500 nm, respectively. Finally, the effect of temperature variation on the sensitivity of the proposed structure is analysed at all incident wavelengths of 400 nm, 550 nm and 632.8 nm respectively. The RI of infiltrated analyte is varied from 1.00 to 1.1 with a step size of 0.02 and the corresponding reflection spectrum is measured.
Increasing the analyte refractive index leads to a red shift in excitation angle and the same trend has been observed in all configurations. This is because of the increased effective index of the device [43,44], which directly affects the phase thickness. Hence, a shift in the excitation angle is observed. Figure 6a represents the temperature dependent reflectivity spectrum for an incident wavelength on 400 nm at varying infiltrated analyte RI. It is evident from Figure 6a that increasing the infiltrated analyte RI leads to red shift in the required BSW excitation angle at all device temperature ranges. For = 0, the excitation angle is red shifted to 58.64 degrees for the analyte refractive index (RI) of 1.1. Similarly, the same has been measured to be around 58.63 degrees, 58.61 degrees, 58.60 degrees and 58.586 degrees for corresponding temperature variations of ( =) 5, 10, 15 and 20, respectively.
This sensitivity analysis is extended for the other two operating wavelengths of 550 nm and 632 nm as well. Figure 6b compares the temperature dependent sensitivity analysis at incident wavelengths of 400 nm, 550 nm and 632.8 nm, respectively. This shows that an increase in operating wavelengths improves structural sensitivity response. Moreover, the sensitivity variation in all three configurations is also almost linear. Figure 7 represents the temperature dependent sensitivity comparison at incident wavelengths of 400 nm, 550 nm and 632.8 nm. Further, it is also evident from the analysis that an increase in device temperature leads to comparatively higher sensitivity.
It is evident from Figure 7 that the higher the operating wavelength, the greater the thermal instability in the structural sensitivity performance. There is a maximum 0.1046 degrees/RIU change in sensitivity for every 10 variation in temperature at an incident wavelength of 632.8 nm. This sensitivity variation decreases to 0.0389 degrees/RIU and 0.0231 degrees/RIU for an incident wavelength of 550 nm and 400 nm, respectively, with coefficients of determination R of around 0.99271 and 0.98648. Additionally, the temperature dependent variation in excitation angle () comes to be around −0.00096 degrees/, −0.0016 degrees/ and −0.0027 degrees/ for incident wavelengths of 632.8 nm, 550 nm and 400 nm, respectively. The obtained results are summarized in Table 1.
4. Conclusions
In this paper, thermal stability analysis is carried out for a proposed SiO and TiO material based Bloch Surface Wave assisted photonic crystal bio-photonic sensor. The structural parameters are optimized to excite BSW at the top interface and the same is confirmed by wavelength interrogation, angular interrogation and a surface electric filed profile. The detailed analysis reveals that the structure is highly sensitive and possesses more thermally stable excitation angle variations at higher operating wavelengths. The optimized structure exhibits average excitation angle variations of about −0.0027 degrees/, −0.0016 degrees/ and −0.00096 degrees/ for incident wavelengths of 400 nm, 550 nm and 632.8 nm, respectively. Furthermore, the performed analysis also shows a 0.1046 degrees/RIU maximum change in sensitivity for every 10 change in temperature at a 632.8 nm wavelength.
Author Contributions
Conceptualization, A.K.G., A.K. and Y.M.; Formal analysis, A.K.G. and A.K.; Investigation, Y.M.; Methodology, A.K.G.; Supervision, Y.M.; Validation, A.K.; Writing—original draft, A.K.G. and A.K.; Writing—review & editing, Y.M. All authors have read and agreed to the published version of the manuscript.
Funding
The authors would like to acknowledge the research funding to the KAUST Innovative Technologies Laboratories (ITL) from King Abdullah University of Science and Technology (KAUST).
Institutional Review Board Statement
Not applicable.
Informed Consent Statement
Not applicable.
Data Availability Statement
Data underlying the results presented in this paper are not publicly available at this time but may be obtained from the authors upon reasonable request.
Conflicts of Interest
The authors declare no conflict of interest.
References
- Ciminelli, C.; Campanella, C.M.; Dell’Olio, F.; Campanella, C.E.; Armenise, M.N. Label free optical resonant sensors for biochemical applications. Prog. Quant. Electron. 2013, 37, 51–107. [Google Scholar] [CrossRef]
- Goyal, A.K. Design Analysis of One-Dimensional Photonic Crystal Based Structure for Hemoglobin Concentration Measurement. Prog. Electromagn. Res. M 2020, 97, 77–86. [Google Scholar] [CrossRef]
- Homola, J.; Yee, J.J.; Gauglitz, G. Surface plasmon resonance sensors review. Sens. Actuators B 1999, 54, 3–15. [Google Scholar] [CrossRef]
- Zaky, Z.A.; Ahmed, A.M.; Shalaby, A.S.; Aly, A.H. Refractive index gas sensor based on the Tamm state in a one-dimensional photonic crystal: Theoretical optimisation. Sci. Rep. 2020, 10, 9736. [Google Scholar] [CrossRef]
- Seitz, W.R. Chemical sensors based on fiber optics. Anal. Chem. 1984, 56, 16A. [Google Scholar] [CrossRef]
- Choi, C.J.; Belobraydich, A.R.; Chan, L.L.; Mathias, P.C.; Cunningham, B.T. Comparison of label-free biosensing in microplate, microfluidic, and spot-based affinity capture assays. Anal. Biochem. 2010, 405, 1–10. [Google Scholar] [CrossRef]
- Karlsson, R.; Stahlebrg, R. Surface plasmon resonance detection and multispot sensing for direct monitoring of interactions involving low-molecular-weight analytes and for determination of low affinities. Anal. Biochem. 1995, 228, 274–280. [Google Scholar] [CrossRef]
- Saleh, E.A.; Teich, M.C. Fundamentals of Photonics; Wiley-Interscience: Hoboken, NJ, USA, 2007. [Google Scholar]
- Goyal, A.K.; Saini, J. Performance analysis of Bloch surface wave-based sensor using transition metal dichalcogenides. Appl. Nanosci. 2020, 10, 4307. [Google Scholar] [CrossRef]
- Zaky, Z.A.; Aly, A.H. Modeling of a biosensor using Tamm resonance excited by graphene. Appl. Opt. 2021, 60, 1411–1419. [Google Scholar] [CrossRef]
- Yeh, P.; Yariv, A.; Hong, C. Electromagnetic propagation in periodic stratified media. I. General theory. J. Opt. Soc. Am. 1977, 67, 423–438. [Google Scholar] [CrossRef] [Green Version]
- Yeh, P.; Yariv, A.; Cho, A.Y. Optical surface waves in periodic layered media. Appl. Phys. Lett. 1978, 32, 104–105. [Google Scholar] [CrossRef] [Green Version]
- Goyal, A.K.; Dutta, H.S.; Pal, S. Porous photonic crystal structure for sensing applications. J. Nanophotonics 2018, 12, 040501. [Google Scholar] [CrossRef]
- Baghbadorani, H.K.; Barvestani, J.; Entezar, S.R. Biosensors based on Bloch surface waves in one-dimensional photonic crystal with graphene nanolayers. Appl. Opt. 2017, 56, 462–469. [Google Scholar] [CrossRef] [PubMed]
- Baghbadorani, H.K.; Aurelio, D.; Barvestani, J.; Liscidini, M. Guided modes in photonic crystal slabs supporting Bloch surface waves. J. Opt. Soc. Am. B 2018, 35, 805–810. [Google Scholar] [CrossRef]
- Vinogradov, A.P.; Dorofeenko, A.V.; Merzlikin, A.M.; Lisyansky, A.A. Surface states in photonic crystals. Physics-Uspekhi 2010, 53, 243. [Google Scholar] [CrossRef]
- Abouti, O.E.; Boudouti, E.H.E.; Hassouani, Y.E.; Noual, A.; Djafari-Rouhani, B. Optical Tamm states in one-dimensional superconducting photonic crystal. Physics-Uspekhi 2016, 23, 082115. [Google Scholar] [CrossRef]
- Bijalwan, A.; Singh, B.K.; Rastogi, V. Surface Plasmon Resonance-Based Sensors Using Nano-Ribbons of Graphene and WSe2. Plasmonics 2020, 15, 1015–1023. [Google Scholar] [CrossRef]
- Jia, Y.; Li, Z.; Wang, H.; Saeed, M.; Cai, H. Sensitivity Enhancement of a Surface Plasmon Resonance Sensor with Platinum Diselenide. Sensors 2020, 20, 131. [Google Scholar] [CrossRef] [Green Version]
- Goyal, A.K.; Pal, S. Design analysis of Bloch surface wave based sensor for haemoglobin concentration measurement. Appl. Nanosci. 2020, 10, 3639–3647. [Google Scholar] [CrossRef]
- Gryga, M.; Ciprian, D.; Gembalova, L.; Hlubina, P. Sensing based on Bloch surface wave and self-referenced guided mode resonances employing a one-dimensional photonic crystal. Opt. Express 2021, 29, 12996. [Google Scholar] [CrossRef]
- Luo, H.; Tang, X.; Lu, Y.; Wang, P. Low-Loss Photonic Integrated Elements Based on Bound Bloch Surface Wave in the Continuum. Phys. Rev. Appl. 2021, 16, 014064. [Google Scholar] [CrossRef]
- Sfez, T.; Descrovi, E.; Yu, L.; Brunazzo, D.; Quaglio, M.; Dominici, L.; Nakagawa, W.; Michelotti, F.; Giorgis, F.; Martin, O.J.F.; et al. Bloch surface waves in ultrathin waveguides: Near-field investigation of mode polarization and propagation. J. Opt. Soc. Am. B 2010, 27, 1617–1625. [Google Scholar] [CrossRef]
- Yu, L.; Barakat, E.; Sfez, T.; Hvozdara, L.; Francesco, J.; Herzig, H.P. Manipulating Bloch surface waves in 2D: A platform concept-based flat lens. Light Sci. Appl. 2014, 3, e124. [Google Scholar] [CrossRef]
- Augenstein, Y.; Vetter, A.; Lahijani, B.V.; Herzig, H.P.; Rockstuhl, C.; Kim, M.S. Inverse photonic design of functional elements that focus Bloch surface waves. Light Sci. Appl. 2018, 7, 104. [Google Scholar] [CrossRef] [PubMed]
- Dubey, R.; Lahijani, B.V.; Barakat, E. Near-field characterization of a Bloch-surface-wave-based 2D disk resonator. Opt. Lett. 2016, 41, 4867–4870. [Google Scholar] [CrossRef]
- Rodriguez, G.; Aurelio, D.; Liscidini, M.; Weiss, S. Bloch surface wave ring resonator based on porous silicon. Appl. Phys. Lett. 2019, 115, 0111019. [Google Scholar] [CrossRef]
- Safronov, K.R.; Gulkin, D.N.; Antropov, I.M.; Abrashitova, K.A.; Bessonov, V.O.; Fedyanin, A.A. Multimode interference of Bloch surface electromagnetic waves. ACS Nano 2020, 14, 10428–10437. [Google Scholar] [CrossRef]
- Moreira, C.S.; Lima, A.M.N.; Neff, H.; Thirstrup, C. Temperature-dependent sensitivity of surface plasmon resonance sensors at the gold–water interface. Sens. Actuators B Chem. 2008, 134, 854–862. [Google Scholar] [CrossRef]
- Yaremchuk, I.; Fitio, V.; Petrovska, H.; Bobitski, Y. The temperature impact on the characteristics of the surface plasmon resonance sensors element. Optik 2019, 192, 162969. [Google Scholar] [CrossRef]
- Dhibi, A. Temperature effect on the performance of a 1D grating-based surface-plasmon resonance sensors. Opt. Quant. Electron. 2019, 51, 78. [Google Scholar] [CrossRef]
- Chen, Y.; Shi, W.; Feng, L.; Xu, X.; Shang-Guan, M. Study on simultaneous sensing of gas concentration and temperature in one-dimensional photonic crystal. Superlattices Microstruct. 2019, 131, 53–58. [Google Scholar] [CrossRef]
- Ratra, K.; Singh, M.; Goyal, A.K. Design and Analysis of Omni-directional Solar Spectrum Reflector using One-dimensional Photonic Crystal. J. Nanophoton. 2020, 14, 026005. [Google Scholar] [CrossRef]
- Ratra, K.; Singh, M.; Goyal, A.K.; Kaushik, R. Design and Analysis of Broadband Reflector for Passive Radiative Cooling. In Proceedings of the 5th International Conference on Signal Processing and Communication (ICSC), Noida, India, 7–9 March 2019. [Google Scholar] [CrossRef]
- Goyal, A.K.; Dutta, H.S.; Pal, S. Development of uniform porous one-dimensional photonic crystal based sensor. Optik 2020, 223, 165597. [Google Scholar] [CrossRef]
- Goyal, A.K.; Dutta, H.S.; Pal, S. Porous Multilayer Photonic Band Gap Structure For Optical Sensing. In Proceedings of the 13th International Conference on Fiber Optics and Photonic, Kanpur, India, 4–8 December 2016. [Google Scholar] [CrossRef]
- Zaky, Z.A.; Panda, A.; Pukhrambam, P.D.; Aly, A.H. The impact of magnetized cold plasma and its various properties in sensing applications. Sci. Rep. 2022, 12, 3754. [Google Scholar] [CrossRef] [PubMed]
- Aly, A.H.; Zaky, Z.A.; Shalaby, A.S.; Ahmed, A.M.; Vigneswaran, D. Theoretical study of hybrid multifunctional one-dimensional photonic crystal as a flexible blood sugar sensor. Phys. Scr. 2020, 95, 035510. [Google Scholar] [CrossRef]
- Goyal, A.K.; Kumar, A. Recent advances and progresses in photonic devices for passive radiative cooling application: A review. J. Nanophoton. 2020, 14, 030901. [Google Scholar] [CrossRef]
- Lourtioz, J.M.; Benisty, H.; Berger, V.; Gerard, J.M.; Maystre, D.; Tchelnokov, A. Optical Properties of Photonic Crystals. In Photonic Crystals: Towards Nanoscale Photonic Devices, 2nd ed.; Springer: New York, NY, USA, 2008. [Google Scholar]
- Gulsen, G.; Inci, M.N. Thermal optical properties of TiO2 films. Opt. Mater. 2002, 18, 373–381. [Google Scholar] [CrossRef]
- Ghosh, G. Model for the thermo-optic coefficients of some standard optical glasses. J. Non-Cryst. Solids 1995, 189, 191–196. [Google Scholar] [CrossRef]
- Aly, A.H.; Mohamed, D.; Mohaseb, M.A.; El-Gawaad, N.; Trabelsi, Y. Biophotonic sensor for the detection of creatinine concentration in blood serum based on 1D photonic crystal. RSC Adv. 2020, 10, 31765. [Google Scholar] [CrossRef]
- Dutta, H.S.; Goyal, A.K.; Pal, S. Analysis of Dispersion Diagram for High Performance Refractive Index Sensor based on Photonic Crystal Waveguides. Photonics Nanostruct. Appl. 2017, 23, 21–27. [Google Scholar] [CrossRef]
Figure 1.
(a) Schematic representation of proposed devices, (b) Corresponding BSW excitation analysis at different incident wavelengths.
Figure 1.
(a) Schematic representation of proposed devices, (b) Corresponding BSW excitation analysis at different incident wavelengths.

Figure 2.
Bloch surface wave excitation analysis for 632.8 nm wavelength at an incident angle of 42.25 degrees using (a) Wavelength interrogation, and (b) Corresponding surface electric field profile.
Figure 2.
Bloch surface wave excitation analysis for 632.8 nm wavelength at an incident angle of 42.25 degrees using (a) Wavelength interrogation, and (b) Corresponding surface electric field profile.

Figure 3.
Effect of thermal variation on effective refractive index of the proposed structure.

Figure 4.
Effect of varying temperature on (a) Reflection spectrum of Glass|(SiO,TiO)|SiO|air structure, and (b) Excitation angle and normalized reflectivity for an incident wavelength of 632.8 nm.
Figure 4.
Effect of varying temperature on (a) Reflection spectrum of Glass|(SiO,TiO)|SiO|air structure, and (b) Excitation angle and normalized reflectivity for an incident wavelength of 632.8 nm.

Figure 5.
Effect of increasing device temperature on excitation angle for incident wavelength of, (a) 400 nm, (b) Corresponding linear profile, (c) 550 nm, and (d) Corresponding linear profile.
Figure 5.
Effect of increasing device temperature on excitation angle for incident wavelength of, (a) 400 nm, (b) Corresponding linear profile, (c) 550 nm, and (d) Corresponding linear profile.

Figure 6.
(a) Temperature dependent reflectivity spectrum for an incident wavelength on 400 nm at varying infiltrated analyte RI, and (b) Comparison of temperature dependent sensitivity analysis at incident wavelengths of 400 nm, 550 nm and 632.8 nm.
Figure 6.
(a) Temperature dependent reflectivity spectrum for an incident wavelength on 400 nm at varying infiltrated analyte RI, and (b) Comparison of temperature dependent sensitivity analysis at incident wavelengths of 400 nm, 550 nm and 632.8 nm.

Figure 7.
Linear plot of temperature dependent sensitivity comparison at incident wavelengths of 400 nm, 550 nm and 632.8 nm.
Figure 7.
Linear plot of temperature dependent sensitivity comparison at incident wavelengths of 400 nm, 550 nm and 632.8 nm.


Table 1.
Effect of increasing temperature on excitation angle and sensitivity at different incident wavelengths of 400 nm, 550 nm and 632.8 nm.
Table 1.
Effect of increasing temperature on excitation angle and sensitivity at different incident wavelengths of 400 nm, 550 nm and 632.8 nm.
| Incident Wavelength | Temperature Variations () | Effective Refractive Index | Excitation Angle (Degree) | Sensitivity (Degree/RIU) | Excitation Angle Variations | Sensitivity Variation |
|---|---|---|---|---|---|---|
| 400 nm | 0 | 1.89546 | 58.08219 | 5.50975 | −0.0027 (Degree/) | 0.00231 ((Degree/RIU)/) |
| 5 | 1.89122 | 58.06899 | 5.52432 | |||
| 10 | 1.89051 | 58.05579 | 5.53118 | |||
| 15 | 1.88978 | 58.04199 | 5.54404 | |||
| 20 | 1.88907 | 58.02819 | 5.55775 | |||
| 550 nm | 0 | 1.84284 | 46.48411 | 23.90073 | −0.0016 (Degree/) | 0.00389 ((Degree/RIU)/) |
| 5 | 1.83921 | 46.47631 | 23.91959 | |||
| 10 | 1.83861 | 46.46851 | 23.93587 | |||
| 15 | 1.83798 | 46.46011 | 23.96159 | |||
| 20 | 1.83738 | 46.45231 | 23.97702 | |||
| 632.8 nm | 0 | 1.82569 | 42.24868 | 47.0266 | −0.00096 (Degree/) | 0.01046 ((Degree/RIU)/) |
| 5 | 1.82227 | 42.24388 | 47.0788 | |||
| 10 | 1.82171 | 42.23908 | 47.132 | |||
| 15 | 1.82111 | 42.23428 | 47.18174 | |||
| 20 | 1.82055 | 42.22948 | 47.2366 |
Publisher’s Note: MDPI stays neutral with regard to jurisdictional claims in published maps and institutional affiliations. |
© 2022 by the authors. Licensee MDPI, Basel, Switzerland. This article is an open access article distributed under the terms and conditions of the Creative Commons Attribution (CC BY) license (https://creativecommons.org/licenses/by/4.0/).
Share and Cite
MDPI and ACS Style
Goyal, A.K.; Kumar, A.; Massoud, Y. Thermal Stability Analysis of Surface Wave Assisted Bio-Photonic Sensor. Photonics 2022, 9, 324. https://doi.org/10.3390/photonics9050324
AMA Style
Goyal AK, Kumar A, Massoud Y. Thermal Stability Analysis of Surface Wave Assisted Bio-Photonic Sensor. Photonics. 2022; 9(5):324. https://doi.org/10.3390/photonics9050324
Chicago/Turabian StyleGoyal, Amit Kumar, Ajay Kumar, and Yehia Massoud. 2022. "Thermal Stability Analysis of Surface Wave Assisted Bio-Photonic Sensor" Photonics 9, no. 5: 324. https://doi.org/10.3390/photonics9050324
Note that from the first issue of 2016, this journal uses article numbers instead of page numbers. See further details here.