Au Nanoparticles Coated ZnO Film for Chemical Sensing by PIERS Coupled to SERS

EPF-Ecole d’Ingénieurs, 55 Avenue du Président Wilson, 94230 Cachan, France
Photonics 2022, 9(8), 562; https://doi.org/10.3390/photonics9080562
Submission received: 22 July 2022
/
Revised: 3 August 2022
/
Accepted: 9 August 2022
/
Published: 10 August 2022
(This article belongs to the Section Optical Interaction Science)
Abstract
:In this work, we present a study on the sensing of chemical molecules with Au nanoparticles coated ZnO film by employing the photo-induced enhanced Raman scattering (PIERS) coupled to the surface-enhanced Raman scattering (SERS). Moreover, the interest of coupling the PIERS to classical SERS (electromagnetic contribution) is to achieve a high sensitivity of detection. In our work, we employed the thiophenol molecule for its quality of adsorption on metals and its small size. For this thiophenol detection, we found a limit concentration of 100 pM, an adsorption capacity () of 3.2 × 10 M and an analytical enhancement factor of 1.9 × 10.
1. Introduction
In the last 10 years, the realization of surface-enhanced Raman scattering (SERS) substrates, having considerable factors of Raman enhancement and a weak cost of production, are highly fundamental points for the detection of biological and chemical molecules [1,2,3]. Nowadays, several fabrication techniques (colloidal synthesis [4,5,6] and lithographies [7,8,9]) are usable for the realization of any type of plasmonic nanosystems having various geometries and shapes. These techniques have allowed to obtain plasmonic nanosystems inducing huge Raman enhancements, nevertheless, a couple of these techniques are too costly to be potentially transferable to industry as Deep UV and UV lithographies [10,11,12], and Electron Beam Lithography (EBL) [13,14,15]. Other techniques are employed for their low-cost of fabrication: colloidal synthesis [16,17,18], nanoimprint lithography [19,20,21] (NIL), and nanosphere lithography [22,23,24] (NSL). Concerning to NIL and NSL, certain limits subsist to achieve an excellent definition of plasmonic nanosystems on huge surfaces requested for practical applications of SERS substrates. In addition, several plasmonic nanosystems have been already considered in order to obtain large enhancement factors (EF) for SERS [25,26,27,28,29]. In addition, significant EFs can be also realized by inserting a metallic layer under the plasmonic nanosystems [30,31,32,33]. Moreover, another way is to use semiconducting nanostructures (e.g., silicon, zinc oxide) combined to plasmonic nanoparticles being able, thus, to improve the detection limit [34,35,36,37,38,39,40]. Furthermore, a supplementary way for improving the Raman enhancement has arisen which is the photo-induced enhanced Raman scattering (PIERS). The PIERS effect enables an additional chemical enhancement of the Raman signal compared to standard SERS by the intermediate of an UV-irradiated semiconducting substrate [41,42,43,44,45,46]. This is explained by the generation of surface oxygen vacancies during the UV-irradiation of the semiconducting substrate which allow improving the Raman signal of studied molecules by the intermediate of charge transfer processes between the UV-irradiated substrate and the molecules via plasmonic (metallic) nanoparticles dropped on this same substrate irradiated by UV [41,42,43,44,45,46], or by promoting back-transfer charges to metallic nanoparticles [47]. A few groups have already employed the PIERS effect for sensitive detection of various molecules [45,46,48,49]. However, in all these works [45,48,49], the excitation wavelength for their Raman measurements is relatively far from the plasmon resonance of their nanostructures benefiting no significant Raman enhancement due to an electromagnetic contribution.
Our investigation is aimed to reveal a highly sensitive detection of thiophenol by using photo-activated ZnO film coated with gold nanoparticles. Thanks to these substrates, we will thus produce photo-activated plasmonic nanosystems at a low-cost of production, and a sensitive detection of thiophenol molecules by using the PIERS effect combined to SERS (electromagnetic contribution).
2. Experimental Details
2.1. Production and Structural Characterization of ZnO Film and Au Nanoparticles
The zinc oxide films were produced on c-plane sapphire (c-AlO) substrates by using the technique of pulsed laser deposition with a 99.9995% pure sintered ZnO target and a KrF excimer laser. Next, an annealing at 600 °C in O was performed. Regarding to the production of Au nanoparticles (AuNPs), they were synthesized with the Turkevich method. We added a volume of 1 mL of trisodium citrate (NaCHO with a concentration of 8.5 × 10 M) to a boiling aqueous solution of 20 mL of HAuCl under vigorous stirring over 30 min. The average size of AuNPs is 30 nm for the diameter. Regarding to the structural characterization of the samples, we employed a Siemens D5000 XRD system (Siemens, Erlangen, Germany) in reflection mode and a quartz monochromator (CuK = 1.54056 Å) in order to acquire a X-ray diffraction (XRD) pattern.
2.2. Functionalization of Au Nanoparticles Coated ZnO Films with Thiophenol Molecules
To investigate the PIERS chemical sensing coupled to SERS using the Au nanoparticles coated ZnO films, we employed the thiophenol molecules for its quality of adsorption on the metal surface [50,51]. The first step was to realize thiophenol solutions (thiophenol + ethanol) with concentrations from 100 pM to 1 mM. Then, the substrates were immersed in the thiophenol solution for a duration of 24 h. Hereafter, the substrates were thoroughly dried by employing a nitrogen gun. In addition, we used a thiophenol concentration of 1 M and the same protocol as used previously for the reference experiment.
2.3. Extinction/Raman Measurements and Irradiation with UV Light
For the extinction measurements, a spectrometer (Labram, Horiba Scientific, Kyoto, Japan) in standard transmission geometry with unpolarized light was used. The transmitted light was collected by using a microscope objective (×10, N.A. = 0.25). For the Raman spectroscopy, the same spectrometer was employed whose the spectral resolution is 1 cm and with an excitation wavelength of 532 nm (power = 2.4 mW). We fixed the acquisition time to 5 s for these Raman measurements. We focused the excitation laser on the samples by using a microscope objective (×100, N.A. = 0.9). Hereafter, this microscope objective has collected the Raman signal in a backscattering configuration. Additionally, for the reference experiment (the ZnO film without any Au nanoparticles), the same conditions of excitation were employed. Regarding to the UV-irradiation of the sample, an UV pencil lamp (Edmund Optics, = 254 nm with a nominal output of 4.5 mW/cm) was used and irradiated the sample under normal incidence. The distance was fixed at 2.4 cm between the sample and the lamp.
3. Results and Discussion
Regarding our investigation, we produced a ZnO film whose the thickness was 200 nm on sapphire (c-AlO) substrate by pulsed laser deposition. Afterwards, we drop-casted on the ZnO film Au nanoparticles (AuNPs) whose the diameter was 30 nm, and they were air dried (see Figure 1). Then, the composition of substrates was confirmed by recording an X-ray diffraction (XRD) pattern (see Figure 1) in which two characteristic peaks of ZnO (wurtzite; planes (002) and (110)) and also two peaks for gold (planes (111) and (220)) were pointed. A last diffraction peak (plane (006)) was also pointed corresponding to the sapphire substrate.
Next, we recorded extinction spectra of Au nanoparticles on ZnO film without UV-irradiation and with UV-irradiation times of 15 min and 30 min in order to determine the position of their plasmon resonance (see Figure 2a). We observed a blueshift of 20 nm and 36 nm for the plasmonic resonance of Au nanoparticles when the samples were irradiated with UV during 15 min and 30 min, respectively. This blueshift in the plasmonic resonance upon UV-irradiation is explained by an increase in electron density due to a charge transfer mechanism induced by light from ZnO film to gold nanoparticles. This increase in electron density can be evaluated as follows [45,46,52]:
where and represent the shift of the plasmonic resonance and the position of the plasmonic resonance before UV-irradiation, respectively. Thereby, the increase in electron density () is 12.9% for the UV-irradiation time of 30 min.
For the assessment of the detection performances of the Au nanoparticles coated ZnO films, thiophenol molecules were grafted on these plasmonic ZnO films by employing the procedure depicted in the Section 2.2. Subsequently, we realized Raman spectra of thiophenol on plasmonic ZnO films for the excitation wavelength of 532 nm (see Figure 2b and Figure 3a,b) for each concentration of thiophenol. From the Figure 2b and Figure 3a,b, four Raman peaks of thiophenol molecules [53,54] are well-present (see Table 1 below):

Table 1.
Vibration modes of thiophenol.
| Vibration Modes | Name | Values (cm−1) |
|---|---|---|
| C–H out-of-plane bending, ring out-of-plane deformation | (CH), r–o–d | 999 |
| Ring in-plane deformation, C–C symmetric stretching | r–i–d, (CC) | 1022 |
| C–C symmetric stretching, C–S stretching | (CC), (CS) | 1073 |
| C–C symmetric stretching mode | (CC) | 1573 |
The vibration mode at 1073 cm and the UV-irradiation time of 30 min were chosen for its strongest SERS + PIERS intensity for demonstrating the sensitivity of Au/ZnO films (see Figure 2b). In addition, the time of 30 min for the UV-irradiation was chosen in order to obtain a good compromise between the experiment duration and the PIERS enhancement for optimizing cost and speed of these experiments. Figure 2b displays the SERS spectrum (in black color) and SERS + PIERS spectra (in red and blue color with the UV-irradiation time of 15 min and 30 min, respectively). The first observation is that the SERS intensity (black spectrum without UV-irradiation) is higher than in our previous study [45] due to the fact that the excitation wavelength used here (532 nm) is close to the plasmon resonance of our Au nanoparticles on ZnO film. Indeed, the main rule for enhancing (electromagnetic contribution) the Raman intensity is that the plasmon resonance of these metallic nanoparticles must be located between the excitation wavelength and the wavelength of Raman emission for the vibration mode chosen for the investigation [55]. Here, it is well the case due to our choice of 30 nm for the gold nanoparticle diameter. Indeed, the plasmonic resonance of these Au nanoparticles is, thus, nicely located between = 532 nm (green dashed line) and = 564 nm (mode at 1073 cm, black dashed line), as shown in Figure 2a (see the purple extinction spectrum), compared to our previous work where the excitation wavelength was far from the plasmon resonance of gold nanoparticles [45]. Moreover, when the substrate is irradiated with UV, the plasmonic resonance of our Au nanoparticles on ZnO film stays or is very close from this range comprised between the excitation wavelength and the wavelength of Raman emission, as displayed in Figure 2a (see the blue and dark yellow spectra of extinction), and thus allowing to keep an electromagnetic contribution for the SERS effect in addition to the PIERS effect. Thereby, the Raman intensity is higher than for the only SERS effect or the only PIERS effect, thus permitting a better sensitivity of detection in terms of concentration of molecules (see Figure 2b). In addition, by employing the E model, the enhancement factor (EF) can be expressed as follows [55,56]: EF ∝ where are extinction intensities. From Table 2, we observe that EF keeps a relatively constant value in or close to the domain bounded by the excitation wavelength and the chosen wavelength of Raman emission, indicating the presence of the electromagnetic contribution.
From Figure 3c, we obtained a limit of detection (LOD) of 100 pM for thiophenol molecules. This LOD is more sensitive than that achieved with Klarite SERS substrates composed of gold inverted pyramids (LOD = 10 M, see reference [57]). Furthermore, the experimental data of the Figure 3c were fitted with a Langmuir model defined as follows [57,58]:
where I is the SERS + PIERS intensity at the concentration C. is the maximum value of the SERS + PIERS intensity when a self-assembled monolayer of thiophenol is constituted. C is the employed concentration of thiophenol, and represents the adsorption constant. The experimental data and the Langmuir model are in good accordance. From this model, we have determined the value of which is 3.2 × 10 M, and this latter was bigger than that determined with Klarite SERS substrates ( = 1.1 × 10 M, see reference [57]). This result has indicated that thiophenol molecules were well-adsorbed on the gold nanoparticles. In addition, we also noted that the Raman (SERS + PIERS) intensity varied linearly with the number of detected thiophenol molecules (see Figure S1 in the Supplementary Materials). Lastly, the analytical enhancement factor (AEF) of the plasmonic ZnO film at LOD was calculated, with the following formula [59]:
where (100 pM) corresponds to the thiophenol concentration for SERS+PIERS experiment, and (1 M) is the thiophenol concentration used for the experiment of reference. (see the black SERS+PIERS spectrum in Figure 3b) is the SERS + PIERS intensity, and (see the blue Raman spectrum in Figure 3d) is the Raman intensity. Figure 3d corresponds to the Raman spectra of the ZnO film without AuNPs (reference experiment). We obtained an AEF value of 1.9 × 10. To conclude this work, we studied the uniformity of the Raman (SERS + PIERS) signal for our plasmonic substrates. To do that, Raman intensities of the vibration mode at 1073 cm were acquired on 10 positions taken distinctly on the substrate with same excitation conditions for assessing the relative standard deviation (RSD) (see error bars of the Figure 3c). We achieved a nice uniformity the average RSD of which was <20% for all the experimental points of the Figure 3c. To complete that, the reproducibility of samples was also investigated by registering the Raman intensity of the same vibration mode (1073 cm) on three samples. Figure 4a,b display the Raman intensity from these samples (for UV-irradiation of 30 min) for the thiophenol concentrations of 100 pM and 1 mM whose the average RSD is <20%, respectively. Thus, we registered a nice uniformity and reproducibility of the Raman signal for these plasmonic substrates whose the average RSD was <20%.
4. Conclusions
In this work, we have proven that Au nanoparticles coated ZnO films could be excellent sensors of thiophenol molecules by using the combination of SERS and PIERS effects. We have chosen the thiophenol molecule because their Raman peaks are well-reported and for its quality of adsorption on metals. Indeed, we found an adsorption capacity of 3.2 × 10 M for thiophenol molecules on gold nanoparticles, which is bigger than those determined in other works mentioned above. For this sensing, a LOD of 100 pM, and an AEF of 1.9 × 10 were achieved. This LOD of 100 pM was more sensitive than those achieved with other plasmonic nanosystems cited in this work. In addition, the SERS+PIERS signal for our Au nanoparticles coated ZnO film was uniform and reproducible the average RSD of which was <20%. Henceforth, this work can be further optimized by varying the size, the shape and the arrangement of plasmonic nanostructures allowing potentially a better enhancement of the Raman signal than nanospheres used in this study.
Supplementary Materials
The following are available online at https://www.mdpi.com/article/10.3390/photonics9080562/s1, Figure S1: Raman (SERS + PIERS) intensity recorded for the Raman peak at 1073 cm versus the number of detected thiophenol molecules. Thus, Raman intensity varies linearly with the number of detected thiophenol molecules whose the linear equation is (Correlation coefficient: ).
Funding
This research received no external funding.
Institutional Review Board Statement
Not applicable.
Informed Consent Statement
Not applicable.
Data Availability Statement
The data presented in this study are available on reasonable request to the author.
Conflicts of Interest
The author declares no conflict of interest.
References
- Li, S.; Xu, P.; Ren, Z.; Zhang, B.; Du, Y.; Han, X.; Mack, N.H.; Wang, H.-L. Fabrication of thorny Au nanostructures on polyaniline surfaces for sensitive surface-enhanced Raman spectroscopy. ACS Appl. Mater. Interfaces 2013, 5, 49–54. [Google Scholar] [CrossRef] [PubMed]
- Bodelon, G.; Montes-Garcia, V.; Lopez-Puente, V.; Hill, E.H.; Hamon, C.; Sanz-Ortiz, M.N.; Rodal-Cedeira, S.; Costas, C.; Celiksoy, S.; Perez-Juste, I.; et al. Detection and imaging of quorum sensing in Pseudomonas Aeruginosa Biofilm Communities by Surface-Enhanced Resonance Raman Scattering. Nat. Mater. 2016, 15, 1203–1211. [Google Scholar] [CrossRef] [PubMed]
- Ding, S.-Y.; Yi, J.; Li, J.-F.; Ren, B.; Wu, D.-Y.; Panneerselvam, R.; Tian, Z.-Q. Nanostructure-based plasmon-enhanced Raman spectroscopy for surface analysis of materials. Nat. Rev. Mater. 2016, 1, 16021. [Google Scholar] [CrossRef]
- Ye, W.; Krüger, K.; Sanchez-Iglesias, A.; Garcia, I.; Jia, X.; Sutter, J.; Celiksoy, S.; Foerster, B.; Liz-Marzan, L.M.; Ahijado-Guzman, R.; et al. CTAB Stabilizes Silver on Gold Nanorods. Chem. Mater. 2020, 32, 1650–1656. [Google Scholar] [CrossRef]
- Gonzalez-Rubio, G.; Scarabelli, L.; Guerrero-Martinez, A.; Liz-Marzan, L.M. Surfactant-Assisted Symmetry Breaking in Colloidal Gold Nanocrystal Growth. ChemNanoMat 2020, 6, 698–707. [Google Scholar] [CrossRef]
- Scarabelli, L.; Vila-Liarte, D.; Mihi, A.; Liz-Marzan, L.M. Templated Colloidal Self-Assembly for Lattice Plasmon Engineering. Acc. Mater. Res. 2021, 2, 816–827. [Google Scholar] [CrossRef]
- Henzie, J.; Lee, J.; Lee, M.H.; Hasan, W.; Odom, T.W. Nanofabrication of Plasmonic Structures. Annu. Rev. Phys. Chem. 2009, 60, 147–165. [Google Scholar] [CrossRef] [PubMed]
- Manfrinato, V.R.; Camino, F.E.; Stein, A.; Zhang, L.H.; Lu, M.; Stach, E.A.; Black, C.T. Patterning Si at the 1 nm Length Scale with Aberration-Corrected Electron-Beam Lithography: Tuning of Plasmonic Properties by Design. Adv. Funct. Mater. 2019, 29, 1903429. [Google Scholar] [CrossRef]
- Faure, A.C.; Barbillon, G.; Ou, M.; Ledoux, G.; Tillement, O.; Roux, S.; Fabregue, D.; Descamps, A.; Bijeon, J.-L.; Marquette, C.A.; et al. Core/shell nanoparticles for multiple biological detection with enhanced sensitivity and kinetics. Nanotechnology 2008, 19, 485103. [Google Scholar] [CrossRef]
- Dhawan, A.; Duval, A.; Nakkach, M.; Barbillon, G.; Moreau, J.; Canva, M.; Vo-Dinh, T. Deep UV nano-microstructuring of substrates for surface plasmon resonance imaging. Nanotechnology 2011, 22, 165301. [Google Scholar] [CrossRef]
- Quilis, N.G.; Hageneder, S.; Fossati, S.; Auer, S.K.; Venugopalan, P.; Bozdogan, A.; Petri, C.; Moreno-Cencerrado, A.; Toca-Herrera, J.L.; Jonas, U.; et al. UV-Laser Interference Lithography for Local Functionalization of Plasmonic Nanostructures with Responsive Hydrogel. J. Phys. Chem. C 2020, 124, 3297–3305. [Google Scholar] [CrossRef] [PubMed]
- Barbillon, G.; Bijeon, J.-L.; Lérondel, G.; Plain, J.; Royer, P. Detection of chemical molecules with integrated plasmonic glass nanotips. Surf. Sci. 2008, 602, L119–L122. [Google Scholar] [CrossRef]
- Barbillon, G.; Faure, A.C.; El Kork, N.; Moretti, P.; Roux, S.; Tillement, O.; Ou, M.; Descamps, A.; Perriat, P.; Vial, A.; et al. How nanoparticles encapsulating fluorophores allow a double detection of biomolecules by localized surface plasmon resonance and luminescence. Nanotechnology 2008, 19, 035705. [Google Scholar] [CrossRef] [PubMed]
- Yu, Q.; Guan, P.; Qin, D.; Golden, G.; Wallace, P.M. Inverted size-dependence of surface-enhanced Raman scattering on gold nanohole and nanodisk arrays. Nano Lett. 2008, 8, 1923–1928. [Google Scholar] [CrossRef] [PubMed]
- Martin, J.; Plain, J. Fabrication of aluminium nanostructures for plasmonics. J. Phys. D Appl. Phys. 2015, 48, 184002. [Google Scholar] [CrossRef]
- Rodriguez-Fernandez, D.; Langer, J.; Henriksen-Lacey, M.; Liz-Marzan, L.M. Hybrid Au-SiO2 core-satellite colloids as switchable SERS tags. Chem. Mater. 2015, 27, 2540–2545. [Google Scholar] [CrossRef]
- La Porta, A.; Sanchez-Iglesias, A.; Altantzis, T.; Bals, S.; Grzelczak, M.; Liz-Marzan, L.M. Multifunctional self-assembled composite colloids and their application to SERS detection. Nanoscale 2015, 7, 10377–10381. [Google Scholar] [CrossRef] [PubMed]
- Höller, R.P.M.; Kuttner, C.; Mayer, M.; Wang, R.; Dulle, M.; Contreras-Caceres, R.; Fery, A.; Liz-Marzan, L.M. Colloidal Superstructures with Triangular Cores: Size Effects on SERS Efficiency. ACS Photonics 2020, 7, 1839–1848. [Google Scholar] [CrossRef]
- Farcau, C.; Marconi, D.; Colnita, A.; Brezestean, I.; Barbu-Tudoran, L. Gold Nanospot-Shell Arrays Fabricated by Nanoimprint Lithography as a Flexible Plasmonic Sensing Platform. Nanomaterials 2019, 9, 1519. [Google Scholar] [CrossRef] [PubMed]
- Ding, T.; Sigle, D.O.; Herrmann, L.O.; Wolverson, D.; Baumberg, J.J. Nanoimprint lithography of Al Nanovoids for Deep-UV SERS. ACS Appl. Mater. Interfaces 2014, 6, 17358–17363. [Google Scholar] [CrossRef]
- Hamouda, F.; Sahaf, H.; Held, S.; Barbillon, G.; Gogol, P.; Moyen, E.; Aassime, A.; Moreau, J.; Canva, M.; Lourtioz, J.-M.; et al. Large area nanopatterning by combined anodic aluminum oxide and soft UV–NIL technologies for applications in biology. Microelectron. Eng. 2011, 88, 1839–1848. [Google Scholar] [CrossRef]
- Masson, J.F.; Gibson, K.F.; Provencher-Girard, A. Surface-enhanced Raman spectroscopy amplification with film over etched nanospheres. J. Phys. Chem. C 2010, 114, 22406–22412. [Google Scholar] [CrossRef]
- Bechelany, M.; Brodard, P.; Elias, J.; Brioude, A.; Michler, J.; Philippe, L. Simple Synthetic Route for SERS-Active Gold Nanoparticles Substrate with Controlled Shape and Organization. Langmuir 2010, 26, 14364–14371. [Google Scholar] [CrossRef]
- Chau, Y.F.C.; Chen, K.H.; Chiang, H.P.; Lim, C.M.; Huang, H.J.; Lai, C.H.; Kumara, N.T.R.N. Fabrication and Characterization of a Metallic-Dielectric Nanorod Array by Nanosphere Lithography for Plasmonic Sensing Applications. Nanomaterials 2019, 9, 1691. [Google Scholar] [CrossRef] [PubMed]
- Reguera, J.; Langer, J.; de Aberasturi, D.J.; Liz-Marzan, L.M. Anistropic metal nanoparticles for surface enhanced Raman scattering. Chem. Soc. Rev. 2017, 46, 3866–3885. [Google Scholar] [CrossRef] [PubMed]
- Barbillon, G.; Ivanov, A.; Sarychev, A.K. Hybrid Au/Si Disk-Shaped Nanoresonators on Gold Film for Amplified SERS Chemical Sensing. Nanomaterials 2019, 9, 1588. [Google Scholar] [CrossRef]
- Langer, J.; de Aberasturi, D.J.; Aizpurua, J.; Alvarez-Puebla, R.A.; Auguié, B.; Baumberg, J.J.; Bazan, G.C.; Bell, S.E.; Boisen, A.; Brolo, A.G.; et al. Present and Future of Surface-Enhanced Raman Scattering. ACS Nano 2020, 14, 28–117. [Google Scholar] [CrossRef] [PubMed]
- Barbillon, G. Latest Novelties on Plasmonic and Non-Plasmonic Nanomaterials for SERS Sensing. Nanomaterials 2020, 10, 1200. [Google Scholar] [CrossRef]
- Maccaferri, N.; Barbillon, G.; Koya, A.N.; Lu, G.; Acuna, G.P.; Garoli, D. Recent advances in plasmonic nanocavities for single-molecule spectroscopy. Nanoscale Adv. 2021, 3, 633–642. [Google Scholar] [CrossRef]
- Li, Z.; Butun, S.; Aydin, K. Ultranarrow Band Absorbers Based on Surface Lattice Resonances in Nanostructured Metal Surfaces. ACS Nano 2014, 8, 8242–8248. [Google Scholar] [CrossRef]
- Sarkar, M.; Besbes, M.; Moreau, J.; Bryche, J.-F.; Olivéro, A.; Barbillon, G.; Coutrot, A.-L.; Bartenlian, B.; Canva, M. Hybrid Plasmonic Mode by Resonant Coupling of Localized Plasmons to Propagating Plasmons in a Kretschmann Configuration. ACS Photonics 2015, 2, 237–245. [Google Scholar] [CrossRef]
- Sobhani, A.; Manjavacas, A.; Cao, Y.; McClain, M.J.; de Abajo, F.J.G.; Nordlander, P.; Halas, N.J. Pronounced Linewidth Narrowing of an Aluminum Nanoparticle Plasmon Resonance by Interaction with an Aluminum Metallic Film. Nano Lett. 2015, 15, 6946–6951. [Google Scholar] [CrossRef] [PubMed]
- Yue, W.; Wang, Z.; Whittaker, J.; Lopez-Royo, F.; Yang, Y.; Zayats, A.V. Amplification of surface-enhanced Raman scattering due to substrate-mediated localized surface plasmons in gold nanodimers. J. Mater. Chem. C 2017, 5, 4075–4084. [Google Scholar] [CrossRef]
- Sheena, T.S.; Devaraj, V.; Lee, J.-M.; Balaji, P.; Gnanasekar, P.; Oh, J.-W.; Akbarsha, M.A.; Jeganathan, K. Sensitive and label-free shell isolated Ag NPs@Si architecture based SERS active substrate: FDTD analysis and in-situ Cell. DNA Detection. Appl. Surf. Sci. 2020, 515, 145955. [Google Scholar] [CrossRef]
- Wu, J.; Du, Y.; Wang, C.; Bai, S.; Zhang, T.; Chen, T.; Hu, A. Reusable and long-life 3D Ag nanoparticles coated Si nanowire array as sensitive SERS substrate. Appl. Surf. Sci. 2019, 494, 583–590. [Google Scholar] [CrossRef]
- Sarychev, A.K.; Ivanov, A.; Lagarkov, A.; Barbillon, G. Light Concentration by Metal-Dielectric Micro-Resonators for SERS Sensing. Materials 2019, 12, 103. [Google Scholar] [CrossRef]
- Barbillon, G.; Ivanov, A.; Sarychev, A.K. SERS Amplification in Au/Si Asymmetric Dimer Array Coupled to Efficient Adsorption of Thiophenol Molecules. Nanomaterials 2021, 11, 1521. [Google Scholar] [CrossRef]
- Yao, J.; Quan, Y.; Gao, M.; Gao, R.; Chen, L.; Liu, Y.; Lang, J.; Shen, H.; Zhang, Y.; Yang, L.; et al. AgNPs decorated Mg-doped ZnO heterostructure with dramatic SERS activity for trace detection of food contaminants. J. Mater. Chem. C 2019, 7, 8199–8208. [Google Scholar] [CrossRef]
- Doan, Q.K.; Nguyen, M.H.; Sai, C.D.; Pham, V.T.; Mai, H.H.; Pham, N.H.; Bach, T.C.; Nguyen, V.T.; Nguyen, T.T.; Ho, K.H.; et al. Enhanced optical properties of ZnO nanorods decorated with gold nanoparticles for self cleaning surface enhanced Raman applications. Appl. Surf. Sci. 2020, 505, 144593. [Google Scholar] [CrossRef]
- Lee, Y.; Lee, J.; Lee, T.K.; Park, J.; Ha, M.; Kwak, S.K.; Ko, H. Particle-on-Film Gap Plasmons on Antireflective ZnO Nanocone Arrays for Molecular-Level Surface-Enhanced Raman Scattering Sensors. ACS Appl. Mater. Interfaces 2015, 7, 26421–26429. [Google Scholar] [CrossRef]
- Barbillon, G. Oxygen Vacancy Dynanmics in Highly Crystalline Zinc Oxide Film Investigated by PIERS Effect. Materials 2021, 14, 4423. [Google Scholar] [CrossRef] [PubMed]
- Zhao, J.; Wang, Z.; Lan, J.; Khan, I.; Ye, X.; Wan, J.; Fei, Y.; Huang, S.; Li, S.; Kang, J. Recent advances and perspectives in photo-induced enhanced Raman spectroscopy. Nanoscale 2021, 13, 8707–8721. [Google Scholar] [CrossRef] [PubMed]
- Furlaz, A.; Almohammed, S.; Rice, J.H. Oxygen Incorporation-Induced SERS Enhancement in Silver Nanoparticle-Decorated ZnO Nanowires. ACS Appl. Nano Mater. 2020, 3, 1666–1673. [Google Scholar]
- Glass, D.; Cortés, E.; Ben-Jaber, S.; Brick, T.; Peveler, W.J.; Blackman, C.S.; Howle, C.R.; Quesada-Cabrera, R.; Parkin, I.P.; Maier, S.A. Dynamics of Photo-Induced Surface Oxygen Vacancies in Metal-Oxide Semiconductors Studied Under Ambient Conditions. Adv. Sci. 2019, 6, 1901841. [Google Scholar] [CrossRef]
- Barbillon, G.; Noblet, T.; Humbert, C. Highly crystalline ZnO film decorated with gold nanospheres for PIERS chemical sensing. Phys. Chem. Chem. Phys. 2020, 22, 21000–21004. [Google Scholar] [CrossRef]
- Ben-Jaber, S.; Peveler, W.J.; Quesada-Cabrera, R.; Cortés, E.; Sotelo-Vazquez, C.; Abdul-Karim, N.; Maier, S.A.; Parkin, I.P. Photo-induced enhanced Raman spectroscopy for universal ultra-trace detection of explosives, pollutants and biomolecules. Nat. Commun. 2016, 7, 12189. [Google Scholar] [CrossRef]
- Brognara, A.; Bricchi, B.R.; William, L.; Brinza, O.; Konstantakopoulou, M.; Bassi, A.L.; Ghidelli, M.; Lidgi-Guigui, N. New Mechanism for Long Photo-Induced Enhanced Raman Spectroscopy in Au Nanoparticles Embedded in TiO2. Small 2022, 18, 2201088. [Google Scholar] [CrossRef]
- Zhang, M.; Chen, T.; Liu, Y.; Zhu, J.; Liu, J.; Wu, Y. Three-Dimensional TiO2–Ag Nanopore Arrays for Powerful Photoinduced Enhanced Raman Spectroscopy (PIERS) and Versatile Detection of Toxic Organics. ChemNanoMat 2019, 5, 55–60. [Google Scholar] [CrossRef]
- Almohammed, S.; Zhang, F.; Rodriguez, B.J.; Rice, J.H. Photo-induced surface-enhanced Raman spectroscopy from a diphenylalanine peptide nanotube-metal nanoparticle template. Sci. Rep. 2018, 8, 3880. [Google Scholar] [CrossRef]
- Christopher Love, J.; Estroff, L.A.; Kriebel, J.K.; Nuzzo, R.G.; Whitesides, G.M. Self-Assembled Monolayers of Thiolates on Metals as a Form of Nanotechnology. Chem. Rev. 2005, 105, 1103–1169. [Google Scholar] [CrossRef]
- Dalstein, L.; Ben Haddada, M.; Barbillon, G.; Humbert, C.; Tadjeddine, A.; Boujday, S.; Busson, B. Revealing the Interplay between Adsorbed Molecular Layers and Gold Nanoparticles by Linear and Nonlinear Optical Properties. J. Phys. Chem. C 2015, 115, 17146–17155. [Google Scholar] [CrossRef]
- Mulvaney, P.; Perez-Juste, J.; Giersig, M.; Liz-Marzan, L.M.; Pecharroman, C. Drastic Surface Plasmon Mode Shifts in Gold Nanorods Due to Electron Charging. Plasmonics 2006, 1, 61–66. [Google Scholar] [CrossRef]
- Tetsassi Feugmo, C.G.; Liegeois, V. Analyzing the vibrational signatures of thiophenol adsorbed on small gold clusters by DFT calculations. ChemPhysChem 2013, 14, 1633–1645. [Google Scholar] [CrossRef] [PubMed]
- Li, S.; Wu, D.; Xu, X.; Gu, R. Theoretical and experimental studies on the adsorption behavior of thiophenol on gold nanoparticles. J. Raman Spectrosc. 2007, 38, 1436–1443. [Google Scholar] [CrossRef]
- Wokaun, A. Surface-enhanced electromagnetic processes. In Solid State Physics; Ehrenreich, H., Turnbull, D., Seitz, F., Eds.; Academic Press: Cambridge, MA, USA, 1984; Volume 38, pp. 223–294. [Google Scholar]
- Etchegoin, P.G.; Le Ru, E.C. Basic electromagnetic theory of SERS. In Surface Enhanced Raman Spectroscopy: Analytical, Biophysical and Life Science Applications; Schlücker, S., Ed.; Wiley-VCH: Weinheim, Germany, 2011; pp. 1–37. [Google Scholar]
- Tripathi, A.; Emmons, E.D.; Kline, N.D.; Christesen, S.D.; Fountain, A.W.; Guicheteau, J.A. Molecular Structure and Solvent Factors Influencing SERS on Planar Gold Substrates. J. Phys. Chem. C 2018, 122, 10205–10216. [Google Scholar] [CrossRef]
- Tripathi, A.; Emmons, E.D.; Fountain, A.W.; Guicheteau, J.A.; Moskovits, M.; Christesen, S.D. Critical Role of Adsorption Equilibria on the Determination of Surface-Enhanced Raman Enhancement. ACS Nano 2015, 9, 584–593. [Google Scholar] [CrossRef]
- Le Ru, E.C.; Blackie, E.J.; Meyer, M.; Etchegoin, P.G. Surface enhanced Raman scattering enhancement factors: A comprehensive study. J. Phys. Chem. C 2007, 111, 13794–13803. [Google Scholar] [CrossRef]
Figure 1.
X-ray diffraction pattern obtained for the ZnO film with AuNPs on sapphire substrate (see SEM image in the inset, and white bar = 300 nm).
Figure 1.
X-ray diffraction pattern obtained for the ZnO film with AuNPs on sapphire substrate (see SEM image in the inset, and white bar = 300 nm).
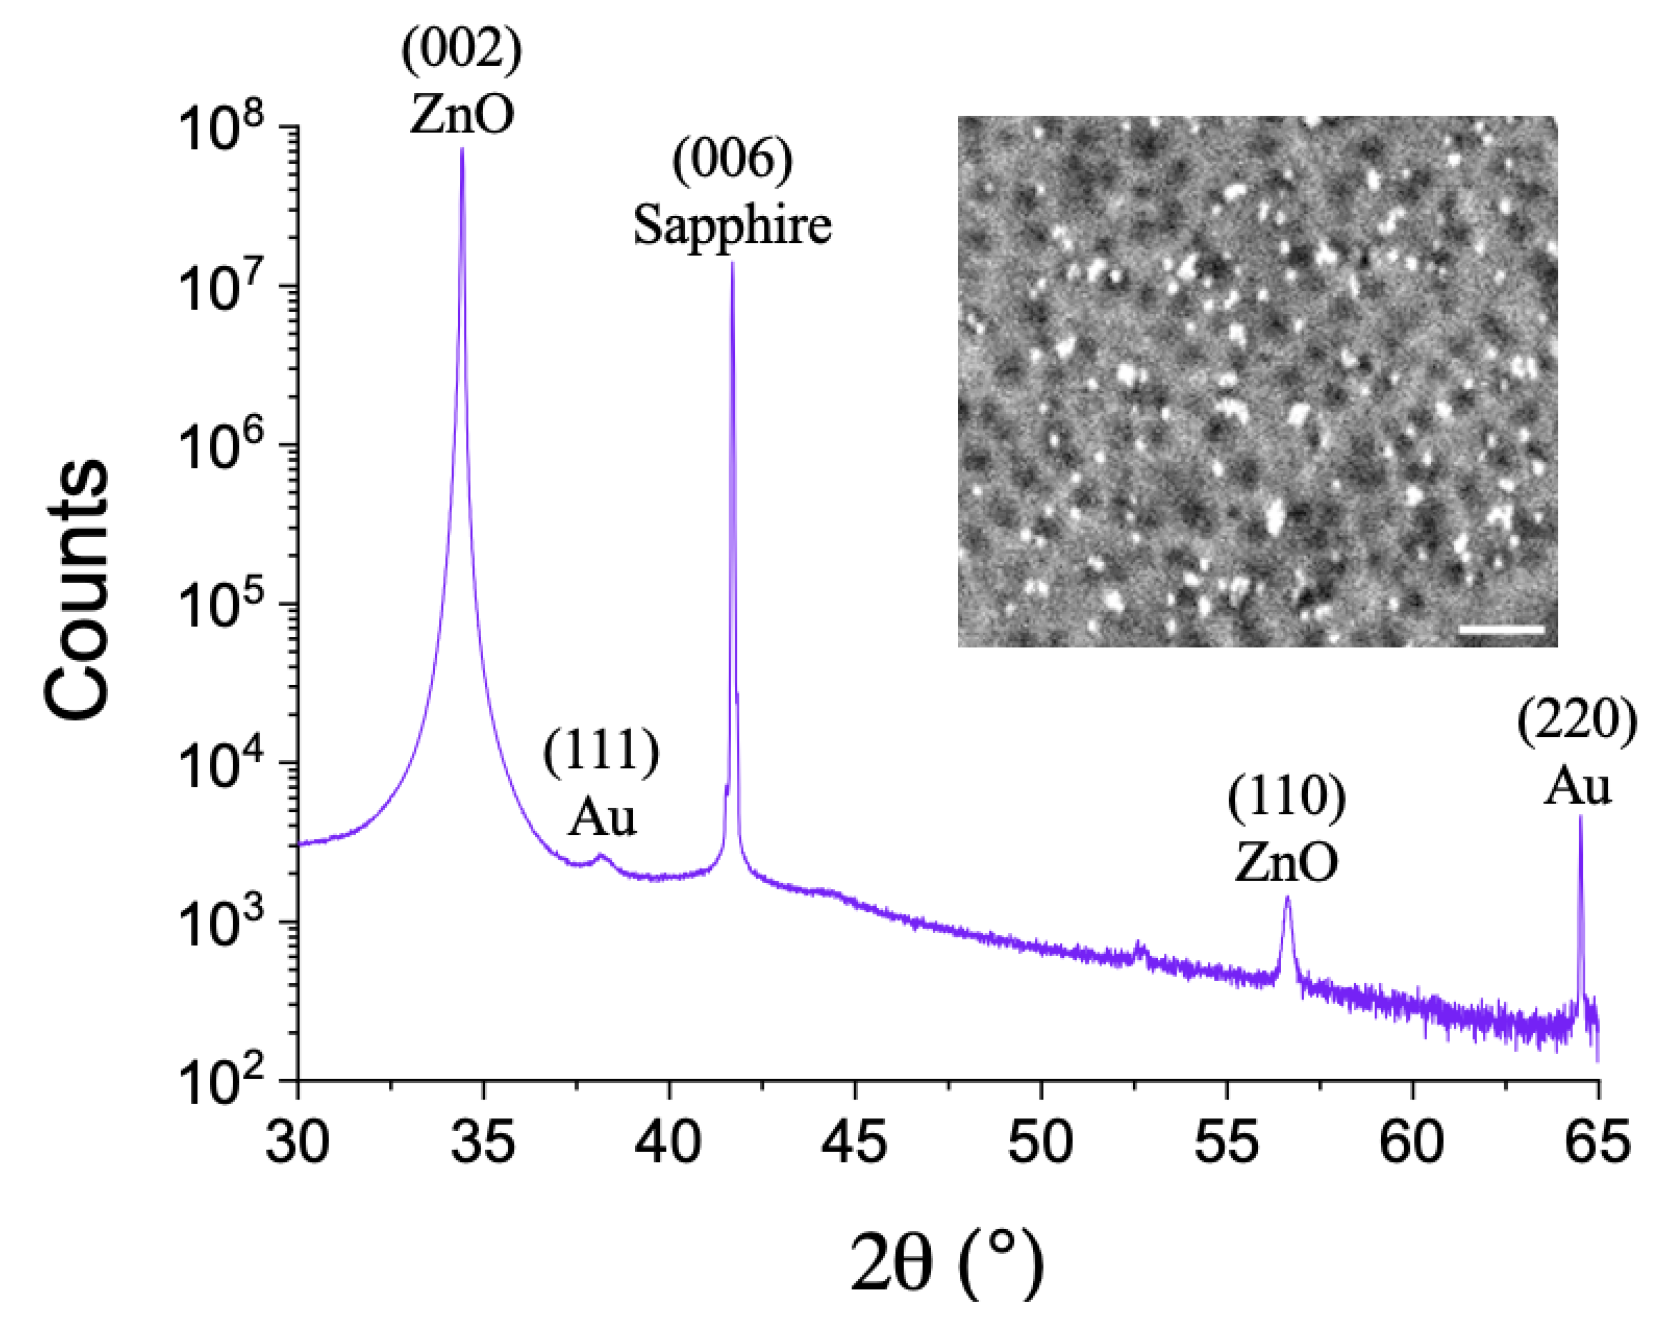
Figure 2.
(a) Extinction spectra of Au nanoparticles on ZnO film without UV-irradiation (in purple color), with an UV-irradiation of 15 min (in dark yellow color) and 30 min (in blue color). The green and black dashed lines correspond to the excitation wavelength and the wavelength of the Raman emission for the chosen vibration mode (at 1073 cm), respectively. (b) Raman spectra of thiophenol on these Au nanoparticles coated ZnO film recorded at the concentrations of 1 mM. For (b), the black, red, and blue spectra correspond to SERS, SERS + PIERS whose the time of UV-irradiation was 15 min, and SERS + PIERS whose the time of UV-irradiation was 30 min, respectively. The vibration mode at 1073 cm chosen for the study is encapsulated in the red rectangle.

Figure 3.
Raman (SERS + PIERS) spectra for the following thiophenol concentrations: (a) 1 mM (yellow color), 0.1 mM (blue color), 10 M (red color), 1 M (black color), and (b) 100 nM (orange color), 10 nM (blue color), 1 nM (red color), and 100 pM (black color). (c) Raman (SERS + PIERS) intensity as function of thiophenol concentration. Blue dots are the experimental data, and the orange fit curve is the Langmuir model. (d) Raman spectra of thiophenol (C = 1 M) obtained on ZnO film without Au nanoparticles serving as reference (in blue, with an UV-irradiation time of 30 min and in black without UV-irradiation). For all the Raman spectra of this figure, the vibration mode at 1073 cm chosen for the study is encapsulated in the red rectangle.

Figure 4.
Raman intensity (SERS + PIERS) of the 1073 cm peak for three samples whose the average RSD is <20% for the following thiophenol concentration (for UV-irradiation of 30 min): (a) 100 pM, and (b) 1 mM.
Figure 4.
Raman intensity (SERS + PIERS) of the 1073 cm peak for three samples whose the average RSD is <20% for the following thiophenol concentration (for UV-irradiation of 30 min): (a) 100 pM, and (b) 1 mM.
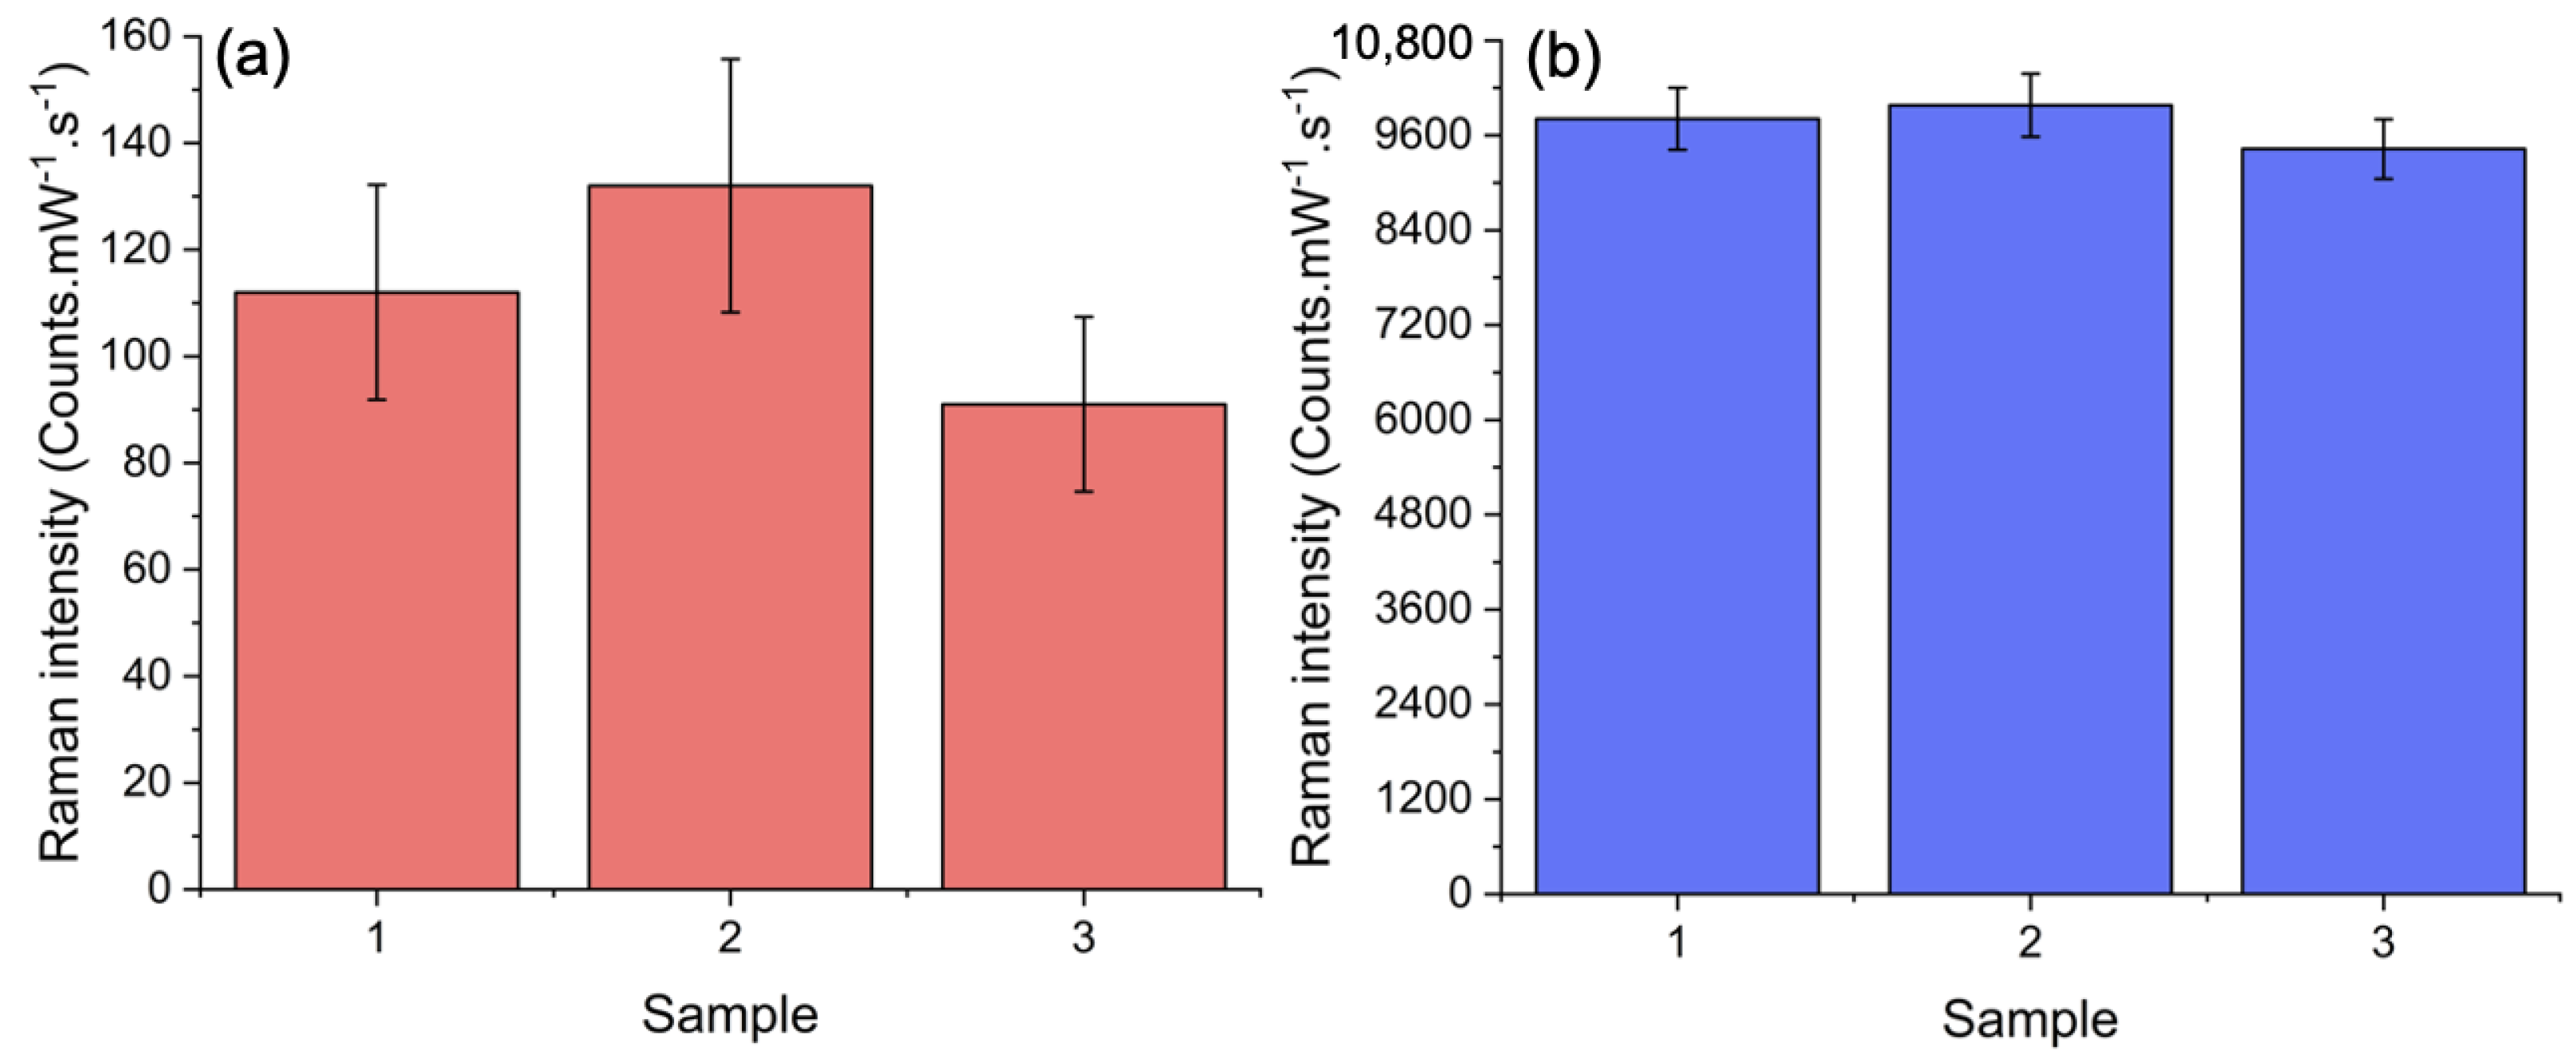
Table 2.
Enhancement factor obtained with the E model (in Arb. Unit). The values of extinction intensities are obtained from the Figure 2a.
Table 2.
Enhancement factor obtained with the E model (in Arb. Unit). The values of extinction intensities are obtained from the Figure 2a.
| Extinction Spectrum | in Arb. Unit | in Arb. Unit | EF (Arb. Unit) |
|---|---|---|---|
| Blue | 1.788 | 1.359 | 2.429 |
| Dark yellow | 1.728 | 1.496 | 2.585 |
| Purple | 1.444 | 1.664 | 2.403 |
Publisher’s Note: MDPI stays neutral with regard to jurisdictional claims in published maps and institutional affiliations. |
© 2022 by the author. Licensee MDPI, Basel, Switzerland. This article is an open access article distributed under the terms and conditions of the Creative Commons Attribution (CC BY) license (https://creativecommons.org/licenses/by/4.0/).
Share and Cite
MDPI and ACS Style
Barbillon, G. Au Nanoparticles Coated ZnO Film for Chemical Sensing by PIERS Coupled to SERS. Photonics 2022, 9, 562. https://doi.org/10.3390/photonics9080562
AMA Style
Barbillon G. Au Nanoparticles Coated ZnO Film for Chemical Sensing by PIERS Coupled to SERS. Photonics. 2022; 9(8):562. https://doi.org/10.3390/photonics9080562
Chicago/Turabian StyleBarbillon, Grégory. 2022. "Au Nanoparticles Coated ZnO Film for Chemical Sensing by PIERS Coupled to SERS" Photonics 9, no. 8: 562. https://doi.org/10.3390/photonics9080562
Note that from the first issue of 2016, this journal uses article numbers instead of page numbers. See further details here.