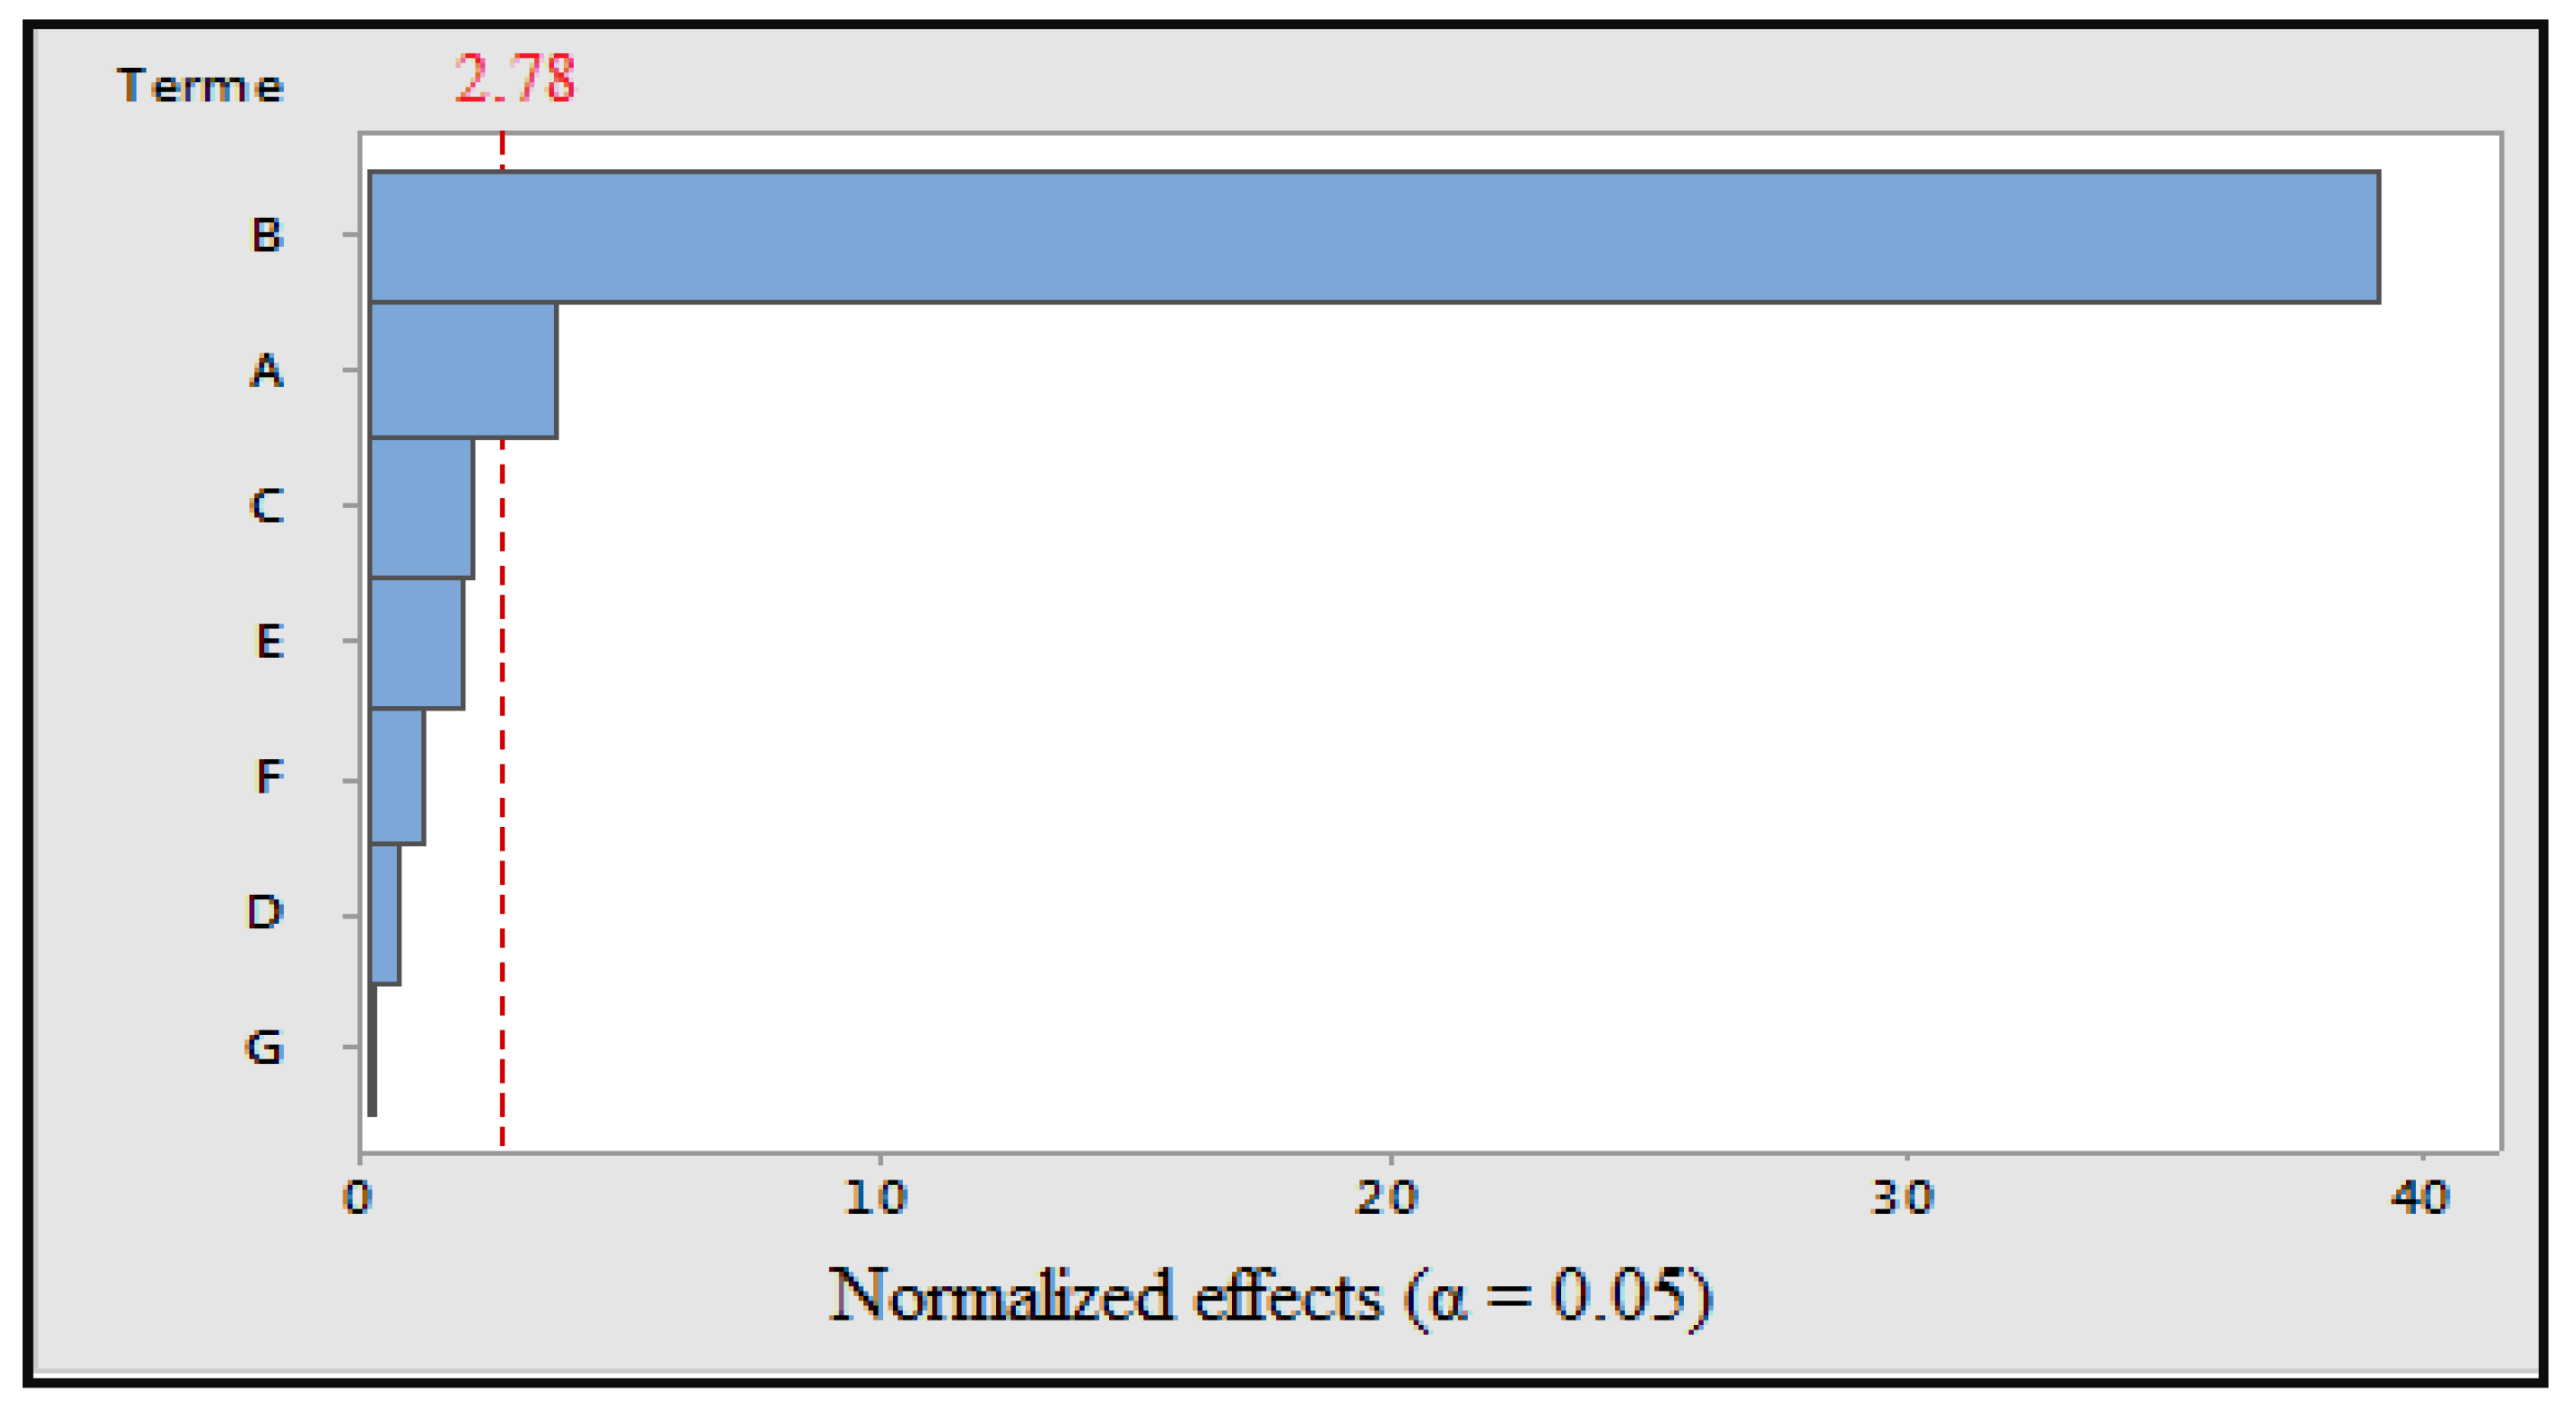
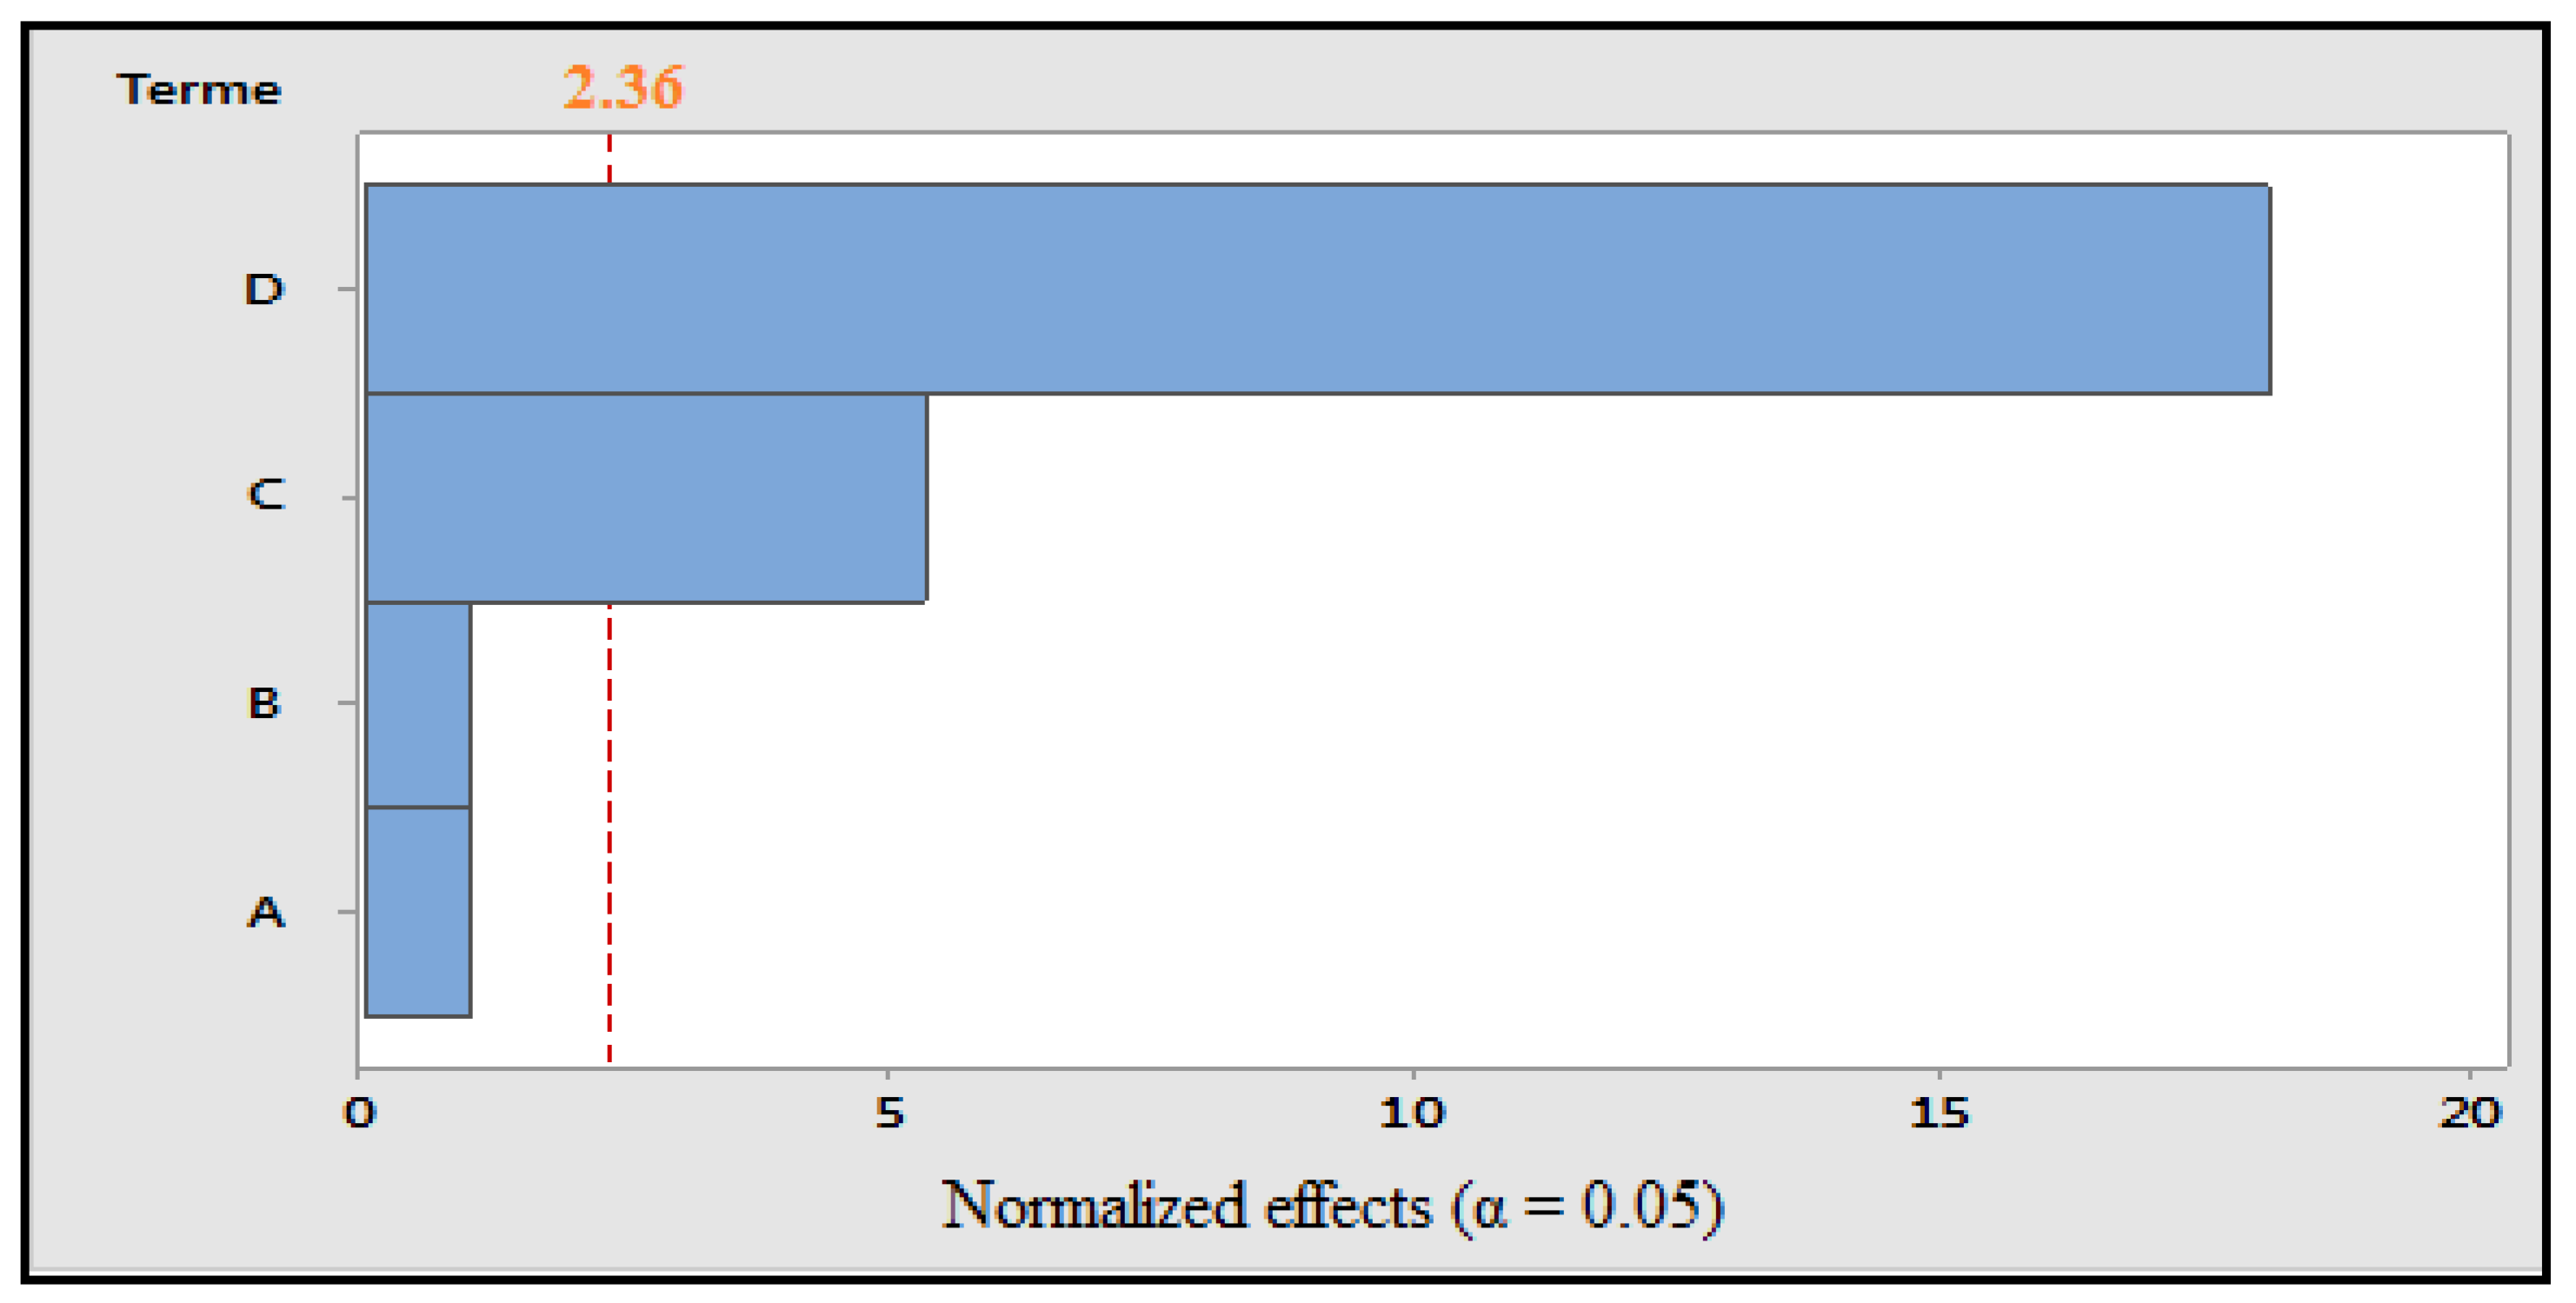
Figure 1.
Pareto diagram of normalized effects (α = 0.05). A: concentration of solvent; B: grinding; C: maceration time; and D: ultrasonication time.
Figure 1.
Pareto diagram of normalized effects (α = 0.05). A: concentration of solvent; B: grinding; C: maceration time; and D: ultrasonication time.
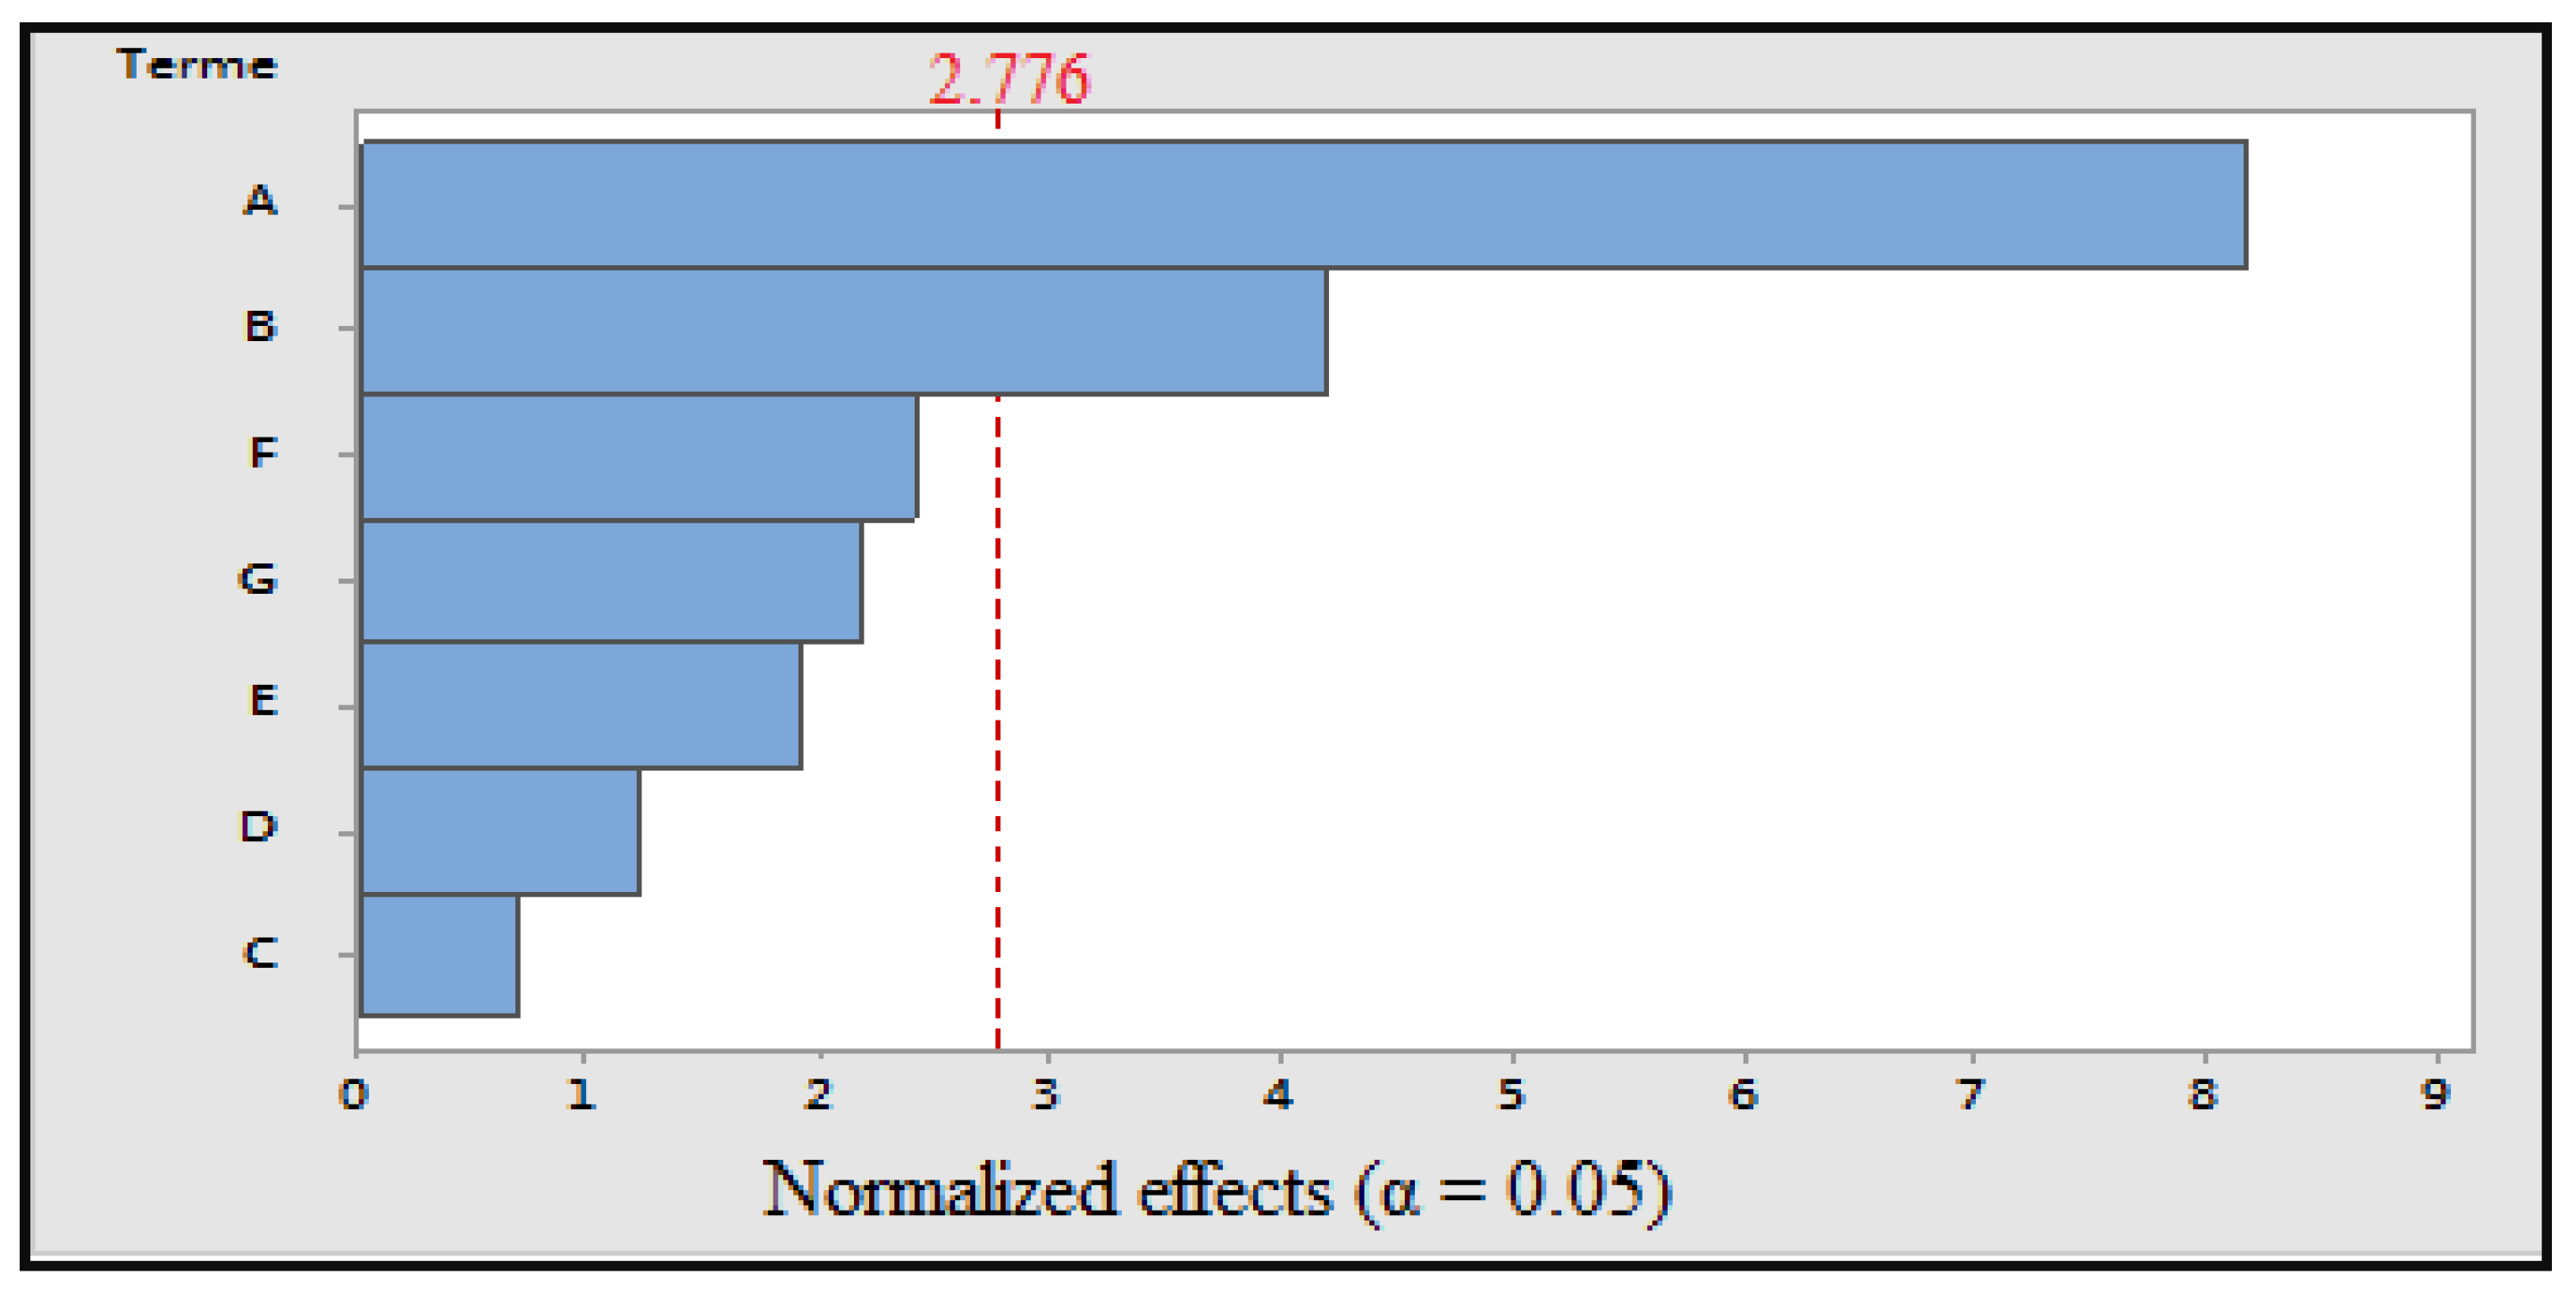
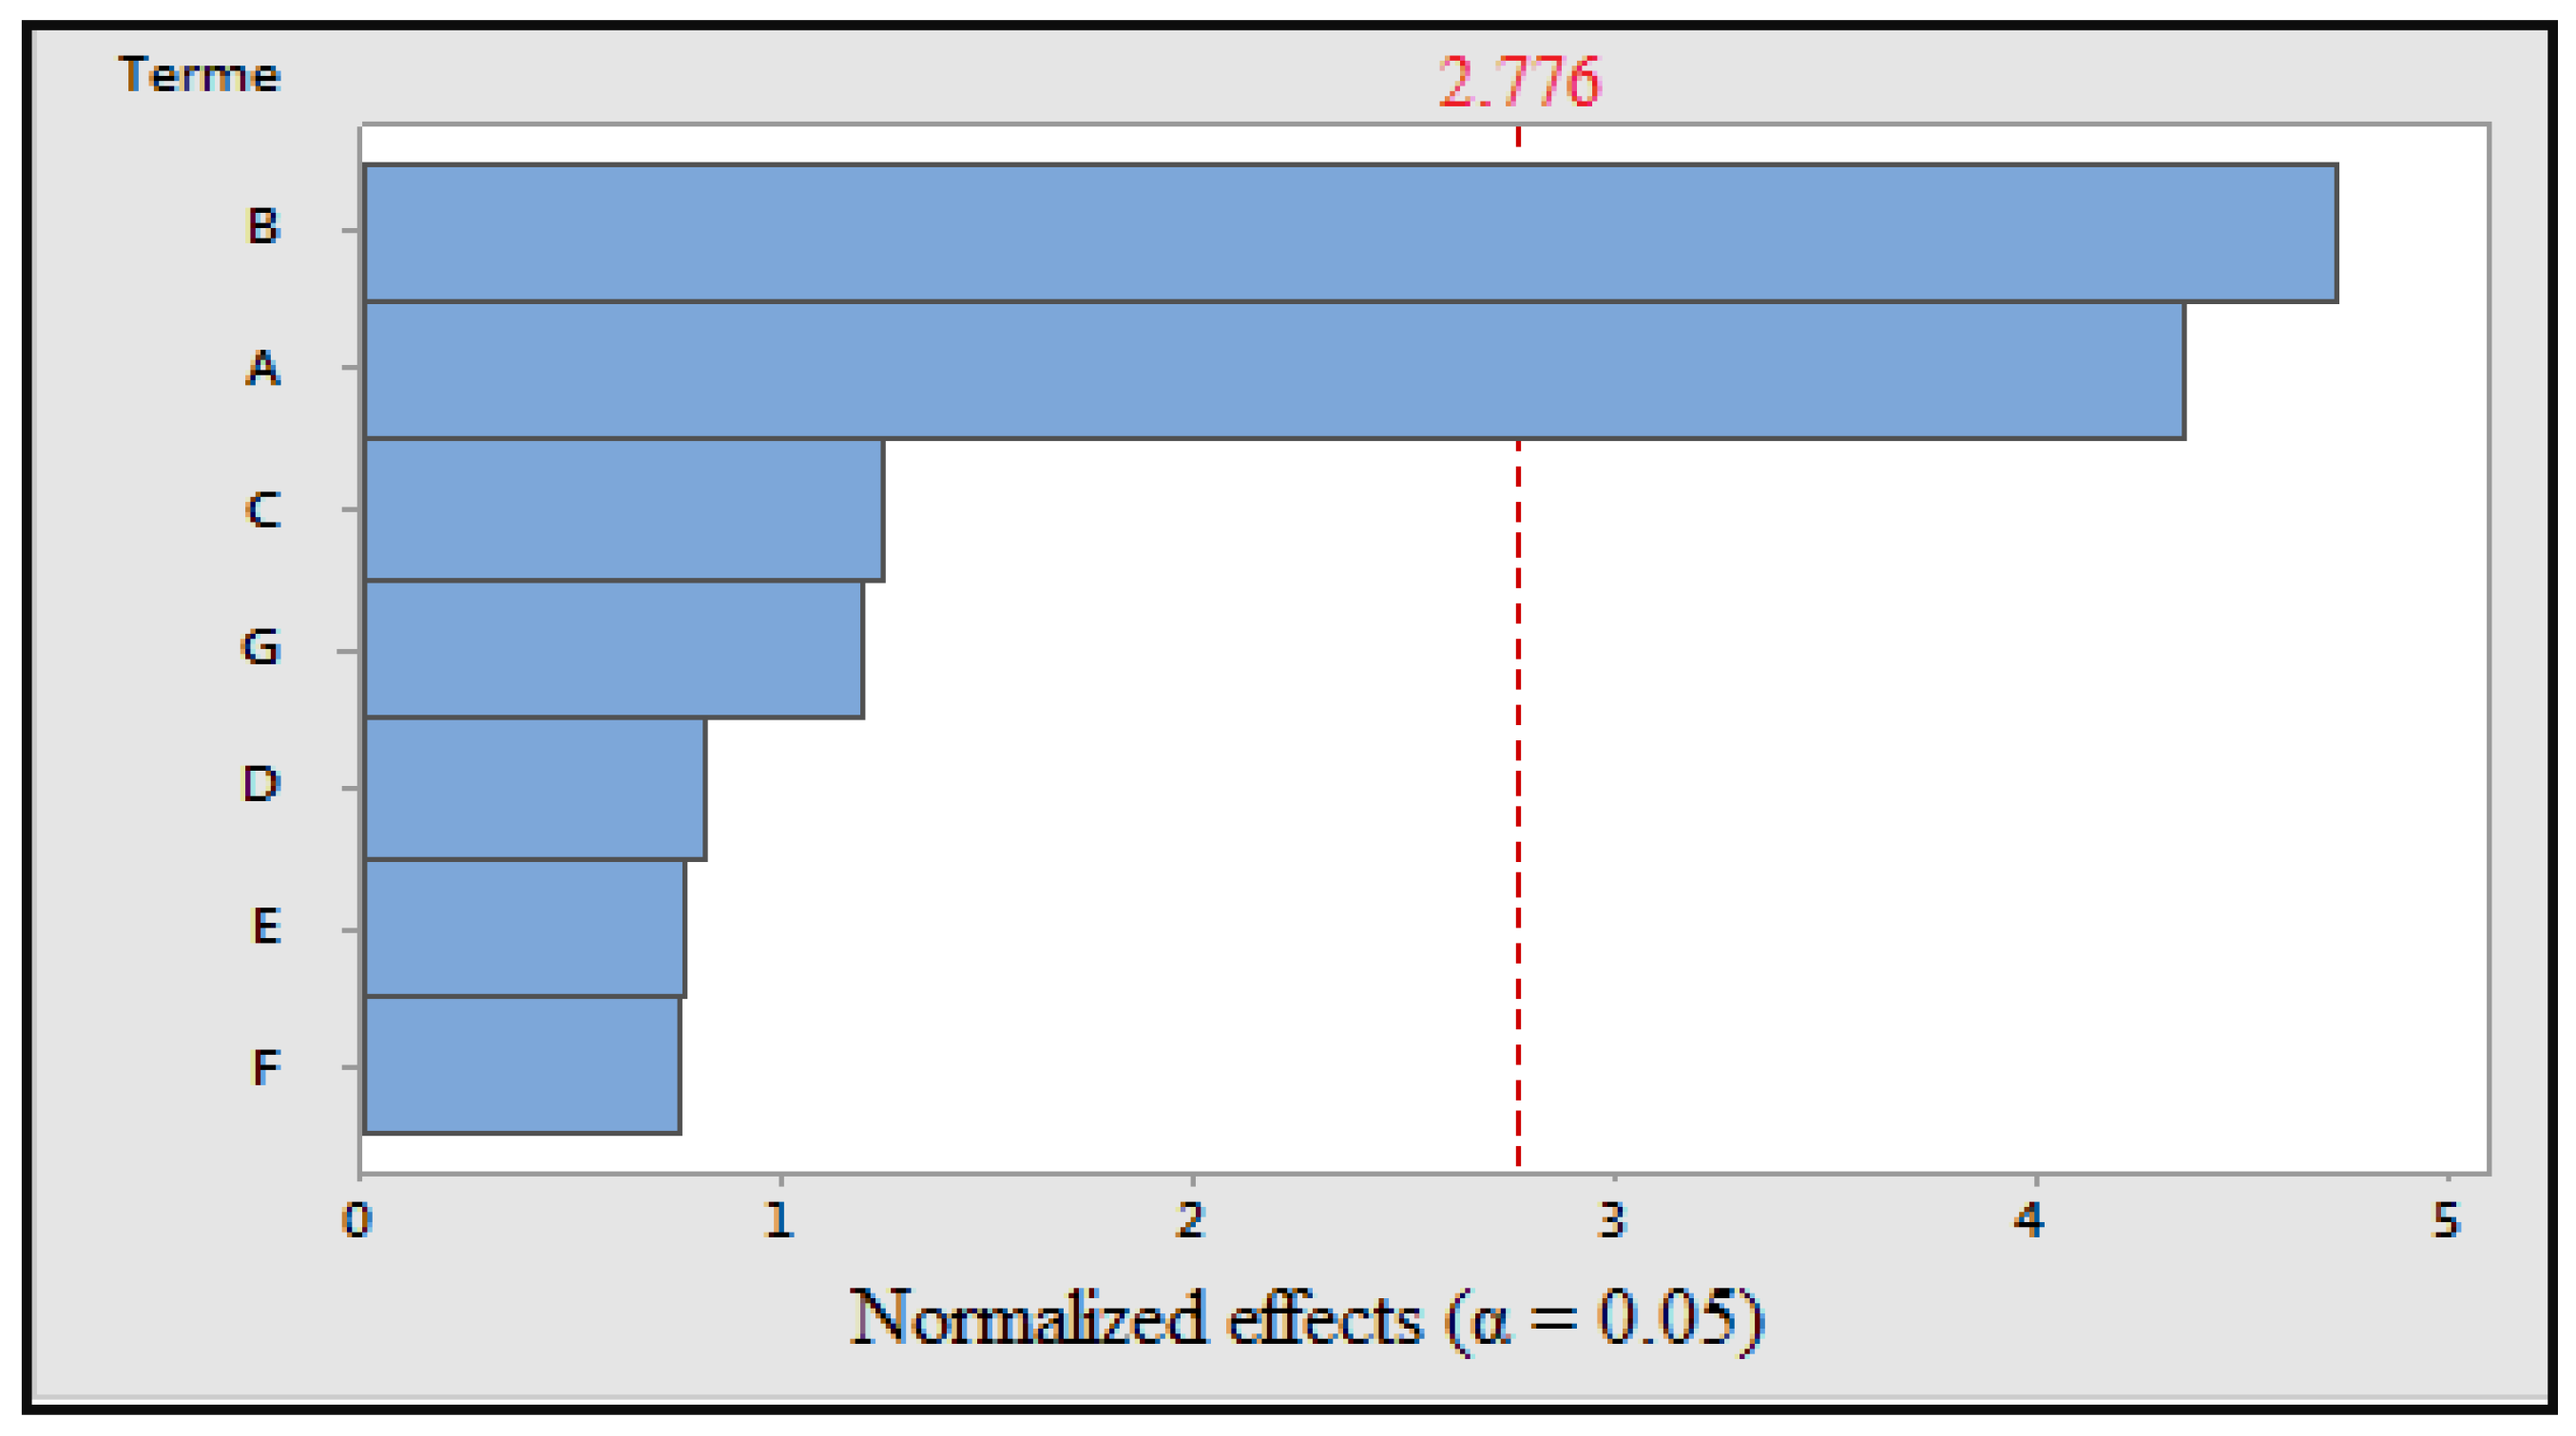
Figure 2.
Pareto diagram of normalized effects (α = 0.05). A: cooking time; B: cooking temperature; C: volume of cooking water; D: concentration of solvent; E: maceration time; F: ultrasonic time; and G: grinding.
Figure 2.
Pareto diagram of normalized effects (α = 0.05). A: cooking time; B: cooking temperature; C: volume of cooking water; D: concentration of solvent; E: maceration time; F: ultrasonic time; and G: grinding.
Figure 3.
Pareto diagram of normalized effects (α = 0.05); A: cooking time; B: cooking temperature; C: volume of cooking water; D: concentration of solvent; E: maceration time; F: ultrasonic time; and G: grinding.
Figure 3.
Pareto diagram of normalized effects (α = 0.05); A: cooking time; B: cooking temperature; C: volume of cooking water; D: concentration of solvent; E: maceration time; F: ultrasonic time; and G: grinding.
Figure 4.
Pareto diagram of normalized effects (α = 0.05); A: cooking time; B: power; C: volume of cooking water; D: concentration of solvent; E: maceration time; F: ultrasonic time; and G: grinding.
Figure 4.
Pareto diagram of normalized effects (α = 0.05); A: cooking time; B: power; C: volume of cooking water; D: concentration of solvent; E: maceration time; F: ultrasonic time; and G: grinding.
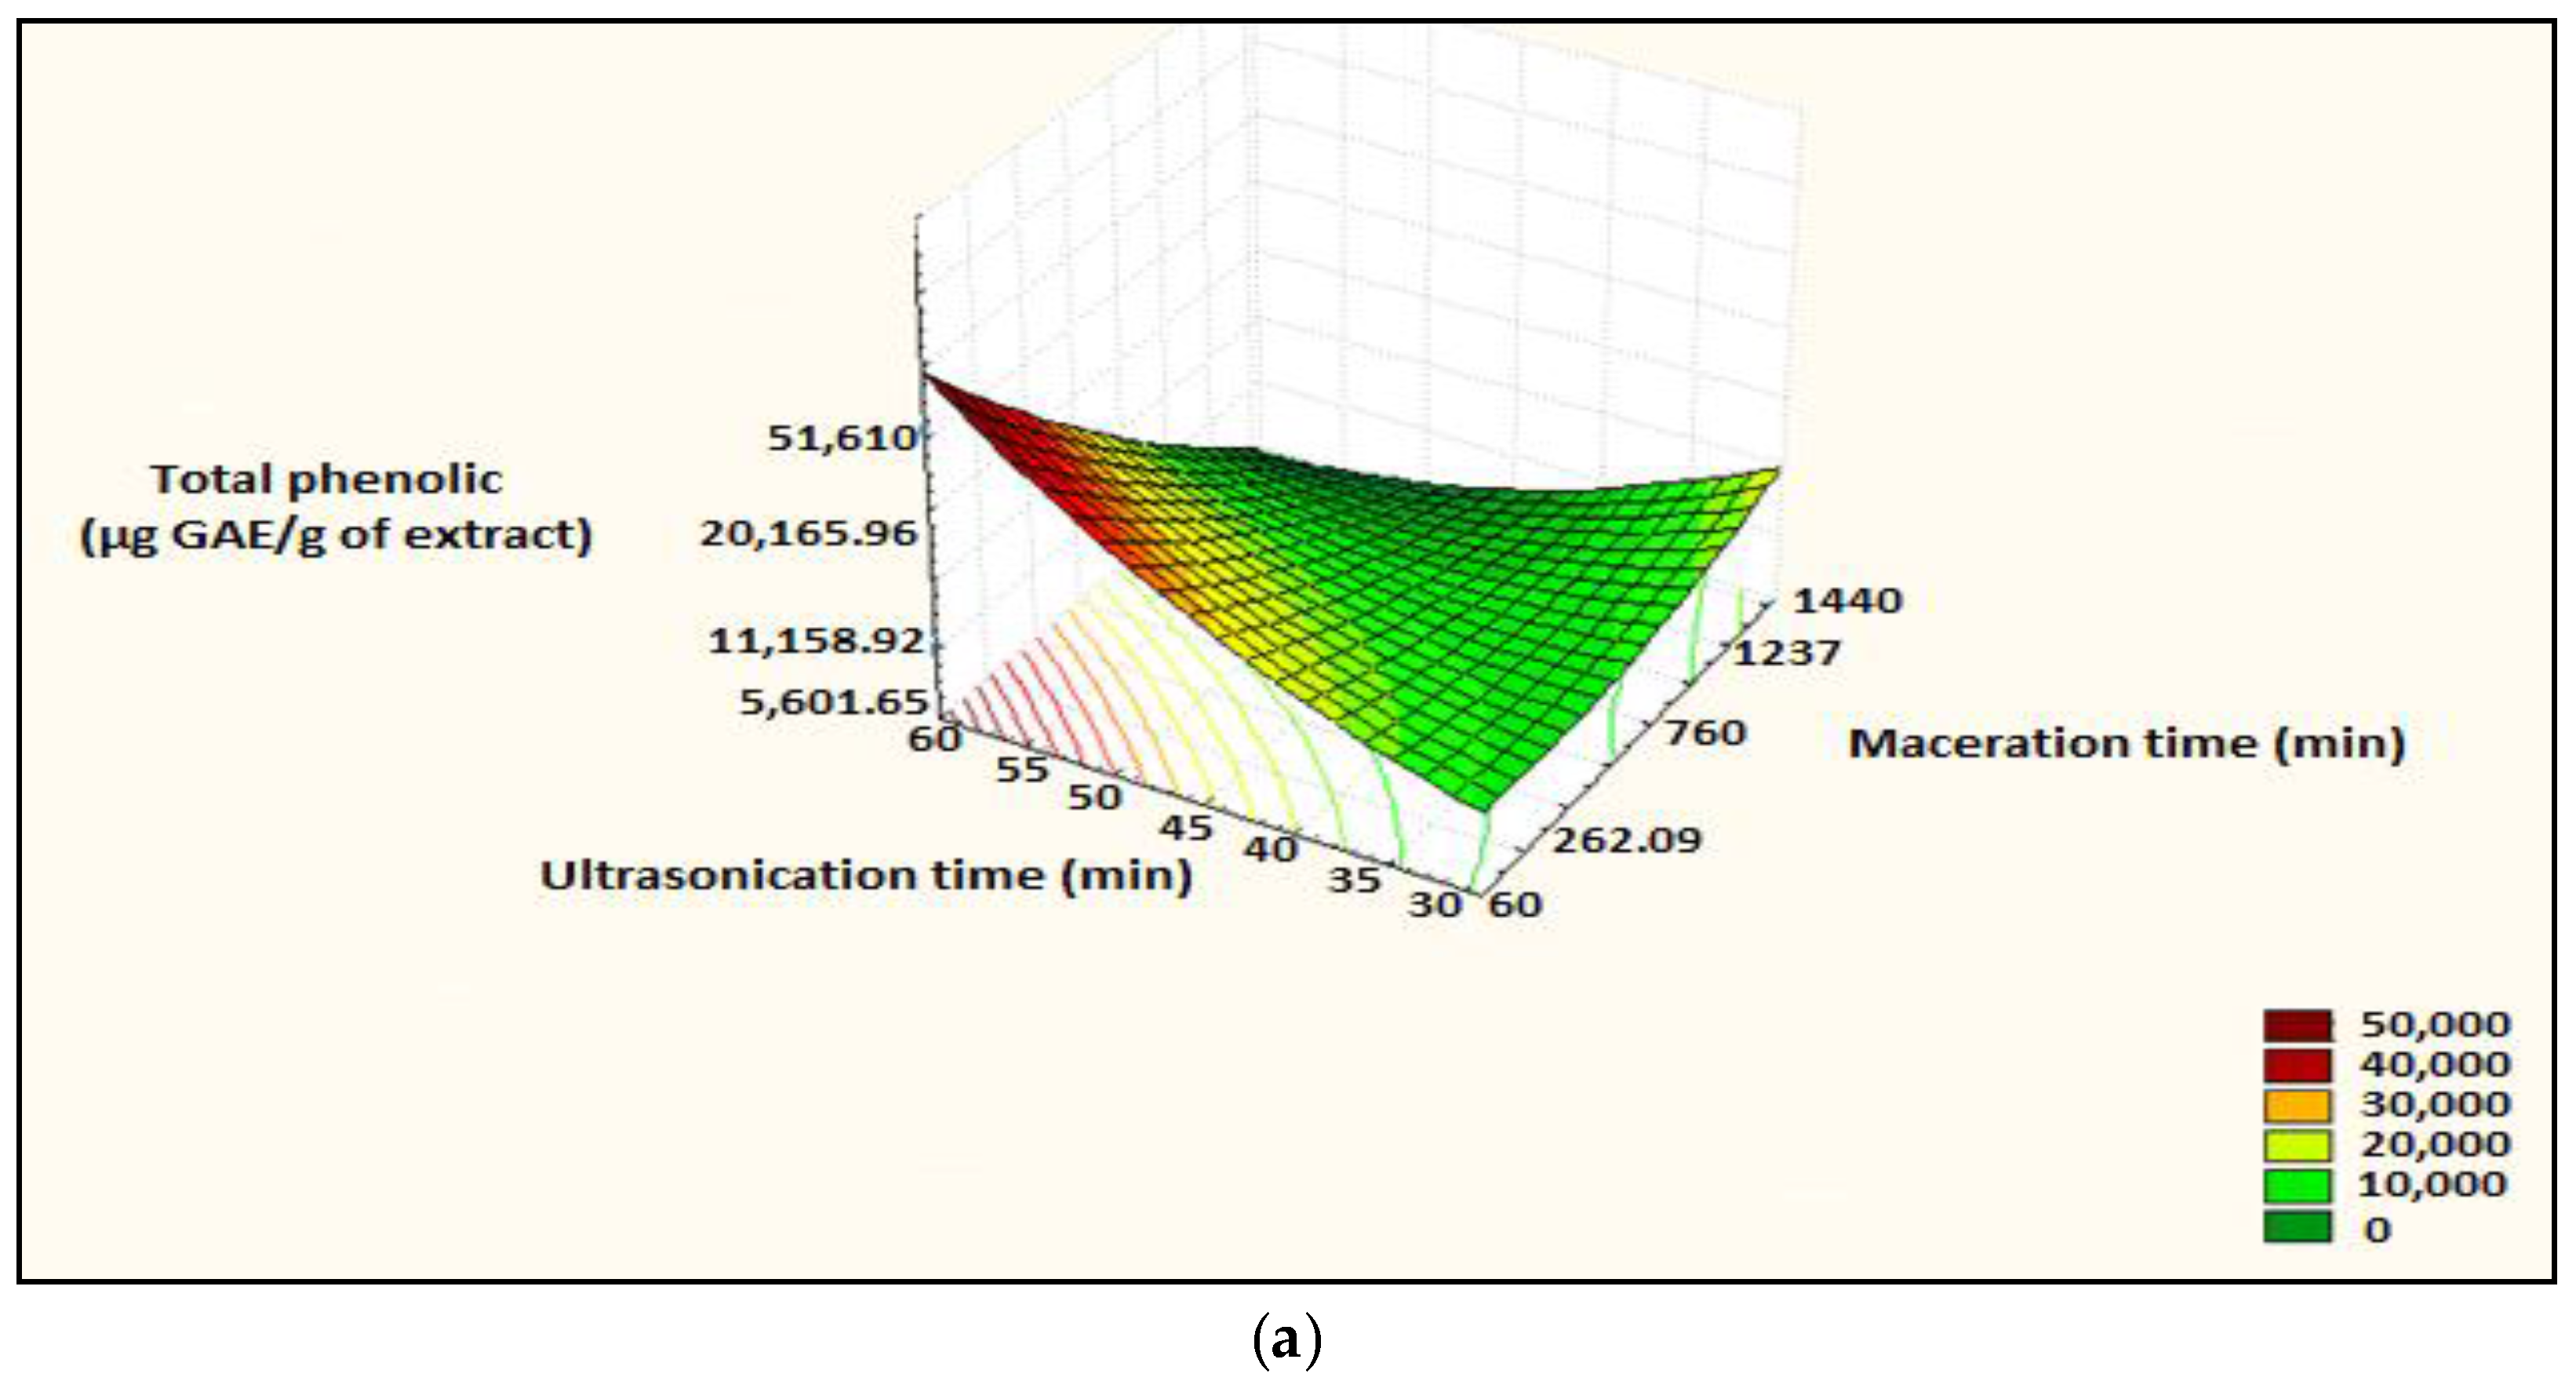
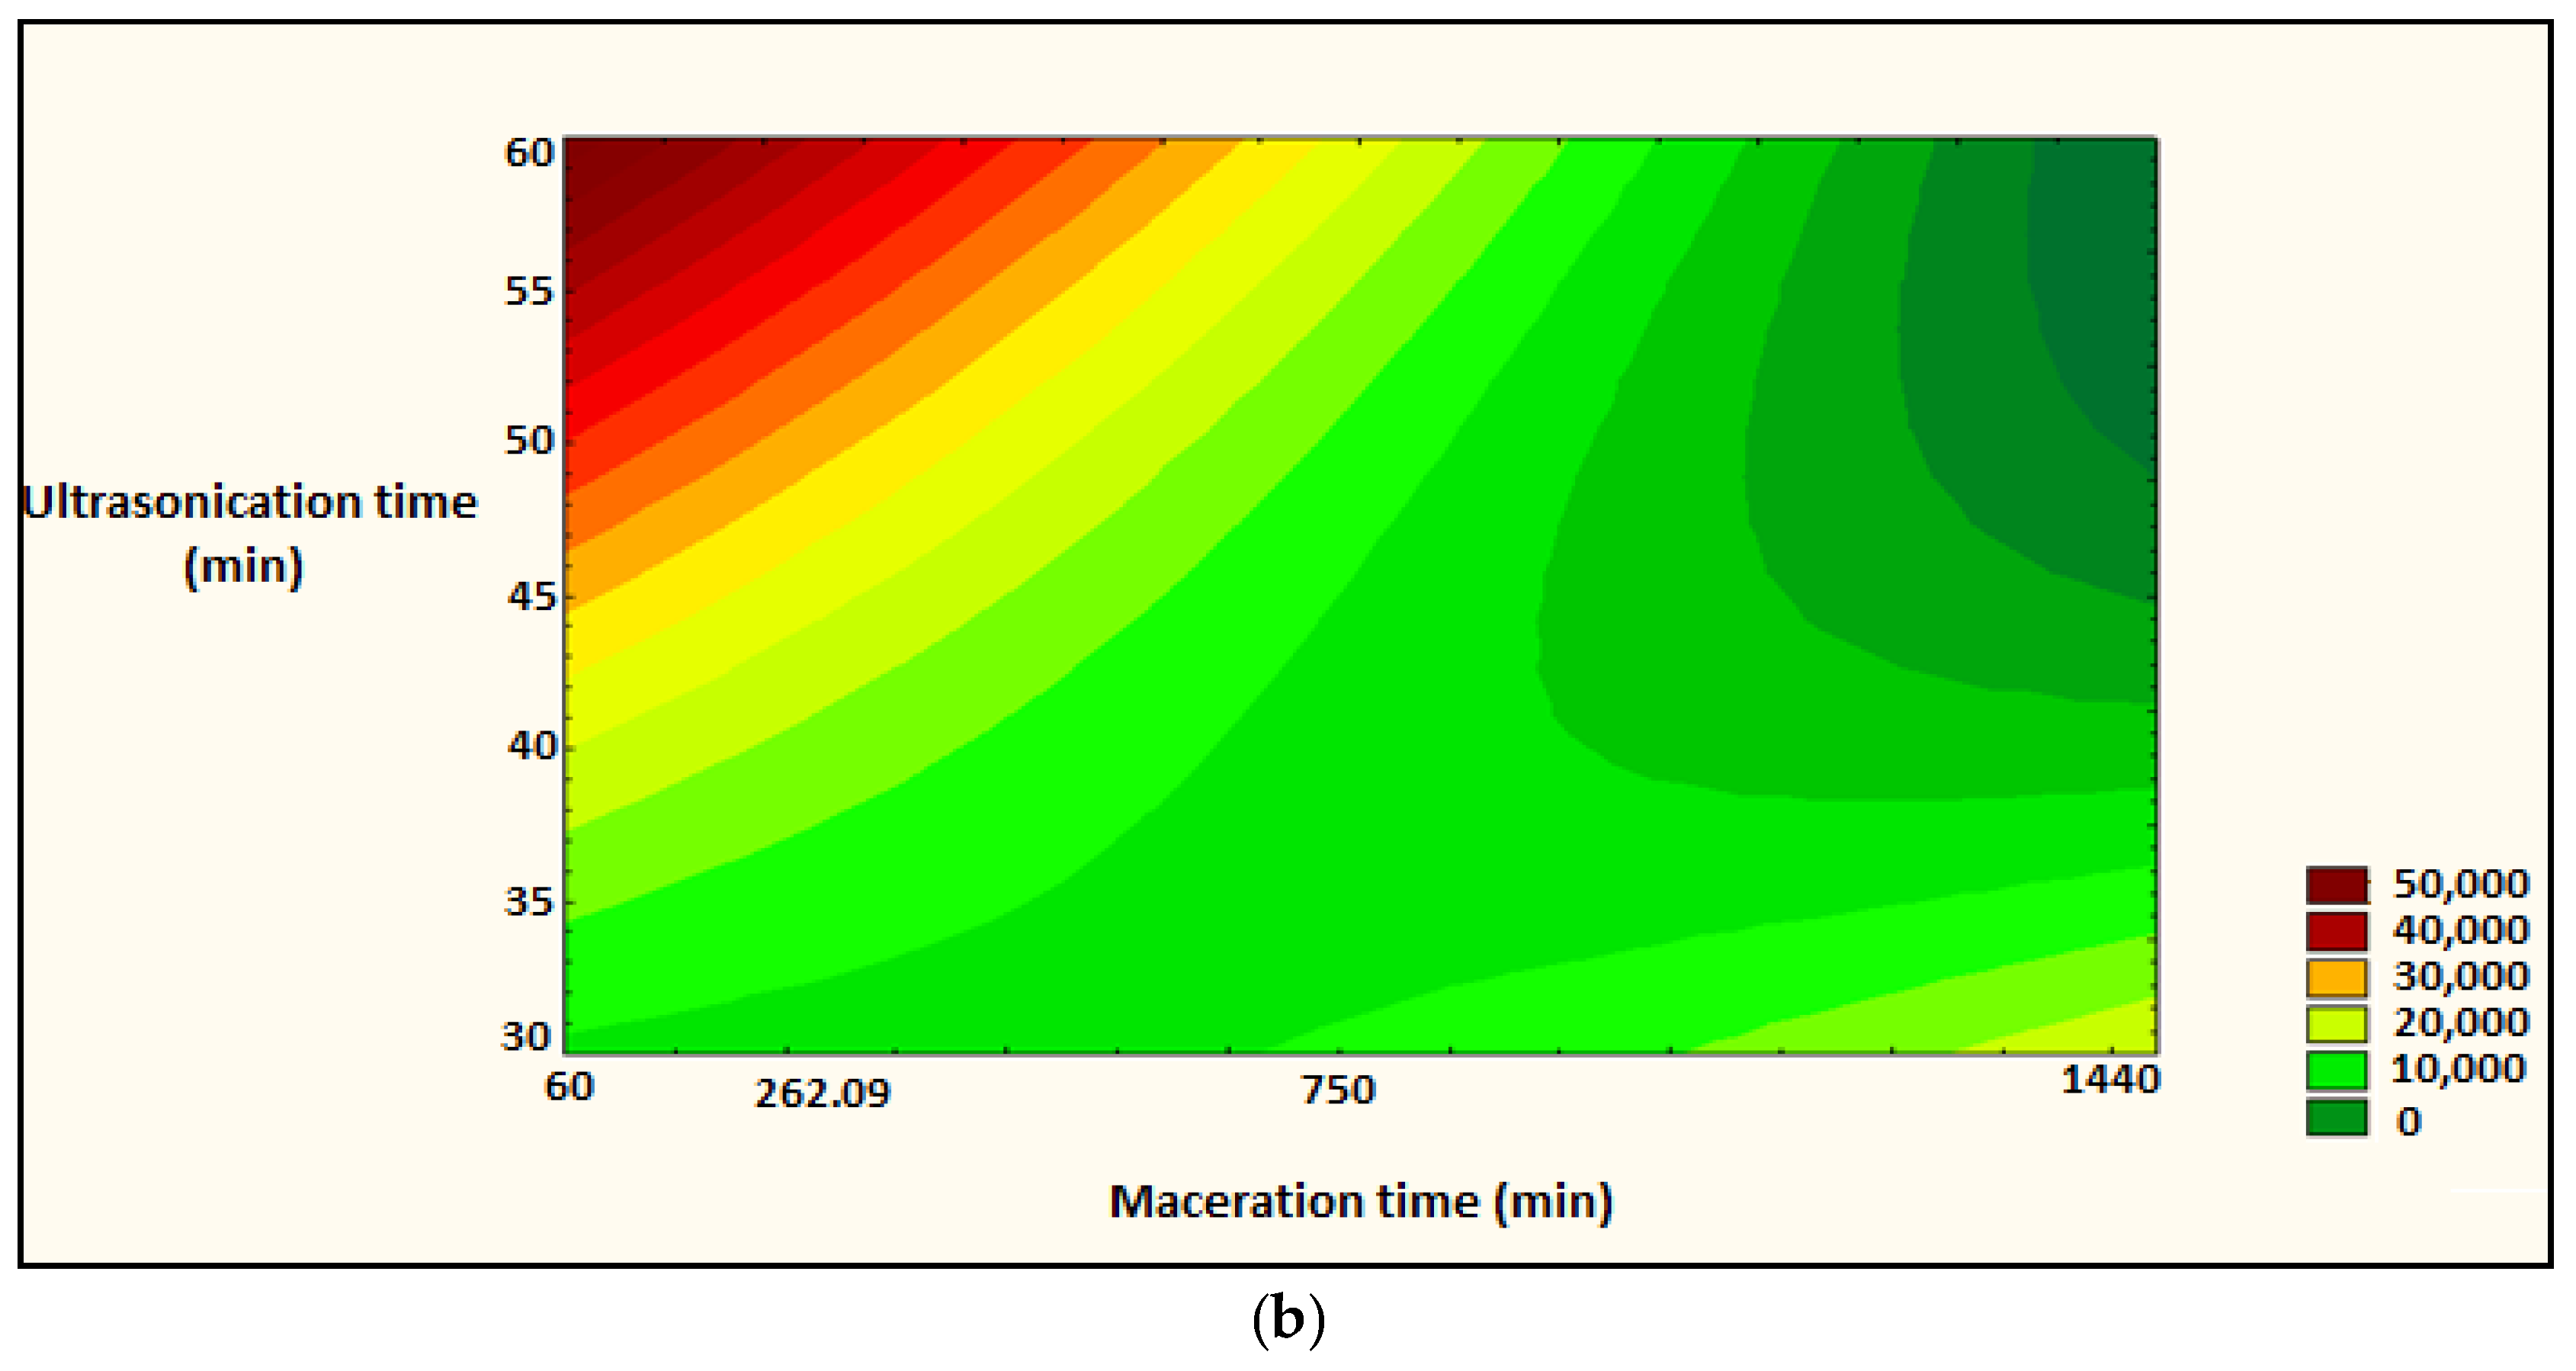
Figure 5.
Surface plot and iso-response curve of polyphenols as a function of the two factors maceration time and ultrasonication time, (a): surface plot; (b): iso-response curve.
Figure 5.
Surface plot and iso-response curve of polyphenols as a function of the two factors maceration time and ultrasonication time, (a): surface plot; (b): iso-response curve.
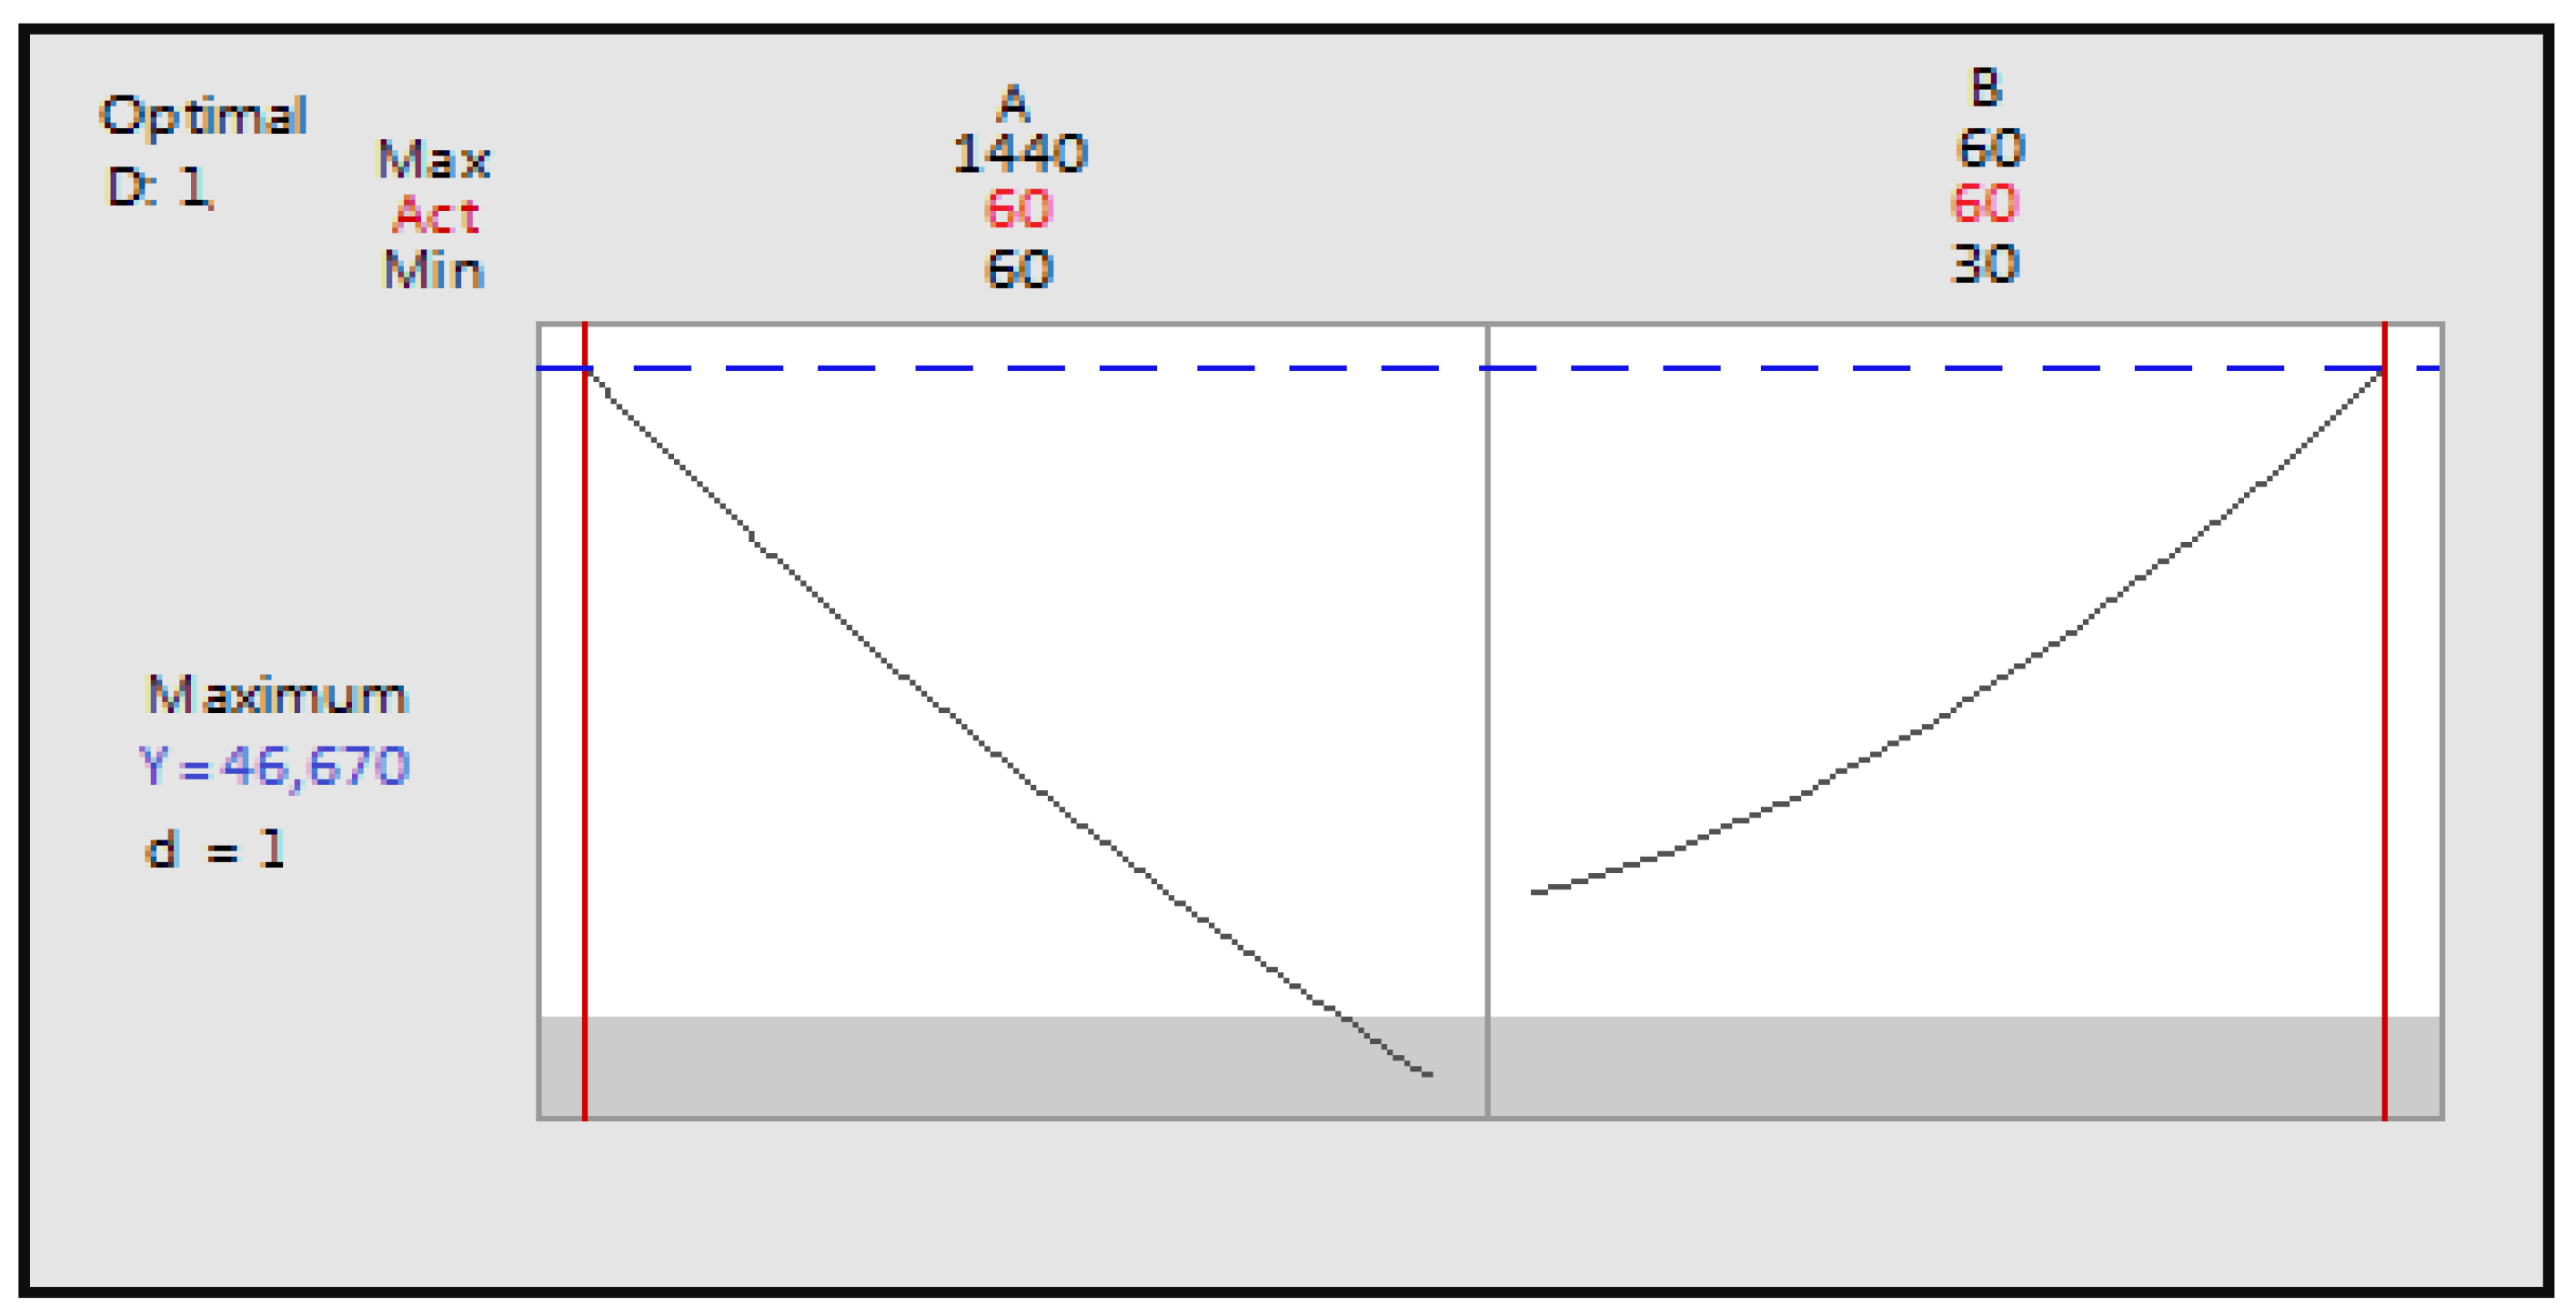
Figure 6.
Optimization of the two factors maceration time and ultrasonication time as a function of desirability; A: maceration time; B: ultrasonication time.
Figure 6.
Optimization of the two factors maceration time and ultrasonication time as a function of desirability; A: maceration time; B: ultrasonication time.
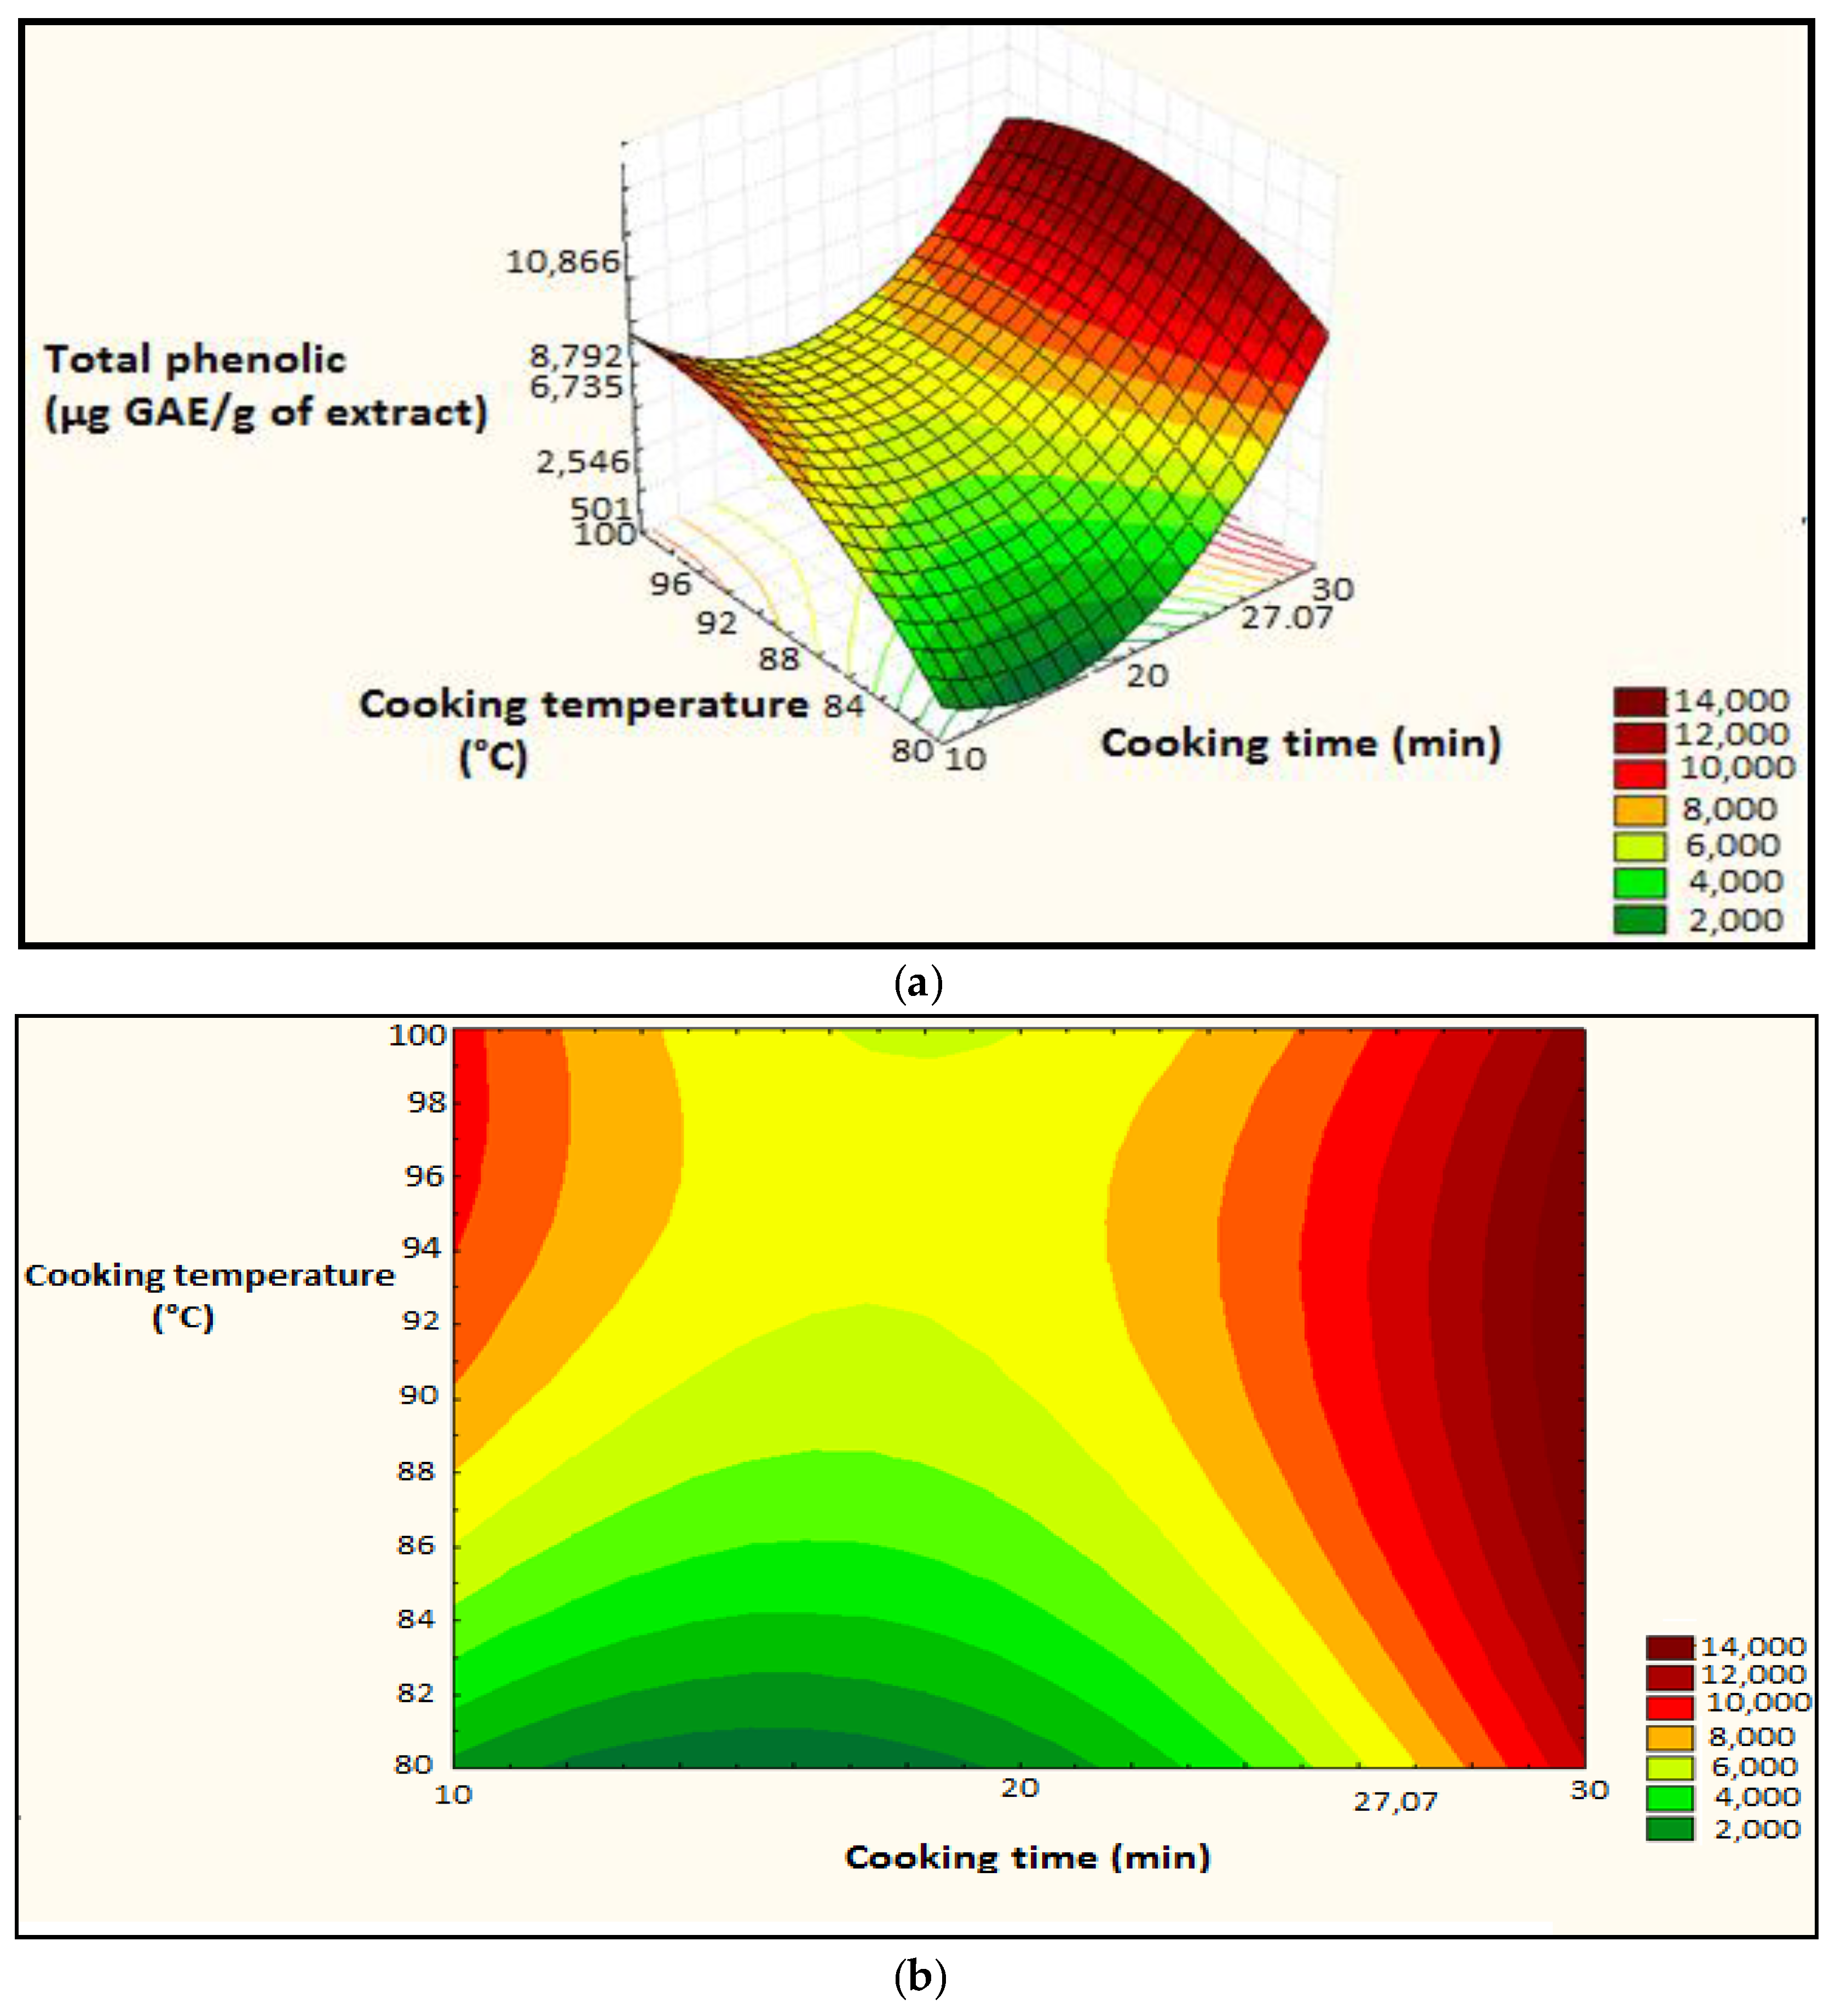
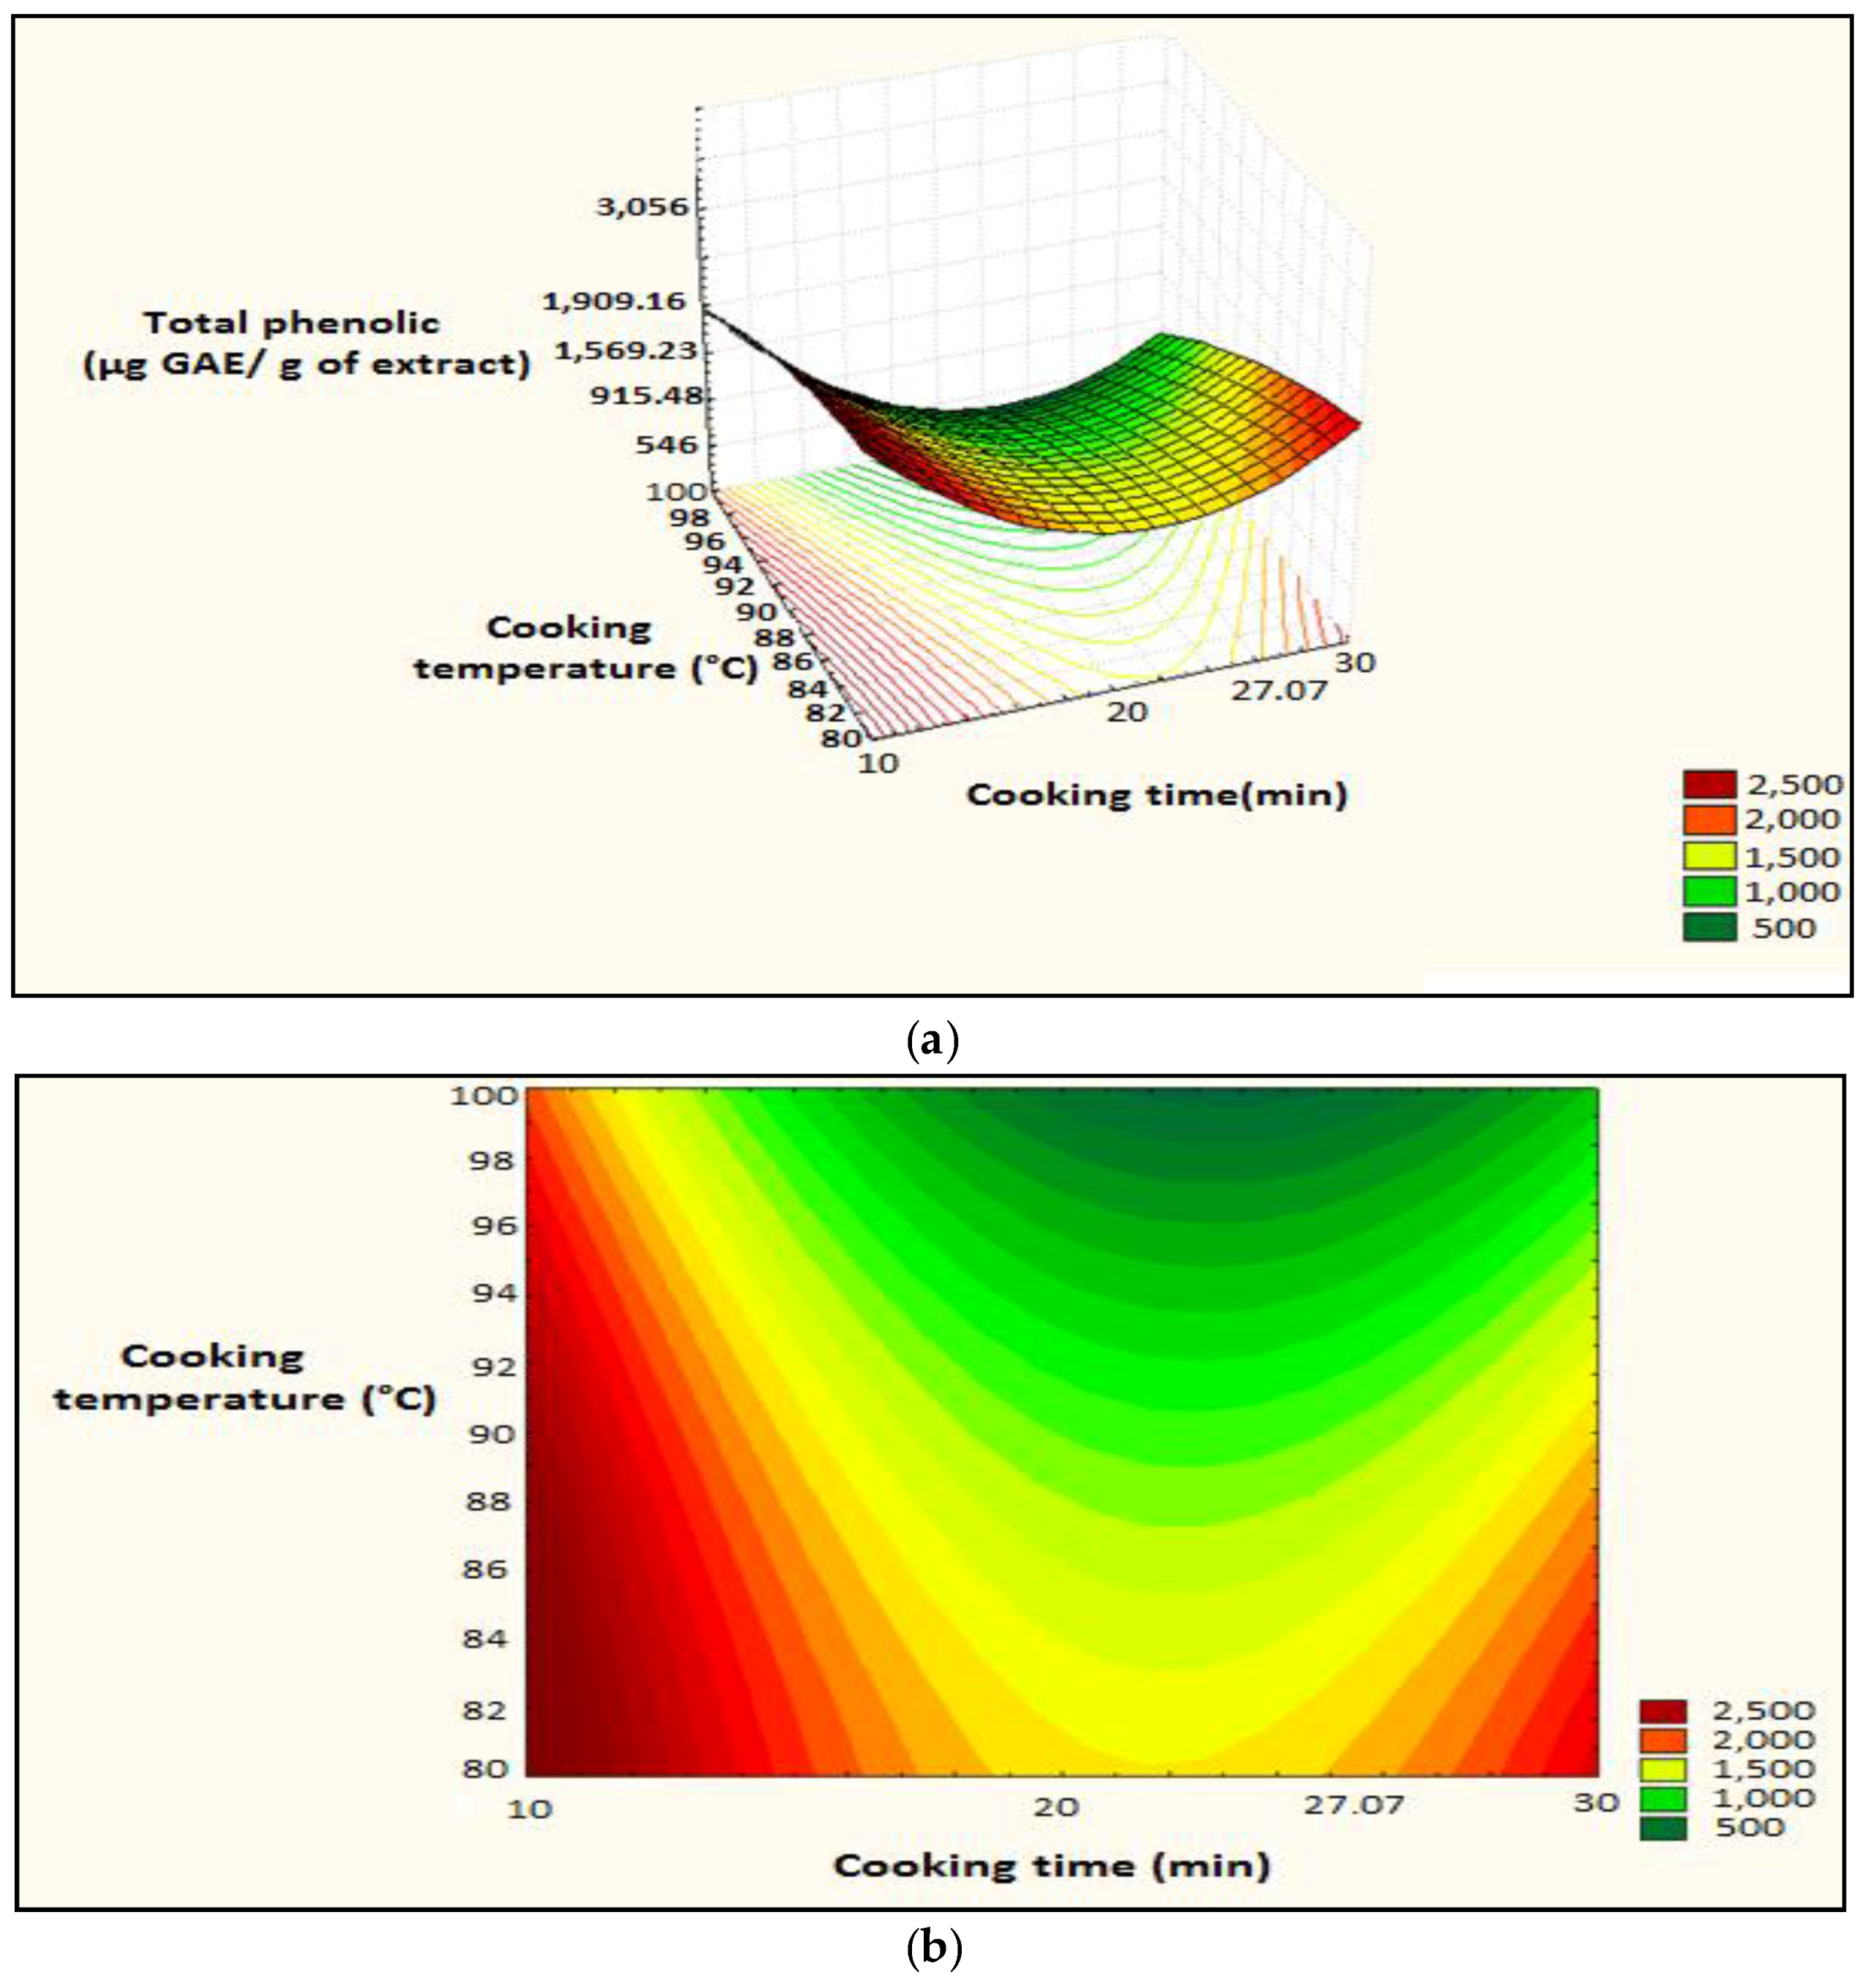
Figure 7.
Surface plot and iso-response curve of polyphenols as a function of the two factors cooking time and temperature, (a): surface plot; (b): iso-response curve.
Figure 7.
Surface plot and iso-response curve of polyphenols as a function of the two factors cooking time and temperature, (a): surface plot; (b): iso-response curve.
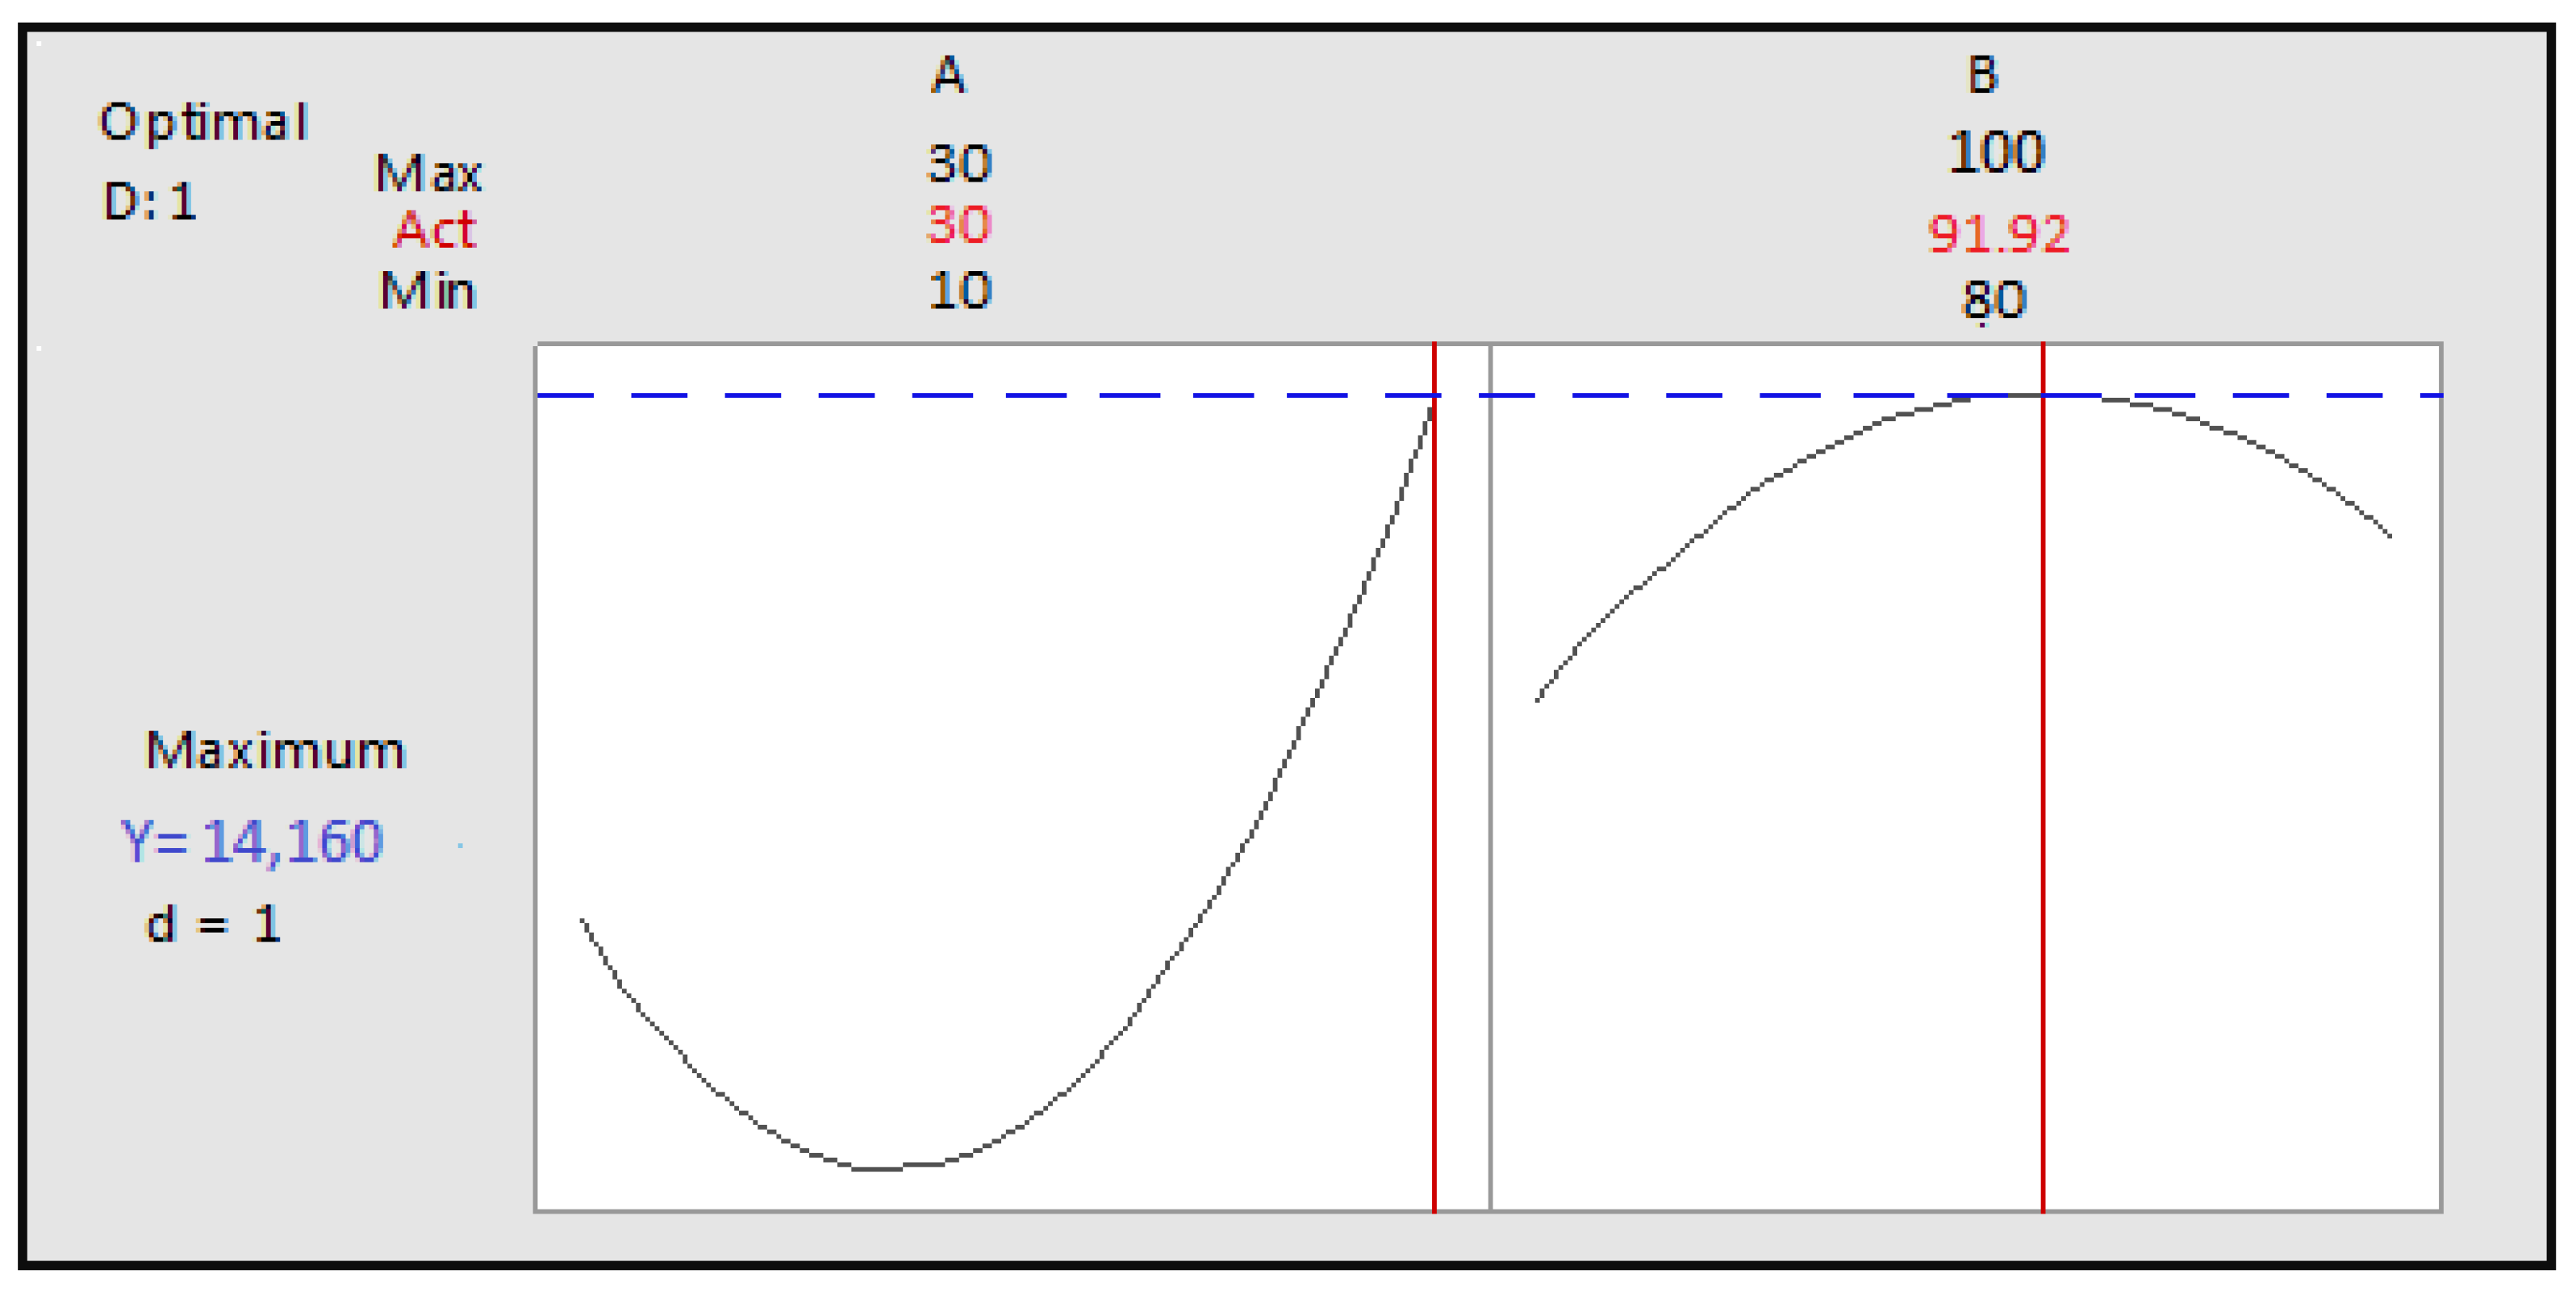
Figure 8.
Optimization of the two cooking time and temperature factors as a function of desirability; A: Cooking time; B: Cooking temperature.
Figure 8.
Optimization of the two cooking time and temperature factors as a function of desirability; A: Cooking time; B: Cooking temperature.
Figure 9.
Surface plot and iso-response curve of polyphenols as a function of both time and temperature cooking factors, (a): surface plot; (b): iso-response curve.
Figure 9.
Surface plot and iso-response curve of polyphenols as a function of both time and temperature cooking factors, (a): surface plot; (b): iso-response curve.
Figure 10.
Optimization of two cooking time and temperature factors according to desirability; A: cooking time; B: cooking temperature.
Figure 10.
Optimization of two cooking time and temperature factors according to desirability; A: cooking time; B: cooking temperature.
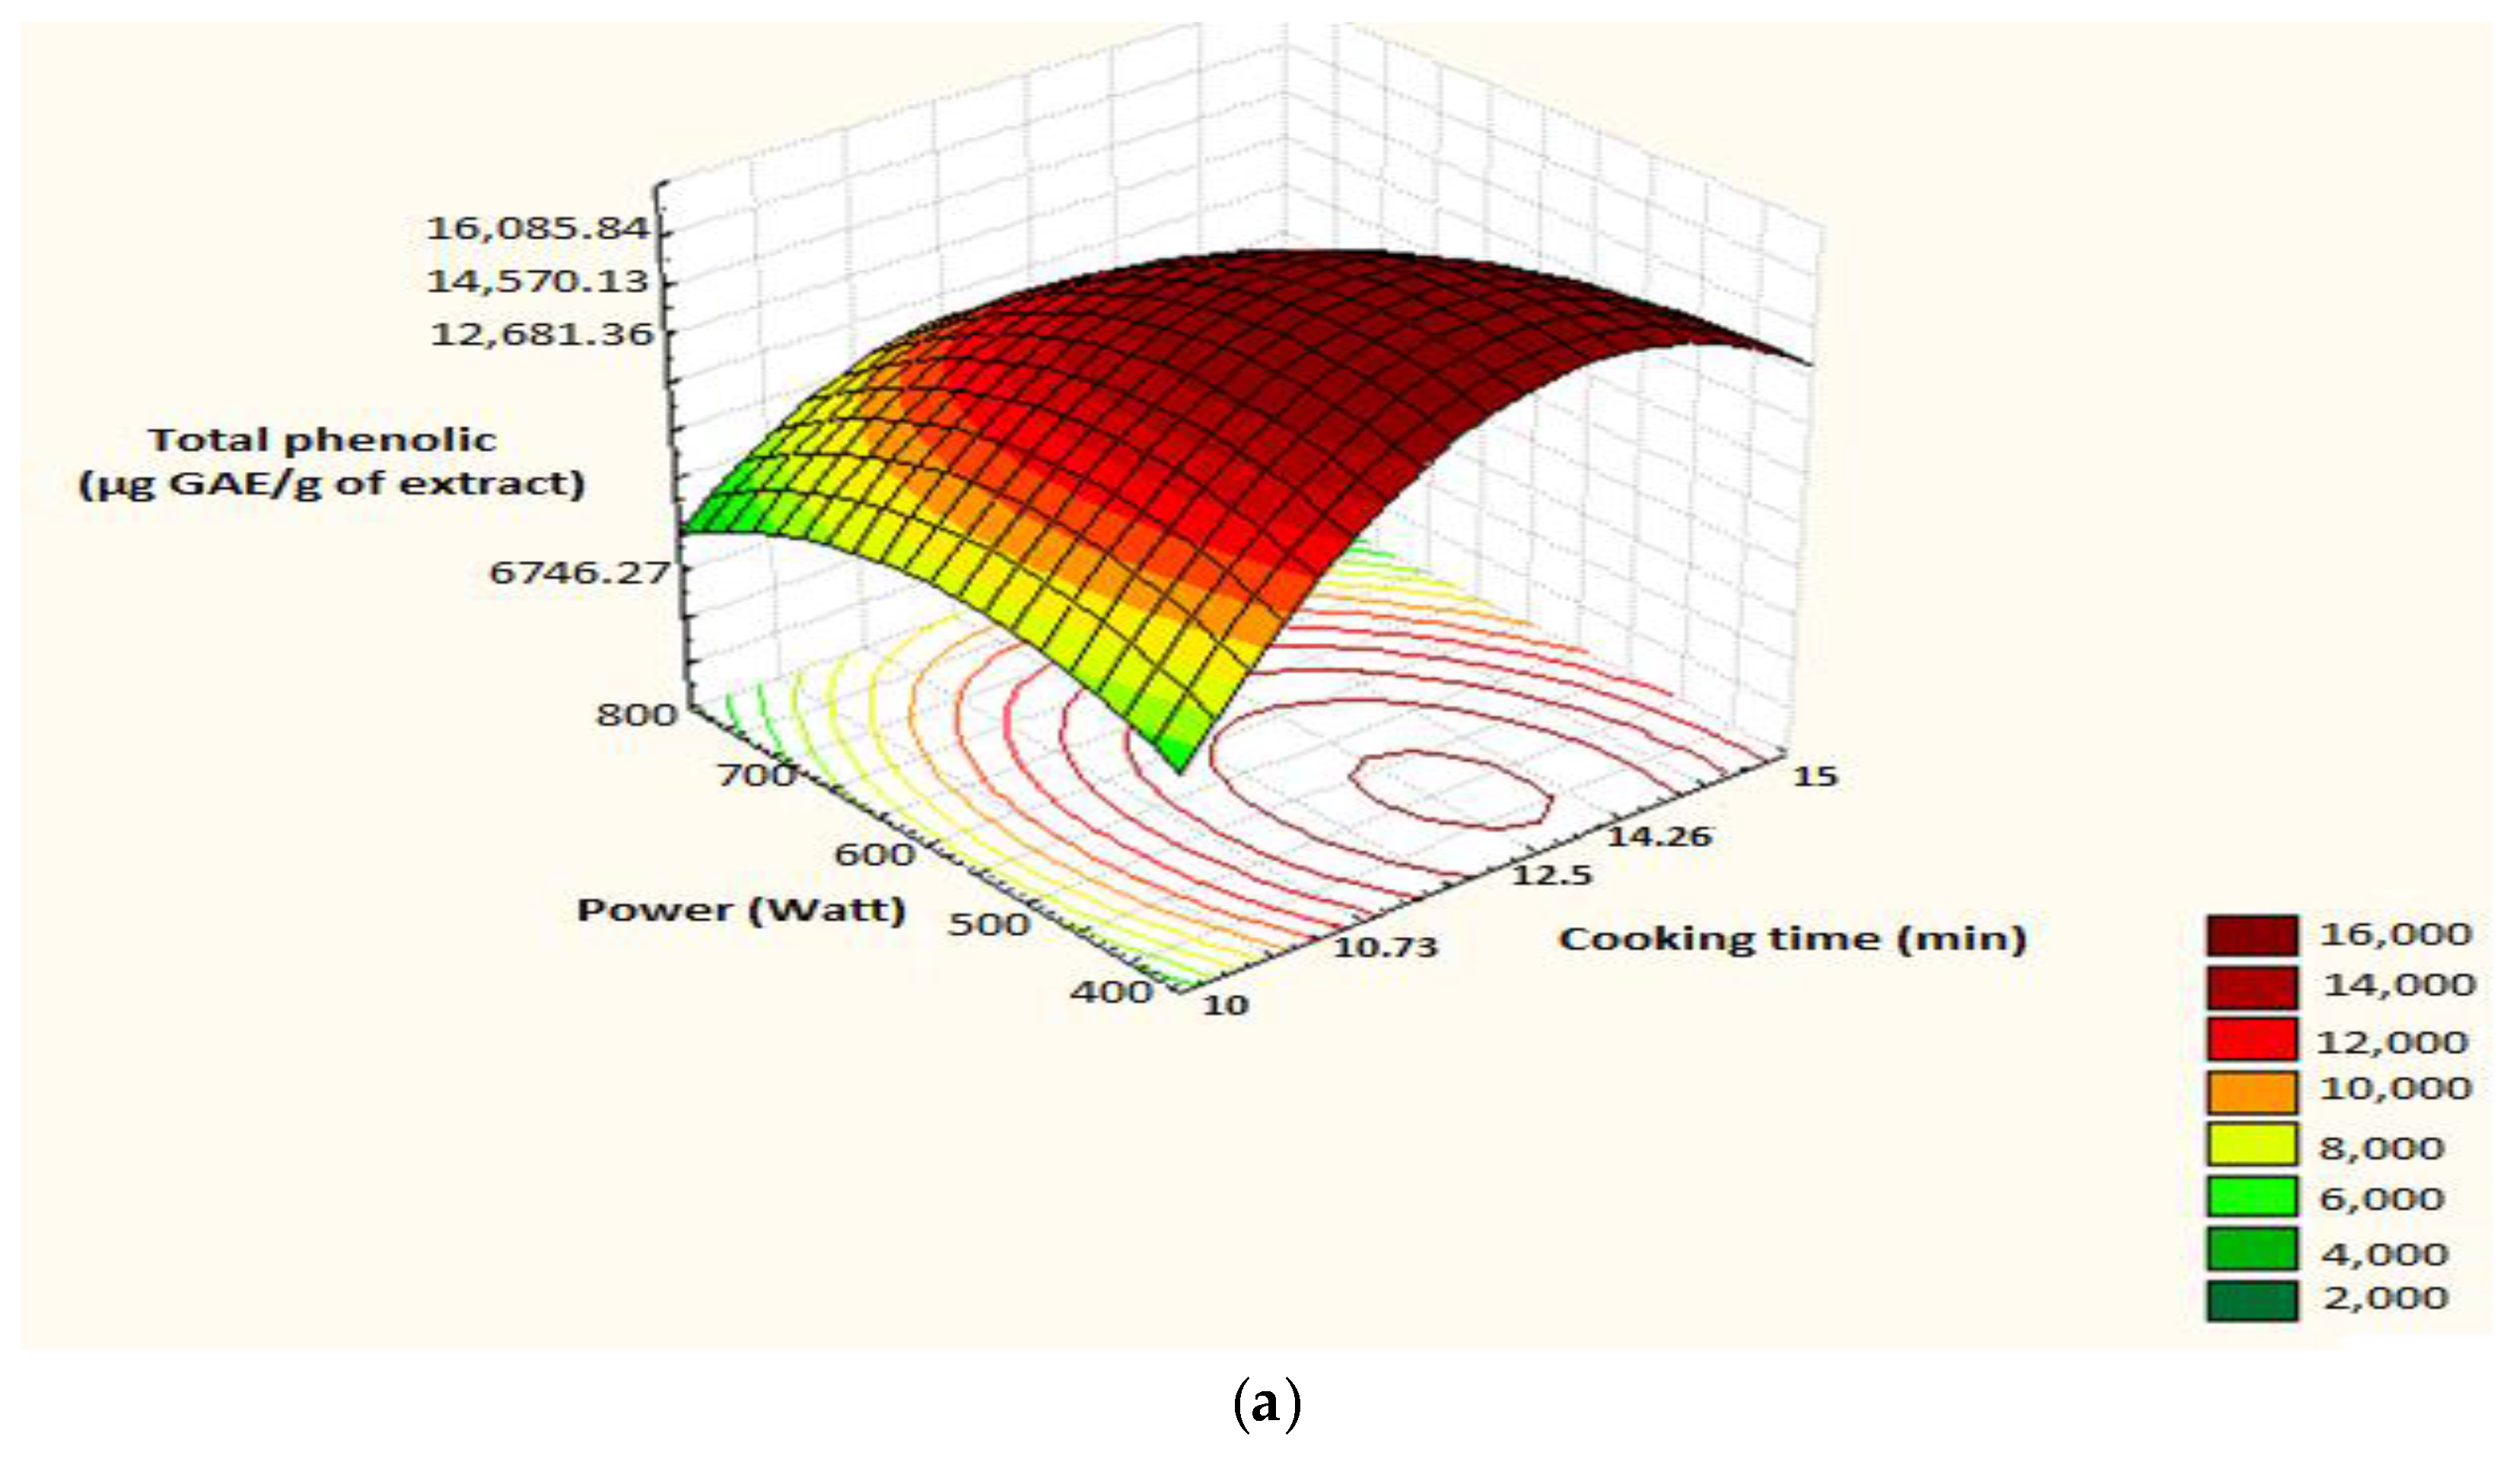
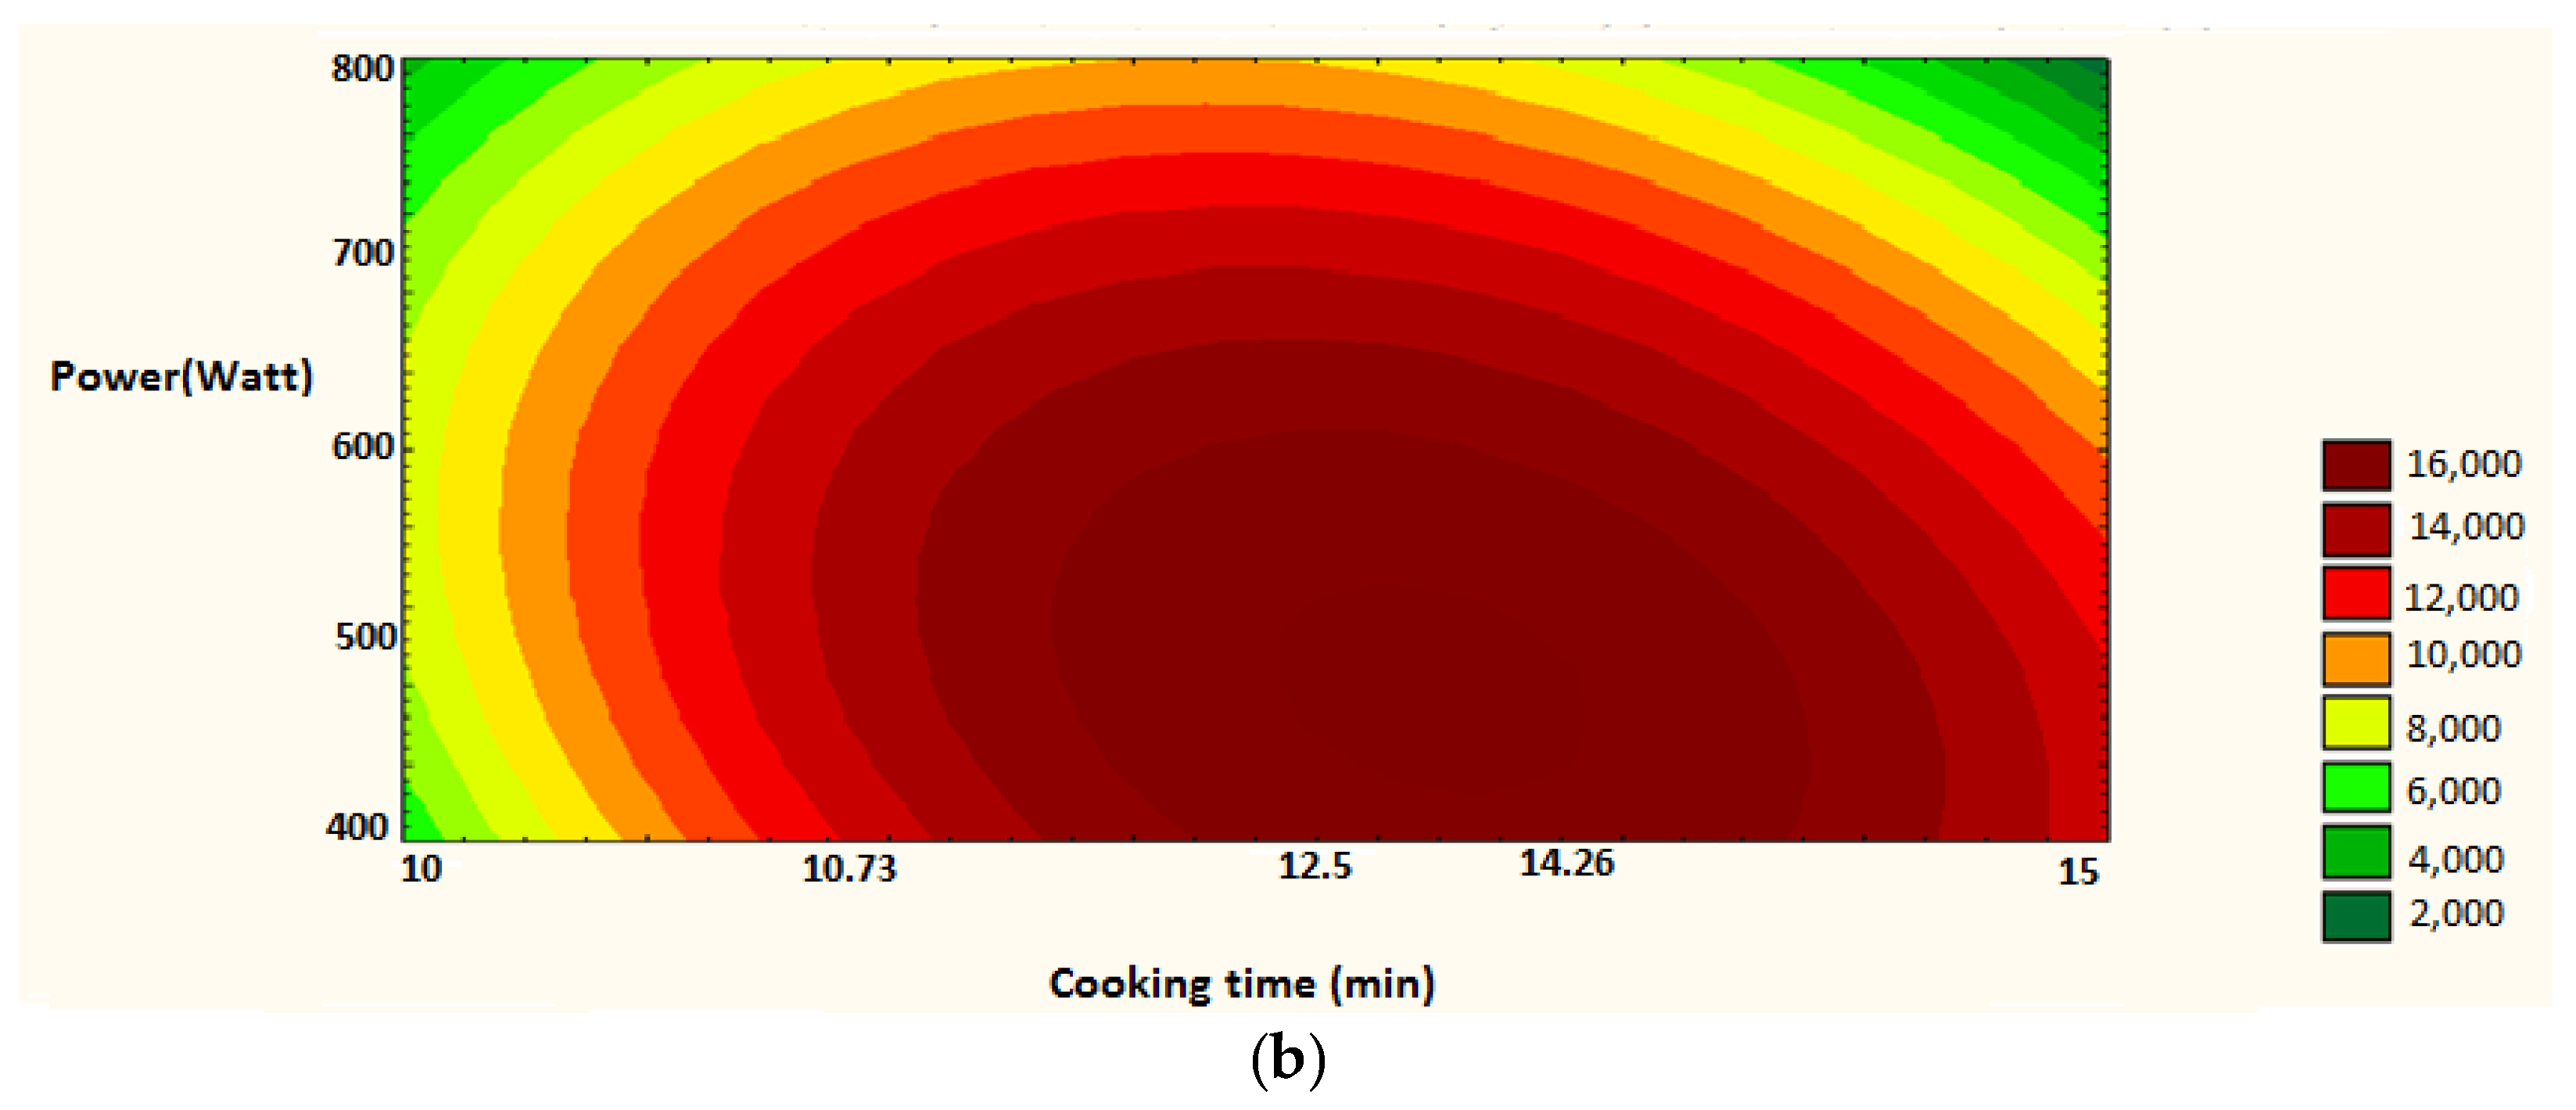
Figure 11.
Surface plot and iso-response curve of polyphenols as a function of both factors time of cooking and microwave power. (a): surface plot; (b): iso-response curve.
Figure 11.
Surface plot and iso-response curve of polyphenols as a function of both factors time of cooking and microwave power. (a): surface plot; (b): iso-response curve.
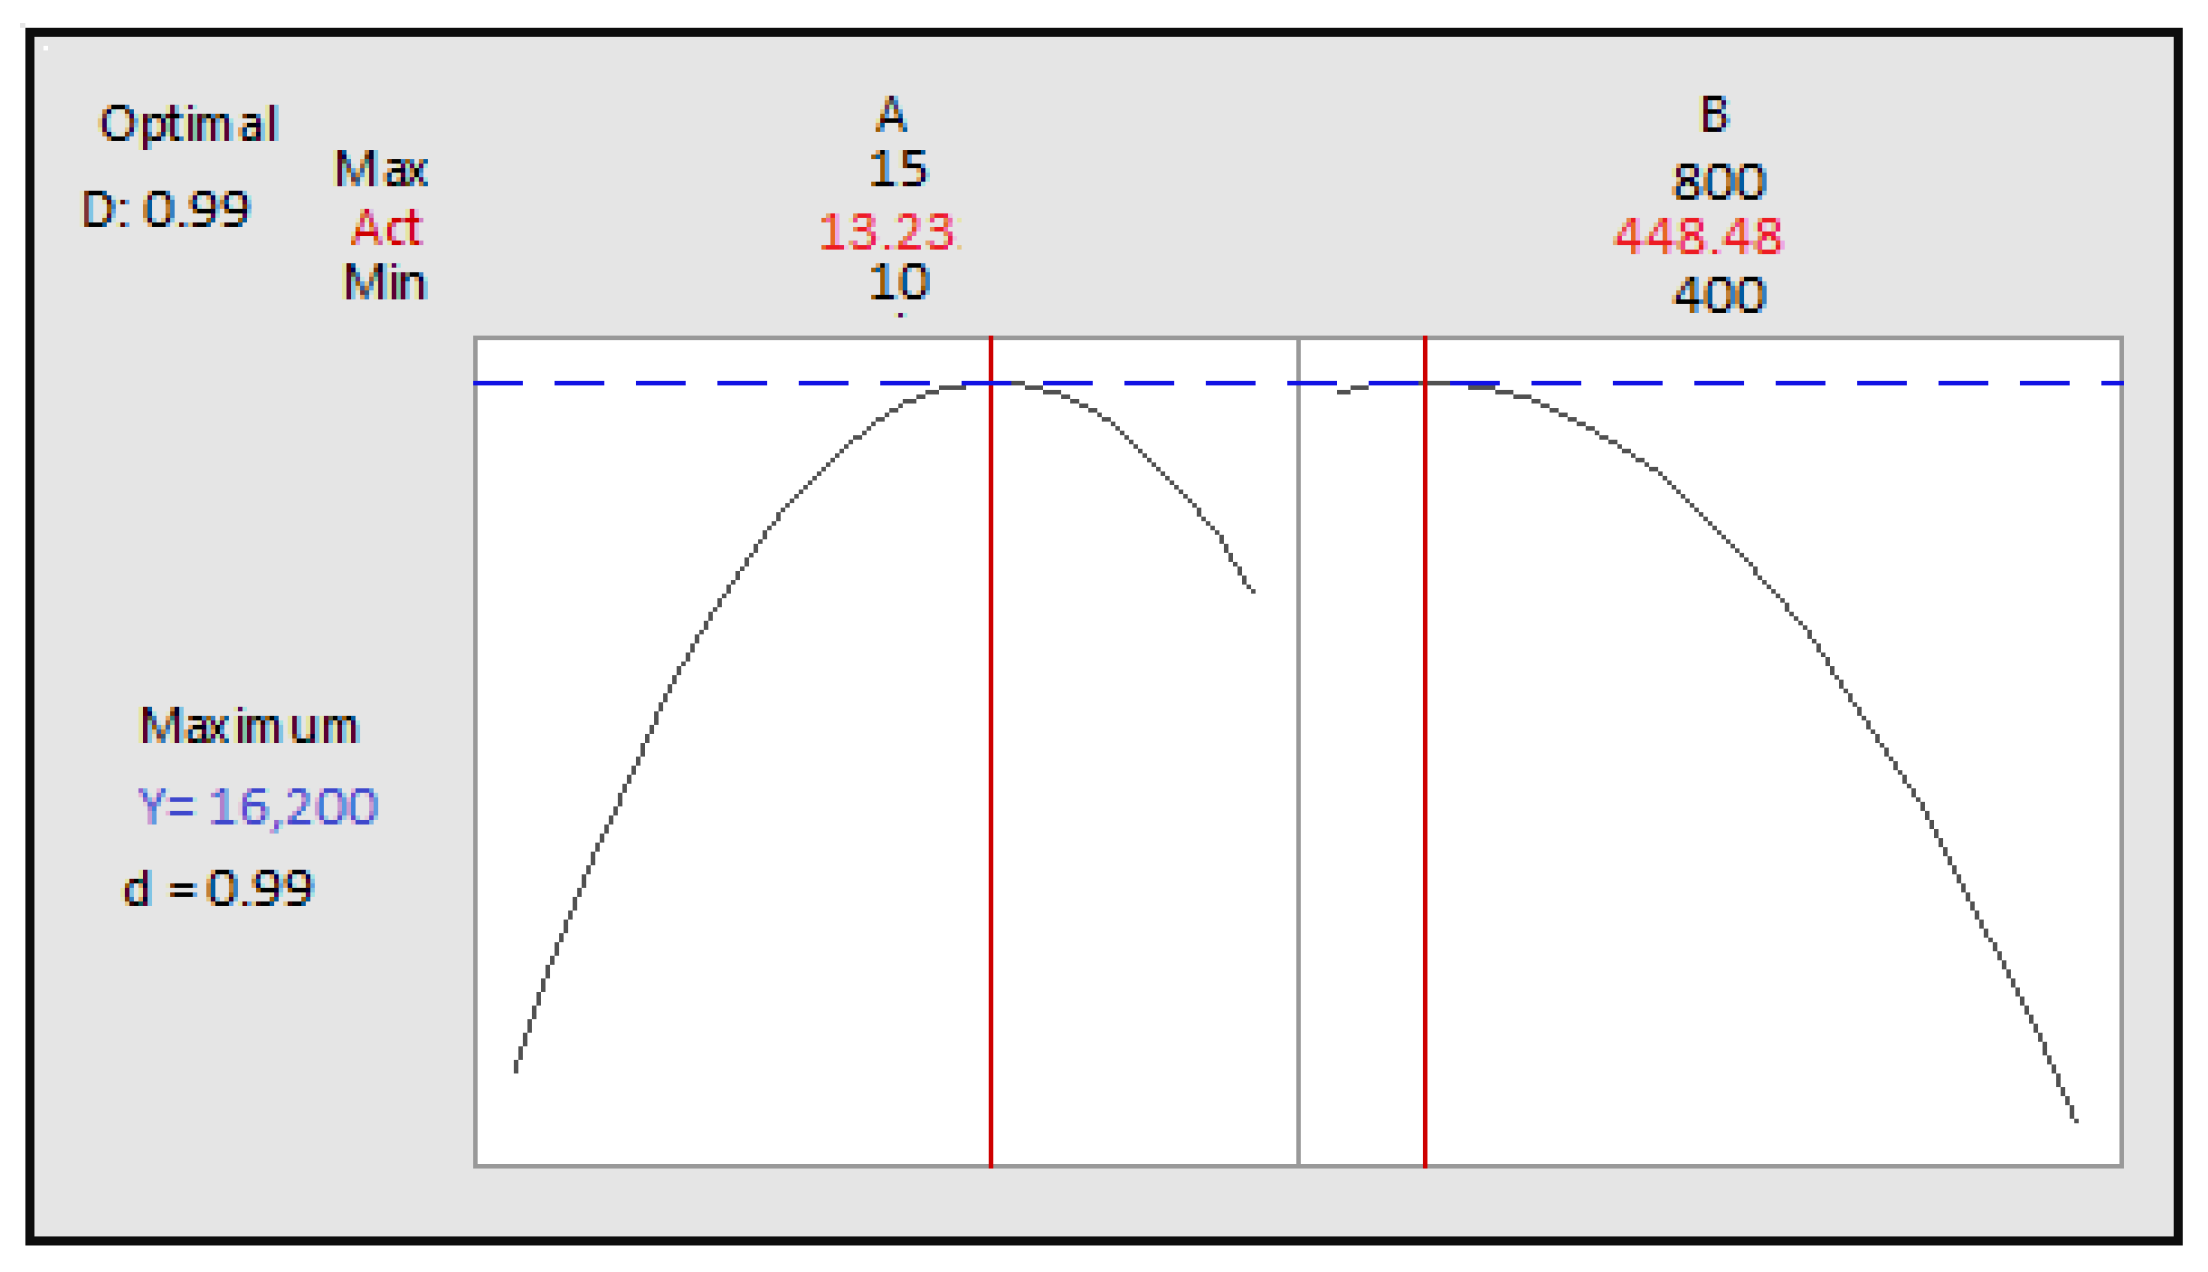
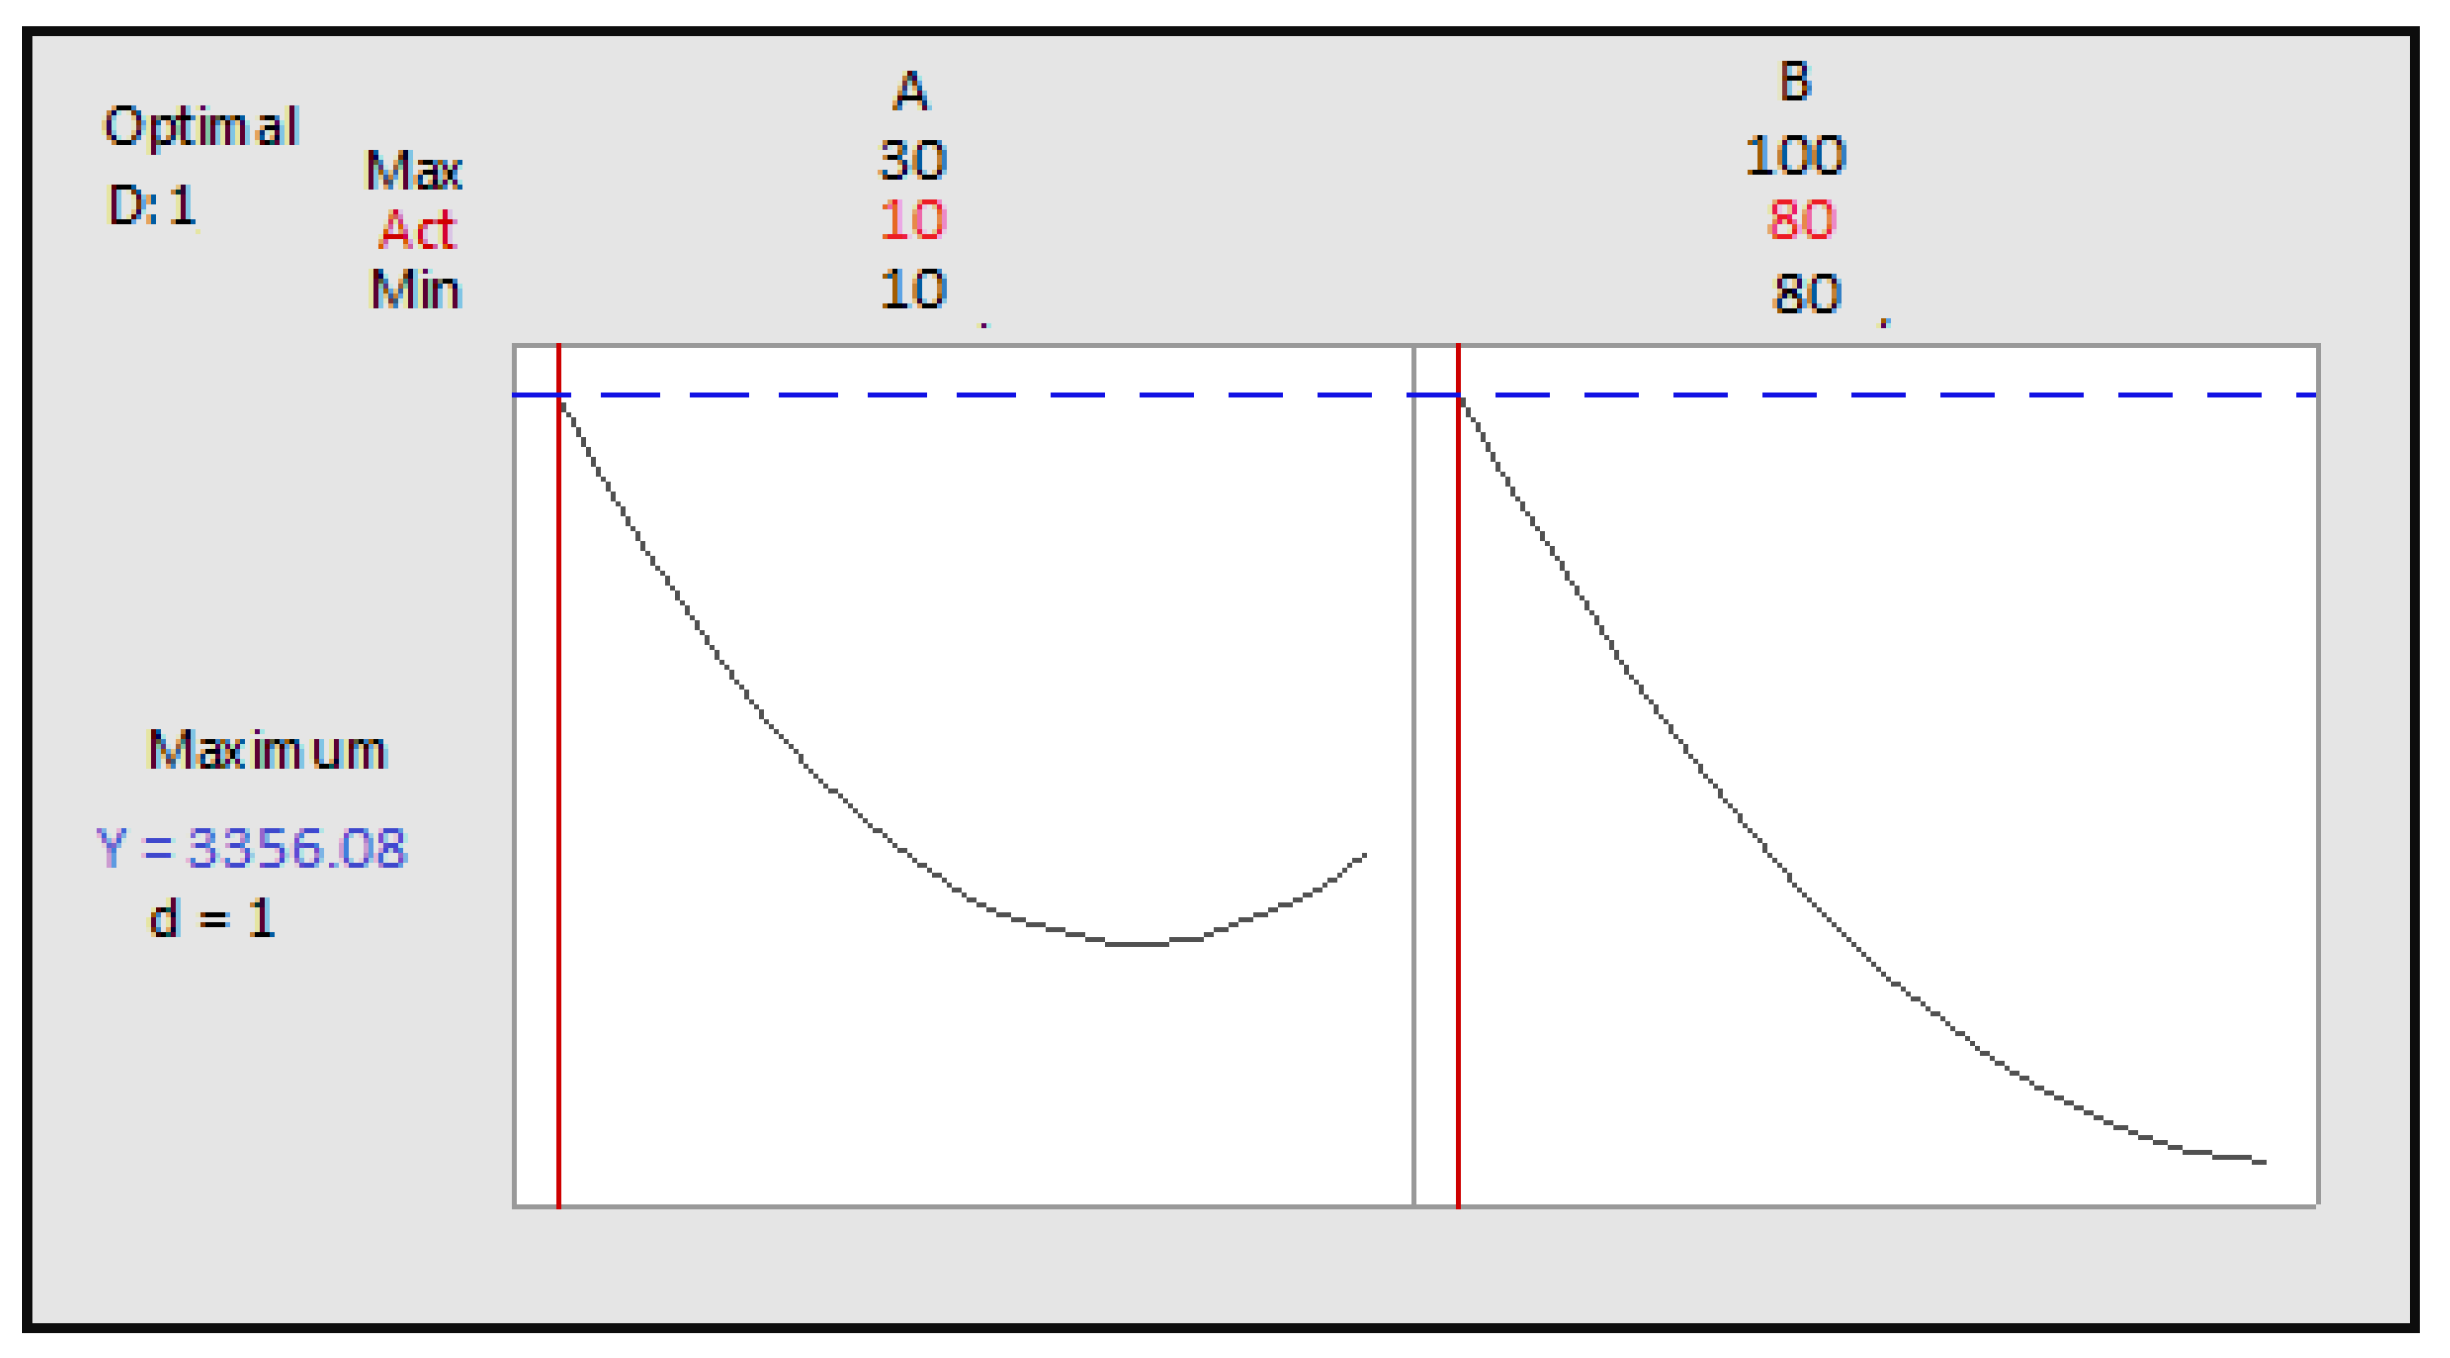
Figure 12.
Optimization of two cooking time and power according to desirability; A: cooking time; B: power.
Figure 12.
Optimization of two cooking time and power according to desirability; A: cooking time; B: power.
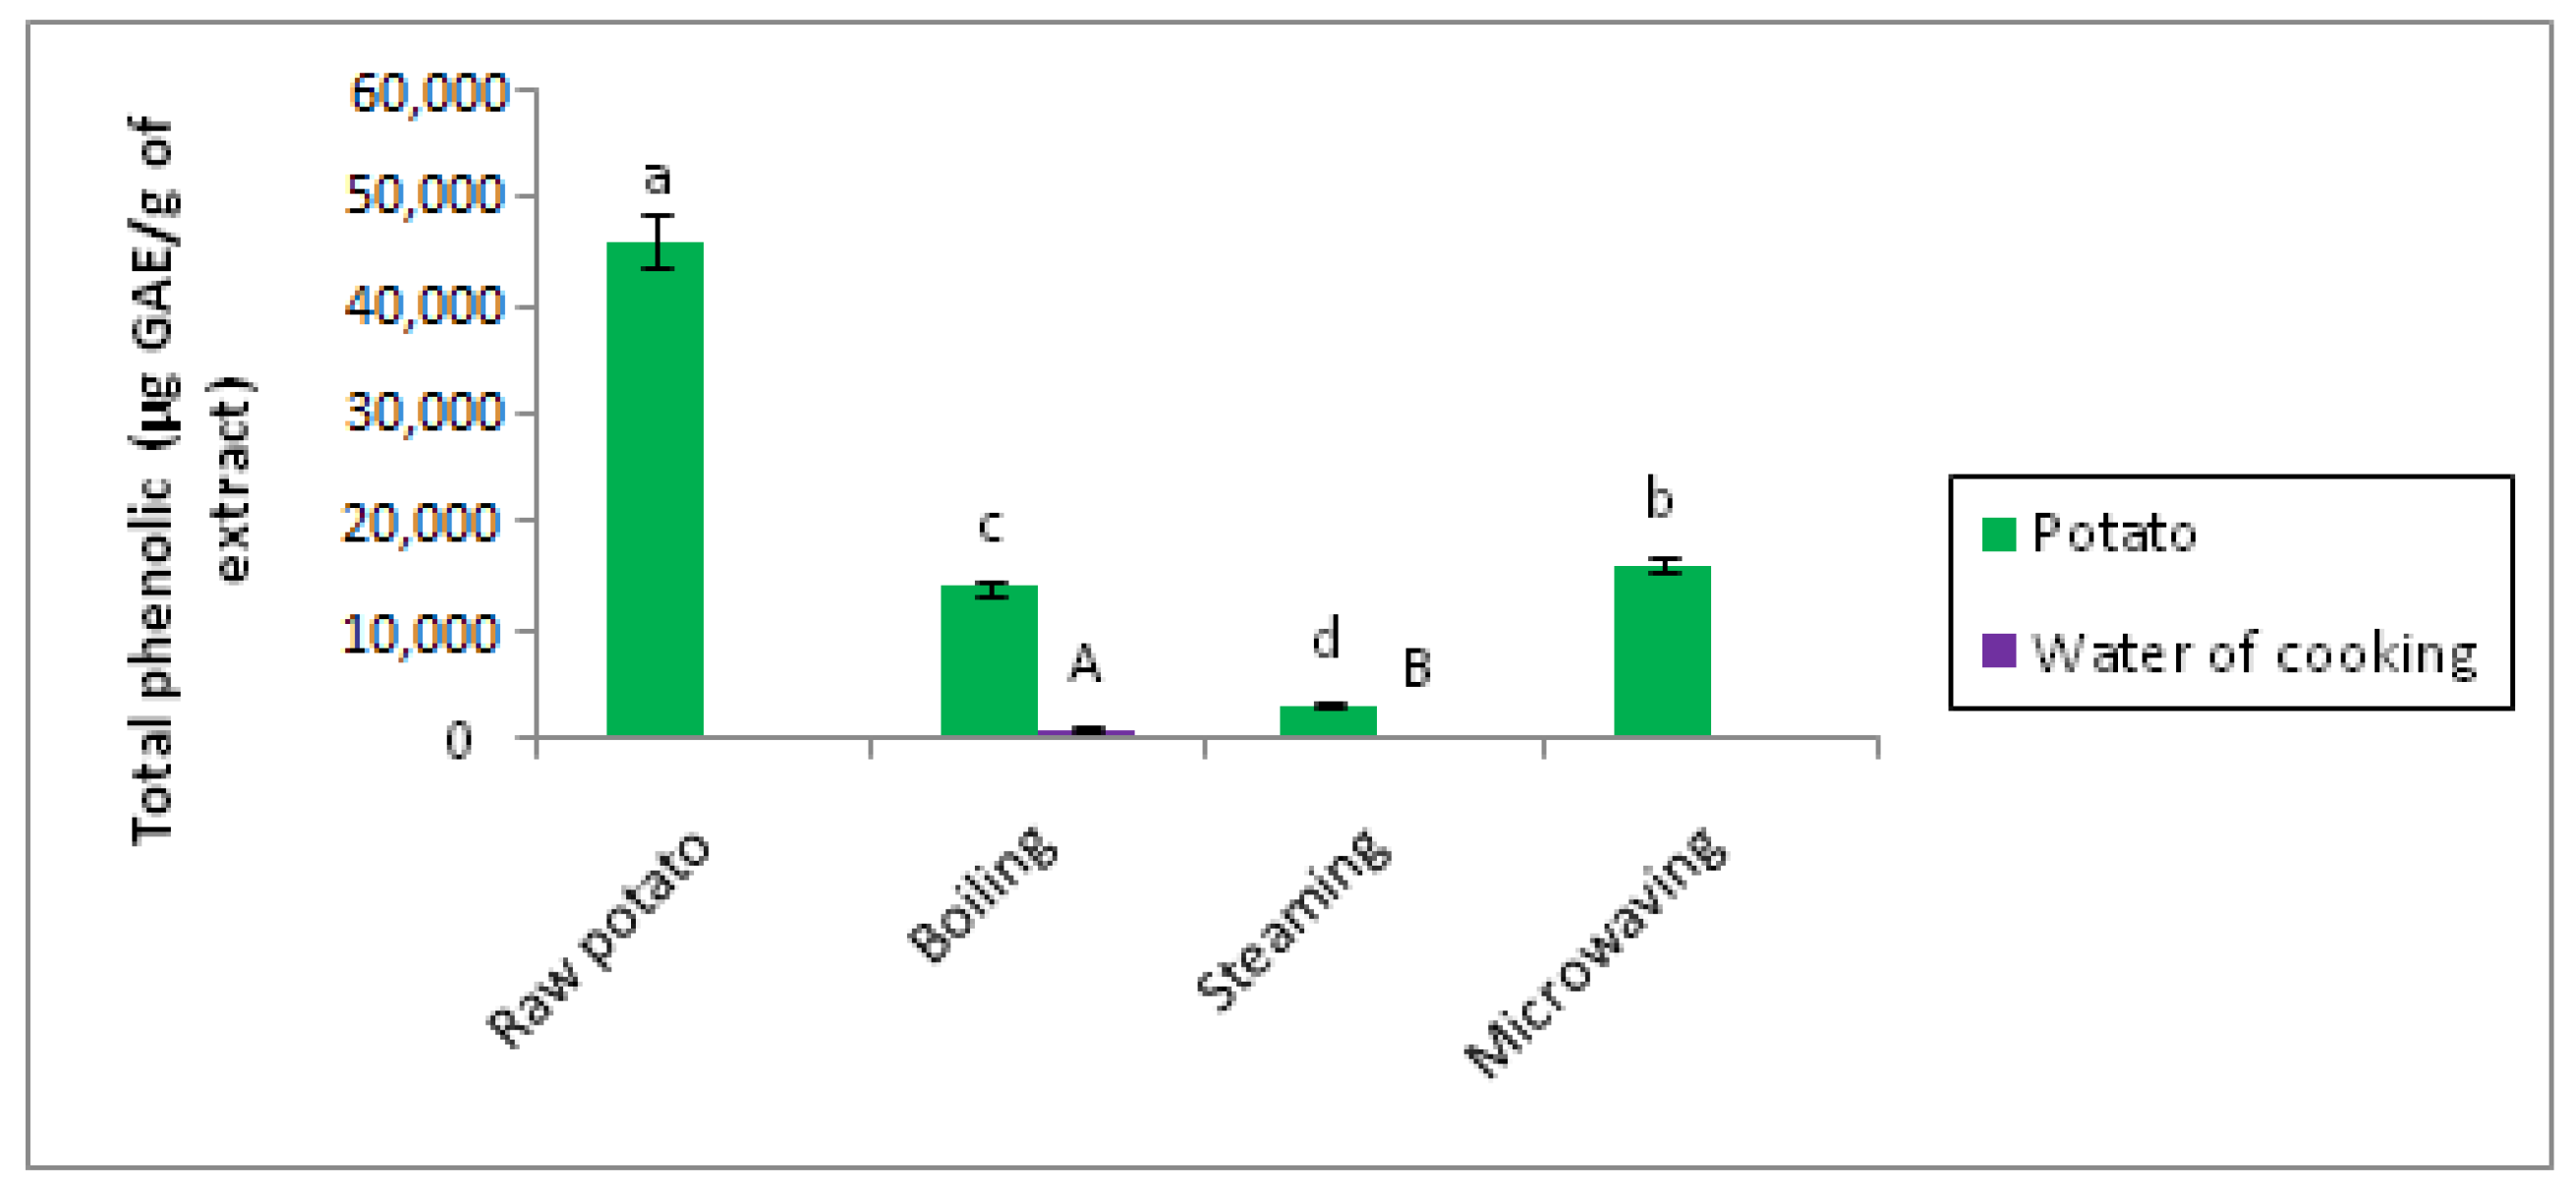
Figure 13.
Effect of cooking on the total polyphenol content of potatoes. The superscript letters a, b, c, d, and e indicate a significant difference between raw and cooked potato at the 0.05 significance level. The superscript letters A, B indicate a significant difference between water of boiling and water of steaming at the 0.05 significance level.
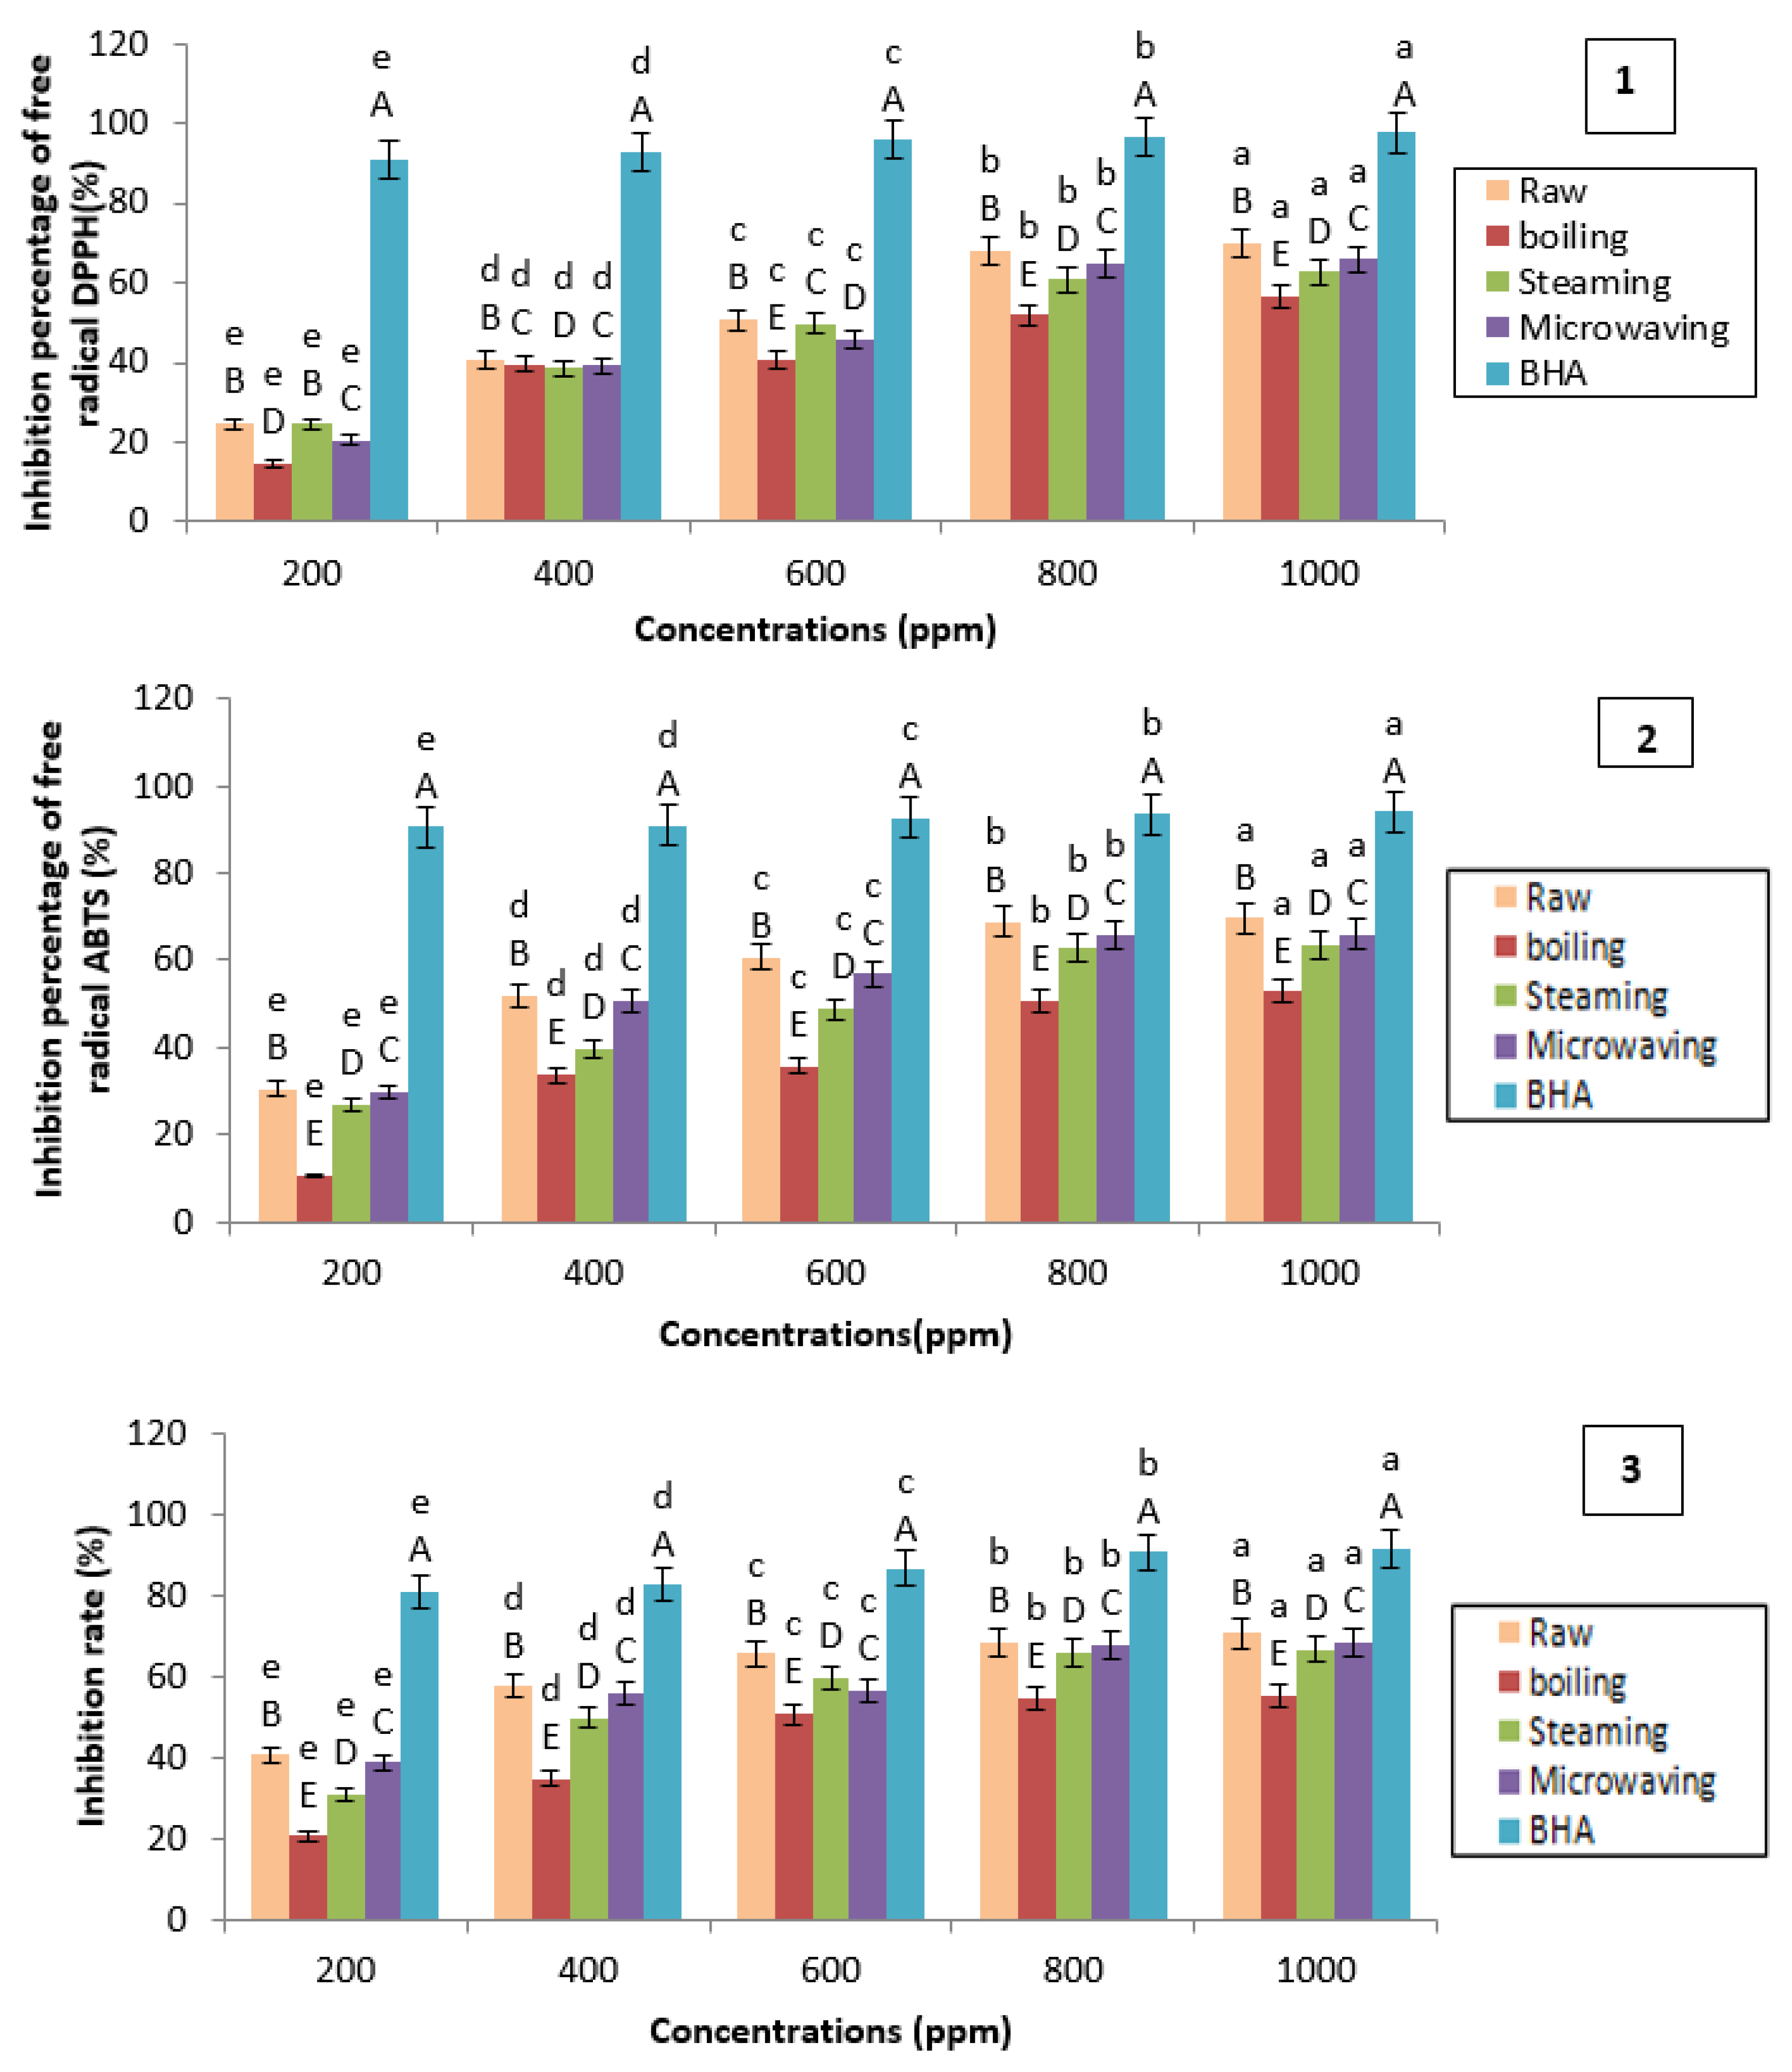
Figure 14.
Evaluation of antioxidant activity: 1: 1,1-diphenyl-2-picryl-hydrazyl (DPPH) method; 2: 2,2′-azino-bis(3-ethylbenzothiazoline-6-sulphonic acid) (ABTS) method; 3: Cupric reducing antioxidant capacity (CUPRAC) method. BHA: Butylated hydroxyanisole. The superscript letters A, B, C, D, and E indicate a significant difference between antioxidant activities of raw and cooked potatoes at the same concentration of extract (ppm) (at the 0.05 significance level. The superscript letters a, b, c, d, and e indicate a significant difference between antioxidant activities of raw and cooked potatoes at different concentrations of extract (ppm) at the 0.05 significance level.
Figure 15.
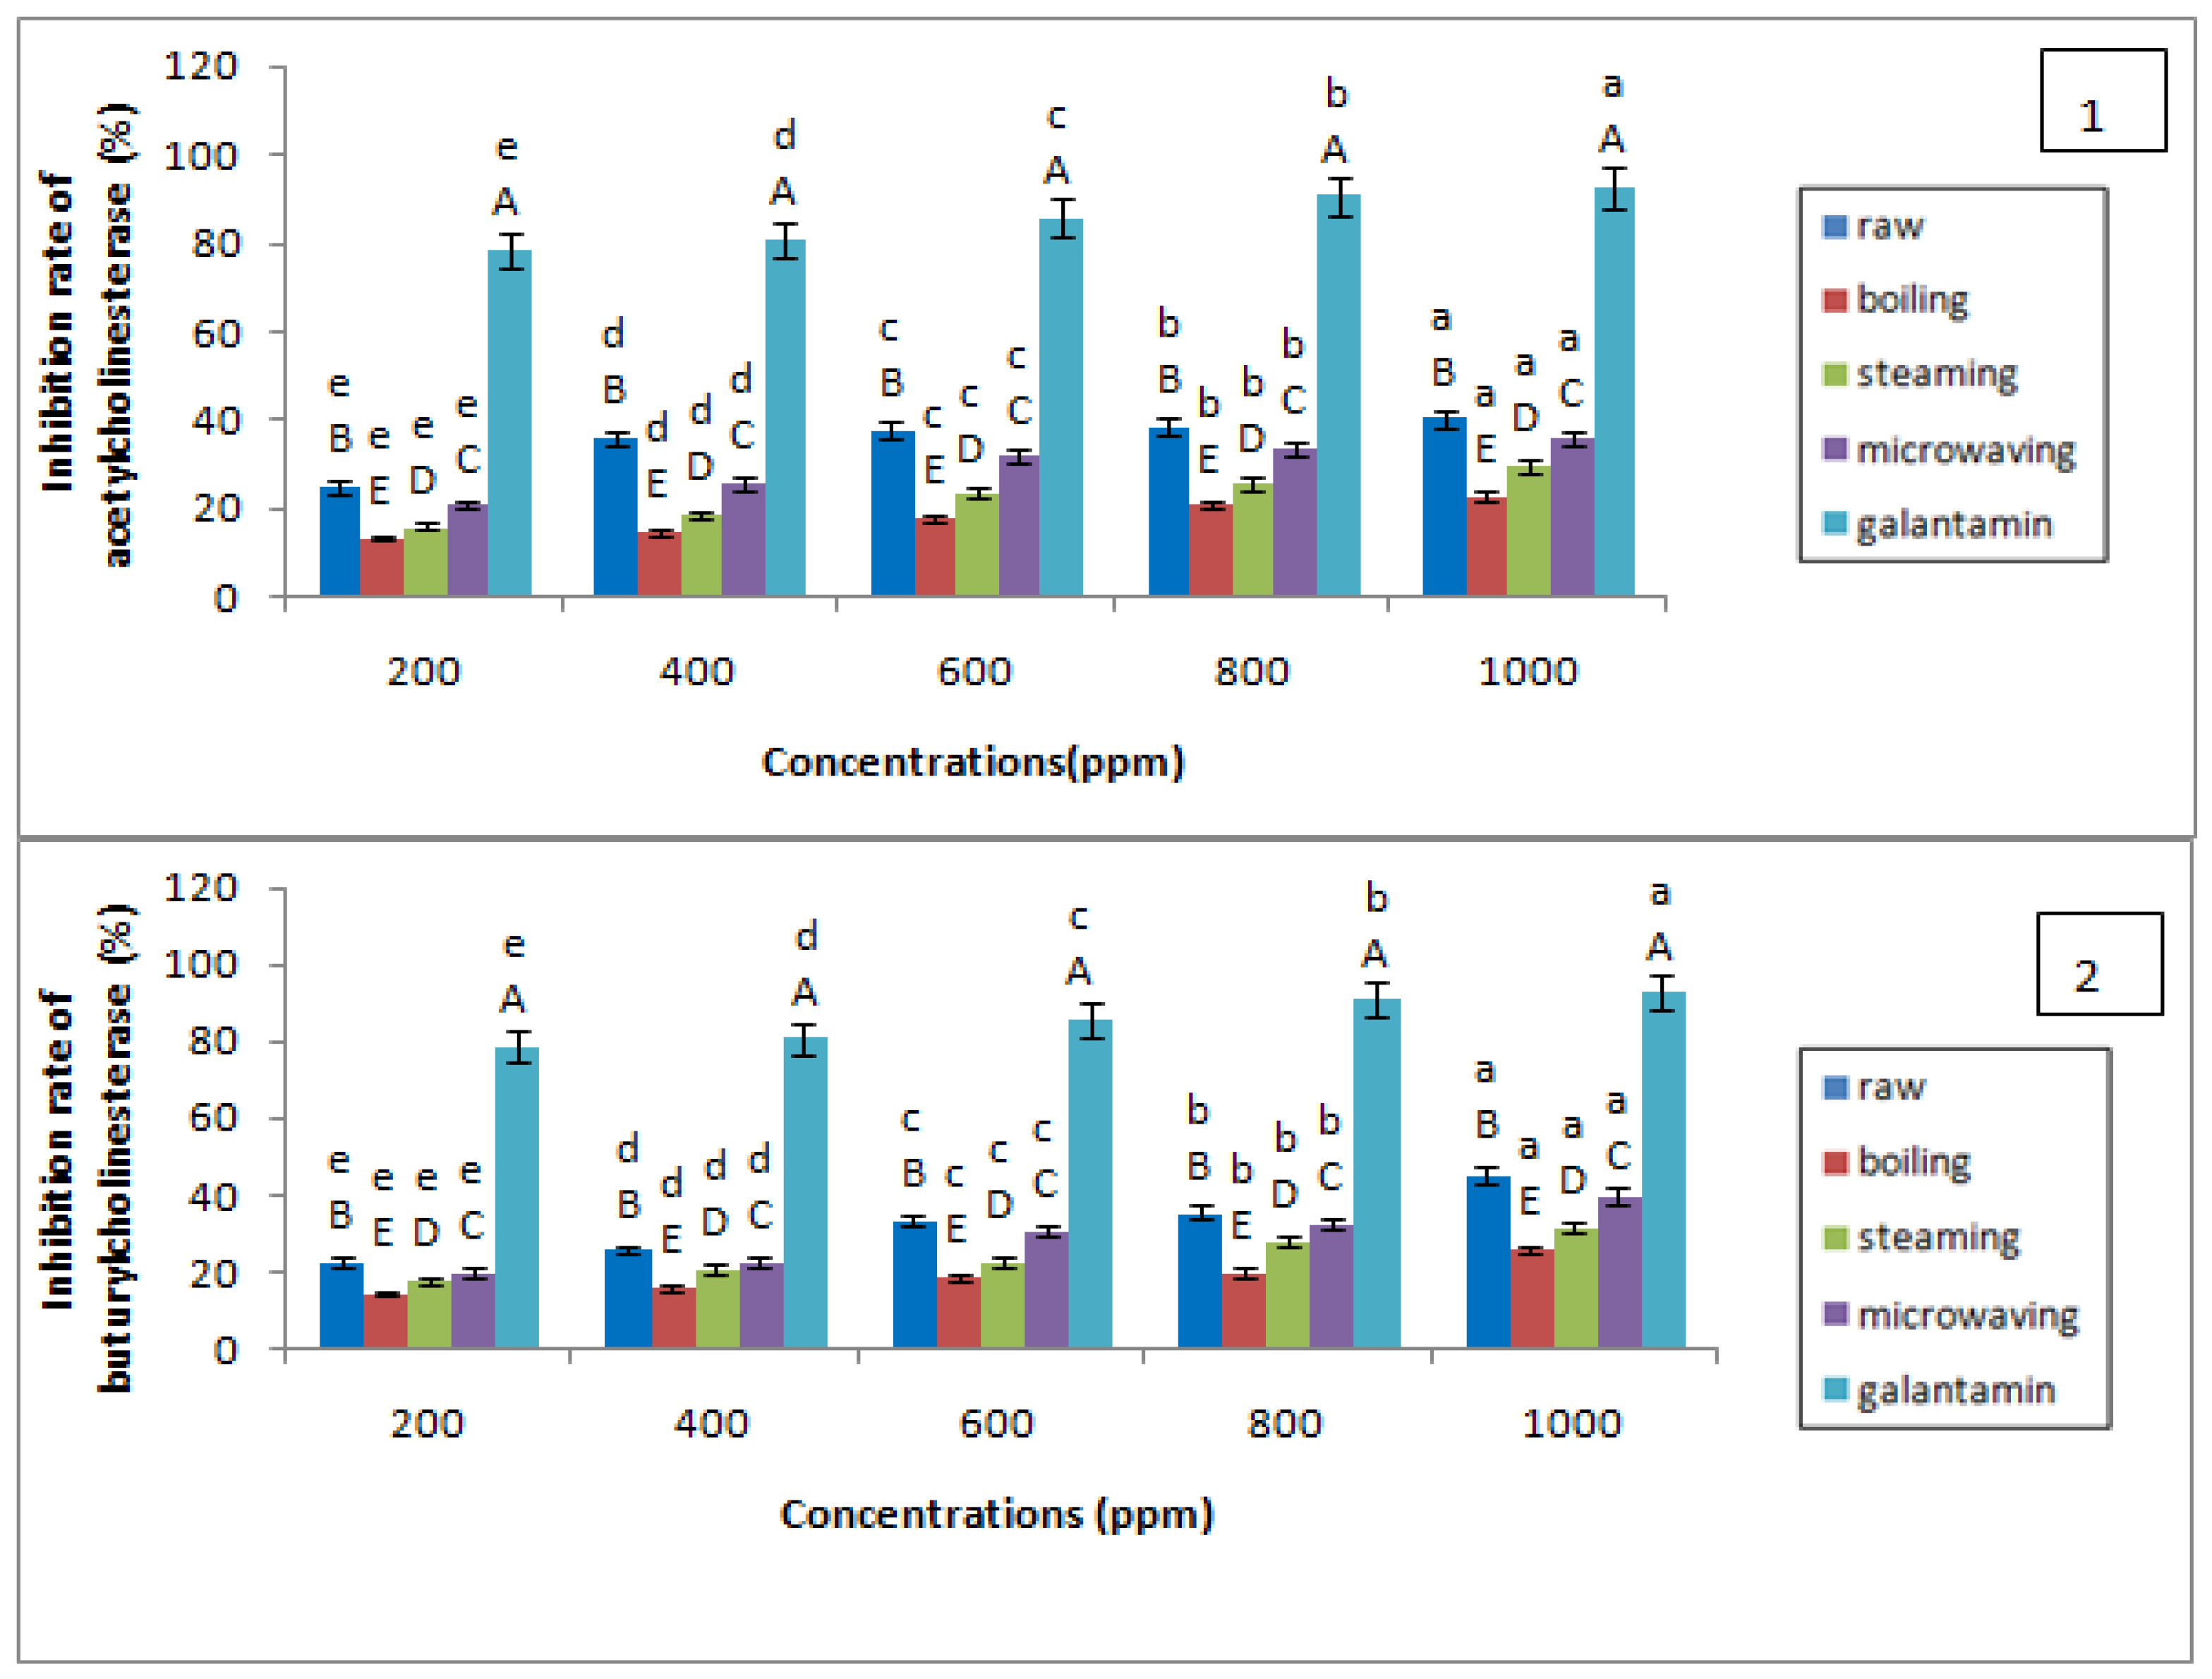
Evaluation of anticholinesterase activity of raw and cooked potato extracts: 1: antiacetylcholinesterase activity; and 2: antibutyrylcholinesterase activity. The superscript letters A, B, C, D, and E indicate a significant difference between anticholinesterase activities of raw and cooked potatoes at the same concentration of extract (ppm) (at the 0.05 significance level. The superscript letters a, b, c, d, and e indicate a significant difference between anticholinesterase activities of raw and cooked potatoes at different concentrations of extract (ppm) at the 0.05 significance level.
Figure 15.
Evaluation of anticholinesterase activity of raw and cooked potato extracts: 1: antiacetylcholinesterase activity; and 2: antibutyrylcholinesterase activity. The superscript letters A, B, C, D, and E indicate a significant difference between anticholinesterase activities of raw and cooked potatoes at the same concentration of extract (ppm) (at the 0.05 significance level. The superscript letters a, b, c, d, and e indicate a significant difference between anticholinesterase activities of raw and cooked potatoes at different concentrations of extract (ppm) at the 0.05 significance level.
Table 1.
Experiment factor levels for each cooking mode.
Table 1.
Experiment factor levels for each cooking mode.
| Factors | Raw Potato | Boiling | Steaming | Microwave |
|---|
| Level −1 | Level +1 | level −1 | level +1 | level −1 | Level +1 | level −1 | Level +1 |
|---|
| Cooking time | _ | _ | 10 min | 30 min | 30 min | 120 min | 10 min | 15 min |
| Power (watt) | _ | _ | _ | _ | _ | _ | 400 | 800 |
| Temperature of cooking | _ | _ | 80 °C | 100 °C | 80 °C | 100 °C | _ | _ |
| Volume of water of cooking | _ | _ | 100 mL | 500 mL | 500 mL | 1000 mL | 10 mL | 50 mL |
| Solvent concentration | 60% | 100% | 60% | 100% | 60% | 100% | 60% | 100% |
| Maceration time | 1 h | 24 h | 1 h | 24 h | 1 h | 24 h | 1 h | 24 h |
| Ultrasonication time | 30 min | 1 h | 30 min | 1 h | 30 min | 1 h | 30 min | 1 h |
| Grinding | No | Yes | No | Yes | No | Yes | No | Yes |
Table 2.
Confirmation results of the model with the measured values and the predicted values of the studied responses.
Table 2.
Confirmation results of the model with the measured values and the predicted values of the studied responses.
| Points | Predicted Polyphenol Content (µg Gallic Acid Equivalent/g of Extract) | Measured Polyphenol Content (µg Gallic Acid Equivalent/g of Extract) |
|---|
| (60 min, 60 min) | 4.667 × 10⁴ a | 4.668 × 10⁴ a |
Table 3.
Confirmation results of the model with the measured values and the predicted values of the studied responses.
Table 3.
Confirmation results of the model with the measured values and the predicted values of the studied responses.
| Points | Predicted Polyphenol Content (µg GAE/g Extract) | Mesured Polyphenol Content (µg GAE/g of Extract) |
|---|
| (30 min, 91,9192 °C) | 1416 × 104 a | 1.415 × 10⁴ a |
Table 4.
Confirmation results of the model with the measured values and the predicted values of the studied responses.
Table 4.
Confirmation results of the model with the measured values and the predicted values of the studied responses.
| Points | Predicted Polyphenol Content (µg GAE/g of Extract) | Mesured Polyphenol Content (µg GAE/g of Extract) |
|---|
| (10 min, 80 °C) | 3356.08 a | 3356.009 a |
Table 5.
Confirmation results of the model with the measured values and the predicted values of the studied responses.
Table 5.
Confirmation results of the model with the measured values and the predicted values of the studied responses.
| Points | Predicted Polyphenol Content (µg GAE/g of Extract) | Measured Polyphenol Content (µg GAE/g of Extract) |
|---|
| (13.23 min, 448.48 Watts) | 16,210 a | 16,208.99 a |
Table 6.
Liquid chromatography tandem-mass spectrometry (LC-MS/MS) analysis.
Table 6.
Liquid chromatography tandem-mass spectrometry (LC-MS/MS) analysis.
| No. | Compound | Ion Parent (m/z) | MS2 (Collision Energy) | Quantification (µg Analyte/g of Extract) |
|---|
| RP | BP | SP | MP | WB | WS |
|---|
| 1 | Acid quinic | 190.95 | 85 (22), 93 (22) | 250.87 | 100.54 | 234.98 | 243.76 | ND | 42.67 |
| 2 | Mallic acid | 133.05 | 115 (14), 71 (17) | 340.67 | 90.65 | 338.76 | 339.76 | ND | 34.76 |
| 3 | Ferrulic Acid | 172.85 | 85 (12),129 (9) | ND | ND | ND | ND | ND | ND |
| 4 | Gallic acid | 169.05 | 125 (14), 79 (25) | ND | ND | ND | ND | ND | ND |
| 5 | Chlorogenicacid | 353 | 191 (17) | 14,500.87 | 4490.76 | 4497.87 | 4498.78 | 67.67 | 56.78 |
| 6 | protocatéchic acid | 152.95 | 109 (16), 108 (26 | 5500.66 | 5499.56 | 5500.21 | 5500.65 | 2500.78 | 49.78 |
| 7 | Tannicacid | 182.95 | 124 (22), 78 (34) | 7032.373 | 7029.65 | 7030.76 | 7031.87 | 3500.78 | 49.98 |
| 8 | Caféic acid | 178.95 | 135 (15), 134 (24), 89 (31) | 20,011.193 | 8907.87 | 9345.78 | 10,000.76 | 4500.78 | 52.78 |
| 9 | Vanillin | 151.05 | 136 (17), 92 (21) | ND | ND | ND | ND | ND | ND |
| 10 | P-coumarique Acid | 162.95 | 119 (15), 93 (31) | 7058.25 | 345.76 | ND | 540.76 | ND | ND |
| 11 | rosmarinic Acid | 358.9 | 161 (17), 133 (42) | 8054.233 | 209.76 | ND | 7098.76 | ND | ND |
| 12 | Hesperidin | 611.1 | 303,465 | ND | ND | ND | ND | ND | ND |
| 13 | Rutin | 609.1 | 300 (37), 271 (51), 301 (38) | ND | ND | ND | ND | ND | ND |
| 14 | Hyperoside | 463.1 | 300, 301 | ND | ND | ND | ND | ND | ND |
| 15 | 4-OH benzoïc acid | 136.95 | 93, 65 | ND | ND | ND | ND | ND | 60.43 |
| 16 | Salicylic acid | 136.95 | 93, 65, 75 | ND | ND | ND | ND | ND | ND |
| 17 | Myricetin | 317 | 179, 151, 137 | 4657.87 | 367.76 | 4569.76 | 456.78 | ND | ND |
| 18 | Coumarin | 146.95 | 103, 91, 77 | 5098.76 | 567.78 | 5089.54 | 5088.76 | ND | ND |
| 19 | Kaempferol | 264.95 | 217, 133, 151 | 119.76 | 89.76 | 99.76 | 99.45 | ND | ND |
| 20 | Quercetin | 300.9 | 179, 151, 121 | ND | ND | ND | ND | ND | 56.87 |
| 21 | Hesperetin | 300.95 | 164, 136, 108 | ND | ND | ND | ND | ND | ND |
| 22 | Naringinin | 270.95 | 151, 119, 107 | 218 .123 | 217.99 | 218.06 | 218.16 | ND | ND |
| 23 | Luteoléin | 284.95 | 175, 151, 133 | 225.980 | 224.76 | 225 | 112.78 | ND | ND |
| 24 | Fisetin | 284.95 | 135, 121 | ND | ND | ND | ND | ND | ND |
| 25 | Apigenin | 268.95 | 151, 117 | 9452.76 | 450.76 | 9065.78 | 5687.78 | ND | ND |
| 26 | Rhamnetin | 314.95 | 165, 121, 300 | 8564.78 | 345.99 | 567.98 | 789.87 | ND | ND |
| 27 | Chrysin | 253 | 143, 119, 107 | 5456.65 | 234.78 | 709.78 | 4987.76 | ND | ND |
Table 7.
Half-maximal inhibitory concentration IC50 values.
Table 7.
Half-maximal inhibitory concentration IC50 values.
| Extracts of Potato | DPPH | ABTS | CUPRAC |
|---|
| Raw | 586.65 ± 0.76 d | 380.67 ± 0.23 d | 300.87 ± 0.26 d |
| Boiling | 703.54 ± 0.56 a | 686.76 ± 0.49 a | 592.78 ± 0.74 a |
| Steaming | 620.76 ± 0.89 b | 610.76 ± 0.67 b | 410 ± 0.25 b |
| Microwaving | 609.8 ± 0.23 c | 395.65 ± 0.98 c | 330.65 ± 0.14 c |
| BHA | 85.13 ± 0.45 e | 86.56 ± 0.34 e | 96.5 ± 0.09 e |
Table 8.
Half-maximal inhibitory concentration (IC50) values for anticholinesterase activity.
Table 8.
Half-maximal inhibitory concentration (IC50) values for anticholinesterase activity.
| Extracts of Potato | Antiacetylcholinesterase Activity | Antibuturylcholinesterase Activity |
|---|
| Raw | 1105.29 ± 0.24 d | 1087.84 ± 0.54 d |
| Boiling | 2471.27 ± 0.67 a | 2129.42 ± 0.21 a |
| Steaming | 1967.72 ± 0.98 b | 1611.22 ± 0.18 b |
| Microwaving | 1363.6 ± 0.56 c | 1234.68 ± 0.54 c |
| Galantamin | 84.23 ± 0.21 e | 86.56 ± 0.08 e |


