Article

Metals and Metalloid Concentrations in Fish, Its Spatial Distribution in PPC, Philippines and the Attributable Risks

by
Delia B. Senoro
1,2,3,*,
Maria Mojena G. Plasus
4,
Alejandro Felipe B. Gorospe
2,
Ronnel C. Nolos
3,5,
Allaine T. Baaco
4,6 and
Chitsan Lin
7
1
School of Civil, Environmental and Geological Engineering, Mapua University, Manila 1002, Philippines
2
Resiliency and Sustainable Development Laboratory, Yuchengco Innovation Center, Mapua University, Manila 1002, Philippines
3
Mapua-MSC Joint Research Laboratory, Marinduque State College, Boac 4900, Philippines
4
College of Fisheries and Aquatic Sciences, Abba Building, Western Philippines University, San Juan 5300, Philippines
5
College of Environmental Studies, Marinduque State College, Boac 4900, Philippines
6
College of Agriculture, Forestry and Environmental Sciences, Western Philippines University, San Juan 5302, Philippines
7
Department of Marine Environmental Engineering, National Kaohsiung University of Science and Technology, Kaohsiung 81157, Taiwan
*
Author to whom correspondence should be addressed.
Toxics 2023, 11(7), 621; https://doi.org/10.3390/toxics11070621
Submission received: 17 June 2023 / Revised: 7 July 2023 / Accepted: 10 July 2023 / Published: 18 July 2023

Abstract

:
Fish is an important source of protein in human meals around the world. However, the fish that we are eating may be contaminated with toxicants such as metals and metalloids (MMs), which may pose health risks to consumers. Information on MMs content in fishes and their potential spatial distribution scenarios would provide knowledge to the community to create strategies and protect human health. Hence, this study assessed and determined the health risk levels of MMs in both brackish and marine water fish (BMF) in Puerto Princesa City (PPC), Palawan Province, Philippines. PPC has an existing abandoned open mine pit near the PPC coastline called the “pit lake”. The concentrations of As, Ba, Cu, Fe, Mn, Hg, and Zn in fishes were analyzed using portable Olympus Vanta X-ray Fluorescence (pXRF), and the spatial distribution of MMs concentrations in BMF was analyzed using a GIS (geographic information system). Fishes were sampled from fishing boat landing sites and nearby seafood markets. The results revealed that the concentration of MMs in marine fish was generally higher than the brackish water fish. It was recorded that the Hg concentration in marine water fish meat was higher than in brackish water fish meat. The Mn concentration in marine water fish exceeded the permissible limits set by international bodies. An elevated concentration of Mn in BMF was detected across the northern part of PPC, and an elevated concentration of Hg in marine fishes was recorded in the southeast area, where the fish landing sites are located. Ba was also detected in BMF across the southern part of PPC. Moreover, an elevated concentration of Cu was detected in MBF in the northeast and in marine fish in the southeastern area of PPC. Further, this paper elaborates the non-carcinogenic and carcinogenic risks of these fishes to the PPC population and tourists with respect to the MMs content in fish meat.

1. Introduction

Fish contains high-quality proteins, polyunsaturated fatty acids, vitamins, and minerals and is an essential source of healthy food throughout the world [1,2]. Recently, however, growing pollution and toxic contamination have caused a decline in the catch and consumption of fish both from the marine and freshwater ecosystems [3,4].
Heavy metals can usually be found in really low concentrations and are essential components of the aquatic environment [5]. However, heavy metals can be accumulated in the body of fish and other aquatic organisms through ingestion or by passing through semi-permeable membranes [6,7,8,9], such as fish skin. The consumption of fish contaminated with toxic metals shows several adverse effects [2,10]. Many factors such as size, sex, reproductive cycle, feeding habits, and swimming patterns are affected by the quality of living environment and have a role in the bioaccumulation of metals in fish [11,12]. Metals such as copper (Cu) and zinc (Zn) are essential for fish metabolism, while others such as mercury (Hg), cadmium (Cd), and lead (Pb) have no known role in biological systems [13,14]. Consumption of fish both from marine and freshwater environments contaminated with metals can cause health problems such as impaired renal and liver function, decreased cognitive function, impaired reproductive capacity, hypertension, neurological changes, and cancers [15,16,17,18].
Puerto Princesa City (PPC) is the capital city of Palawan Province in the Philippines. It is an island that has beautiful scenery, stunning islets, and is known for its clean and natural environment [19]. PPC is one of the tourist capitals of the Philippines and the main supplier of marine fish [20]. Based on the tourism office report, 1,170,083 people visited PPC in 2019, but this was reduced to 156,501 people in 2020 due to the pandemic [21]. Local fisherfolk in the Philippines often choose to directly sell fish, particularly grouper, to restaurant owners and/or tourists instead of to middlemen to deliver fresh fish, maximize their profit, and directly serve tourists [22]. Thus, it is important to monitor the fish quality being consumed by tourists and the local population, as PPC is known for its fresh marine fishes.
PPC as a tourism city has been challenged by industrialization. The presence of mining sites within and outside the city has been helpful to the local economy; however, environmental quality control and monitoring have become a challenge due to the lack of qualified laboratories, competent personnel, and funding. At present, based on a report by the Local Disaster Risk Reduction and Management Office of PPC, there are at least ten complex hazards in PPC related to heavy metals. These hazards include Hg contamination, water resource contamination, and chemical poisoning [20].
One of the mining companies operated Hg mining activities in Barangay Tagburos, PPC, from 1953 to 1976 through an open pit mining technique. This is a coastal barangay of Honda Bay in PPC. The Hg open mining site was abandoned after its operation in 1976. Currently, the abandoned Hg open mining pit still exists, which the local population calls “pit lake”. Remediation has been recommended by the government because of its possible adverse effect on the health of the people surrounding the abandoned open mine pit; however, the necessary remediation remains a recommendation document as of the writing of this scientific paper. One of the fishing grounds of Honda Bay has a designated fishing port (fishing boat landing site) and fish market near Brgy. Tagburos, where high mercury contamination has been observed [20,23,24]. Further, the effluents from the city pass near PPC Bay, which is also near the culture site for milkfish and other cage-farmed fish commodities [20]. This scenario calls for a comprehensive assessment of the marine water and fish meat quality.
The PPC Local Government is implementing a water quality monitoring system particularly to monitor algal bloom. However, attention has not been given to the monitoring of metal and metalloid (MMs) concentrations in the water and the fish being consumed by the PPC population and its tourists. In addition, no studies have been published on the bioaccumulation of MMs in brackish water and marine fish specific to PPC. Hence, an assessment of the brackish and marine fish meat quality was carried out to assist the PPC local government to create monitoring strategies and appropriate interventions to protect the health of its constituents, tourists, and its local economy.

2. Materials and Methods

2.1. Study Site and Sampling Locations

The study was conducted in PPC, the capital city of Palawan Province, Philippines. PPC is located at 9°30′ N and 118°30′ E, with a population of 1.2 million, has 66 barangays, and is internationally known for its natural resources such as underground rivers, beautiful beaches, and delicious seafood.
The province has a Type III climate characterized by a short dry season and sporadic rainfall months. The dry season typically lasts from January to April, while the rest of the year experiences the rainy season, with September being the wettest month [25]. The annual precipitation is 1314 mm, and the rainy season records a monthly average precipitation of 185 mm [26], describing runoff events that potentially carry contaminants from a higher to a lower elevation.

2.2. Collection, Processing, and Detection of Metals and Metalloids (MMs) in Fish Samples

Fish samples were bought from the fishing boat landing sites and small markets, locally known as “talipapa”, of PPC towards the end of the rainy season. These fishing boat landing sites are for local trade. Twenty-nine sampling sites were recorded in various barangays of PPC, as shown in Table A1 and Figure 1. Five fish species were collected such as Epinephelus coioides, Epinephelus sp, Cephalopholis sp. (locally known as Lapua-Lapu, English name is grouper), Rastrilliger kanagurta (locally known as buraw), and Chanos (locally known as bangus, English name milkfish). These are the common fish types consumed by local residents. The fish samples collected from 29 sites, addressing a 95% level of confidence, comprised nine brackish water fish (Chanos chanos) and twenty marine fish (Lujanus sp., Epinephelus coioides, Epinephelus sp., Cephalopholis sp., and Rastrilliger kanagurta). The Lujanus sp., Epinephelus sp., and Cephalopholis sp. fishes are coral reef carnivore marine fishes; while Rastrelliger sp. is a pelagic marine water fish; Chanos fish thrive in both marine and brackish water. Carnivore fishes get most of their energy from a meat-based diet that could possibly mean eating some smaller fishes. Pelagic fishes live in water columns of the open seas, oceans, or lakes. Both Chanos and Lujanus sp. are omnivore fish. The Chanos fish samples in this study were collected from brackish water. The omnivore fish needs both meat- and plant-based for their food.
The EPA 823-B-00–007 protocol [27] was followed in handling and storing of the fish samples. The fish samples were washed with deionized water and placed in resealable plastic, labelled, arranged in a clean cooler, and brought to the laboratory for organization and MMs (Olympus Corporation of the Americas, Westborough, MA, USA) detection and analysis. No other complex preparation or pre-treatment is required. A portable Olympus Vanta portable X-ray Fluorescence (pXRF), (Olympus Corporation of the Americas, Westborough, MA, USA) analyzer was used for the detection and analysis of MMs in the fish samples. Hence, all fish samples were organized and analyzed within 24 h after actual collection. The calibration of the pXRF was carried out with the aid of the manufacturer before its use. The pXRF was calibrated using the Olympus Vanta blank in #2 zipper plastic bags, the Olympus Vanta XRF standard reference materials [28], and set to Geochem prior to the analysis of the fish samples [29,30]. The Olympus Vanta XRF is a handheld metal analyzer that provides rapid, accurate multi-elemental analysis and alloy identification, even during fieldwork. The limit of detection (LOD) for As, Ba, Cu, Fe, Mn, Hg, and Zn is 1, 5, 2, 12, 5, 1, and 1, respectively. The declared MMs concentration is the net concentration, i.e., after the background concentration of MMs was deducted.

2.3. Health Risk Assessment of MMs in Fish Samples from PPC

2.3.1. Chronic Daily Intake

The chronic daily intake (CDI) of MMs through consuming brackish water and marine fish was calculated using Equation (1) [9].
C D I = C i × E f × E d × I R × C f B W × A T × 10 3
where Ci is the concentration of MMs in the fish samples (mg kg−1); Ef is the exposure frequency (365 days y−1) [9]; Ed is the exposure duration (69.39 years) [9]; IR is the ingestion rate of brackish water fish (7.23 g person−1 day−1) [31] and marine fish (11.62 g person−1 day−1) [31]; Cf is the conversion factor (0.208) [9]; BW is the average body weight (60 kg) [9]; and AT is the averaging time ( E f × E d ).

2.3.2. Non-Carcinogenic Risk

The target hazard quotient (THQ) estimation approach used in the study provided estimates of the degree of non-carcinogenic health risk brought on by exposure to MMs in the fish [32]. The risks for the consumption of BMF were assessed based on Equation (2) [33]. As a general rule, when the THQ value is less than 1, it means the toxic effects of the specific MMs mentioned above are unlikely to occur. If the THQ is equal or greater than 1, it means there is a possible carcinogenic risk to the population. Therefore, appropriate intervention/s and protective measure/s should be made [32].
T H Q = C D I R f D
where RfD is the reference dose for the MMs (mg kg−1 day−1), as shown in Table 1. Moreover, the total target hazard quotient (TTHQ) was calculated following Equation (3) [34,35]. Summarizing THQs across MMs can act as a cautious assessment method to estimate high-end health risks rather than low-end risks. This is to safeguard the public from the potential adverse health consequences posed by several MMs [36].
T T H Q = T H Q A S + T H Q B a + T H Q C u + T H Q F e + T H Q M n + T H Q H g + T H Q Z n
It is inferred that the larger the value of TTHQ, the higher the probability of carcinogenic risk or health risks of toxic concerns [37].
Table 1. Reference dose (RfD) and slope factor (SF) of MMs.
MMsRfD (mg kg−1 day−1)SF (mg kg−1 day−1)Reference
As0.00231.5[38,39]
Ba0.2-[39]
Cu0.037-[40]
Fe0.7-[41]
Mn0.14-[40]
Hg0.00016-[36]
Zn0.3-[40]

2.3.3. Carcinogenic Risk

The lifelong risk of developing cancer as a result of exposure to a carcinogen(s) is known as carcinogenic risk (CR) [42]. Among the studied MMs in brackish water and marine fish, only As is categorized as a carcinogen by the International Agency for Research on Cancer (IARC) [43]. The CR was calculated following Equation (4) [42].
C R = C D I × S F
where CDI is the chronic daily intake of MMs (mg kg−1 day−1 ) and SF is the slope factor (mg kg−1 day−1 ), as shown in Table 1 [38]. Cancer risk is categorized as negligible if CR < 1 × 10⁻⁶; acceptable if CR is within 1 × 10⁻⁶–1 × 10⁻⁴; high if CR is within 1 × 10⁻³–1 × 10⁻¹; and very high if CR > 1 × 10⁻¹ [44].

2.3.4. Maximum Allowable Fish Consumption Rates

The maximum allowable fish consumption rates (CRlim) (g person−1 day−1) for both the non-carcinogenic and carcinogenic risks of MMs in brackish water and marine fish were calculated [45]. The CRlim for the non-carcinogenic and carcinogenic health risks of consuming fish contaminated with MMs are shown in Equations (5) and (6), respectively [46].
CR l i m = R f D × B W C i
where RfD is the reference dose of MMs (mg kg−1 day−1), as shown in Table 1; BW is the average body weight for adults (60 kg) [9]; and Ci is the concentration of MMs in fish (mg kg−1).
C R l i m = A R L × B W C i × S F
where ARL is the acceptable lifetime risk level ( 1 × 10 −5) [46] and SF is the slope factor (mg kg−1 day−1), as shown in Table 1. Just like in the CR calculation, only the As in fish was calculated using Equation 6 as it is the only identified carcinogen [43]. Generally, when the CRlim exceeds the determined average daily consumption of fish [31], the food does not present non-carcinogenic and carcinogenic health concerns.

2.4. Statistical Analysis

The descriptive statistics of the mean concentration of MMs in brackish water and marine fish were calculated using Excel software version 16.0.5332.1000 (Redmond, WA, USA). A Pearson rank correlation matrix coupled with a correlogram was also calculated using RStudio version 1.4.1106. Additionally, IBM SPSS Statistics version 23.0.0.0 was used in performing the Kruskal–Wallis test and hierarchical cluster analysis (HCA) to identify significant differences and homogenous clusters across the MMs in brackish water and marine fish [47,48]. In order to evaluate how cohesive, the clusters generated were, a dendrogram was also created, in which correlations between the various components are clearly visible [49].

2.5. Spatial Distribution Maps of MMs in PPC

The spatial distribution of MMs in the brackish water and marine fish of PPC was mapped using the Geographic Information System (GIS), ArcGIS Desktop 10.8.1 ArcPro2.8 [50].

The Inverse Distance Weighting

Raster data for the spatial distribution of MMs concentration was derived from the Inverse Distance Weighting (IDW) method of spatial interpolation using the IDW tool in ArcGIS Desktop. The collected sample points for fishes in the study area were used as the input in the IDW tool to generate raster data that showed the spatial distribution of MMs concentrations in fishes within the study area.
The IDW technique is a deterministic type of spatial interpolation that assumes objects closer to one another, i.e., within a certain radius, are more similar than those objects that are further apart [51]. Weights assigned to sample points are heavier or higher when they are closer to an estimated value point. This is raised to a specific power or exponent [52], shown as Equation (7).
Z j ^ = i z i d i n j i 1 d i n j
where Z j ^ is the estimated value of unsampled point j, Zi is the value of sample point i, dij is the distance from point i to j, and n is the weight parameter applied as an exponent to distance dij. This implies that the larger the value of n, the greater influence has the sampled point i compared to the unsampled point j [53].

3. Results

3.1. Heavy Metals and Metalloids in Fish of PPC

The Olympus Vanta XRF is a rapid multi-element and alloy analyzer. It only requires washing of the fish, placing it inside the resealable plastic, and proper labelling. Hence, it detects various metals and alloys within its limit of detection simultaneously. Results of metals analysis by XRF showed no concentration of Cd, Ni, and Pb detected. However, it recorded the presence of Ba, Cu, Fe, Hg, and Zn. The range of concentrations of these various MMs in fish and its comparison to the permissible limit [9,54,55,56] is presented in Table 2. It is shown in the Table that, in general, except for Zn and Ba, the MMs concentration in marine fish was higher than the brackish water fish. The highest MMs concentration in brackish water fish was Zn at 14.118 mg kg−1, while in marine water fish was Fe at 11.630 mg kg−1. It was recorded that Mn in both marine and brackish water fish exceeded the permissible limits. Additionally, the concentration of Hg in marine fish was almost near the permissible limit set by the European Commission (EC) [54]. Other MMs in BMF, such as Ba, Cu, Fe, and Zn, did not exceed the permissible limits set by FAO/WHO. All the As and Hg concentration in brackish water fish was below the limit of detection (LOD). The trend of MMs concentrations in brackish water fish and marine water fish were in the following order: Zn > Fe > Mn > Cu > Ba > Hg > As and Fe > Zn > Cu > Mn > Ba > Hg > As, respectively. The results of the Kruskal–Wallis test showed that the MMs across BMFs originated from the same distribution due to its record of 5% significant differences (Table A2).

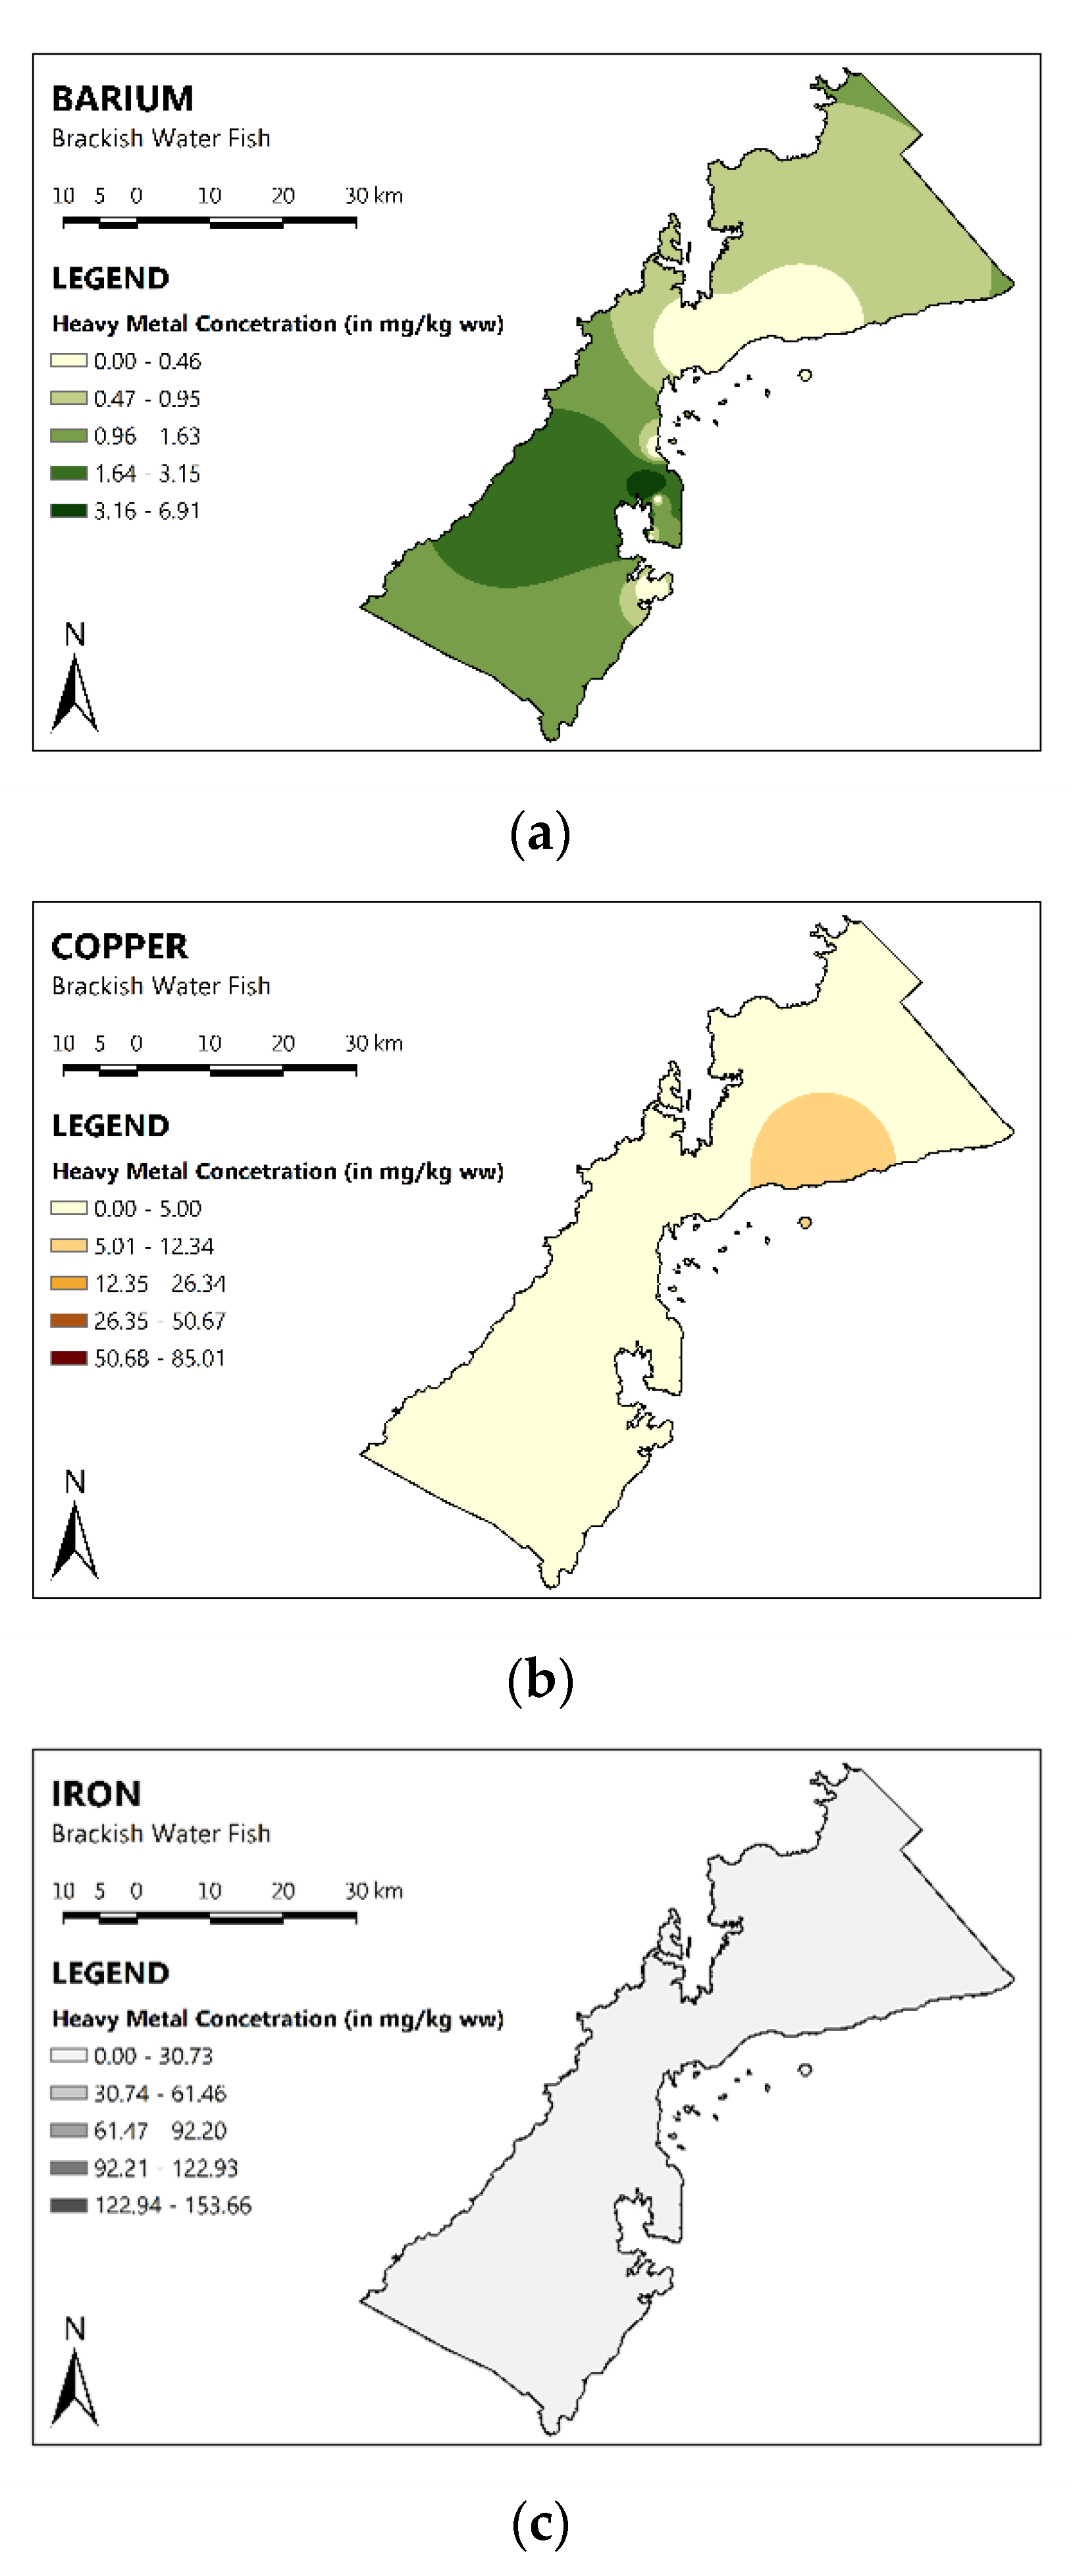
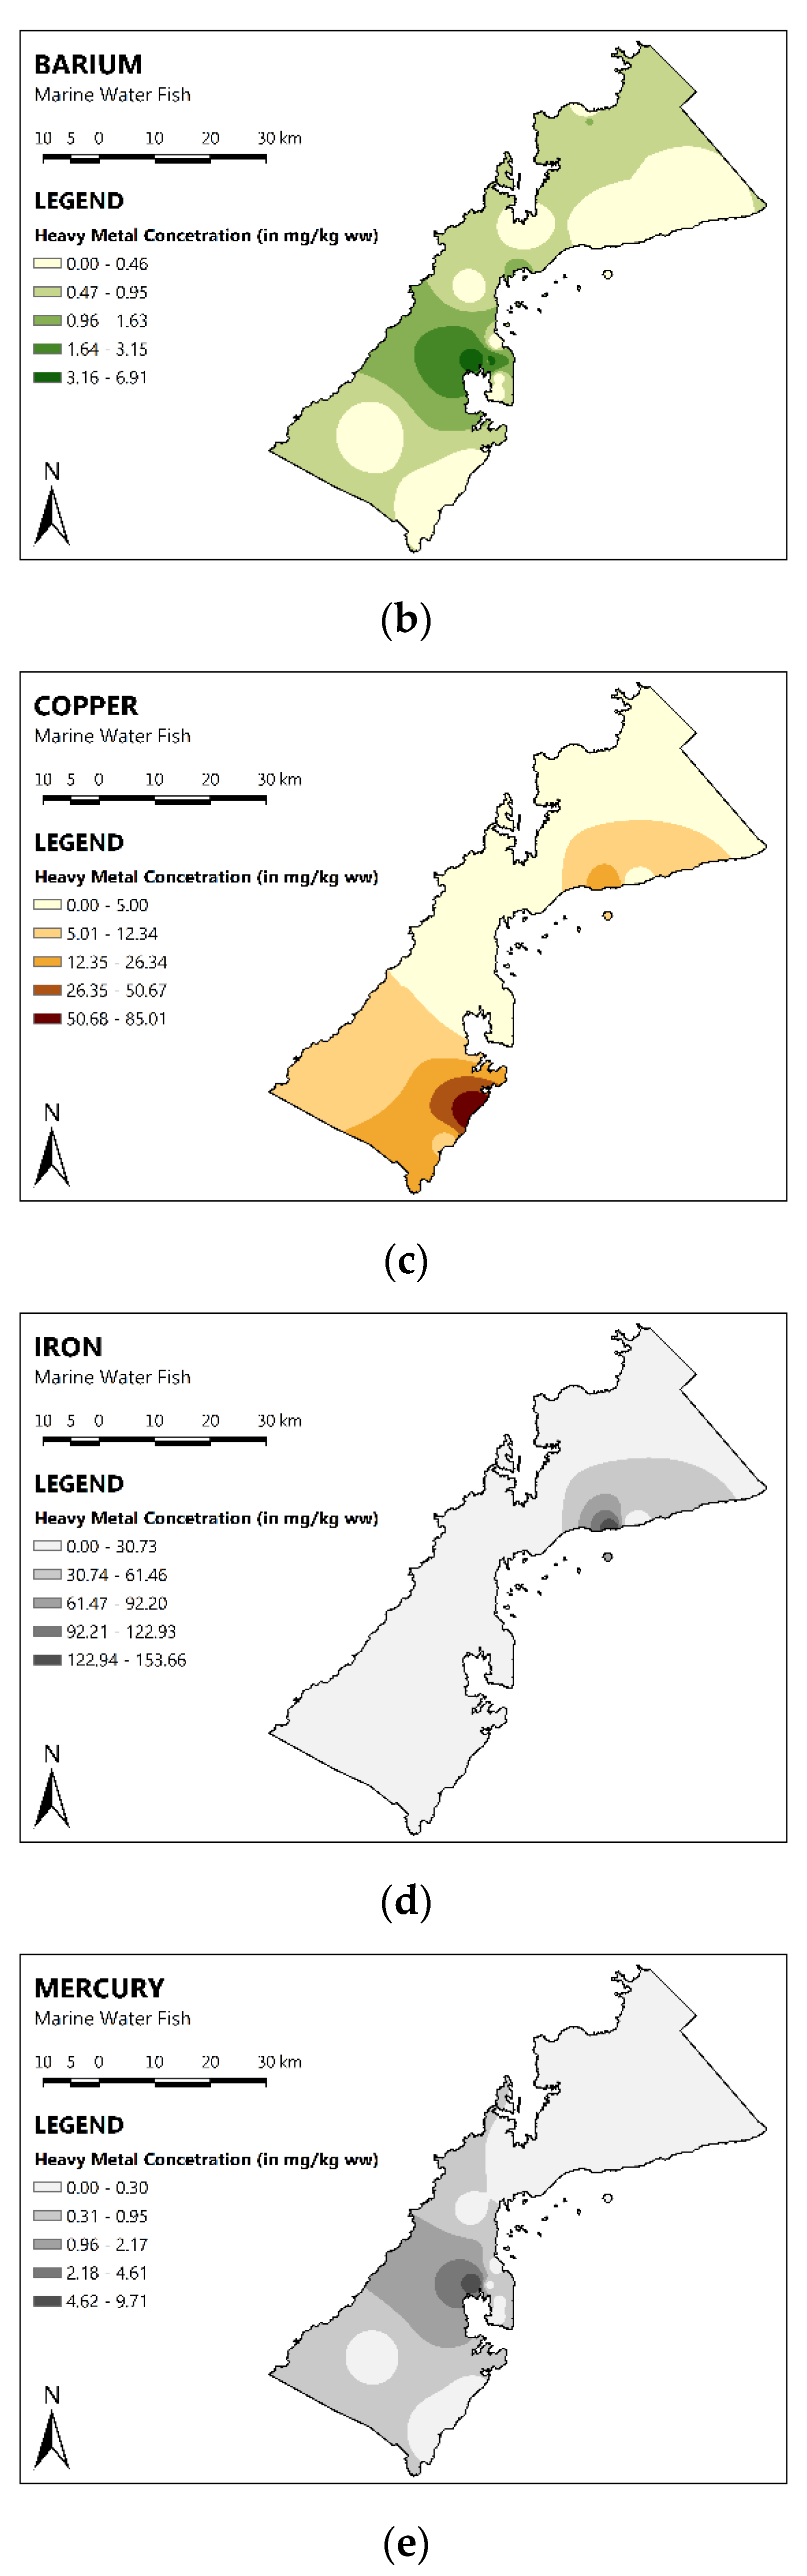
3.2. Spatial Distribution of MMs in the Fish of PPC

The spatial distribution maps of MMs in the brackish water fish of PPC are shown in Figure 2. The recorded concentrations of Cu, Mn, and Zn were found to be the highest in the northeastern part of PPC. While the concentration of Ba was highest in the southwestern part of PPC. The concentration of Fe was similarly distributed all over PPC and did not illustrate specific area of concern. There were no spatial distribution maps for the As and Hg, as the concentrations of these MMs were below the detection limit.
Additionally, the spatial distribution maps of MMs in the marine fish of PPC are shown in Figure 3. The concentrations of Ba, Cu, and Hg were highest in the southwestern part of PPC; As was highest in the northwestern part of PPC; and the concentrations of Mn and Zn were highest in major parts of PPC.

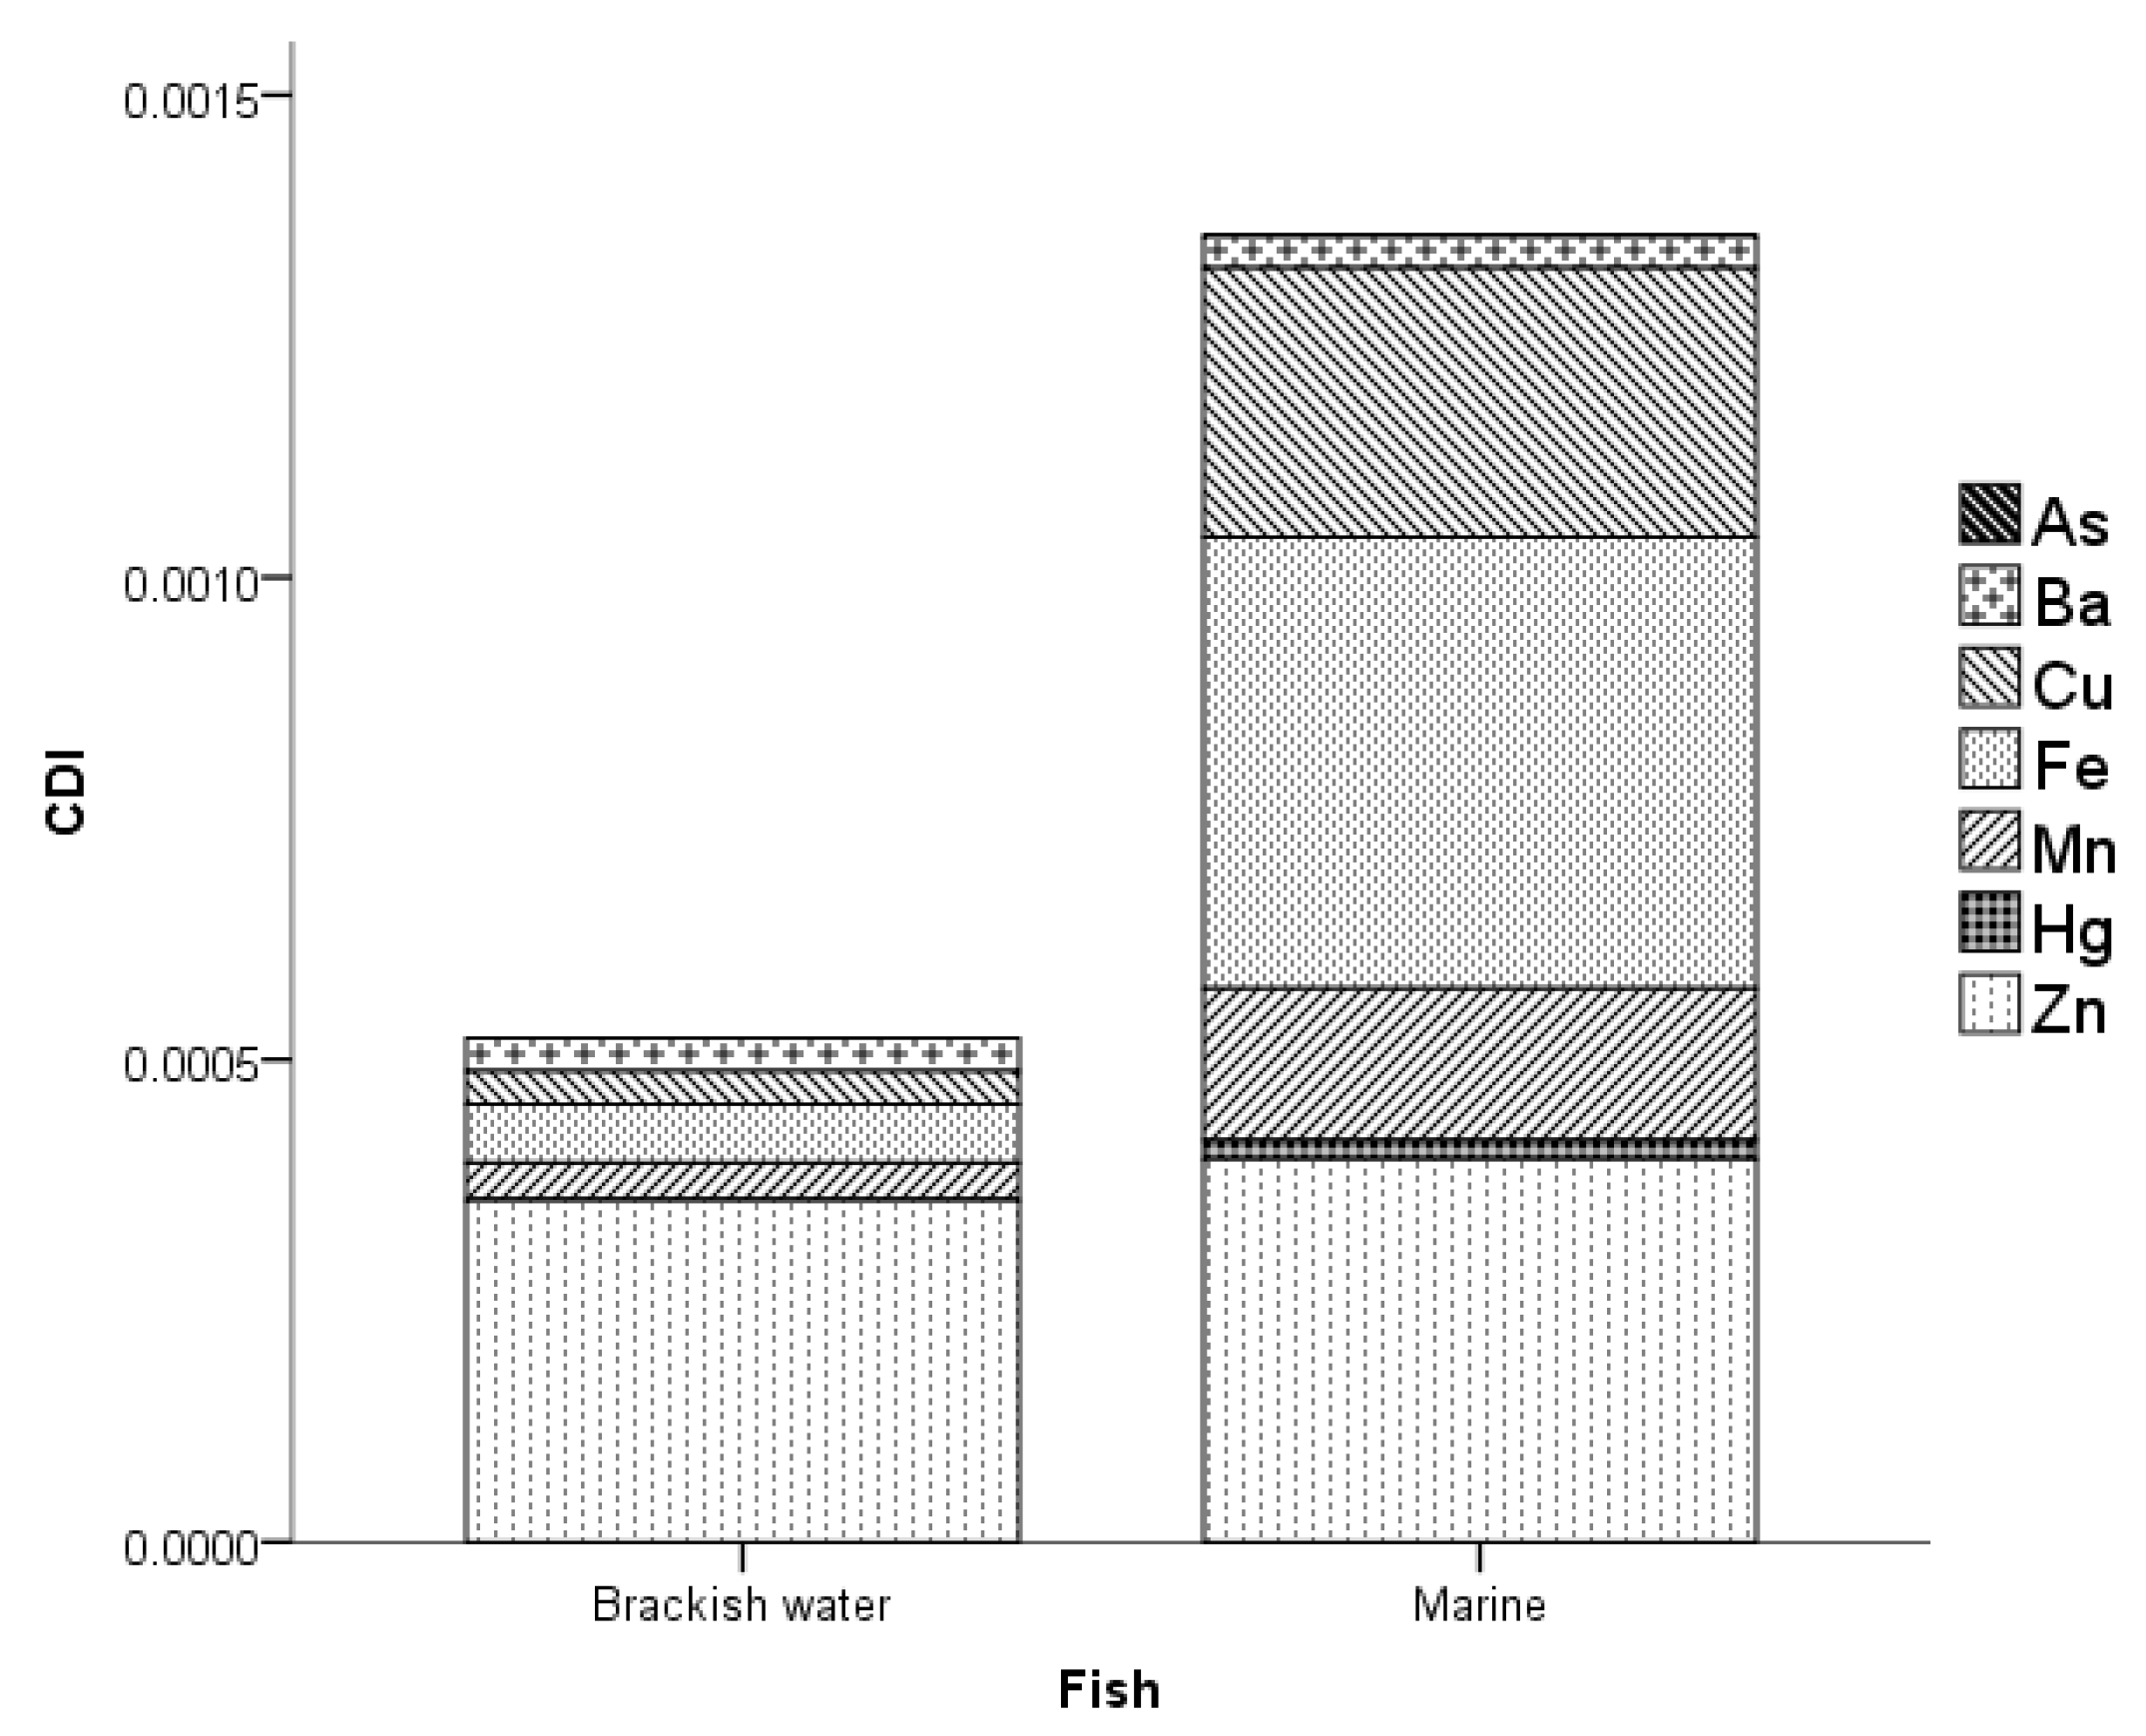
3.3. Health Risk Assessment of MMs in Fish

The chronic daily intake (CDI) of MMs in fish in PPC is shown in Figure 4. The computed CDI of MMs in brackish water fish ranged from 0   to   3.54 × 10 4 . The concentration of Zn contributed significantly to the total CDI of MMs in brackish water fish accounting for 67.77%. Additionally, the computed CDI of MMs in marine water fish ranged from 9.21 × 10 9   to   4.68 × 10 4 . On the other hand, the Fe contributed largely to the total CDI of MMs in marine water fish, which was equivalent to 34.58%. The trend of CDI in BMF was in the following order: Zn > Fe > Mn > Cu > Ba > Hg > As and Fe > Zn > Cu > Mn > Ba > Hg > As for brackish and marine water fish, respectively.
The total target hazard quotient (TTHQ) of MMs in the BMF in PPC is shown in Figure 5. It can be observed from the Figure that the TTHQ of MMs in marine fish is relatively greater than the brackish water fish recording about 96%. The TTHQ of MMs in brackish water fish ranged from 0   to   1.18 × 10 3 , while marine water fish recorded a TTHQ range of 3.07 × 10⁻⁵–1.22 × 10⁻¹. The Zn and Cu contributed 44.6% and 35.2%, respectively, to the total TTHQ in brackish water fish; both accounted for almost 80%. Further, it is observed from the Figure that Hg contributed largely to the total TTHQ in marine fish, accounting for more than 90%. This was followed by Cu, which accounted for 5.7% of the total TTHQ in marine fish. Both the THQs of all MMs in BMF did not exceed the threshold 1, which indicates that toxic effects are unlikely to occur [32,34,55,56,57] by consuming BMF in PPC. The trends of TTHQ in brackish water and marine fish were on the following order: Zn > Cu > Mn > Ba > Fe > Hg > As, and Hg > Cu > Zn > Mn > Fe > Ba > As, respectively.
To assess the carcinogenic risk of consuming fish contaminated with MMs, the carcinogenic risk (CR) was calculated, as shown in Table 3. Only As was included in the CR calculation as it was the only MM in this study that was identified by the IARC as a carcinogen [58]. It was shown in the Table that the CR of the brackish water fish was 0, which was lower than the threshold value of 1 × 10 6 indicating a negligible risk of developing cancer [42,44]. The CR of the marine water fish was 1.38 × 10 8 which was also lower than the threshold value of 1 × 10 6 indicating negligible risk of developing cancer [42,44] from the consumption of marine water fish.
Table 4 shows the maximum allowable fish consumption rates (CRlim) that a 60 kg adult can consume in a day. It was recorded that all the CRlim (carcinogenic risk limit) of BWF were higher than the average daily consumption of brackish water fish (7.23 g person−1 day−1) and marine water fish (11.62 g person−1 day−1) [31]. This indicates that the fish investigated in this specific study did not pose carcinogenic health risks to the local population [59,60]. The CRlim for the non-carcinogenic health risks of consuming brackish water fish ranged from 1619.06 to 17,219.82 g person−1 day−1 while marine fish ranged from 19.77 to 14,629.68 g person−1 day−1. The lowest CRlim of consuming fish was recorded in marine fish with Hg content which was equivalent to 19.77 g person−1 day−1. It was 8.15 g higher than the average daily consumption, which indicated that if the local population increases their consumption than the recorded CRlim, the potentially toxic effects that are negative to health may occur.
Moreover, for the carcinogenic health risks of consuming marine fish contaminated with As, the CRlim was approximately 115 times higher than the average daily consumption (11. 62 g person−1 day−1) [31]; this also indicates that the carcinogenic risk posed by consuming marine fish contaminated with As by the tourists and local population was very low [61].

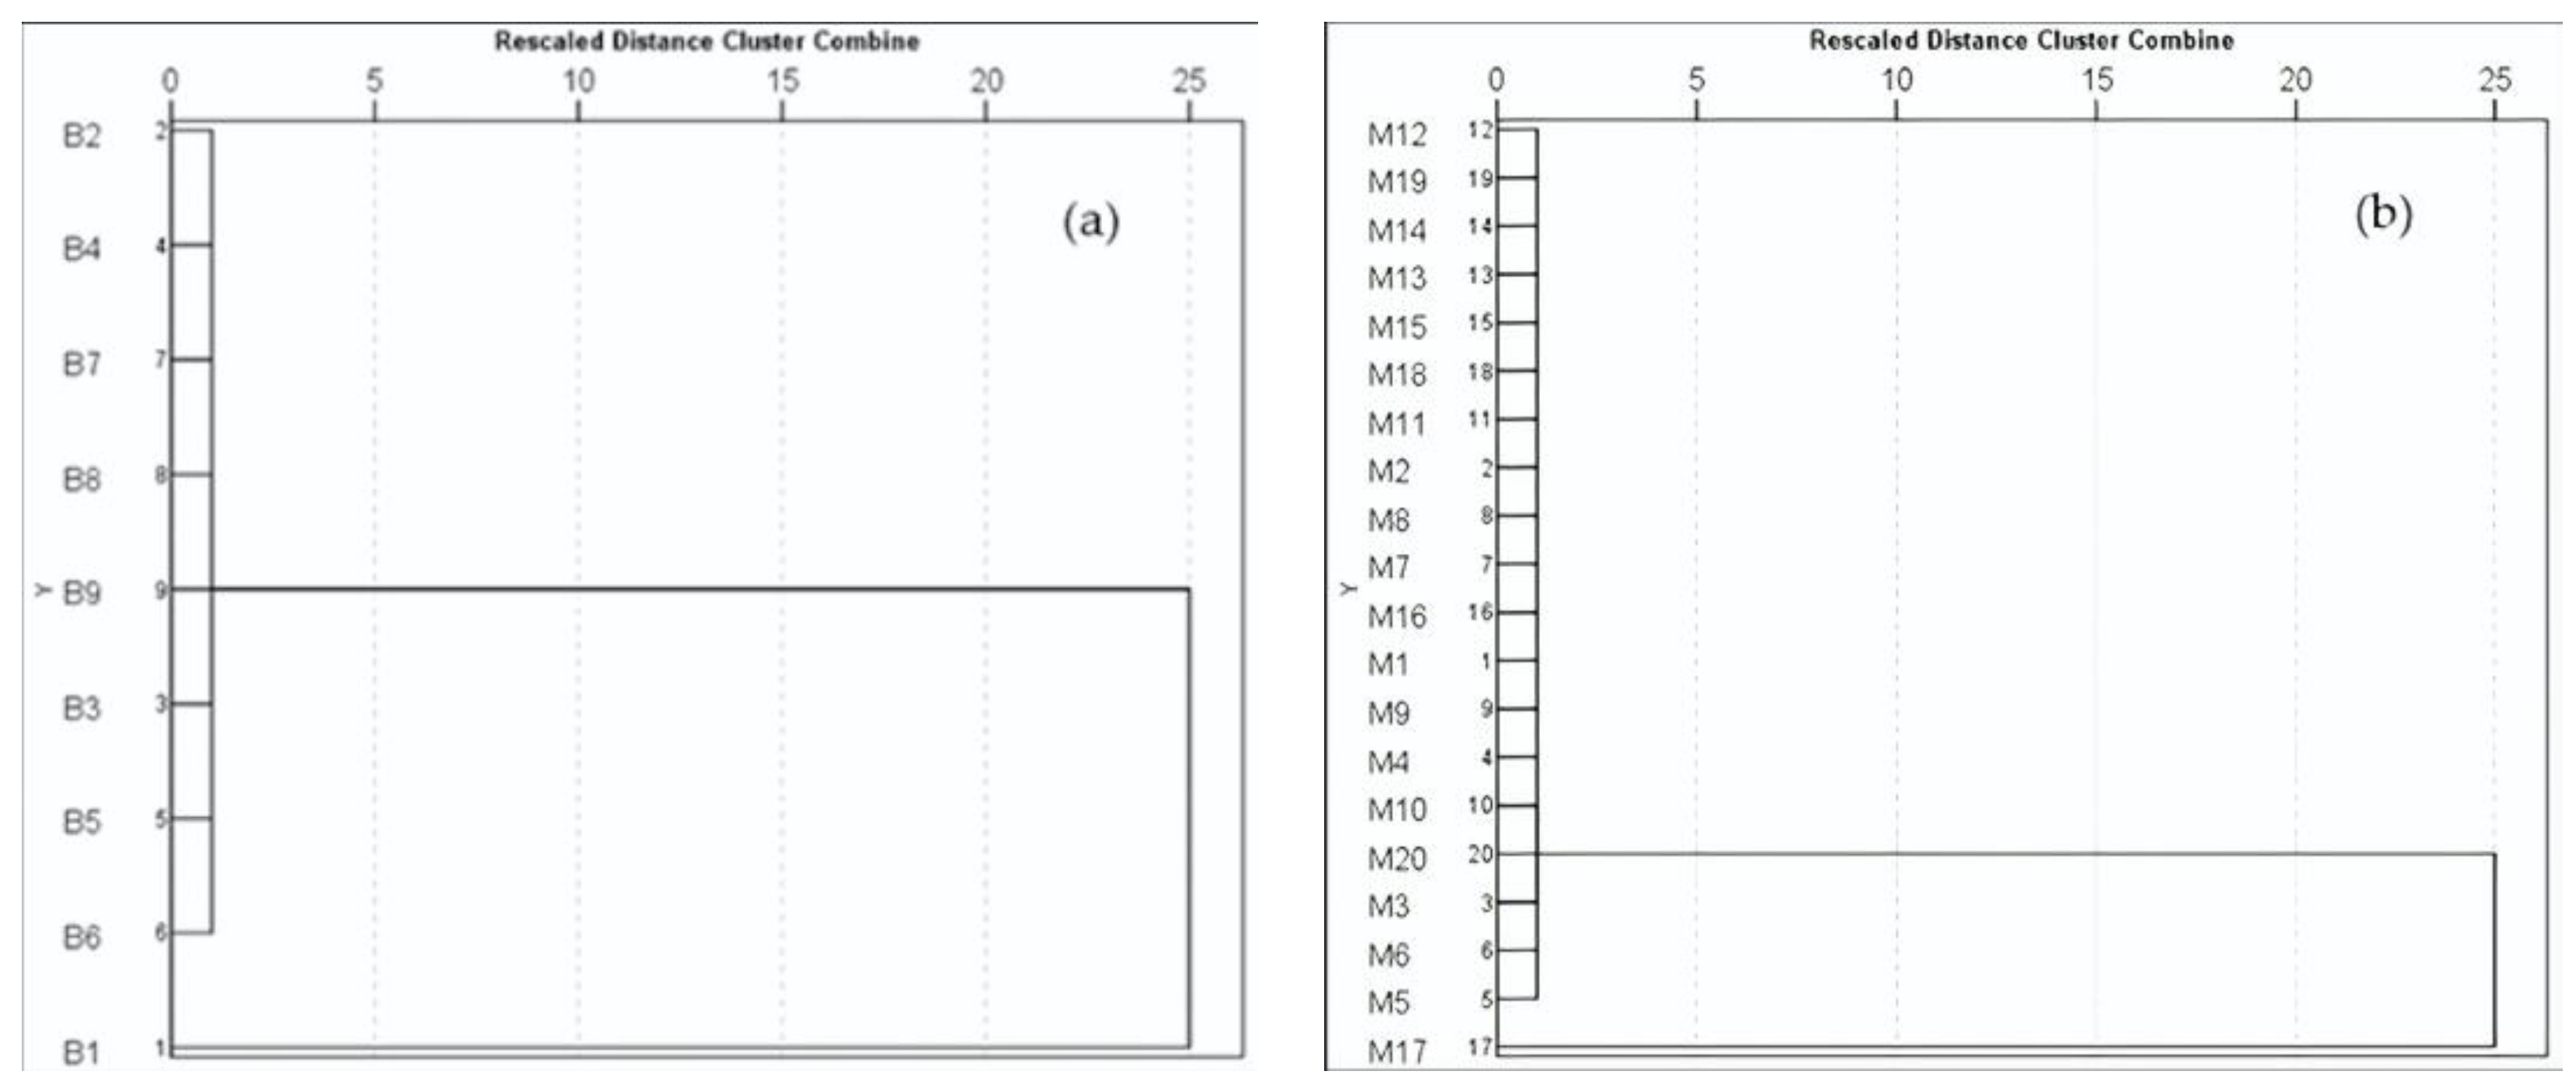
3.4. Relationship of MMs in Brackish Water and Marine Water Fish

The correlograms that show the correlation between MMs in fish are shown in Figure 6. As and Hg were not included in the correlation analysis of MMs in brackish water fish as all the data observed were below LOD. Figure 6a shows that high to very high significant positive correlations existed between Fe–Cu (r = 0.874, p = 0.002); Cu–Mn (r = 0.968, p = 0); and Fe–Mn (r = 0.950, p = 0) at 1% significance difference level (2-tailed). Moreover, Figure 6b also shows medium to high significant positive correlation between Mn–Zn (r = 0.704, p = 0.001) at 1% significance difference level (2-tailed) and between Ba–Hg (r = 0.550, p = 0.012) and Fe–Zn (r = 0.465, p = 0.039) at 5% significance difference level (2-tailed).
The hierarchical cluster analysis (HCA) of brackish water and marine fish based on THQ [62] was represented with dendrograms (Figure 7). In Figure 7A, two (2) clusters were classified. The first cluster comprised eight (8) brackish water fish samples (B2, B4, B7, B8, B9, B3, B5, and B6), approximately 88.89%, deemed safe for consumption. On the other hand, the second cluster was comprised of one (1) brackish water fish sample (B1), approximately 11.11%, which was recorded to have the highest THQ among the brackish water fish investigated (Table A1).
Additionally, Figure 7B shows the dendrogram in marine fish based on THQ, which has two (2) clusters. The first cluster was comprised of nineteen (19) marine fish samples (M12, M19, M14, M13, M15, M18, M11, M2, M8, M7, M16, M1, M9, M4, M10, M20, M3, M6, and M5), approximately 95%, which were deemed safe for consumption. The second cluster, on the other hand, was comprised of one (1) marine fish sample (M17), approximately 5%, which was found to have the highest THQ among the group and exceeded the threshold value for THQ. This indicates that marine fish sample M17 may be unsafe for consumption (please see Table A1). Generally, both dendrograms for BMF based on THQ revealed two (2) clusters.

4. Discussion

The consumption of fish is essential for human health and growth because of its nutritional content. However, pollutants such as MMs carried by runoff from abandoned mine pits, pit lakes, and industrial, uncontrolled discharges found their way to the aquatic environment and were eventually consumed by fishes. These pollutants can be ingested by aquatic organisms and eventually enter the food chain [63,64]. These MMs can bioaccumulate along the food chain where aquatic organisms in the higher trophic level, such as fish, have higher MMs content. This poses human health risks to the population who consumed such fish contaminated with MMs [65]. The determination of MMs levels in foods such as fish has gained important attention in recent years [9,32,66,67,68].
The findings of the study showed that among the MMs in BMF analyzed, it was Mn concentrations in both BMF were higher than the permissible limit. This is a similar result to the study of Ali et al. (2021) [69], in which Mn was one of the metals that tend to bioaccumulate highly in the muscle and liver of common carp (Cyprinus carpio) exposed to manganese sulphate and chromium chloride solution for 96 h. Mn can be present in aquatic environments due to natural causes (i.e., weathering of rocks) but primarily from anthropogenic activities such as mining [70] and domestic and industrial effluents [71]. A constant intake of fish highly contaminated with Mn may pose adverse health effects to the local population, such as neurodegenerative disorders [72], liver damage [73], and cardiovascular diseases [74]. In addition, the concentration of Hg in marine fish almost reached the permissible limit set by the European Commission (EC) [54].
Generally, wild fish are exposed to Hg2+ and methylmercury (MeHg) both from water and food. Hg has a strong affinity with elements Se and S which are mostly present as selenols and thiols in organisms like fish [75]. Cysteine (Cys) is the most abundant thiol in fish and the major complexing agent in the muscle of fish, which enhances the assimilation of MeHg from the environment [76]. This is one of the reasons why high accumulation of Hg in aquatic organisms such as fish frequently occurs. This finding was similar to the work of Nava et al., that showed Hg content in aquatic products was higher than land-based products [77]. The Hg pollution was recorded in the province of Palawan, Philippines, and was associated with the mining of cinnabar (HgS), known as the most common ore deposit of Hg [78].
Further, the deposit also contains an abundant amount of pyrite (FeS2), which is hazardous because FeS2 is a mineral that produces acid-mine drainage (AMD) [78]. This AMD makes the water more acidic, which, in turn, hastens the solubility and reactivity of metals like Hg. This makes the Hg bioavailable for aquatic organisms like fish. Hg poisoning of residents near the abandoned mine site in PPC, Palawan was already reported due to exposure to mine tailings and ingestion of contaminated marine fish [79]. Symptoms such as nausea, vomiting, chest pains, palpitations, kidney dysfunction, and even death may manifest due to acute toxicity to Hg [80]. On the other hand, chronic exposure to Hg can cause cardiovascular and developmental toxicity, neurotoxicity, and immunotoxicity [81]. Exposure of pregnant women to MeHg also poses a severe impact on the neurodevelopment of new born babies [82]. These contaminants and their clinical manifestations to the local population shall be looked into by the local government and health units of PPC. This is to monitor possible cases of Hg intoxication and to create appropriate strategic program(s) to improve the environmental quality and the health of the tourists and population. Also, the fish landing sites (Figure A1) and the registered mining sites in PPC (Table A3) were recorded during the project study implementation. The detected MMs in fish samples, especially Hg in marine water fish, can be attributed to the presence of existing and abandoned open mining sites [83,84] (Table A3) near the fishing grounds and fishing ports at the southeast portion of PPC. Based on Figure 3, these are also the areas where elevated concentration of Hg was detected in BMF. Similar cases were recorded in several regions, such as the Pb concentrations, were found in Epinephelus sp. in fishes collected from Tuticorin, India [85], and Tanzania [86]. Concentrations of As and Hg were detected from Epinephelus coioides collected from the Persian Gulf [87]. Further, alarming concentrations of MMS were detected from Rastrilliger kanagurta samples collected from Visakhapatnam, India [88].
Additionally, climate variations are also important factors in the kinetics of toxic metals in aquatic environments. The primary negative impact of climate change on aquatic ecosystems and metal bioaccumulation is linked to the risks of the creation of new stress situations in which aquatic organisms are more susceptible to chronic intoxication [89]. The model simulations of Moe et al. [90] also showed that climate warming accelerates the cycling of toxic metals and metalloids in aquatic ecosystems and increases their toxic properties. The work of Panebianco et al. also suggested that the presence of some elements (i.e., MMs) in aquatic products may indicate the co-existence of other pollutants [91].
Among the MMs analyzed, Zn and Fe recorded the highest concentration in brackish water and marine fish, respectively. These were also the MMs, which contributed largely to the CDI in brackish water and marine fish. Zn is considered an essential metal for growth, but excess amounts can be hazardous to fish and those who consume the fish meat [92]. High accumulation of MMs, especially Zn in brackish water fish, is associated with anthropogenic contaminants originating from a wide range of sources, i.e., industrial activities, household, and agriculture [93], osmoregulation of fish exposed to different environments [94,95] and the presence of high level of Zn in natural food [96]. Additionally, Fe is also an essential metal for humans, especially for menstruating and pregnant women, where iron-deficiency anaemia is prevalent [97]. The recorded Fe concentration in marine fish was not greater than the permissible limit [9] and can provide the dietary need for Fe of an individual.
The computed THQs of all MMs were not also greater than 1, which indicates that non-carcinogenic health risks were unlikely to occur. However, the TTHQ of marine fish was far greater than brackish water fish. This was attributed to the high Hg concentration in marine fish than brackish water fish. Marine fish in PPC was expected to have a high concentration of Hg, as the waste from a cinnabar mine was deposited along the coast of Honda Bay, Palawan in 1995 [98]. The results of the CR also show that As in brackish water and marine fish have a negligible cancer risk to the population. However, it shall be kept in mind that the presence of some MMs could be associated with the co-existence of other pollutants [93] that are attributable to the seasonal variations and weather conditions (such as floods) affecting the spread of different pollutants in the environment. Additionally, the CRlim for both non-carcinogenic and carcinogenic health risks were all greater than the average daily consumption of brackish water and marine fish [31], indicating that the fish investigated do not pose health risks to a 60 kg adult, similar to the findings of Zhong et al., [99] and Han et al., [2]. However, it should be noted that the CRlim decreases when the amount of MM concentration increases and the body weight decreases.
The results of the correlation analysis also revealed that some positive relationships exist between MMs in both brackish water and marine fish, indicating changes in the same direction (i.e., when a MM increases, other MMs also increase) [100]. Similarly, this may also reveal common absorption sites of MMs in both brackish and marine fish, their interaction, and possible source(s) of pollution [34,101]. Ali et al. (2022) [102], also investigated toxic metals in commercial fishes from Bangladesh and found highly positive relationships between toxic metals, suggesting common sources and distribution patterns. A study of the water, sediments, and fish in Yemen for metal contamination also shows that the levels of metals in the fish are positively correlated with the levels of metals in the water and sediment [103]. On the contrary, studies show that the concentrations of MMs in fish have no direct relationship with the fish’s length and weight. Jiang et al. [104] investigated the concentrations of heavy metals such as As, Cd, Cr, Cu, Hg, Pb, and Zn in eighteen (18) fish species from Heilongjiang River, China, recorded no significant correlation between fish size and the concentrations of heavy metals, particularly Cd, Cr, Cu, Pb, and Zn. Similar observations were recorded by Cais et al. [105] that concentrations of As, Hg, and Zn in the muscle and gills of P. vachelli collected from the Yangtze River, China showed no significant correlations with the fish length. Likewise, the concentrations of Cu and Zn in P. reticulata collected in a stream in Indonesia did not depend on the fish’s body weight. The body concentrations of these metals are apparently regulated at certain concentrations [106].
Generally, the dendrograms show that almost 97% of all the investigated fish were considered safe for consumption by the local population. The findings of this study can be considered for future research in brackish water and marine fish in PPC to better understand the bioaccumulation and kinetics of pollutants, particularly MMs in fish as well as their risks to human health [102]. This study utilized portable XRF in analyzing MMs in fish, which can be used for regular in situ monitoring by the local government, as it provides real-time detection results [29,107] that are rapid and accurate, and does not require sophisticated sample preparation and/or pre-treatment. Similarly, XRF is also a powerful technique for analyzing MMs in fish which is cost-effective and drastically reduces analytical time [30]. Possible sources of MMs contamination in the area aside from mining should be looked into by the local government to come up with effective mitigation measures. Remediation measures are highly recommended, especially in the abandoned Hg mine site in PPC, where remediation work has not been carried out for the past four decades [83]. Moreover, regular monitoring of MMs and other possible contaminants in fishponds should be done [85] as it is doable where commercial fishes like milkfish (Chanos chanos) and tilapia (Oreochromis niloticus) are usually cultured.

5. Conclusions

This study investigated the concentrations of metals and metalloids (MMs) in brackish water and marine fish in PPC, Palawan, Philippines. Also, the associated health risks to the population were evaluated and determined. The MMs that were analyzed using portable Olympus Vanta XRF include As, Ba, Cu, Fe, Mn, Hg, and Zn. Results revealed that Mn in both brackish water and marine fish exceeded the permissible limit for safe consumption. Additionally, the Hg in marine fish was at an alarming level, as it is almost along the permissible limit. Other MMs, namely As, Ba, Cu, Fe, and Zn, did not exceed the permissible limit set by FAO. WHO and EC Both the CDI and TTHQ of MMs in marine fish were greater than the brackish water fish due to their different aquatic environment and degree of exposure to MMs. The TTHQ for both brackish water and marine fish, on the other hand, did not exceed the threshold value implying that toxic effects may not occur as health risks by consuming the BMF. Further, the CR due to As in BMF posed “negligible” carcinogenic risks to the population as the calculated CRs were below the threshold value set by IARC and USEPA. The calculated CRlim for both non-carcinogenic and carcinogenic risks also shows that the average daily consumption of BMF by an adult does not pose health risks. The pXRF is a practical device for MMs’ detection in BMF as it can provide rapid and accurate MMs concentration. More research on MMs’ concentration monitoring and its health risks for more fish species, and other toxic metals, such as Cd, Cr, Pb, and Ni that are deemed carcinogenic, are recommended. The Hg in marine fish should be routinely monitored as the recorded concentrations were quite alarming and MMs pose neurodegenerative disorders. Furthermore, and based on the result of this study, extensive research on land-based products in PPC is warranted to generate more data to ensure the food safety of the local population and tourists.

Author Contributions

Conceptualization, D.B.S.; methodology, D.B.S. and M.M.G.P., R.C.N.; software, A.F.B.G. and R.C.N.; validation, M.M.G.P., R.C.N. and A.T.B., formal analysis, M.M.G.P., R.C.N., A.T.B., C.L. and D.B.S.; investigation, M.M.G.P., R.C.N., A.T.B. and D.B.S.; resources, D.B.S..; data curation, A.F.B.G., M.M.G.P. and R.C.N.; writing—original draft preparation, M.M.G.P. and R.C.N.; writing—review and editing, M.M.G.P., R.C.N., A.T.B., C.L. and D.B.S.; visualization, A.F.B.G. and R.C.N.; supervision, D.B.S. and M.M.G.P.; project administration, D.B.S.; funding acquisition, D.B.S. All authors read and approved the final manuscript.

Funding

This research was funded by the Department of Science and Technology, Philippine Council for Health Research and Development (DOST-PCHRD), Philippines, under the project titled Development of Health Index and Vulnerability Reduction System for Region 4B Capital (D-HIVE 4B Capital).

Institutional Review Board Statement

Not applicable.

Informed Consent Statement

Not applicable.

Data Availability Statement

Not applicable.

Acknowledgments

We wish to acknowledge the support of Mapua University, the Western Philippines University, the Marinduque State College, the D-HIVE 4B Capital Research Project Team, and the cooperation of the PPC local government unit.

Conflicts of Interest

The authors declare no conflict of interest.

Appendix A

Table A1. Fish samples and sampling locations in PPC.
EnvironmentCodeBarangayType of FishScientific NameEnglish NameLatitudeLongitudeWeight (g)Feeding Habit
Brackish Water B1BabuyanBangusChanos sp.Milkfish9.98029118.91462-Omnivore
B2MangingisdaBangusChanos sp.Milkfish9.67527118.73655283.4Omnivore
B3San JoseBangusChanos sp.Milkfish9.78193118.74316308.6Omnivore
B4TagumpayBangusChanos sp.Milkfish9.7423118.73625240.6Omnivore
B5SalvacionBangusChanos sp.Milkfish9.96691118.78505386.3Omnivore
B6TagburosBangusChanos sp.Milkfish9.84264118.74381351.5Omnivore
B7LiwanagBangusChanos sp.Milkfish9.74032118.22863405Omnivore
B8MasipagBangusChanos sp.Milkfish9.73514118.73515445.3Omnivore
B9Sta. MonicaBangusChanos sp.Milkfish9.79418118.73571311Omnivore
MarineM1CabayuganBurawRastrelliger spMackerel10.18221118.89548-Carnivore
M2CabayuganBisugoNemipterus sp.Threadfin bream10.18221118.89548-Carnivore
M3SalvacionWalingGazza sp.slipmouths9.94371118.7808-Carnivore
M4SalvacionBlack Lapu-lapuEpinephelus sp.grouper9.94371118.7808-Omnivore
M5Inagawan Sub-ColonyRed Lapu-apuEpinephelus sp.grouper9.61427118.70711-Omnivore
M6BabuyanBlack Lapu-lapuEpinephelus sp.grouper9.98001118.9325-Omnivore
M7TagburosLapu-lapuEpinephelus sp.grouper9.82518118.74225-Omnivore
M8TagburosDugsoLetrinus sp.Emperor fish9.82518118.74225-Carnivore
M9NapsanBuraw Rastrelliger spMackerel9.68359118.55226258.3Carnivore
M10InagawanBurawRastrelliger spMackerel9.56812118.66583401.8Carnivore
M11Sta. MonicaBurawRastrelliger spMackerel9.79375118.73385212.8Carnivore
M12San RafaelLapu-lapuEpinephelus sp.grouper9.98571118.96236219.8Omnivore
M13CabayuganLapu-lapuEpinephelus sp.grouper10.19408118.89374176.3Omnivore
M14BahileLapu-lapuEpinephelus sp.grouper9.99743118.78659456.4Omnivore
M15BacunganLapu-lapuEpinephelus sp.grouper9.90981118.70345304.6Omnivore
M16TagburosLapu-lapuEpinephelus sp.grouper9.82009118.74429266.1Omnivore
M17SicsicanLapu-lapuEpinephelus sp.grouper9.79559118.71157323.2Omnivore
M18Sta. MonicaLapu-lapuEpinephelus sp.grouper9.79381118.73435388.3Omnivore
M19San MiguelLapu-lapuEpinephelus sp.grouper9.7431118.74359452Omnivore
M20San Manuel Lapu-lapuEpinephelus sp.grouper9.76748118.74872411.2Omnivore
Table A2. Kruskal-Wallis test of MMs across brackish water and marine fish in PPC.
Null HypothesisSig.Decision
The distribution of As is the same across the brackish water and marine fish0.334Retain the null hypothesis
The distribution of Ba is the same across the brackish water and marine fish0.764Retain the null hypothesis
The distribution of Cu is the same across the brackish water and marine fish0.222Retain the null hypothesis
The distribution of Fe is the same across the brackish water and marine fish0.772Retain the null hypothesis
The distribution of Mn is the same across the brackish water and marine fish0.359Retain the null hypothesis
The distribution of Hg is the same across the brackish water and marine fish0.502Retain the null hypothesis
The distribution of Zn is the same across the brackish water and marine fish0.118Retain the null hypothesis
The significance level is 0.05.
Table A3. Registered mining sites in PPC, Palawan.
NameCommodity/MineCoordinates
Nickel Mining
Birong Nickel OccurenceNi9.4173° N 118.1993° E
Brookes Point Nickel OccurenceNi8.9173° N 117.8827° E
Coral Bay Nickel Corp.Ni8.483828° N,117.4377063° E
Palawan Rio Tuba Nickel Laterite depositNi8.5007° N 117.3994° E
Long Point Nickel Deposit-Palawan IslandNi9.6506° N 118.3326° E
Ipilan Nickel ProspectNi8.8507° N 117.8493° E
Rio Tuba Mine Ni8.5868° N 117.4049° E
Guintalungan Nickel DepositNi8.5549° N 117.3863° E
Isabela Nickel DepositNi9.1006° N 117.8993° E
Zinc Mining
Balabac Copper mineCu, Zn7.9841° N 117.0660° E
Manganese Mining
Pina–Balitbitin Manganese OccurenceMn12.0837° N 120.1993° E
Binabaan Manganese OccurenceMn11.731° N 120.0276° E
Busuanga Island Manganese MineMn12.1670° N 119.9993° E
Lorraine Orebody–Balabac Island MineAl, Fe, Mn, P, SiO28.0008° N 117.0493° E
Busuanga Island: Coron, Borac-East MineAl, Fe, Mn, P, SiO212.1104° N 119.9993° E
Iron Mining
Rio tuba MineFe, Ni8.5868° N 117.4049° E
Lorraine Orebody–Balabac Island MineAl, Fe, Mn, P, SiO28.0008° N 117.0493° E
Busuanga Island: Coron, Borac-East MineAl, Fe, Mn, P, SiO212.1104° N 119.9993° E
Copper Mining
Balabac Copper Mine in Palawan, PhilippinesCu, Zn7.9841° N 117.0660° E
Atlas Copper Mine in PalawanNi, FeCr2O4, and other
associated mineral deposits
Espanola-9.106383° N,
118.0779211° E, Narra—9.106383° N,118.0779211° E
Figure A1. Fish landing sites in PPC, Palawan.
Toxics 11 00621 g0a1

References

  1. FAO. The State of World Fisheries and Aquaculture; FAO: Rome, Italy, 2016; Volume 50, ISBN 9789251091852. [Google Scholar]
  2. Han, J.L.; Pan, X.D.; Chen, Q.; Huang, B.F. Health Risk Assessment of Heavy Metals in Marine Fish to the Population in Zhejiang, China. Sci. Rep. 2021, 11, 11079. [Google Scholar] [CrossRef] [PubMed]
  3. Hamilton, P.B.; Cowx, I.G.; Oleksiak, M.F.; Griffiths, A.M.; Grahn, M.; Stevens, J.R.; Carvalho, G.R.; Nicol, E.; Tyler, C.R. Population-Level Consequences for Wild Fish Exposed to Sublethal Concentrations of Chemicals—A Critical Review. Fish Fish. 2016, 17, 545–566. [Google Scholar] [CrossRef]
  4. Beeler, B.; Immig, J. Chemical Pollution Causes Fish Declines Escalating: Chemical Production Threatens Aquatic Food Chain; IPEN: Gothenburg, Sweden, 2021. [Google Scholar]
  5. Yousif, R.A.; Choudhary, M.I.; Ahmed, S.; Ahmed, Q. Review: Bioaccumulation of Heavy Metals in Fish and Other Aquatic Organisms from Karachi Coast, Pakistan. Nusant. Biosci. 2021, 13, 73–84. [Google Scholar] [CrossRef]
  6. Bosch, A.C.; O’Neill, B.; Sigge, G.O.; Kerwath, S.E.; Hoffman, L.C. Heavy Metals in Marine Fish Meat and Consumer Health: A Review. J. Sci. Food Agric. 2016, 96, 32–48. [Google Scholar] [CrossRef] [PubMed]
  7. Donati, E. Heavy Metals in the Environment: Microorganisms and Bioremediation, 1st ed.; CRC Press: Boca Raton, FL, USA, 2018; ISBN 9780367781576. [Google Scholar]
  8. Ferrante, M.; Napoli, S.; Grasso, A.; Zuccarello, P.; Cristaldi, A.; Copat, C. Systematic Review of Arsenic in Fresh Seafood from the Mediterranean Sea and European Atlantic Coasts: A Health Risk Assessment. Food Chem. Toxicol. 2019, 126, 322–331. [Google Scholar] [CrossRef] [PubMed]
  9. Agarin, C.J.M.; Mascareñas, D.R.; Nolos, R.; Chan, E.; Senoro, D.B. Transition Metals in Freshwater Crustaceans, Tilapia, and Inland Water: Hazardous to the Population of the Small Island Province. Toxics 2021, 9, 71. [Google Scholar] [CrossRef] [PubMed]
  10. Ranasinghe, P.; Weerasinghe, S.; Kaumal, M. Determination of Heavy Metals in Tilapia Using Various Digestion Methods Determination of Heavy Metals in Tilapia Using Various Digestion Methods Department of Chemistry, Faculty of Science, University of Colombo, Sri Lanka Faculty of Applied Sciences. Int. J. Sci. Res. Innov. Technol. 2016, 3, 38–48. [Google Scholar]
  11. Adei, D.; Braimah, I.; Mensah, J.V.; Mensah, A.A.; Agyemang-Duah, W. Improving upon the Working Environment of Informal Sector Workers in Ghana: The Role of Planning. Cogent Med. 2021, 8, 1911441. [Google Scholar] [CrossRef]
  12. Zeitoun, M.M.; Mehana, E.S.E. Impact of Water Pollution with Heavy Metals on Fish Health: Overview and Updates. Glob. Vet. 2014, 12, 219–231. [Google Scholar] [CrossRef]
  13. Ateş, A.; Türkmen, M.; Tepe, Y. Assessment of Heavy Metals in Fourteen Marine Fish Species of Four Turkish Seas. Indian J. Geo-Mar. Sci. 2015, 44, 49–55. [Google Scholar]
  14. Yi, Y.J.; Zhang, S.H. The Relationships between Fish Heavy Metal Concentrations and Fish Size in the Upper and Middle Reach of Yangtze River. Procedia Environ. Sci. 2012, 13, 1699–1707. [Google Scholar] [CrossRef] [Green Version]
  15. Ahmed, K.; Baki, M.A.; Kundu, G.K.; Saiful Islam, M.; Monirul Islam, M.; Muzammel Hossain, M. Human Health Risks from Heavy Metals in Fish of Buriganga River, Bangladesh. Springerplus 2016, 5, 1697. [Google Scholar] [CrossRef]
  16. Lee, K.G.; Kweon, H.Y.; Yeo, J.H.; Woo, S.O.; Han, S.M.; Kim, J.H. Characterization of Tyrosine-Rich Antheraea Pernyi Silk Fibroin Hydrolysate. Int. J. Biol. Macromol. 2011, 48, 223–226. [Google Scholar] [CrossRef] [PubMed]
  17. Tchounwou, P.B.; Yedjou, C.G.; Patlolla, A.K.; Sutton, D.J. Heavy Metal Toxicity and the Environment. In Molecular, Clinical and Environmental Toxicology; Springer: Basel, Switzerland, 2012; Volume 101, pp. 133–164. [Google Scholar] [CrossRef] [Green Version]
  18. Tongesayi, T.; Fedick, P.; Lechner, L.; Brock, C.; Le Beau, A.; Bray, C. Daily Bioaccessible Levels of Selected Essential but Toxic Heavy Metals from the Consumption of Non-Dietary Food Sources. Food Chem. Toxicol. 2013, 62, 142–147. [Google Scholar] [CrossRef]
  19. Nolos, R.C.; Zamroni, A.; Evina, K.F.P. Drivers Of Deforestation And Forest Degradation In Palawan, Philippines: An Analysis Using Social-Ecological Systems (SES) And Institutional Analysis And Development (IAD) Approaches. Geogr. Environ. Sustain. 2023, 15, 44–56. [Google Scholar] [CrossRef]
  20. Cadag, J.R.; Timbancaya, E.; De la Cruz, E.; Matillano, D.; De la Cruz, L.; Ocampo, D.; Caringal, J.C. Puerto Princesa City Local Disaster Risk Reduction and Management FY 2020–2022; City Disaster Risks Reduction and Management Office: Puerto Princesa City, Philippines, 2022. [Google Scholar]
  21. PPC LGU. City Government of Puerto Princesa Annual Report of City Government of Puerto Princesa. In Accomplishments of Economic Sector; Puerto Princesa City Local Government: Palawan, Philippines, 2020. [Google Scholar]
  22. Peralta-milan, S.; Baba, O.; Salmo, S. Linking Marketing of Reef-Sourced Seafood with Tourism: Potential for Improving Fisheries Management. Philipp. Sci. Lett. 2020, 13, 113–123. [Google Scholar]
  23. Samaniego, J.; Gibaga, C.R.; Tanciongco, A.; Rastrullo, R. Assessment of Trace Elements in Soils and Sediments in the Abandoned Mercury Mine Site in Puerto Princesa City, Philippines. ASEAN J. Sci. Technol. Dev. 2021, 38, 43–49. [Google Scholar] [CrossRef]
  24. Samaniego, J.; Gibaga, C.R.; Tanciongco, A.; Rastrullo, R. Total Mercury in Soils and Sediments in the Vicinity of Abandoned Mercury Mine Area in Puerto Princesa City, Philippines. Appl. Sci. 2020, 10, 4599. [Google Scholar] [CrossRef]
  25. Ureta, J.U.; Florece, L.; Pulhin, J. Social Vulnerability and Adaptation to Climate Variability and Extremes of Farming and Fishing Households in Puerto Princesa City, Palawan, Philippines. J. Econ. Manag. Agric. Dev. 2015, 3, 73–88. [Google Scholar]
  26. City Government of Puerto Princesa Climate and Weather Palawan. Available online: https://palawanperfection.com/climate-weather/563 (accessed on 17 November 2022).
  27. USEPA. Guidance for Assessing Chemical Contaminant Data for Use in Fish Advisories Volume 1 Fish Sampling and Analysis, 3rd ed.; United States Environmental Protection Agency: Washington, DC, USA, 2000; Volume 1.
  28. Mendoza, L.C.; Nolos, R.C.; Villaflores, O.B.; Apostol, E.M.D.; Senoro, D.B. Detection of Heavy Metals, Their Distribution in Tilapia Spp., and Health Risks Assessment. Toxics 2023, 11, 286. [Google Scholar] [CrossRef] [PubMed]
  29. Senoro, D.B.; de Jesus, K.L.M.; Nolos, R.C.; Lamac, M.R.L.; Deseo, K.M.; Tabelin, C.B. In Situ Measurements of Domestic Water Quality and Health Risks by Elevated Concentration of Heavy Metals and Metalloids Using Monte Carlo and MLGI Methods. Toxics 2022, 10, 342. [Google Scholar] [CrossRef]
  30. Medaković, D.; Dolenec, T.; Karlović, D.; Vrhovnik, P.; Rogan Šmuc, N.; Rončević, S.; Pitarević-Svedružić, L.; Dolenec, M. Trace Metals in Fish Biominerals as Environmental Indicators: Handheld XRF Analyses. Key Eng. Mater. 2016, 672, 328–339. [Google Scholar] [CrossRef]
  31. Philippine Statistics Authority. Consumption of Selected Agricultural Commodities in the Philippines; Philippine Statistics Authority (PSA): Quezon City, Philippines, 2017; Volume 2, pp. 1689–1699.
  32. Safiur Rahman, M.; Solaiman Hossain, M.; Ahmed, M.K.; Akther, S.; Jolly, Y.N.; Akhter, S.; Jamiul Kabir, M.; Choudhury, T.R. Assessment of Heavy Metals Contamination in Selected Tropical Marine Fish Species in Bangladesh and Their Impact on Human Health. Environ. Nanotechnol. Monit. Manag. 2019, 11, 100210. [Google Scholar] [CrossRef]
  33. United States Environmental Protection Agency. Health Effects Assessment Summary Tables; Office of Research and Development, US Environmental Protection Agency: Washington, DC, USA, 1995; Volume 93.
  34. Nolos, R.C.; Agarin, C.J.M.; Domino, M.Y.R.; Bonifacio, P.B.; Chan, E.B.; Mascareñas, D.R.; Senoro, D.B. Health Risks Due to Metal Concentrations in Soil and Vegetables from the Six Municipalities of the Island Province in the Philippines. Int. J. Environ. Res. Public Health 2022, 19, 1587. [Google Scholar] [CrossRef]
  35. Zaghloul, G.Y.; Ezz El-Din, H.M.; Mohamedein, L.I.; El-Moselhy, K.M. Bio-Accumulation and Health Risk Assessment of Heavy Metals in Different Edible Fish Species from Hurghada City, Red Sea, Egypt. Environ. Toxicol. Pharmacol. 2022, 95, 103969. [Google Scholar] [CrossRef]
  36. Qu, C.-S.; Ma, Z.-W.; Yang, J.; Liu, Y.; Bi, J.; Huang, L. Human Exposure Pathways of Heavy Metals in a Lead-Zinc Mining Area, Jiangsu Province, China. PLoS ONE 2012, 7, e46793. [Google Scholar] [CrossRef] [Green Version]
  37. Musarrat, M.; Ullah, A.K.M.A.; Moushumi, N.S.; Akon, S.; Nahar, Q.; Saliheen Sultana, S.S.; Quraishi, S.B. Assessment of Heavy Metal(Loid)s in Selected Small Indigenous Species of Industrial Area Origin Freshwater Fish and Potential Human Health Risk Implications in Bangladesh. LWT 2021, 150, 112041. [Google Scholar] [CrossRef]
  38. Zeng, F.; Wei, W.; Li, M.; Huang, R.; Yang, F.; Duan, Y. Heavy Metal Contamination in Rice-Producing Soils of Hunan Province, China and Potential Health Risks. Int. J. Environ. Res. Public Health 2015, 12, 15584–15593. [Google Scholar] [CrossRef] [PubMed]
  39. United States Environmental Protection Agency. Toxicological Review of Barium and Compounds. In Information on the Integrated Risk Information System; United States Environmental Protection Agency: Washington, DC, USA, 2010; Volume 39, pp. 759–786. [Google Scholar]
  40. Muhammad, S.; Shah, M.T.; Khan, S. Health Risk Assessment of Heavy Metals and Their Source Apportionment in Drinking Water of Kohistan Region, Northern Pakistan. Microchem. J. 2011, 98, 334–343. [Google Scholar] [CrossRef]
  41. Yuswir, N.S.; Praveena, S.M.; Aris, A.Z.; Ismail, S.N.S.; Hashim, Z. Health Risk Assessment of Heavy Metal in Urban Surface Soil (Klang District, Malaysia). Bull. Environ. Contam. Toxicol. 2015, 95, 80–89. [Google Scholar] [CrossRef] [PubMed] [Green Version]
  42. Means, B. Risk-Assessment Guidance for Superfund. Volume 1. Human Health Evaluation Manual. Part A. Interim Report (Final); Office of Solid Waste and Emergency Response, Environmental Protection Agency: Washington, DC, USA, 1989.
  43. International Agency for Research on Cancer. Agents Classified by the IARC Monographs; International Agency for Research on Cancer: Lyon, France, 2012; Volume 1–105, pp. 1–5.
  44. Abdel-Kader, H.H.; Mourad, M.H. Estimation of Cadmium in Muscles of Five Freshwater Fish Species from Manzalah Lake, and Possible Human Risk Assessment of Fish Consumption (Egypt). Biol. Trace Elem. Res. 2023, 201, 937–945. [Google Scholar] [CrossRef] [PubMed]
  45. Varol, M.; Kaçar, E.; Sünbül, M.R.; Md Towfiqul Islam, A.R. Levels of Metals and Elements in Tissues of Fish Species in the Kızılırmak River (Turkey) and Assessment of Health Risks and Nutritional Benefits. Environ. Res. 2022, 214, 113791. [Google Scholar] [CrossRef]
  46. Bigler, J. Guidance for Assessing Chemical Contaminant Data for Use in Fish Advisories: Risk Assessment and Fish Consumption Limits; US EPA Office of Water, Office of Science and Technology: Washington, DC, USA, 1997; Volume 2. [Google Scholar]
  47. Hossain, M.B.; Tanjin, F.; Rahman, M.S.; Yu, J.; Akhter, S.; Noman, M.A.; Sun, J. Metals Bioaccumulation in 15 Commonly Consumed Fishes from the Lower Meghna River and Adjacent Areas of Bangladesh and Associated Human Health Hazards. Toxics 2022, 10, 139. [Google Scholar] [CrossRef] [PubMed]
  48. Liu, B.; Lv, L.; An, M.; Wang, T.; Li, M.; Yu, Y. Heavy Metals in Marine Food Web from Laizhou Bay, China: Levels, Trophic Magnification, and Health Risk Assessment. Sci. Total Environ. 2022, 841, 156818. [Google Scholar] [CrossRef] [PubMed]
  49. Ogunlaja, A.; Ogunlaja, O.O.; Okewole, D.M.; Morenikeji, O.A. Risk Assessment and Source Identification of Heavy Metal Contamination by Multivariate and Hazard Index Analyses of a Pipeline Vandalised Area in Lagos State, Nigeria. Sci. Total Environ. 2019, 651, 2943–2952. [Google Scholar] [CrossRef]
  50. Geographic Information System Software, ESRI ArcGIS Desktop 10.8.1, ARCPro 2.8; Esri: Redlands, CA, USA.
  51. Inverse Distance Weighting (IDW) Interpolation—GIS Geography. Available online: https://gisgeography.com/inverse-distance-weighting-idw-interpolation/ (accessed on 16 September 2022).
  52. Karimi, H.A. Handbook of Research on Geoinformatics. In IGI Global 2009; University of Pittsburgh: Pittsburgh, PA, USA, 2009; pp. 129–136. [Google Scholar]
  53. Gimond, M. Introduction to GIS and Spatial Analysis. Available online: https://mgimond.github.io/Spatial/ (accessed on 16 September 2022).
  54. European Commission Commission Regulation (EC). No 1881/2006 of 19 December 2006 Setting Maximum Levels for Certain Contaminants in Foodstuffs. Off. J. Eur. Union 2006, 364, 5–24. [Google Scholar]
  55. World Health Organization. Summary and Conclusions of the Sixty-First Meeting of the Joint FAO/WHO Expert Committee on Food Additives (JECFA); WHO: Roma, Italy, 2003.
  56. Joint FAO/WHO Expert Committee on Food Additives. Toxicological Evaluation of Certain Food Additives and Contaminants. In Proceedings of the Meeting of the Joint FAO/WHO Expert Committee on Food Additives, Geneva, Switzerland, 21–30 March 1989, International Program on Chemical Safety, 33rd ed.; Geneva, S., Ed.; Cambridge University Press: Cambridge, UK, 1989; p. 362. [Google Scholar]
  57. Botwe, B.O. Heavy Metal Concentrations in Five Fish Species from the Gulf of Guinea and Their Human Health Implications. Reg. Stud. Mar. Sci. 2021, 44, 101763. [Google Scholar] [CrossRef]
  58. United States Environmental Protection Agency. Arsenic, Inorganic; CASRN 7440-38-2; Integrated Risk Information System, (IRIS): Washington, DC, USA; U.S. Chemical Assessment Summary National Center for Environmental Assessment: Washington, DC, USA, 1988; p. 27. [Google Scholar]
  59. Felix, C.S.A.; Pereira Junior, J.B.; da Silva Junior, J.B.; Cruz, A.S.; Dantas, K.G.F.; Ferreira, S.L.C. Determination and Human Health Risk Assessment of Mercury in Fish Samples. Talanta 2022, 247, 123557. [Google Scholar] [CrossRef]
  60. Zhu, L.; Yan, B.; Wang, L.; Pan, X. Mercury Concentration in the Muscle of Seven Fish Species from Chagan Lake, Northeast China. Environ. Monit. Assess. 2012, 184, 1299–1310. [Google Scholar] [CrossRef] [PubMed]
  61. Melake, B.A.; Nkuba, B.; Groffen, T.; De Boeck, G.; Bervoets, L. Distribution of Metals in Water, Sediment and Fish Tissue. Consequences for Human Health Risks Due to Fish Consumption in Lake Hawassa, Ethiopia. Sci. Total Environ. 2022, 843, 156968. [Google Scholar] [CrossRef] [PubMed]
  62. Egbueri, J.C. Groundwater Quality Assessment Using Pollution Index of Groundwater (PIG), Ecological Risk Index (ERI) and Hierarchical Cluster Analysis (HCA): A Case Study. Groundw. Sustain. Dev. 2020, 10, 100292. [Google Scholar] [CrossRef]
  63. Karayakar, F.; Işık, U.; Cicik, B.; Canli, M. Heavy Metal Levels in Economically Important Fish Species Sold by Fishermen in Karatas (Adana/TURKEY). J. Food Compos. Anal. 2022, 106, 104348. [Google Scholar] [CrossRef]
  64. Steinhausen, S.L.; Agyeman, N.; Turrero, P.; Ardura, A.; Garcia-Vazquez, E. Heavy Metals in Fish Nearby Electronic Waste May Threaten Consumer’s Health. Examples from Accra, Ghana. Mar. Pollut. Bull. 2022, 175, 113162. [Google Scholar] [CrossRef]
  65. Lawal Usman, U.; Muhammad, A.Z.; Banerjee, S.; Musa, N. Bioaccumulation Potential of Heavy Metals in Some Commercially Fish Species from Cika Koshi Reservoir Katsina North-Western Nigeria: Threat to Ecosystem and Public Health. Mater Today Proc. 2022, 49, 3423–3429. [Google Scholar] [CrossRef]
  66. Elvira, M.V.; Faustino-Eslava, D.V.; de Chavez, E.R.C.; Losloso, J.A.L.; Fukuyama, M. Human Health Risk Associated with Heavy Metals from Consumption of Asiatic Clam, Corbicula Fluminea, from Laguna de Bay, Philippines. Environ. Sci. Pollut. Res. 2021, 28, 36626–36639. [Google Scholar] [CrossRef]
  67. Töre, Y.; Ustaoğlu, F.; Tepe, Y.; Kalipci, E. Levels of Toxic Metals in Edible Fish Species of the Tigris River (Turkey); Threat to Public Health. Ecol. Indic. 2021, 123, 107361. [Google Scholar] [CrossRef]
  68. Rakib, M.; Jahan, R.; Jolly, Y.N.; Enyoh, C.E.; Khandaker, M.U.; Hossain, M.B.; Akther, S.; Alsubaie, A.; Almalki, A.S.A.; Bradley, D.A. Levels and Health Risk Assessment of Heavy Metals in Dried Fish Consumed in Bangladesh. Sci. Rep. 2021, 11, 14642. [Google Scholar] [CrossRef]
  69. Ali, Z.; Yousafzai, A.M.; Sher, N.; Muhammad, I.; Nayab, G.E.; Aqeel, S.A.M.; Shah, S.T.; Aschner, M.; Khan, I.; Khan, H. Toxicity and Bioaccumulation of Manganese and Chromium in Different Organs of Common Carp (Cyprinus carpio) Fish. Toxicol. Rep. 2021, 8, 343–348. [Google Scholar] [CrossRef]
  70. Liu, Z.; Kuang, Y.; Lan, S.; Cao, W.; Yan, Z.; Chen, L.; Chen, Q.; Feng, Q.; Zhou, H. Pollution Distribution of Potentially Toxic Elements in a Karstic River Affected by Manganese Mining in Changyang, Western Hubei, Central China. Int. J. Environ. Res. Public Health 2021, 18, 1870. [Google Scholar] [CrossRef]
  71. Ramprasad, C.; Sona, K.; Afridhi, M.; Kumar, R. Water Quality Assessment of the Cauvery and Vaigai River at Upstream and Downstream Locations: Impact of Domestic and Industrial Effluents. Indian J. Ecol. 2021, 48, 615–619. [Google Scholar]
  72. Levy, B.S.; Nassetta, W.J. Neurologic Effects of Manganese in Humans: A Review. Int. J. Occup. Environ. Health 2003, 9, 153–163. [Google Scholar] [CrossRef]
  73. O’Neal, S.L.; Zheng, W. Manganese Toxicity upon Overexposure: A Decade in Review. Curr. Environ. Health Rep. 2015, 2, 315–328. [Google Scholar] [CrossRef] [PubMed] [Green Version]
  74. Jiang, Y.; Zheng, W. Cardiovascular Toxicities upon Managanese Exposure. Cardiovasc. Toxicol. 2005, 5, 345–354. [Google Scholar] [CrossRef] [PubMed] [Green Version]
  75. Bradley, M.A.; Barst, B.D.; Basu, N. A Review of Mercury Bioavailability in Humans and Fish. Int. J. Environ. Res. Public Health 2017, 14, 169. [Google Scholar] [CrossRef] [PubMed] [Green Version]
  76. Wang, F.; Lemes, M.; Khan, M. Metallomics of Mercury: Role of Thiol-and Selenol-Containing Biomolecules. In Environmental Chemistry and Toxicology of Mercury; John Wiley & Sons: Hoboken, NJ, USA, 2012; pp. 517–544. [Google Scholar]
  77. Nava, V.; Di Bella, G.; Fazio, E.; Potorti, A.G.; Lo Turco, V.; Licata, P. Hg Content in EU and Non-EU Processed Meat and Fish Foods. Appl. Sci. 2023, 13, 793. [Google Scholar] [CrossRef]
  78. Langcay, M.L.; Clemente, E.D.; Arranz, C.G. Risk Assessment of Mercury in Soil and Surface Water in Brgy. Santa Lourdes, Puerto Princesa City, Palawan. In Proceedings of the IOP Conference Series: Earth and Environmental Science, Beijing, China, 6–8 December 2020; IOP Publishing: Bristol, UK, 2021; Volume 690, p. 12043. [Google Scholar] [CrossRef]
  79. Gray, J.E.; Greaves, I.A.; Bustos, D.M.; Krabbenhoft, D.P. Mercury and Methylmercury Contents in Mine-Waste Calcine, Water, and Sediment Collected from the Palawan Quicksilver Mine, Philippines. Environ. Geol. 2003, 43, 298–307. [Google Scholar] [CrossRef]
  80. World Health Organization. Mercury and Human Health; WHO: Geneva, Switzerland, 2021; ISBN 9789289055888.
  81. Genchi, G.; Sinicropi, M.S.; Carocci, A.; Lauria, G.; Catalano, A. Mercury Exposure and Heart Diseases. Int. J. Environ. Res. Public Health 2017, 14, 74. [Google Scholar] [CrossRef] [Green Version]
  82. Caetano, T.; Branco, V.; Cavaco, A.; Carvalho, C. Risk Assessment of Methylmercury in Pregnant Women and Newborns in the Island of Madeira (Portugal) Using Exposure Biomarkers and Food-Frequency Questionnaires. J. Toxicol. Environ. Health A 2019, 82, 833–844. [Google Scholar] [CrossRef]
  83. Samaniego, J.O.; Gibaga, C.R.L.; Tanciongco, A.M.; Rastrullo, R.M.; Costa, M.A.V. Surface Water Characteristics in the Vicinity of Abandoned Mercury Mine Site in Puerto Princesa City, Philippines. Philipp. J. Sci. 2019, 148, 493–498. [Google Scholar]
  84. Samaniego, J.O.; Gibaga, C.R.L.; Mendoza, N.D.S.; Racadio, C.D.T.; Tanciongco, A.M.; Rastrullo, R.M. Mercury and Other Heavy Metals in Groundwater in the Abandoned Mercury Mine in Puerto Princesa City, Philippines. Philipp. J. Sci. 2020, 149, 897–901. [Google Scholar] [CrossRef]
  85. Pugalendhi, T.; Uma Maheswari, G. Concentration of Lead and Cadmium in Some Edible Fishes from Tuticorin. J. Mar. Biol. Ass. India 2007, 49, 254–256. [Google Scholar]
  86. Mwakalapa, E.B.; Simukoko, C.K.; Mmochi, A.J.; Mdegela, R.H.; Berg, V.; Bjorge Müller, M.H.; Lyche, J.L.; Polder, A. Heavy Metals in Farmed and Wild Milkfish (Chanos chanos) and Wild Mullet (Mugil cephalus) along the Coasts of Tanzania and Associated Health Risk for Humans and Fish. Chemosphere 2019, 224, 176–186. [Google Scholar] [CrossRef]
  87. Saei-Dehkordi, S.S.; Fallah, A.A.; Nematollahi, A. Arsenic and Mercury in Commercially Valuable Fish Species from the Persian Gulf: Influence of Season and Habitat. Food Chem. Toxicol. 2010, 48, 2945–2950. [Google Scholar] [CrossRef] [PubMed]
  88. Mangalagiri, P.; Bikkina, A.; Sundarraj, D.K.; Thatiparthi, B.R. Bioaccumulation of Heavy Metals in Rastrelliger Kanagurta along the Coastal Waters of Visakhapatnam, India. Mar. Pollut. Bull 2020, 160, 111658. [Google Scholar] [CrossRef] [PubMed]
  89. Moiseenko, T.I.; Gashkina, N.A. Distribution and Bioaccumulation of Heavy Metals (Hg, Cd and Pb) in Fish: Influence of the Aquatic Environment and Climate. Environ. Res. Lett. 2020, 15, 115013. [Google Scholar] [CrossRef]
  90. Moe, S.J.; De Schamphelaere, K.; Clements, W.H.; Sorensen, M.T.; den Brink, P.J.; Liess, M. Combined and Interactive Effects of Global Climate Change and Toxicants on Populations and Communities. Environ. Toxicol. Chem. 2013, 32, 49–61. [Google Scholar] [CrossRef] [Green Version]
  91. Panebianco, F.; Nava, V.; Giarratana, F.; Gervasi, T.; Cicero, N. Assessment of heavy- and semi-metals contamiantion in edible seaweed and dried fish sold in ethnic food stores on the Italian market. J. Food Compos. Anal. 2021, 104, 104150. [Google Scholar] [CrossRef]
  92. Senthil Murugan, S.; Karuppasamy, R.; Poongodi, K.; Puvaneswari, S. Bioaccumulation Pattern of Zinc in Freshwater Fish Channa punctatus (Bloch.) after Chronic Exposure. Turk. J. Fish. Aquat. Sci. 2008, 59, 55–59. [Google Scholar]
  93. Wood, C.M.; Farrell, A.P.; Brauner, C.J. Fish Physiology: Homeostasis and Toxicology of Essential Metals. In Homeostasis and Toxicology of Essential Metals; Academic Press: Waltham, MA, USA, 2011; Volume 31. [Google Scholar]
  94. Nikinmaa, M. An Introduction to Aquatic Toxicology; Elsevier: Amsterdam, The Netherlands, 2014; pp. 1–240. [Google Scholar] [CrossRef]
  95. Mensoor, M.; Said, A. Determination of Heavy Metals in Freshwater Fishes of the Tigris River in Baghdad. Fishes 2018, 3, 23. [Google Scholar] [CrossRef] [Green Version]
  96. Memmert, U. Bioaccumulation of Zinc in Two Freshwater Organisms (Daphnia magna, Crustacea and Brachydanio, Rerio, Pisces). Water Res. 1987, 21, 99–106. [Google Scholar] [CrossRef]
  97. World Health Organization. Daily Iron Supplementation in Adult Women and Adolescent Girls; WHO: Geneva, Switzerland, 2016; p. 44.
  98. Williams, T.M.; Weeks, J.M.; Apostol, A.N., Jr.; Miranda, C.R. Assessment of Mercury Contamination and Human Exposure Associated with Coastal Disposal of Waste from a Cinnabar Mining Operation, Palawan, Philippines. Environ. Geol. 1999, 39, 51–60. [Google Scholar] [CrossRef]
  99. Zhong, W.; Zhang, Y.; Wu, Z.; Yang, R.; Chen, X.; Yang, J.; Zhu, L. Health Risk Assessment of Heavy Metals in Freshwater Fish in the Central and Eastern North China. Ecotoxicol. Environ. Saf. 2018, 157, 343–349. [Google Scholar] [CrossRef] [PubMed]
  100. Łuczyńska, J.; Paszczyk, B.; Łuczyński, M.J. Fish as a Bioindicator of Heavy Metals Pollution in Aquatic Ecosystem of Pluszne Lake, Poland, and Risk Assessment for Consumer’s Health. Ecotoxicol. Environ. Saf. 2018, 153, 60–67. [Google Scholar] [CrossRef]
  101. Chandrapalan, T.; Kwong, R.W.M. Functional Significance and Physiological Regulation of Essential Trace Metals in Fish. J. Exp. Biol. 2021, 224, jeb238790. [Google Scholar] [CrossRef]
  102. Ali, M.M.; Ali, M.L.; Jahan Rakib, M.R.; Islam, M.S.; Bhuyan, M.S.; Senapathi, V.; Chung, S.Y.; Roy, P.D.; Sekar, S.; Md Towfiqul Islam, A.R.; et al. Seasonal Behavior and Accumulation of Some Toxic Metals in Commercial Fishes from Kirtankhola Tidal River of Bangladesh—A Health Risk Taxation. Chemosphere 2022, 301, 134660. [Google Scholar] [CrossRef] [PubMed]
  103. Saleh, Y.S.; Marie, M.-A.S. Assessment of Metal Contamination in Water, Sediment, and Tissues of Arius Thalassinus Fish from the Red Sea Coast of Yemen and the Potential Human Risk Assessment. Environ. Sci. Pollut. Res. 2015, 22, 5481–5490. [Google Scholar] [CrossRef]
  104. Jiang, H.; Qin, D.; Chen, Z.; Tang, S.; Bai, S.; Mou, Z. Heavy Metal Levels in Fish from Heilongjiang River and Potential Health Risk Assessment. Bull. Environ. Contam. Toxicol. 2016, 97, 536–542. [Google Scholar] [CrossRef]
  105. Cai, S.; Ni, Z.; Li, Y.; Shen, Z.; Xiong, Z.; Zhang, Y.; Zhou, Y. Metals in the Tissues of Two Fish Species from the Rare and Endemic Fish Nature Reserve in the Upper Reaches of the Yangtze River, China. Bull. Environ. Contam. Toxicol. 2012, 88, 922–927. [Google Scholar] [CrossRef]
  106. Widianarko, B.; Van Gestel, C.A.M.; Verweij, R.A.; Van Straalen, N.M. Associations between Trace Metals in Sediment, Water, and Guppy, Poecilia Reticulata (Peters), from Urban Streams of Semarang, Indonesia. Ecotoxicol. Environ. Saf. 2000, 46, 101–107. [Google Scholar] [CrossRef] [PubMed]
  107. Senoro, D.B.; de Jesus, K.L.M.; Mendoza, L.C.; Apostol, E.M.D.; Escalona, K.S.; Chan, E.B. Groundwater Quality Monitoring Using In-Situ Measurements and Hybrid Machine Learning with Empirical Bayesian Kriging Interpolation Method. Appl. Sci. 2021, 12, 132. [Google Scholar] [CrossRef]
Figure 1. PPC and the 29 sampling sites of marine and brackish fish.
Toxics 11 00621 g001
Figure 2. Spatial distribution of MMs in brackish water fish. The darker the color, the higher the MMs concentration.
Toxics 11 00621 g002aToxics 11 00621 g002b
Figure 3. Spatial distribution of MMs in marine water fish. The darker the color, the higher the MMs concentration.
Toxics 11 00621 g003aToxics 11 00621 g003bToxics 11 00621 g003c
Figure 4. CDI of MMs in the fish of PPC.
Toxics 11 00621 g004
Figure 5. TTHQ of MMs in the fish of PPC.
Toxics 11 00621 g005
Figure 6. Correlation of MMs in (a) brackish water and (b) marine fish.
Toxics 11 00621 g006
Figure 7. Dendrograms classifying the (a) brackish water fish and (b) marine fish based on THQ.
Toxics 11 00621 g007
Table 2. Range of MM concentrations (mg kg−1) in fish with permissible limits.
FishAsBaCuFeMnHgZn
Brackish<LOD<LOD–6.91<LOD–9.60<LOD–11.21<LOD–12.35<LOD3.83–26.18
Marine<LOD<LOD–6.68<LOD–85.01<LOD–153.660–12.35<LOD–9.710–30.01
FAO/WHO [9,56]--301001-100
JECFA [55]0.002------
EC [54]-----0.5-
Note: FAO/WHO—Food and Agriculture Organization/World Health Organization; JECFA–Joint FAO/WHO Expert Committee on Food Additives; EC—European Commission.
Table 3. The CR of MMs in the fish of PPC.
FishCRRisk [44,56]
Brackish Water0negligible
Marine 1.38 × 10 8 negligible
Table 4. Maximum allowable fish consumption rates (CRlim) (g person−1 day−1).
FishMMsCRlim (Non-Carcinogenic)CRlim (Carcinogenic)
Brackish Water FishAs--
Ba8862.21-
Cu1619.06-
Fe17,219.82-
Mn5423.41-
Hg--
Zn1274.99-
Marine Water FishAs78,750.001750.00
Ba14,629.68-
Cu320.61-
Fe3611.47-
Mn2152.15-
Hg19.77-
Zn1824.69-
Disclaimer/Publisher’s Note: The statements, opinions and data contained in all publications are solely those of the individual author(s) and contributor(s) and not of MDPI and/or the editor(s). MDPI and/or the editor(s) disclaim responsibility for any injury to people or property resulting from any ideas, methods, instructions or products referred to in the content.

