
Pharmaceutical Wastewater Effluent—Source of Contaminants of Emerging Concern: Phytotoxicity of Metronidazole to Soybean (Glycine max)


Abstract
: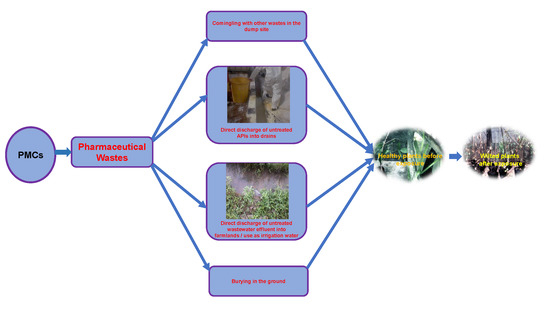
1. Introduction
2. Materials and Methods
2.1. Experimental Design
2.2. Chemicals and Materials
2.3. Soil Analysis
2.3.1. Soil pH
2.3.2. Soil Organic Matter Content
2.4. Seed Planting, Labelling, and Treatment
2.5. Harvesting, Drying, and Weighing
2.6. Relative Growth Rate (RGR) and Statistical Analysis
2.6.1. RGR
2.6.2. Statistical Analysis
3. Results
3.1. Soil Analysis
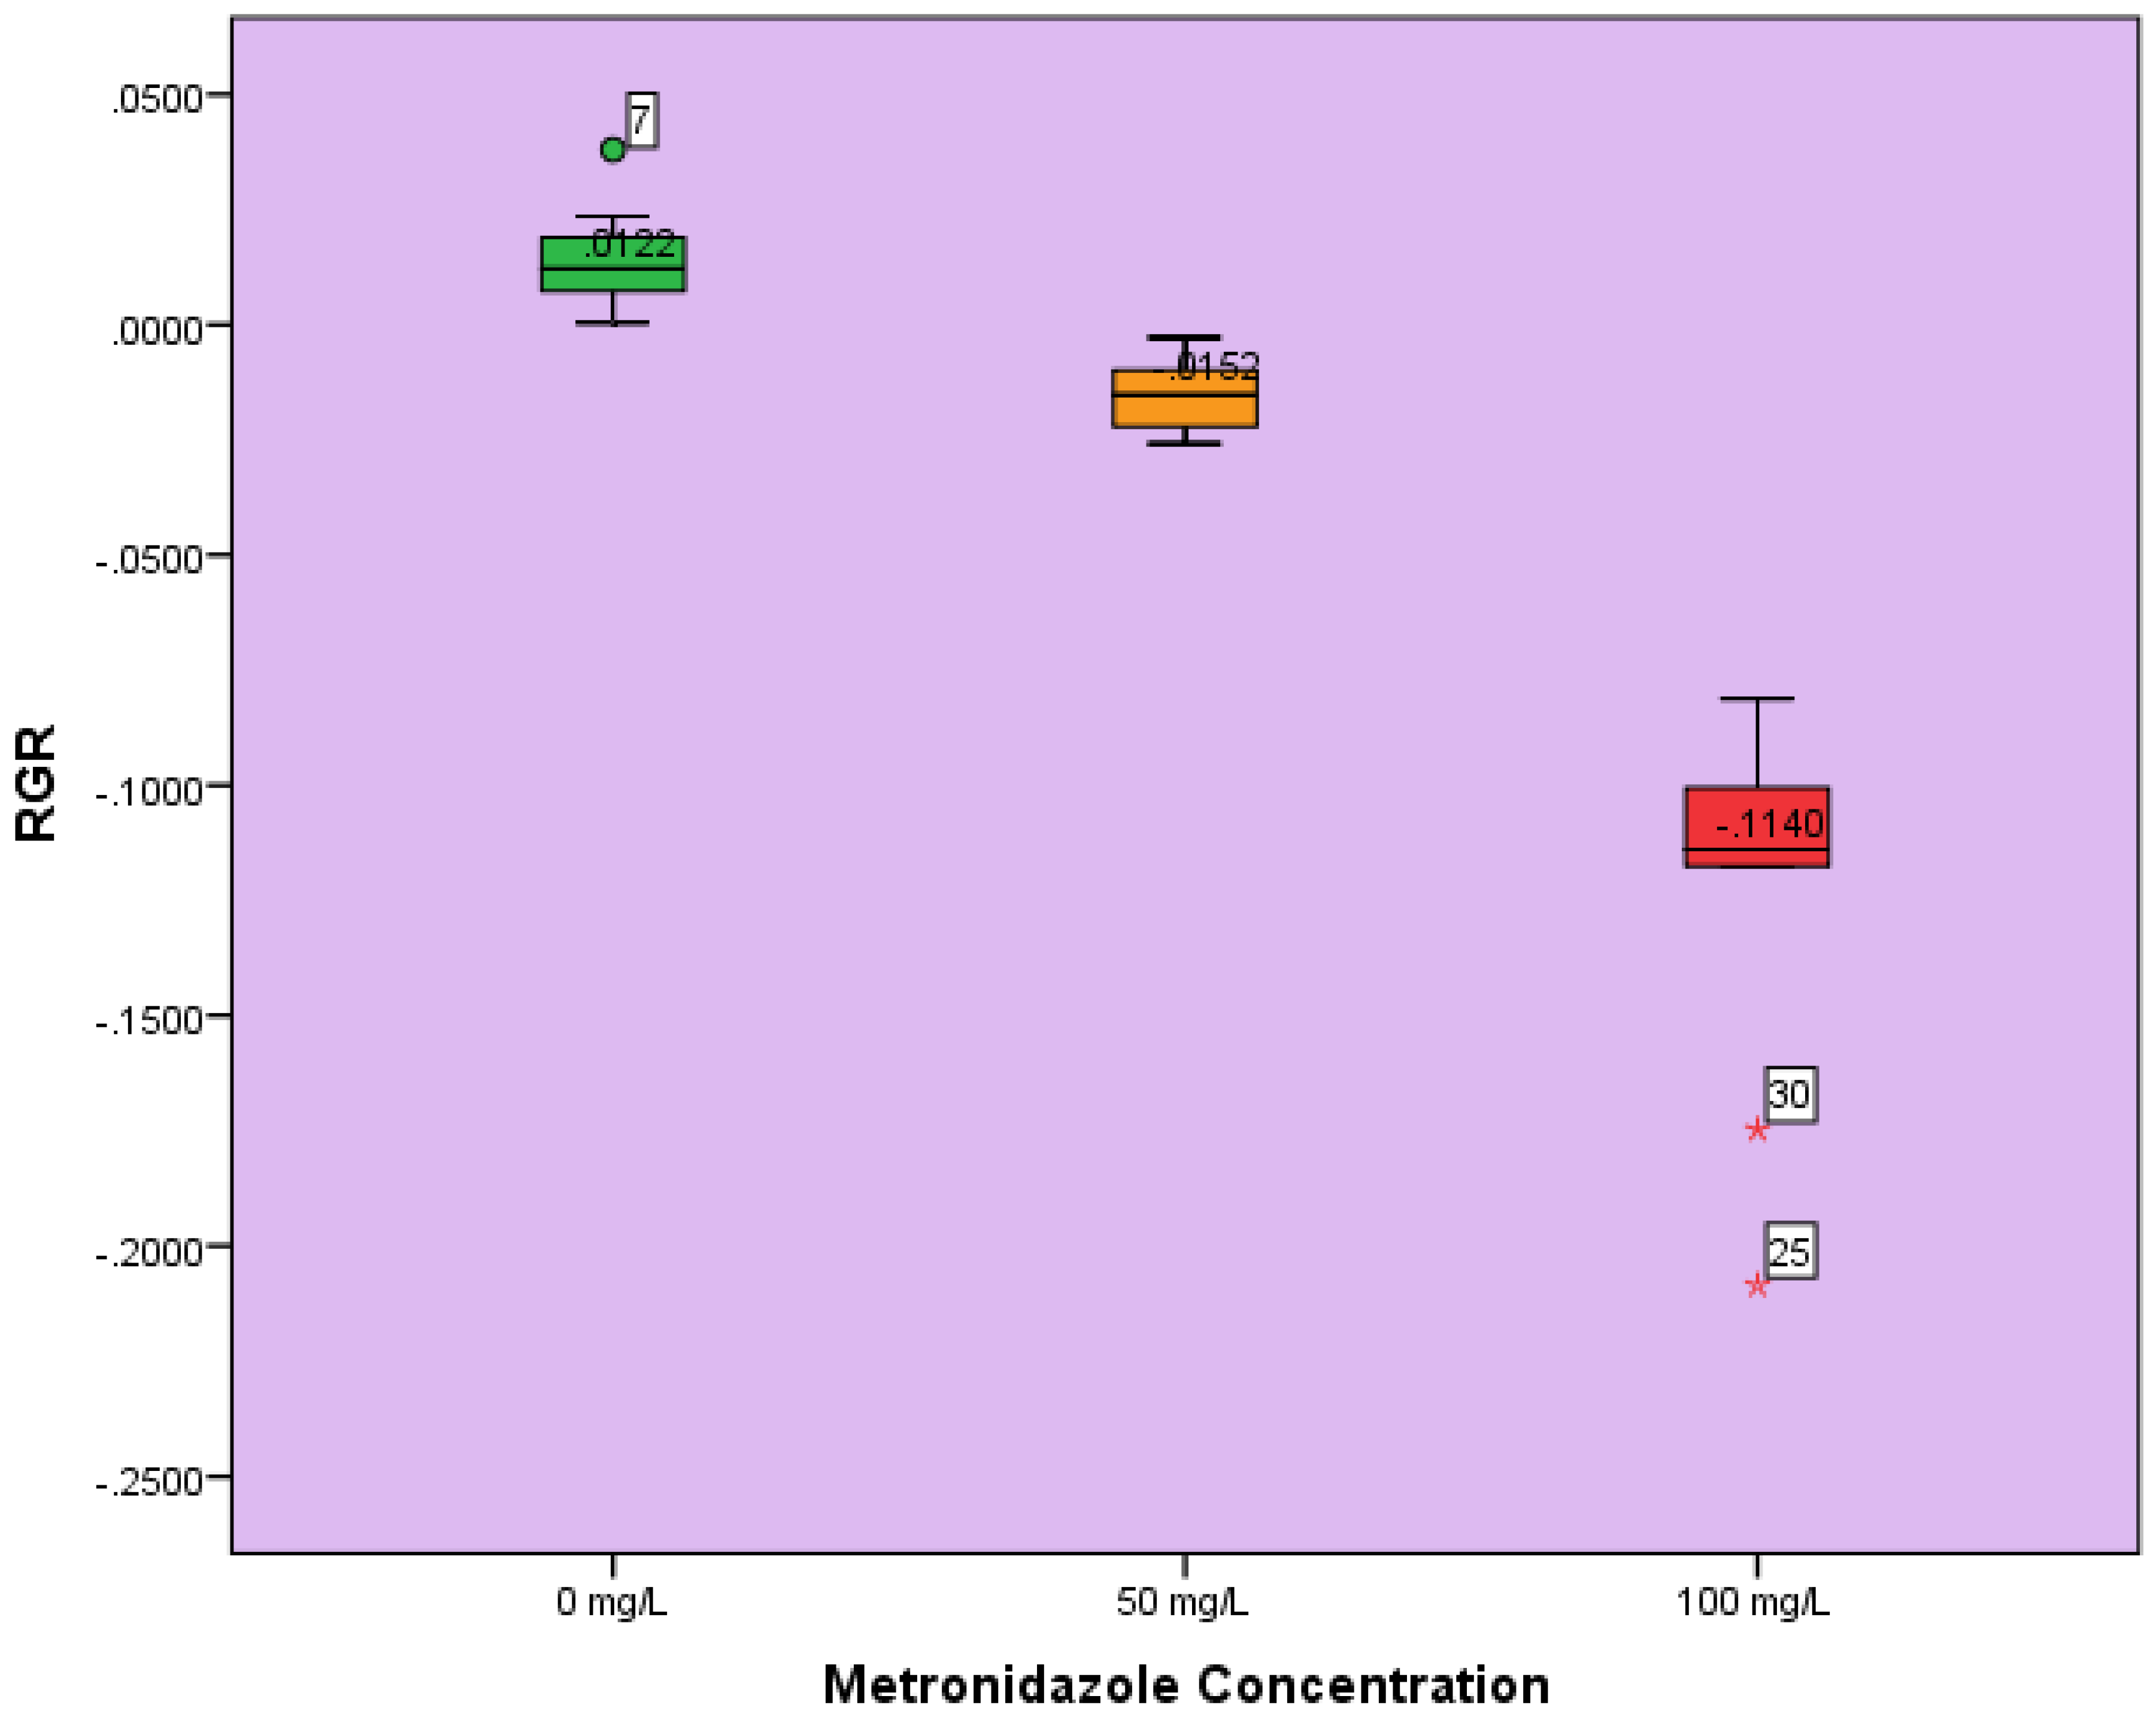
3.2. RGR
3.3. Statistical Analysis
4. Discussion
4.1. Soil Analysis
4.2. RGR, Statistical Analysis and Dose Response
4.3. Uptake and Phytotoxicity
5. Conclusions
Acknowledgments
Conflicts of Interest
References
- Babatunde, A.I.; Bamgbola, E.P.; Oyelola, O.T. The effect of pharmaceutical effluents on the quality of groundwater: A case study of Ikeja industrial area of Lagos, Nigeria. Int. J. Med. Res. Health Sci. 2014, 4. Available online: http://ijsk.org/uploads/3/1/1/7/3117743/1_environmental_pollution.pdf (accessed on 30 December 2016).
- Kümmerer, K. Drugs in the Environment: Emission of Drugs, Diagnostic Aids and Disinfectants into Wastewater by Hospitals In Relation to Other Sources—A Review. Chemosphere 2001, 45, 957–969. [Google Scholar] [CrossRef]
- Bisarya, S.C.; Patil, D.M. Determination of Salicylic-acid and Phenol (ppm level) in Effluent from Aspirin Plant. Res. Ind. 1993, 38, 170–172. [Google Scholar]
- Cui, C.W.; Ji, S.L.; Ren, H.Y. Determination of Steroid Estrogens in Wastewater Treatment Plant of a Contraceptives Producing Factory. Environ. Monit. Assess. 2006, 121, 409–419. [Google Scholar] [CrossRef] [PubMed]
- Larsson, D.G.J.; de Pedro, C.; Paxeus, N. Effluent from Drug Manufactures Contains Extremely High Levels of Pharmaceuticals. J. Hazard. Mater. 2007, 148, 751–755. [Google Scholar] [CrossRef] [PubMed]
- Li, D.; Yang, M.; Hu, J.; Ren, L.; Zhang, Y.; Li, K. Determination and Fate of Oxytetracycline and Related Compounds in Oxytetracycline Production Wastewater and the Receiving River. Environ. Toxicol. Chem. 2008, 27, 80–86. [Google Scholar] [CrossRef] [PubMed]
- Heberer, T. Occurrence, Fate, and Removal of Pharmaceutical Residues in the Aquatic Environment: A Review of Recent Research Data. Toxicol. Lett. 2002, 131, 5–17. [Google Scholar] [CrossRef]
- Cardoso, O.; Porcher, J.; Sanchez, W. Factory-Discharged Pharmaceuticals Could be a Relevant Source of Aquatic Environment Contamination: Review of Evidence and Need for Knowledge. Chemosphere 2014, 115, 20–30. [Google Scholar] [CrossRef] [PubMed]
- Qiting, J.; Xiheng, Z. Combination Process of Anaerobic Digestion and Ozonation Technology for Treating Wastewater from Antibiotics Production. Water Treat. 2008, 3, 285–291. [Google Scholar]
- Sim, W.J.; Lee, J.W.; Lee, E.S.; Shin, S.K.; Hwang, S.R.; Oh, J.E. Occurrence and Distribution of Pharmaceuticals in Wastewater from Households, Livestock Farms, Hospitals and Pharmaceutical Manufactures. Chemosphere 2011, 82, 179–186. [Google Scholar] [CrossRef] [PubMed]
- Phillips, P.J.; Smith, S.G.; Kolpin, D.W.; Zaugg, S.D.; Buxton, H.T.; Furlong, E.T.; Esposito, K.; Stinson, B. Pharmaceutical Formulation Facilities as Sources of Opioids and Other Pharmaceuticals to Wastewater Treatment Plant Effluents. Environ. Sci. Technol. 2010, 44, 4910–4916. [Google Scholar] [CrossRef] [PubMed]
- Fick, J.; Söderström, H.; Lindberg, R.H.; Phan, C.; Tysklind, M.; Larsson, D.G.J. Contamination of Surface, Ground, and Drinking Water from Pharmaceutical Production. Environ. Toxicol. Chem. 2009, 28, 2522–2527. [Google Scholar] [CrossRef] [PubMed]
- Ngwuluka, N.C.; Ochekpe, N.A.; Odumosu, P.O. An Assessment of Pharmaceutical Waste Management in Some Nigerian Pharmaceutical Industries. Afr. J. Biotechnol. 2011, 10, 11259–11264. [Google Scholar] [CrossRef]
- Daughton, C.G.; Ternes, T.A. Pharmaceuticals and Personal Care Products in the Environment: Agents of Subtle Change? Environ. Health Perspect. 1999, 107, 907–938. Available online: https://www.ncbi.nlm.nih.gov/pmc/articles/PMC1566206/pdf/envhper00523-0087.pdf (accessed on 30 December 2016). [CrossRef] [PubMed]
- Wada, A.A. Food Security in Nigeria: The Role of Peasant Farmers in Nigeria. Afr. Res. Rev. 2012, 6, 173–190. [Google Scholar]
- Musa, J.J.; Ogbonnaya, C.; Saidu, M.; Adura, V.I. Evaluation of Drainage Wastewater for Irrigation Farms. IUP J. Environ. Sci. 2010, 4, 61–68. [Google Scholar]
- USDA. Foreign Agricultural Service. Gain Report: Nigeria—Soybeans and products. Available online: https://www.nigerianseminarsandtrainings.com/articlespg/30-gain-report-nigeria--soybeans-and-products (accessed on 4 February 2017).
- U.S. Pharmacopoeia. Metronidazole. Available online: http://www.pharmacopeia.cn/v29240/usp29nf24s0_m53670.html (accessed on 30 December 2016).
- Tally, F.P.; Sullivan, C.E. Metronidazole: In vitro activity, pharmacology and efficacy in anaerobic bacterial infections. Pharmacotherapy 1981, 1, 28–38. [Google Scholar] [CrossRef] [PubMed]
- Bendesky, A.; Menéndez, D.; Ostrosky-Wegman, P. Is metronidazole carcinogenic? Mutat. Res. Rev. Mutat. Res. 2002, 511, 133–144. [Google Scholar] [CrossRef]
- Yu, L.; Liu, H.E.L.; Wu, X.; Wang, D. Uptake of metronidazole by human gingival fibroblasts. J. Periodontol. 2009, 80, 993–998. [Google Scholar] [CrossRef] [PubMed]
- Freeman, C.D.; Klutman, N.E.; Lamp, K.C. Metronidazole. A Therapeutic Review and Update. Drugs 1997, 54, 679–708. [Google Scholar] [CrossRef] [PubMed]
- Nigerian Bulletin. Five Drugs Commonly Abused By Nigerians and Their Adverse Effects. 2015. Available online: https://www.nigerianbulletin.com/threads/5-drugs-commonly-abused-by-nigerians-and-their-adverse-effects.113260/ (accessed on 5 February 2017).
- Uchendu, U.O.; Ikemefuna, A.N.; Emodi, I.J. Medication Use and Abuse in Childhood Diarrhoeal Diseases by Caregivers Reporting to a Nigerian Tertiary Health Institution. SAJCH 2009, 3, 83–89. [Google Scholar]
- Rabølle, M.; Spliid, N.H. Sorption and mobility of Metronidazole, Oloquindox, Oxytertacycline and Tylosin in Soil. Chemosphere 2000, 40, 715–722. [Google Scholar] [CrossRef]
- Richardson, M.L.; Bowron, J.M. The Fate of Pharmaceutical Chemicals in the Aquatic Environment. J. Pharm. Pharmacol. 1985, 37, 1–12. [Google Scholar] [CrossRef] [PubMed]
- Halling-Sørensen, B.; Nielsen, S.N.; Lanzky, P.F.; Ingerster, F.; Lutzhøff, H.C.H.; Jørgensen, S.E. Occurrence, Fate and Effects of Pharmaceutical Substances in the Environment—A Review. Chemosphere 1998, 36, 357–393. [Google Scholar] [CrossRef]
- Kummerer, K.; Al-Ahmad, A.; Mersch-Sundermann, V. Biodegradability of Some Antibiotics, Elimination of the Genotoxicity and Affection of Wastewater Bacteria in a Simple Test. Chemosphere 2000, 40, 701–710. [Google Scholar] [CrossRef]
- Jjemba, P.K. The Effect of Chloroquine, Quinacrine, and Metronidazole on both Soybean Plants and Soil Microbata. Chemosphere 2002, 46, 1019–1025. [Google Scholar] [CrossRef]
- Zuccato, E.; Castiglioni, S.; Fanelli, R. Identification of the Pharmaceuticals for Human Use Contaminating the Italian Aquatic Environment. J. Hazard. Mater. 2005, 122, 205–209. [Google Scholar] [CrossRef] [PubMed]
- Zuccato, E.; Castiglioni, S.; Fanelli, R.; Reitano, G.; Bagnati, R.; Chiabrando, C.; Pomati, F.; Rossetti, C.; Calamari, D. Pharmaceuticals in the Environment in Italy: Causes, Occurrence, Effects and Control. Environ. Sci. Pollut. Res. 2006, 13, 15–21. [Google Scholar] [CrossRef]
- Ternes, T.A. Occurrence of Drugs in German Sewage Treatment Plants and Rivers. Water Res. 1998, 32, 3245–3260. [Google Scholar] [CrossRef]
- Azanu, D.; Mortey, C.; Darko, G.; Weisser, J.J.; Styrishave, B.; Abaidoo, C.R. Uptake of Antibiotics from Irrigation Water by Plants. Chemosphere 2016, 157, 107–114. [Google Scholar] [CrossRef] [PubMed]
- Sacher, F.; Lange, F.T.; Brauch, H.; Blankenhorn, I. Pharmaceuticals in Groundwaters: Analytical Methods and Results of a Monitoring Program in Baden-Württemberg, Germany. J. Chromatogr. A 2001, 938, 199–210. [Google Scholar] [CrossRef]
- Blackman, G.E. The Quantitative Analysis of Plant Growth. J. Ecol. 1973, 61, 617–619. [Google Scholar] [CrossRef]
- Sim, W.J.; Lee, J.W.; Lee, E.S.; Shin, S.K.; Hwang, S.R.; Oh, J.E. Occurrence and Distribution of Pharmaceuticals in Wastewater from Households, Livestock Farms, Hospitals and Pharmaceutical Manufactures. Chemosphere 2011, 82, 179–186. [Google Scholar] [CrossRef] [PubMed]
- Blume, L.J.; Schumacher, P.W. Handbook of methods for Acid Deposition Studies Laboratory Analysis for Soil Chemistry; EPA/600/4-90/023; U.S. Environmental Protection Agency: Las Vegas, NV, USA, 1990.
- ASTM. Standard Test Methods for Moisture, Ash, and Organic Matter of Peat and Other Organic Soils. Method D 297400; American Society for Testing and Materials: West Conshohocken, PA, USA, 2000. [Google Scholar]
- Orzolek, M.D. Organic Matter Application—Can You Apply Too Much? Available online: https://pubs.ext.vt.edu/2906/2906-1316/2906-1316_pdf.pdf (accessed on 30 December 2016).
- Encyclopedia Britannica. Soybean Plant. Available online: https://www.britannica.com/plant/soybean (accessed on 30 December 2016).
- Johnson, R.R. Soybeans: Improvement, Production, and Uses, 2nd ed.; Agronomy Monograph: Madison, WI, USA, 1987. [Google Scholar]
- O’Neil, M.J. The Merck Index—An Encyclopedia of Chemicals, Drugs, and Biologicals, 13th ed.; Merck and Co. Inc.: Whitehouse Station, NJ, USA, 2001; p. 1095. [Google Scholar]
- Migliore, L.; Cozzolino, S.; Fiori, M. Phytotoxicity to and Uptake of Enrofloxacin in Crop Plants. Chemosphere 2003, 52, 1233–1244. [Google Scholar] [CrossRef]
- Raloff, J. Pharm Pollution: Excreted Antibiotics Can Poison Plants. Sci. News 2002, 161, 406–407. [Google Scholar] [CrossRef]
- Batchelder, A.R. Chlortetracycline and Oxytetracycline Effects on Plant Growth and Development in Soil Systems. J. Environ. Qual. 1982, 11, 675–678. [Google Scholar] [CrossRef]
- Batchelder, A.R. Chlortetracycline and Oxytetracycline effects on plant growth and development in liquid cultures. J. Environ. Qual. 1981, 10, 515–518. [Google Scholar] [CrossRef]
- Hatzinger, P.B.; Alexander, M. Biodegradation of organic compounds sequestered in organic solids or in Nanopores within silica particles. Environ. Toxicol. Chem. 1997, 16, 2215–2221. [Google Scholar] [CrossRef]
- OECD. Test No. 106: Adsorption—Desorption Using a Batch Equilibrium Method, OECD Guideline for the Testing of Chemicals, Section 1; OECD Publishing: Paris, France, 2000. [Google Scholar]
- Musa, J.J.; Ogbonanya, C.; Mohammed, S.; Valentine, A.I. Evaluation of Drainage Wastewater for Irrigation Farms. IUP J. Environ. Sci. 2010, 4, 61–68. [Google Scholar]
- Carvalho, P.N.; Basto, M.C.; Almeida, C.M.; Brix, H. A Review of Plant-Pharmaceutical Interactions: From Uptake and Effects in Crop Plants to Phytoremediation in Constructed Wetlands. Environ. Sci. Pollut. Res. Int. 2014, 21, 11729–11763. [Google Scholar] [CrossRef] [PubMed]
- Farkas, M.H.; Mojica, E.R.; Patel, M.; Aga, D.S.; Berry, J.O. Development of a Rapid Biolistic Assay to Determine Changes in Relative Levels of Intracellular Calcium in Leaves following Tetracycline Uptake by Pinto Bean Plants. Analyst 2009, 134, 1594–1600. [Google Scholar] [CrossRef] [PubMed]
- Kong, W.D.; Zhu, Y.G.; Liang, Y.C.; Zhang, J.; Smith, F.A.; Yang, M. Uptake of Oxytetracycline and its Phytotoxicity to Alfalfa (Medicago sativa L.). Environ. Pollut. 2007, 147, 187–193. [Google Scholar] [CrossRef] [PubMed]
- D’Abrosca, B.; Fiorentino, A.; Izzo, A.; Cefarelli, G.; Pascarella, M.T.; Uzzo, P.; Monaco, P. Phytotoxicity Evaluation of Five Pharmaceutical Pollutants Detected in Surface Water on Germination and Growth of Cultivated and Spontaneous Plants. J. Environ. Sci. Health A Toxic Hazard. Subst. Environ. Eng. 2008, 43, 285–294. [Google Scholar] [CrossRef] [PubMed]
- Li, Z.-J.; Xie, X.-Y.; Zhang, S.-Q.; Liang, Y.-C. Negative Effects of Oxytetracycline on Wheat (Triticum Aestivum L.) Growth, Root Activity, Photosynthesis, and Chlorophyll Contents. Agric. Sci. China 2011, 10, 1545–1553. [Google Scholar] [CrossRef]
- Bartha, B.; Huber, C.; Harpaintner, R.; Schröder, P. Effects of Acetaminophen in Brassica juncea L. Czern.: Investigation of Uptake, Translocation, Detoxification, and the Induced Defense Pathways. Environ. Sci. Pollut. Res. 2010, 17, 1553–1562. [Google Scholar] [CrossRef] [PubMed]

| Harvesting | Replicates | |||||||||
|---|---|---|---|---|---|---|---|---|---|---|
| 5 d | A1 | B1 | C1 | D1 | E1 | F1 | G1 | H1 | I1 | J1 |
| 10 d | A2 | B2 | C2 | D2 | E2 | F2 | G2 | H2 | I2 | J2 |
| S. No. | 1 | 2 | 3 | 4 | 5 | 6 | 7 | 8 | 9 | 10 | Mean |
|---|---|---|---|---|---|---|---|---|---|---|---|
| Control | 7.00 | 7.10 | 7.06 | 7.12 | 7.00 | 6.95 | 7.24 | 6.89 | 6.94 | 7.00 | 7.04 |
| 50 mg/L | 6.58 | 6.96 | 6.82 | 6.96 | 6.80 | 6.86 | 6.81 | 6.98 | 6.75 | 6.58 | 6.82 |
| 100 mg/L | 6.54 | 6.58 | 6.74 | 6.75 | 6.72 | 6.56 | 6.14 | 6.16 | 6.23 | 6.57 | 6.49 |
| Replicates | W1 | W2 | ln W1 | ln W2 | ln W2 − ln W1 | RGR |
|---|---|---|---|---|---|---|
| 1 | 1.2113 | 1.3624 | 0.1917 | 0.3092 | 0.1175 | 0.0235 |
| 2 | 1.2393 | 1.3621 | 0.2145 | 0.3090 | 0.0945 | 0.0189 |
| 3 | 1.4584 | 1.5577 | 0.3773 | 0.4432 | 0.0659 | 0.0132 |
| 4 | 1.4432 | 1.5548 | 0.3669 | 0.4413 | 0.0744 | 0.0149 |
| 5 | 1.2567 | 1.3143 | 0.2285 | 0.2733 | 0.0448 | 0.0089 |
| 6 | 1.2746 | 1.3058 | 0.2426 | 0.2668 | 0.0242 | 0.0048 |
| 7 | 0.8185 | 0.9900 | −0.2003 | −0.0101 | 0.1902 | 0.0380 |
| 8 | 0.9560 | 1.1059 | −0.0450 | 0.1007 | 0.0557 | 0.0111 |
| 9 | 1.1130 | 1.1547 | 0.1071 | 0.1438 | 0.0367 | 0.0073 |
| 10 | 1.1643 | 1.1665 | 0.1521 | 0.1540 | 0.0019 | 0.0004 |
| Replicates | W1 | W2 | ln W1 | ln W2 | ln W2 − ln W1 | RGR |
|---|---|---|---|---|---|---|
| 1 | 0.8760 | 0.8639 | −0.1324 | −0.1463 | −0.0139 | −0.0028 |
| 2 | 0.8758 | 0.8248 | −0.1326 | −0.1926 | −0.0599 | −0.0119 |
| 3 | 0.8429 | 0.7410 | −0.1709 | −0.2998 | −0.1288 | −0.0258 |
| 4 | 0.8429 | 0.7683 | −0.1709 | −0.2636 | −0.0927 | −0.0185 |
| 5 | 0.7830 | 0.7248 | −0.2446 | −0.3219 | −0.0772 | −0.0154 |
| 6 | 0.7509 | 0.7162 | −0.2865 | −0.3338 | −0.0473 | −0.0095 |
| 7 | 0.6708 | 0.6006 | −0.3993 | −0.5098 | −0.1105 | −0.0221 |
| 8 | 0.6903 | 0.6404 | −0.3706 | −0.4457 | −0.0750 | −0.0150 |
| 9 | 0.8004 | 0.7619 | −0.2226 | −0.2719 | −0.0493 | −0.0099 |
| 10 | 0.8488 | 0.7491 | −0.1639 | −0.2889 | −0.01250 | −0.0250 |
| Replicates | W1 | W2 | ln W1 | ln W2 | ln W2 − ln W1 | RGR |
|---|---|---|---|---|---|---|
| 1 | 0.6726 | 0.4482 | −0.3966 | −0.8025 | −0.4059 | −0.0812 |
| 2 | 0.6684 | 0.4292 | −0.4029 | −0.8458 | −0.4430 | −0.0886 |
| 3 | 0.6613 | 0.3784 | −0.4135 | −0.9718 | −0.5583 | −0.1117 |
| 4 | 0.6317 | 0.3509 | −0.4593 | −1.0473 | −0.5880 | −0.1176 |
| 5 | 0.6233 | 0.3541 | −0.4727 | −1.0382 | −0.5655 | −0.1131 |
| 6 | 0.6176 | 0.3441 | −0.4819 | −1.0668 | −0.5849 | −0.1170 |
| 7 | 0.5415 | 0.3315 | −0.6134 | −1.1041 | −1.0428 | −0.2086 |
| 8 | 0.5765 | 0.3245 | −0.5508 | −1.1255 | −0.5747 | −0.1149 |
| 9 | 0.5127 | 0.3100 | −0.6681 | −1.1712 | −0.5031 | −0.1006 |
| 10 | 0.5040 | 0.2103 | −0.6852 | −1.5592 | −0.8740 | −0.1748 |
© 2017 by the author. Licensee MDPI, Basel, Switzerland. This article is an open access article distributed under the terms and conditions of the Creative Commons Attribution (CC BY) license (http://creativecommons.org/licenses/by/4.0/).
Share and Cite
Yakubu, O.H. Pharmaceutical Wastewater Effluent—Source of Contaminants of Emerging Concern: Phytotoxicity of Metronidazole to Soybean (Glycine max). Toxics 2017, 5, 10. https://doi.org/10.3390/toxics5020010
Yakubu OH. Pharmaceutical Wastewater Effluent—Source of Contaminants of Emerging Concern: Phytotoxicity of Metronidazole to Soybean (Glycine max). Toxics. 2017; 5(2):10. https://doi.org/10.3390/toxics5020010
Chicago/Turabian StyleYakubu, Okhumode H. 2017. "Pharmaceutical Wastewater Effluent—Source of Contaminants of Emerging Concern: Phytotoxicity of Metronidazole to Soybean (Glycine max)" Toxics 5, no. 2: 10. https://doi.org/10.3390/toxics5020010