
Do 16 Polycyclic Aromatic Hydrocarbons Represent PAH Air Toxicity?


Desert Research Institute, Division of Atmospheric Sciences, 2215 Raggio Parkway, Reno, NV 89512, USA
*
Authors to whom correspondence should be addressed.
Toxics 2017, 5(3), 17; https://doi.org/10.3390/toxics5030017
Submission received: 30 June 2017
/
Revised: 9 August 2017
/
Accepted: 10 August 2017
/
Published: 15 August 2017
(This article belongs to the Special Issue Health Effects of Airborne Particles, Gases and Aerosols: Current and Future Perspectives)
Abstract
:Estimation of carcinogenic potency based on analysis of 16 polycyclic aromatic hydrocarbons (PAHs) ranked by U.S. Environmental Protection Agency (EPA) is the most popular approach within scientific and environmental air quality management communities. The majority of PAH monitoring projects have been focused on particle-bound PAHs, ignoring the contribution of gas-phase PAHs to the toxicity of PAH mixtures in air samples. In this study, we analyzed the results of 13 projects in which 88 PAHs in both gas and particle phases were collected from different sources (biomass burning, mining operation, and vehicle emissions), as well as in urban air. The aim was to investigate whether 16 particle-bound U.S. EPA priority PAHs adequately represented health risks of inhalation exposure to atmospheric PAH mixtures. PAH concentrations were converted to benzo(a)pyrene-equivalent (BaPeq) toxicity using the toxic equivalency factor (TEF) approach. TEFs of PAH compounds for which such data is not available were estimated using TEFs of close isomers. Total BaPeq toxicities (∑88BaPeq) of gas- and particle-phase PAHs were compared with BaPeq toxicities calculated for the 16 particle-phase EPA PAH (∑16EPABaPeq). The results showed that 16 EPA particle-bound PAHs underrepresented the carcinogenic potency on average by 85.6% relative to the total (gas and particle) BaPeq toxicity of 88 PAHs. Gas-phase PAHs, like methylnaphthalenes, may contribute up to 30% of ∑88BaPeq. Accounting for other individual non-EPA PAHs (i.e., benzo(e)pyrene) and gas-phase PAHs (i.e., naphthalene, 1- and 2-methylnaphthalene) will make the risk assessment of PAH-containing air samples significantly more accurate.

1. Introduction
Polycyclic aromatic hydrocarbons (PAHs) are widespread organic species in the environment, originating from a variety of sources including wild forest and peat fires [1,2,3], volcano emissions [4,5], and different biological processes [6,7]. For example, biogenic PAHs can be formed due to biosynthesis by microorganisms, phytoplankton, algae, highly developed plants or termite activities [8,9,10]. Atmospheric anthropogenic emissions of PAHs are mainly caused by the combustion of carbon-based fuels [6], such as fossil fuels [11,12,13,14], wood [15,16,17,18], peat [19], agricultural biomass [20,21,22,23], and animal waste [24,25,26]. Anthropogenic emissions of PAHs significantly exceed their natural sources [27,28]. Shen et al. [29] showed that in 2007, global total atmospheric emission of the 16 U.S. EPA priority PAHs (16EPAPAHs) was 504 Gg, with biomass fuels combustion, mainly firewood and crop residues, contributing the most (approximately 60.5% of the total global PAH emissions). PAHs are of great environmental concern because of their widespread abundance [1,29,30,31,32,33] combined with high toxicity, mutagenic and/or carcinogenic health effects [34,35]. Carcinogenic effects of PAHs are due to their ability to bind to DNA [36,37,38,39], with many studies showing positive correlation between levels of PAH-DNA adduct formation in different organs and PAH doses [40,41].
There are several routes of PAH exposure, including water, food, tobacco smoke, pharmaceutical products, etc. [35,42,43]. Ambient air is one of the major sources of PAH intake [44,45]. Airborne PAHs are present in both gas and particle phases. Low molecular weight PAHs that have 2–3 aromatic rings in their structure (i.e., naphthalene, methylnaphthalenes, acenaphthylene, fluorene) are mainly present in the gas phase, while heavier PAHs (with four or more aromatic rings, i.e., pyrene, benz(a)anthracene, benzo-fluoranthenes) are usually associated with atmospheric particulate matter (PM) [46,47,48,49]. The U.S. EPA set the regulation for 16 PAHs [50], which were selected based on knowledge of their relative toxicity, abundance, chance of exposure, and levels in the environmental samples [35]. TEFs have been only determined for 17 reasonably-well studied PAHs [51]—the 16 EPA priority PAHs (Table S1) and 2-methylnaphthalene. However, the number of PAHs present in the environment is significantly larger and very little is known about their carcinogenic properties [35]. For this reason, most of air pollution studies have focused on sources, emission factors, and toxic effects of these 16-17 PAHs [2,23,34,52,53,54]. Since nine out of the 16 EPA PAHs are mostly present in the particle phase, research has been focused on analysis of particle-bound PAHs, largely ignoring gas-phase PAHs. Yet, gas-phase PAHs may have a strong carcinogenic health impact [35,42]. For example, several toxicological studies reported a link between naphthalene exposure and a number of adverse health outcomes such as nasal cancer [55,56,57,58]. It needs to be emphasized, that only a very little fraction of this compound (a few %) is found in the particle phase and most of naphthalene mass is usually present in the gas phase [48,59,60].
In order to estimate health effects of different pollutants, the toxicity equivalency factor (TEF) methodology was developed by the U.S. Environmental Protection Agency (EPA) [61] and adapted for PAH compounds [51]. TEF represents the toxicity of an individual PAH compound relative to the reference chemical—benzo(a)pyrene. Benzo(a)pyrene is the most studied PAH for carcinogenic properties [62] and, for this reason, it was selected as the reference compound. To calculate the toxicity potential of a specific PAH, its concentration is multiplied by the determined TEF value. The total potential carcinogenic potency of PAH mixtures in air samples is determined by summing up concentrations of individual PAHs, which are multiplied by the determined TEFs of individual PAHs [51]. The International Agency for Research on Cancer (IARC) classifies PAHs by their toxic potencies as probable (2A) and possible (2B) carcinogens [35] and the following PAHs have been highlighted: benzo(a)pyrene, dibenz(a,h)anthracene, benz(a)anthracene, chrysene, benzo(b)fluoranthene, benzo(k)-fluoranthene, benzo(ghi)perylene, and indeno(1,2,3-c,d)pyrene.
Only a few studies have performed quantitative analyses on more than the 16 airborne PAHs for both gas and particle phases. Our group performed measurements of over 70 gas and particle phase PAHs in different vehicle emissions [11,63,64], biomass-burning [65,66], and meat cooking samples [67]. Kameda et al. [68] collected filters and polyurethane foam (PUFs) cartridges to analyze 22 gas and particle-phase atmospheric PAHs (16 EPA priority PAHs and additional high risk PAHs recommended by WHO/IPCS [69]) to evaluate PAH toxicity and to study deposition of these species in different regions of the human respiratory tract. The 16 EPA priority PAHs were analyzed by Black et al. [70] and Cereceda-Balic et al. [71] to characterize the distribution of these compounds between gas and particle phases in biomass-burning emissions. Analysis of gas-particle distribution of urban and suburban PAHs was presented by several groups [14,46,48,72]. In Vasilakos [72] and Gregoris [47] studies, for example, Teflon-impregnated glass fiber (TIGF) filters and PUFs were used to collect particle and gas-phase species, but concentration levels of only the 16 specified PAHs were measured.
Most health risk assessment studies have also been focused on the analysis of only the 16 EPA priority PAHs, with PM-bound PAHs being analyzed most extensively. Muendo et al. [73] presented measurements of 25 PAHs; however only filter samples were collected and characterized for particulate PAHs. Delgado-Saborit et al. [74] estimated the carcinogenic potential of 16 particle-phase PAHs in different outdoor and indoor environments. Sources and cancer risk assessments of 26 PM2.5-bound PAHs were analyzed by Bandowe et al. [75] in the air of a mega city in China. Allen et al. [76] measured a total of 41 PAHs at rural and urban Massachusetts areas to study the distribution of these PAHs between particles of different sizes. However, the scope of these studies with extended lists of analyzed PAHs has been limited only to the analysis of particle phase.
Many studies [35] have used the 16 U.S. EPA PAHs due to their recognized toxicity by the scientific community in the late 1960s and early 70s. Analytical capabilities and standard materials available at that time imposed some limitations on the selection of PAHs and thus further health risk assessment. At present, a larger number of PAH compounds can be analyzed simultaneously. That opens a discussion for whether other PAH compounds should be recognized as priority PAHs and studied for their toxic properties.
This paper presents an analysis of results from a unique set of 13 projects in which 88 PAHs were measured in both particle and gas phases. PAH samples were collected from different types of sources (biomass burning, vehicle emissions, meat cooking, mining operations and urban air). The goal of this study was to compare TEF-based carcinogenic potency of the 16 U.S. EPA PAHs with the total TEF-based carcinogenic potency of the measured 88 PAHs in both phases and to determine whether measurements of only the 16 U.S. EPA particle-bound PAHs adequately represent the total potential toxicity of PAHs originating from different sources. Using the TEF approach, the relative importance of gaseous and particulate PAHs, as well as the most prominent contributors to the total PAH toxicity in different sources were determined.
2. Experimental
2.1. Materials and Reagents
Certified PAH standards were purchased from Sigma-Aldrich (St. Louis, MO, USA), AccuStandard (New Haven, CT, USA), and Cambridge Isotope Laboratories, Inc. (Andover, MA, USA). Acetonitrile, acetone, methanol, and dichloromethane (High-Performance Liquid Chromatography grade) were obtained from Fisher Scientific (Fair Lawn, NJ, USA). TIGF filters (Fiber Film T60A20, PALL Life Sciences, Ann Arbor, MI, USA) and XAD-4 resin (Amberlite® XAD4, St. Louis, MO, USA) were used as sampling media. Prior to sampling, XAD-4 resin was cleaned using an accelerated solvent extractor (ASE, DIONEX, ASE-300, Salt Lake City, UT, USA) with methanol followed by dichloromethane for 15 min each at 85 °C and 1500 psi pressure. Clean XAD-4 resin was dried in a vacuum oven at room temperature overnight. Glass (Tisch Environmental, Inc., Village of Cleves, OH, USA) and stainless-steel Teflon-coated cartridges (homemade DRI’s cartridges) were packed with 20–200 g of XAD-4 resin depending on the project (Table 1) and expected concentration levels of PAHs. Every 10th blank XAD-4 cartridge and TIGF filter were extracted on ASE and analyzed with gas chromatography mass spectrometry (GC-MS) to determine their purity. Ultra-high purity (UPH) grade nitrogen was purchased from Airgas (Sparks, NV, USA).
2.2. Sampling
Gas- and particle-phase PAH concentrations were measured during several projects aimed at the characterization of: urban ambient air (A-1, A-2), biomass burning (B-1), meat cooking (M-1), engine exhaust (E1–E5), traffic emissions in a road tunnel (T-1, T-2), and mining operations (Mi-1, Mi-2) (Table 1). In total, 325 filter and XAD samples (650 individual samples) were collected, extracted, and analyzed. Detailed descriptions of sampling campaigns can be found in previously published papers and reports (Table 1). Briefly, particulate matter (PM) was collected using medium and high-volume samplers at different flow rates depending on the project (Table 1). TIGF filters (Fiber Film T60A20, PALL Life Sciences, Ann Arbor, MI, USA) were used to collect PM for PAH analysis. Gas-phase semi-volatile PAHs were collected with XAD-4 resin cartridges that were placed downstream of the filters.
After sampling, each filter and XAD cartridge was packed into pre-cleaned aluminum foil, sealed in secure static-sensitive double-track zipper bags (Uline, Pleasant Prairie, WI, USA), and transported in a cooler with blue ice to DRI, where it was stored at −20 °C until extraction and analysis. A detailed description of the extraction and GC-MS analysis are described elsewhere [13,79].
2.3. Calculation of BaPeq Toxicity
To estimate the carcinogenic potency of analyzed PAHs, TEF values proposed by Nisbet and LaGoy [51] were applied. TEFs are widely used to calculate toxicities of PAH mixtures based on the toxicity of a specific PAH compound relative to the toxicity of the reference compound—benzo(a)pyrene. The potential cancer risk associated with exposure to PAH mixtures is calculated by summing up the concentrations of individual PAH compounds, multiplied by their TEF values (Table S1). TEF values were not available for all 88 PAHs measured in this study. TEFs have been determined for only 17 PAHs [51], including the 16 EPA priority PAHs [acenaphthylene, acenaphthene, fluorine, phenanthrene, anthracene, fluoranthene, pyrene, benz(a)anthracene, chrysene, benzo(b)fluoranthene, benzo(k)fluoranthene, benzo(a)pyrene, dibenz(a,h)anthracene, benzo(ghi)perylene, indeno(1,2,3-cd)pyrene), and 2-methylnaphthalene (Table S1)]. TEFs for the remaining 71 PAHs were estimated based on the similarity of a compound to one of the 17 PAHs whose TEFs are known. Compounds were considered similar if they are close isomers, have the same number of aromatic rings, GC-MS response factors, and similar molecular structure. For example, for 1-methylnaphthalene, the TEF of 2-methylnaphthalene (0.001) [51] was used since these compounds are isomers and are structurally similar. The same TEF (0.001) was applied for dimethyl- and trimethylnaphthalenes, because GC-MS response factors of these PAHs are similar to methylnaphthalene and because chemical structures of these compounds differ only by the presence of one or two methyl (-CH3) groups. The TEF proposed for anthracene (0.01) was used to calculate the BaPeq concentrations for methylanthracenes and different benz(a)anthracenes like 7-methylbenz(a)anthracene and 7,12-dimethylbenz(a)anthracene. In the case of fluoranthenes [1 + 3-methylfluoranthene, 4-methylfluoranthene, benzo(ghi)fluoranthene, etc.], TEF of fluoranthene (0.001) was applied. TEFs of four isomers of dibenzopyrene [dibenzo(a,e)pyrene (TEF: 1), dibenzo(a,l)pyrene (TEF: 10), dibenzo(a,i)pyrene (TEF: 10), dibenzo(a,h)pyrene (TEF: 10)] were assigned using values provided by Office of Environmental Health Hazard Assessment (OEHHA) report [80]. It has to be emphasized that TEFs assigned based on analytical criteria described above may not adequately reflect the real toxicological properties of non-EPA PAHs. Since to our knowledge, there are no toxicological studies on these compounds, we used this approach to estimate the relative importance of the non-EPA PAHs and selected those that deserved a more thorough toxicological characterization. It should be also noted that 75% of the assigned TEFs (Table S2) had the lowest TEF value (0.001), which makes overestimation of their toxicity less likely. Table S2 summarizes TEFs that were assigned to the 88 PAHs measured in this study. BaPeq concentrations of PAH mixtures in different samples were then calculated using the following formula:
where Ci—concentration of PAH compound i (in ng m3); TEFi—assigned toxic equivalency factor (Table S2).
Total BaPeq concentrations of 16 EPA priority PAHs (∑16BaPeq) were calculated using the same formula, but this was applied only to the 16 EPA PAHs [51].
3. Results and Discussion
Measured PAH concentrations varied significantly from project to project, because of the differences in the nature of each sampling project (see Experimental Section). For example, the concentration of gas-phase naphthalene measured during controlled combustion of five different fuels [78] was 2637 ± 929 ng m−3 on average, while its concentration in ambient urban air in downtown Reno (NV, USA) was more than 10 times lower (167 ± 71 ng m−3). To estimate the carcinogenic potency of PAH-containing samples (Table 1), the sum of BaPeq concentrations of 88 (∑88BaPeq) and 16 (∑16BaPeq) gas- and particle-phase PAHs, respectively, were calculated for each project and summarized in Table S3. As expected, ∑BaPeq values vary significantly from project to project because of the differences in PAH concentrations observed during each project (Table 1). For example, the mean ∑88BaPeq value for particle-phase PAHs during the biomass-burning project was 41.3 ± 22.1 ng m−3, which was significantly higher than that of the measured urban PM (project A-1), where the ∑88BaPeq was 0.341 ± 0.242 ng m−3.
To compare the total BaPeq toxicity of the 16 EPA particle-phase PAHs with that of 88 PAHs (∑88BaPeq), as well as with BaPeq toxicities that include gas-phase PAHs, the following ∑BaPeq ratios were calculated for each sample collected during the 13 projects considered here (Table S4):
The above ratios helped us to assess whether the 16 EPA particle-bound PAHs were sufficient for evaluation of the total PAH toxicity of aerosols originating from different sources. Ratios close to 1 would indicate that the 16 EPA PAHs adequately represented the total toxicity, while lower ratios will provide an estimate of how much the PAH toxicity is underestimated by the traditional 16-PAH method. Summary statistics of these ratios for each project are given in Table S4. For simplicity, only the mean values of the ∑BaPeq ratios will be discussed in the text below.
Figure 1 presents a graphical summary of BaPeq(%)I ratios [Equation (2)]. BaPeq(%)I that considered only particle-phase PAHs did not exceed 60% in any of the analyzed projects. The particle-bound 16 EPA priority PAHs were found to be responsible, on average, only for 21–58% of the PM PAH toxicity (Table S4). The lowest project-average BaPeq(%)I (~21%) was observed for heavy-duty vehicle engine emissions (project E-5, Table S4). It should be noted that within each project there were BaPeq(%)I observations that were significantly lower than the project-average values. These results indicated that PAHs not included in the EPA priority list contributed more to the PM toxicity than the 16 EPA PAHs, especially in the case of heavy-duty vehicle emissions (E-projects, Table 1 and Table S4). Analysis of BaPeq values for individual 88 PAHs showed the dominance of dibenzo(a,i)pyrene (25%), benzo(e)pyrene (24%), benzo(a)pyreneEPA (14%), benz(a)anthraceneEPA (11%), dibenzo(a,h)pyrene (9%), and benzo(b)fluorantheneEPA (5%) in the total PM∑88BaPeq toxicity of heavy-duty vehicle emissions (Figure S1, project E-5). As can be seen, only three out of six listed top PAHs were EPA priority compounds, which accounted for only 31% of PM∑88BaPeq levels. In the case of biomass-burning samples (project B-1), the EPA priority PAHs contributed more to the total PM PAH toxicity (∑88BaPeq) than to the heavy-duty engine emissions (E-1), on average making up to 57.5% of the total PM∑88BaPeq. The dominant PAHs in biomass-burning samples were benzo(a)pyreneEPA (37%), benzo(e)pyrene (30%), benz(a)anthraceneEPA (6%), benzo(b)fluorantheneEPA (5%), dibenzo(ah)anthraceneEPA (4%), benzo(j)fluoranthene (3%). Overall, non-EPA PAHs were responsible for 42.5% of the PM∑88BaPeq (Figure S1, project B-1), which was still a significant contribution to the PAH toxicity level. Delgado-Saborit et al. [74] reported that the main contributor to the carcinogenic potency of PM PAH mixtures in different indoor and outdoor environments is benzo(a)pyrene, which was in agreement with our results. However, in their study, only 16 EPA PAHs were measured, and thus the carcinogenic potency of non-EPA PAHs has been overlooked.
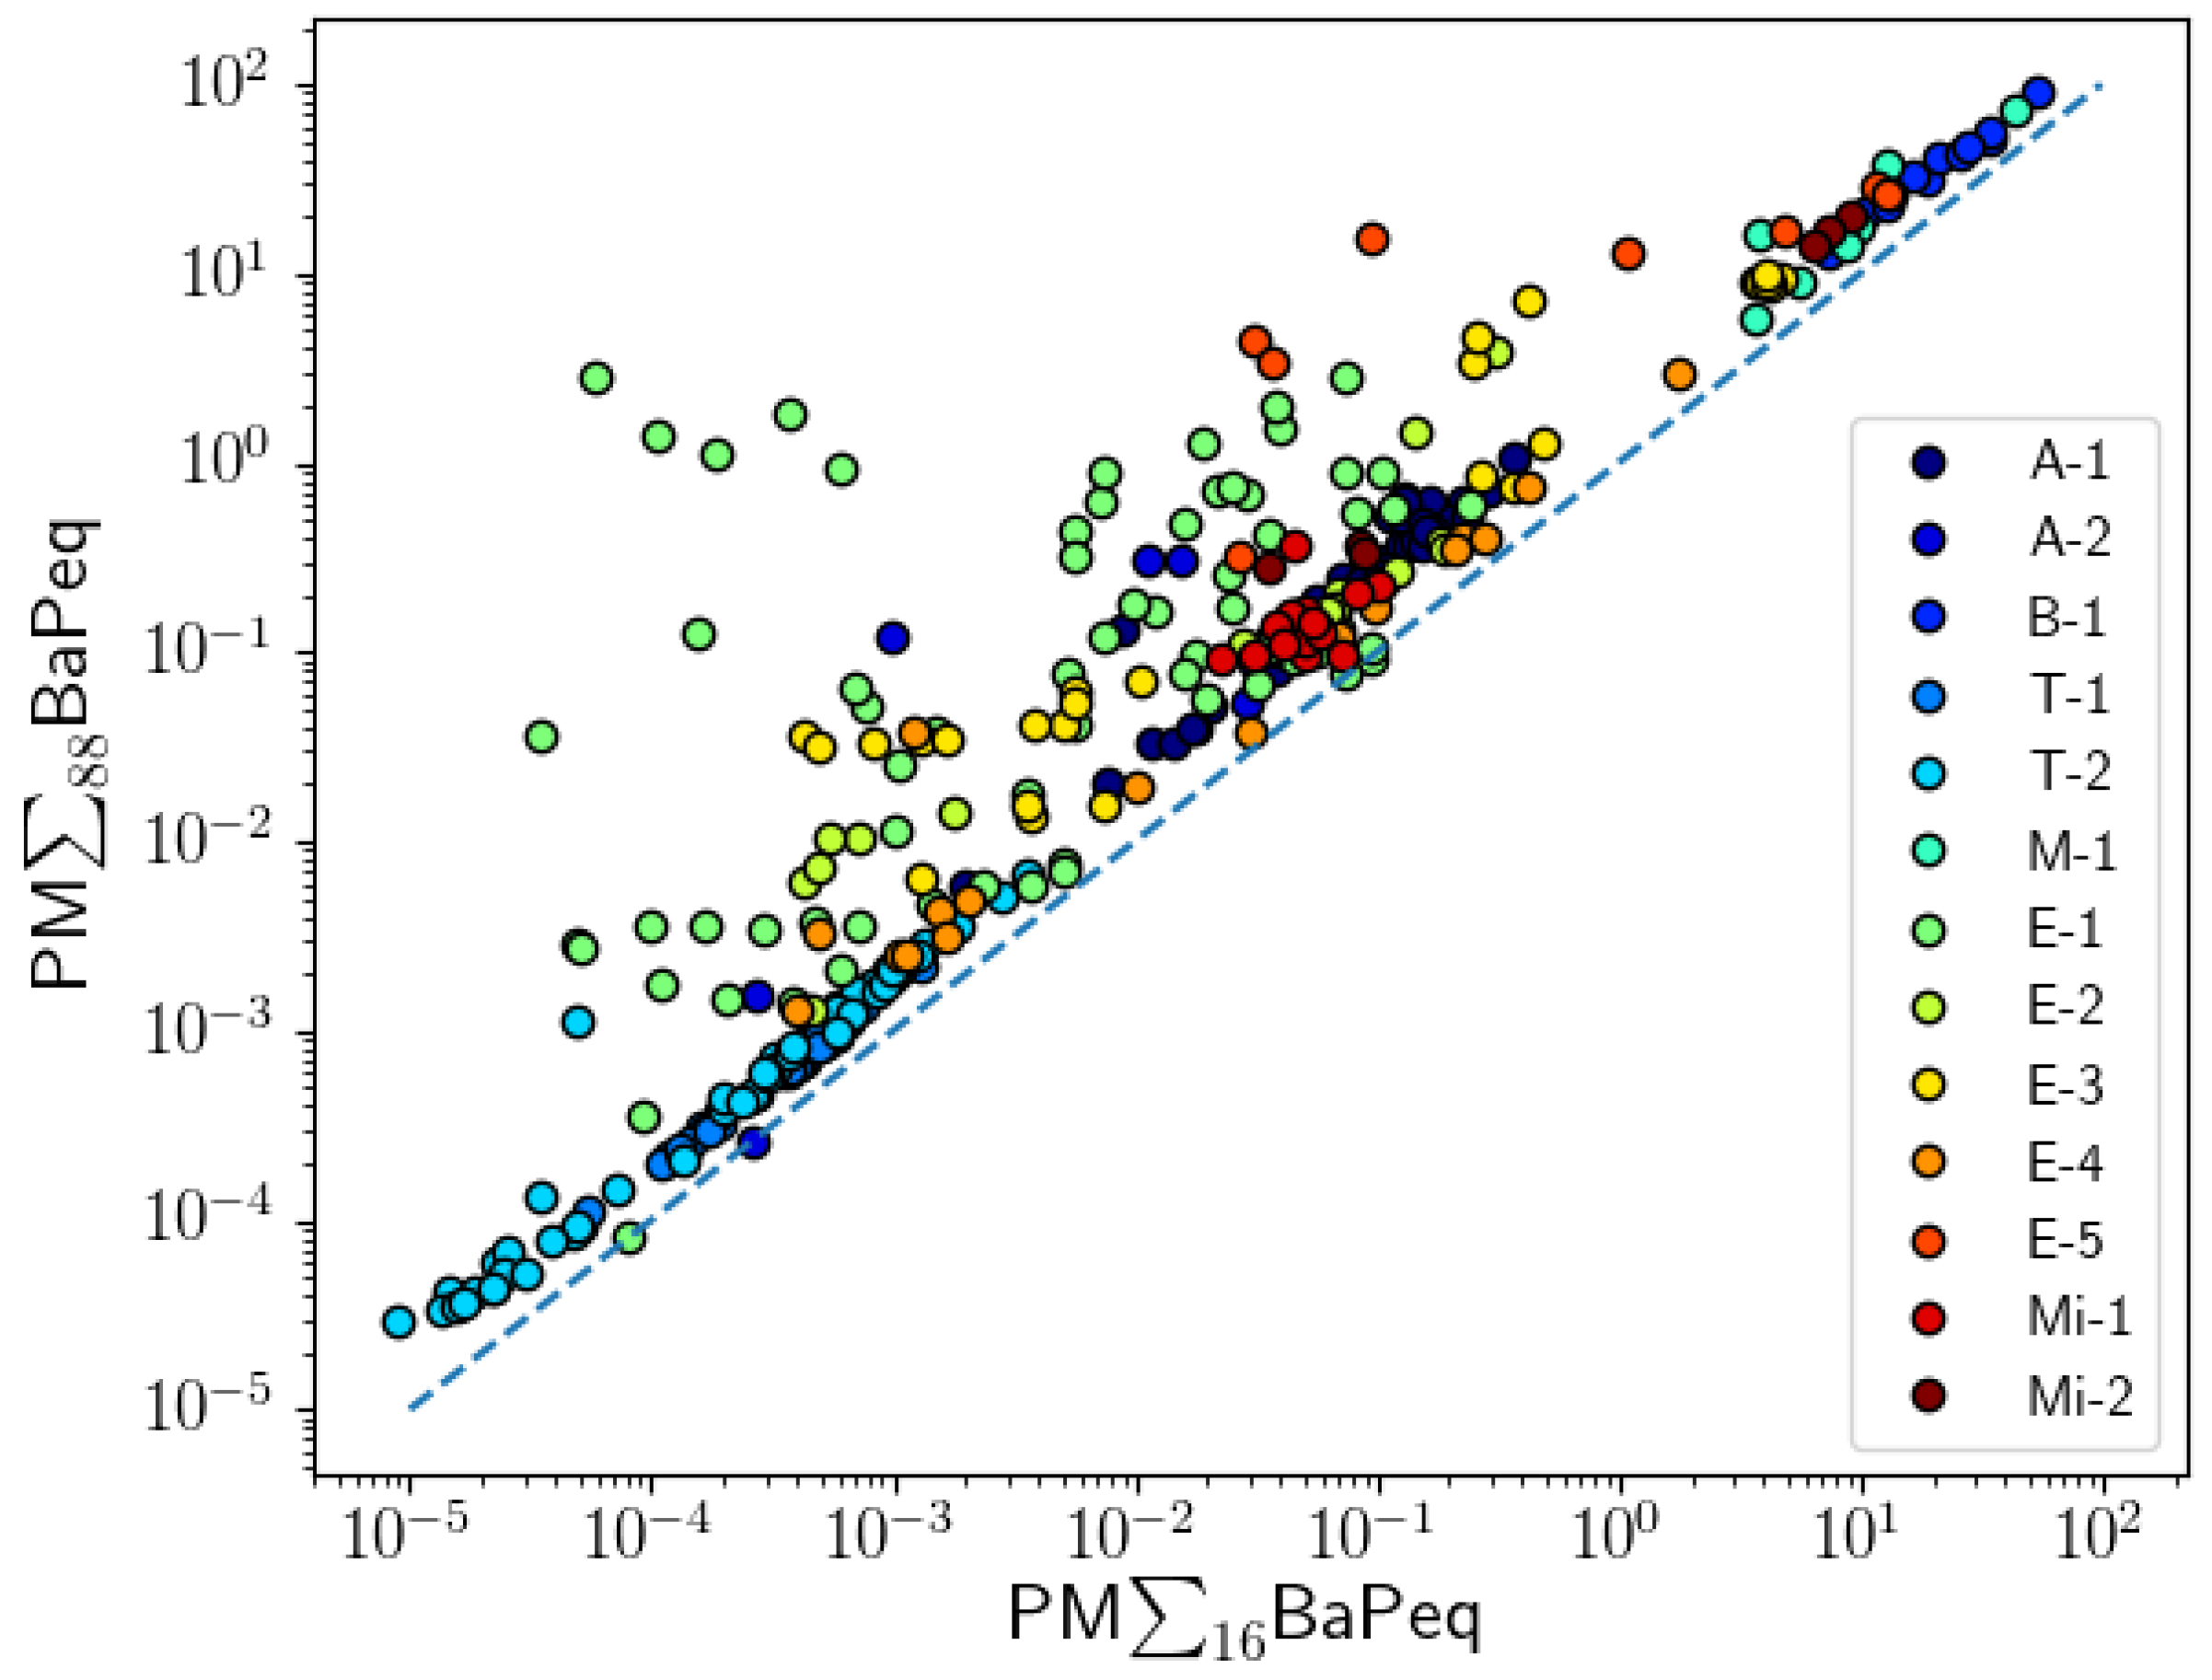
A comparison between PM BaPeq values of the 16 EPA priority PAHs and the 88 analyzed PM PAHs showed positive liner correlations for all projects (Figure 2, Table 2). The correlations were calculated using Spearman’s approach. A strong linear relationship was observed for most of the projects: both tunnel studies (T-1: r = 0.981; T-2: r = 0.987), PM samples collected at the LAX airport (A-1: r = 0.917), during controlled biomass combustion experiments (B-1, r = 0.991), one project on mining pollutants (Mi-2: r = 0.943), and analysis of meat cooking emissions (M-1: r = 0.893). Good correlations between BaPeq of the 16 EPA PAHs and those of the 88 PAHs were observed for PM emissions from vehicle engines, except for the E-1 project where a poor correlation was obtained (r = 0.507). Poor correlations were also observed for one mining project (Mi-1: r = 0.450) and for the filter samples collected in the Reno city area (A-2, r = 0.657). The lack of a correlation (PM∑16BaPeq and PM∑88BaPeq) shows that, in general, the total ∑BaPeq toxicity cannot be reliably extrapolated based on measurements of the 16 EPA priority PAHs.
As was mentioned above, many ambient PAH studies have been focused on characterization of particle-phase PAHs, while gas-phase PAH species have been underrepresented in air quality projects so far. It has been emphasized in the literature [35,81] that high molecular weight PAH compounds (with four or more aromatic rings) are more toxic, and thus analysis of PM, especially PM2.5, is more important than gas phase measurements. At the same time, light PAHs with 2–3 aromatic rings, such as naphthalene and naphthalene derivatives, are mainly present in the gas phase. Measurements of only PM PAHs, thus could underestimate the total PAH toxicity of air samples [60]. The contribution of gas phase PAHs to the total PAH carcinogenic potency was evaluated using two equations: the BaPeq(%)II ratio [Equation (3)] and the BaPeq(%)III ratio [Equation (4)].
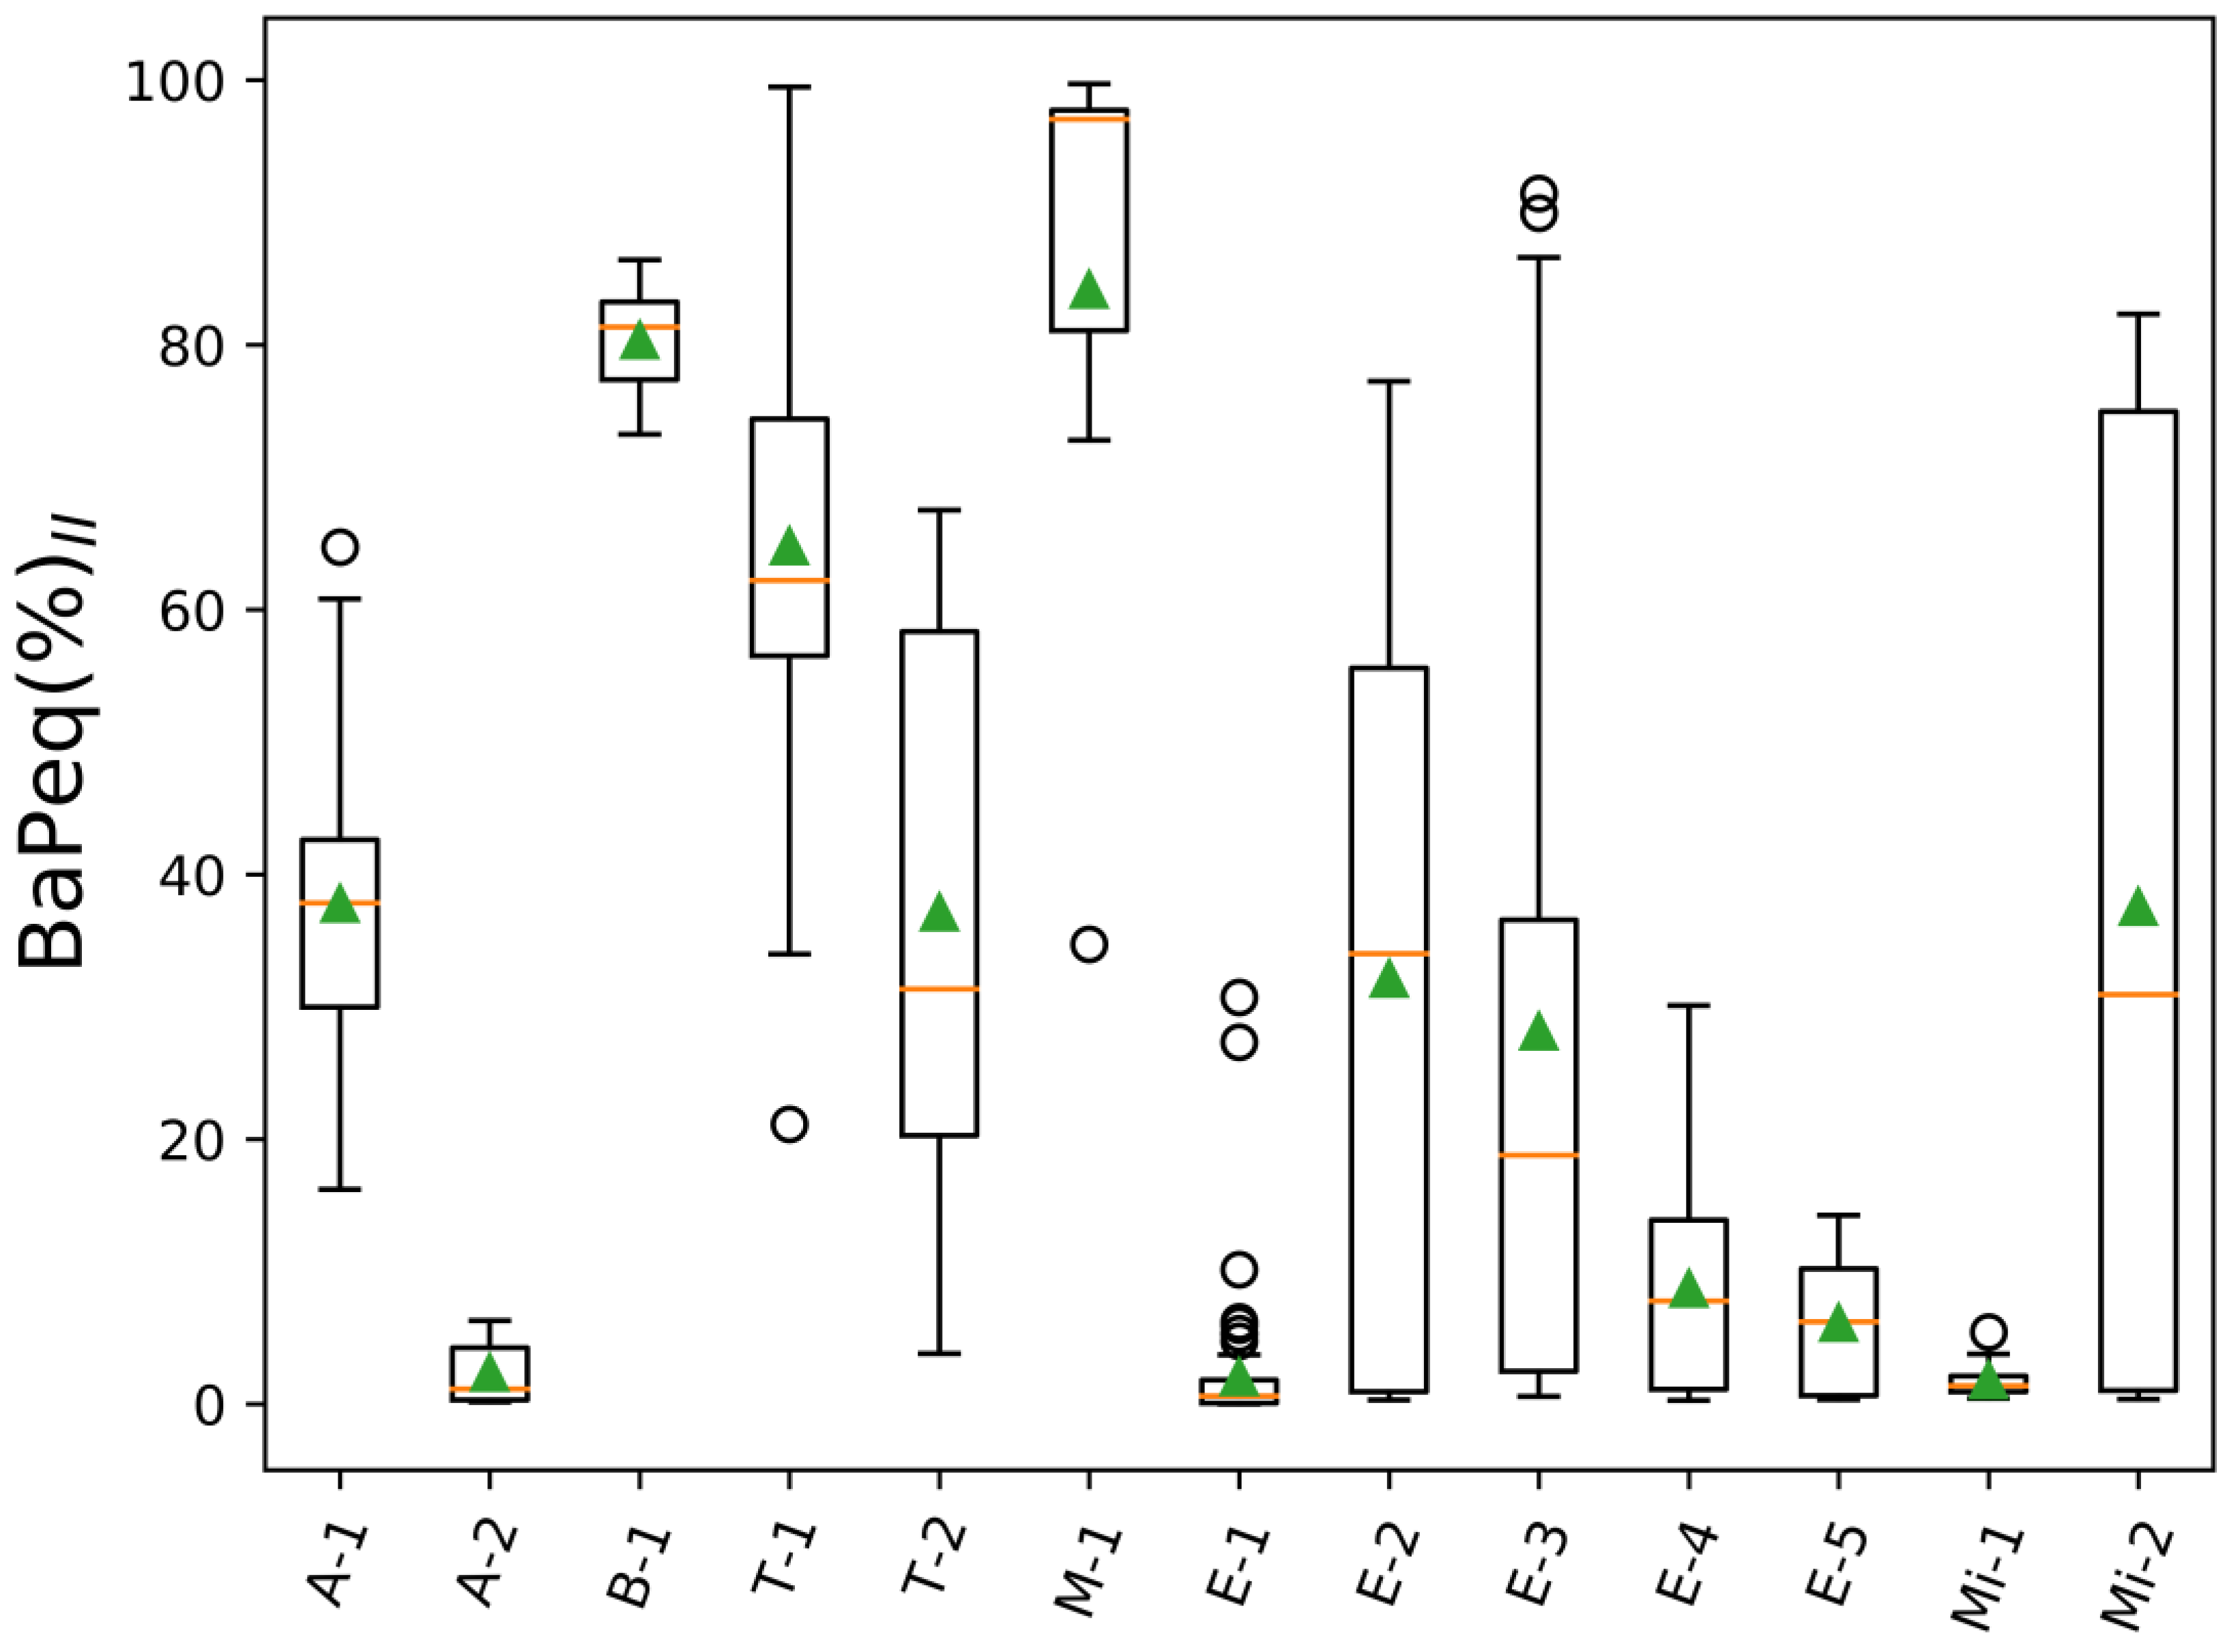
Equation (3) represents the contribution of the particle phase of the 16 EPA priority PAHs to their total (gas + particles) toxicity, (PM + Gas)∑16BaPeq. BaPeq(%)II ratios for all analyzed projects are summarized in Figure 3 and Table S4. The ratios varied significantly from project to project, and ranged between 1.8% and 84%. A dominant contribution of the 16 gas-phase EPA priority PAHs to (PM + Gas)∑16BaPeq was observed for A-2, E-1, E-4, E-5, and Mi-1 projects, where the 16 EPA particle-bound PAHs were responsible only for 2.3, 2.0, 8.7, 6.1, and 1.8%, respectively. The contribution of the gas-phase PAHs to the total toxicity of the 16 EPA was also larger than that of the particle-phase 16 PAHs for most of the other projects (A-1, T-2, E-2, E-3, Mi-2)—the particle-phase 16 PAHs contributed, on average, between 28% and 38%. Only for three projects (B-1, T-1, and M-1), the 16 particle-bound EPA PAHs had a significant contribution to the (PM + Gas)∑16BaPeq toxicity—above 50%. Moreover, we also found that within one project, the distribution of PAHs between gas and particle phases and, therefore, their PM BaPeq contribution, varies significantly. Our study of traffic emissions at the Fort McHenry tunnel (Baltimore, MD, USA) showed that the contribution of the particle-phase EPA PAHs to the total 16 PAH toxicity (or ∑16BaPeq) is larger in winter (T-1, BaPeq(%)II = 64.8%) than in summer (T-2, BaPeq(%)II = 37.1%). During this study, summer temperatures were on average 29 °C, ranging from 25 °C to 31 °C, while in winter, temperatures were on average 0.2 °C, ranging from −9.1 °C to 13.7 °C. Gas-particle partitioning of semi-volatile compounds shifts to the gas phase at higher temperature [48,82,83], which explains the stronger contribution of gas-phase PAHs during summer months of this project. It should be also noted that the gas-particle partitioning of PAHs and other semi-volatile compounds depends not only on ambient temperature, but also on the concentration of particle-phase organics [83]. Thus, dilution of emitted PAHs and mixing with organic aerosols from other sources could change gas-particle partitioning of semi-volatile PAHs. Measurements of only particle-phase PAHs represent particle-phase toxicity only at the conditions of the measurements and cannot be used to estimate toxicity at other conditions.
To illustrate how much the PAH carcinogenic potency of analyzed air samples would change if 88 gas- and particle-phase PAHs are taken into account instead of only 16 particle phase EPA priority PAHs, BaPeq(%)III ratios [Equation (4)] were calculated (Table S4, Figure 4). BaPeq(%)III ratios for six projects (B-1, E-1, E-3, E-4, E-5, Mi-1) were below 10% (range: 0.2–7.4%); for four projects (A-1 T-2, E-2, Mi-2) these ratios were not higher than 20% (A-1: 14.8%; T-2: 15.6%; E-2: 10.3%; Mi-2: 15.1%); and for the remaining three projects BaPeq(%)III values were 41.9% (B-1), 30.8% (T-1), and 41.3% (M-1). As would be expected, all BaPeq(%)III ratios were significantly lower (2–10 times) than BaPeq(%)II, since the contribution of all 88 PAHs and the gas phase were taken into account. Therefore, assuming that our assignment of TEF values to the non-EPA PAHs adequately represents their benzo(a)pyrene equivalent toxicity, the 16 EPA PAHs significantly underestimated the carcinogenic potency of PAH mixtures in all of the scenarios considered in this study. Moreover, several toxicological studies emphasized that PAHs in mixtures can have additive or synergistic health effects [84,85] and thus, risk assessment based on limited number PAH compounds most likely underestimates the total carcinogenic potency of complex PAH mixtures. Figure 5 shows the top six contributors to the total BaPeq toxicity ([PM + Gas]∑88BaPeq) for each individual project. In the majority of the projects, the following compounds substantially contributed to the total BaPeq toxicity: benzo(a)pyrene (16.8 ± 9.2%), naphthalene (15.1 ± 7.1%), benzo(e)pyrene (14.4 ± 7.0%), 2-methylnaphthalene (8.6 ± 3.8%), and 1-methylnaphthalene (5.7 ± 2.1%). It has to be noted that three out of five top listed PAHs were not the EPA priority compounds (1-methylnaphthalene, 2-methylnaphthalene, and benzo(e)pyrene). Moreover, 1- and 2-methylnaphthalenes are low molecular weight PAHs, which are usually found in the gas phase [47,48,72,82]. For some of the projects different PAHs contributed significantly to the overall and gas-phase BePeq toxicity. For example, 2,4,5-trimethylnaphthalene was the second top contributor in the gas phase biomass-burning emissions (project B-1, 9.9%), while for mining samples (Mi-1), 7-methylbenzo(a)pyrene was the second top gas phase PAH, contributing 18.9% to the ∑88BePeq toxicity (Figure S2).
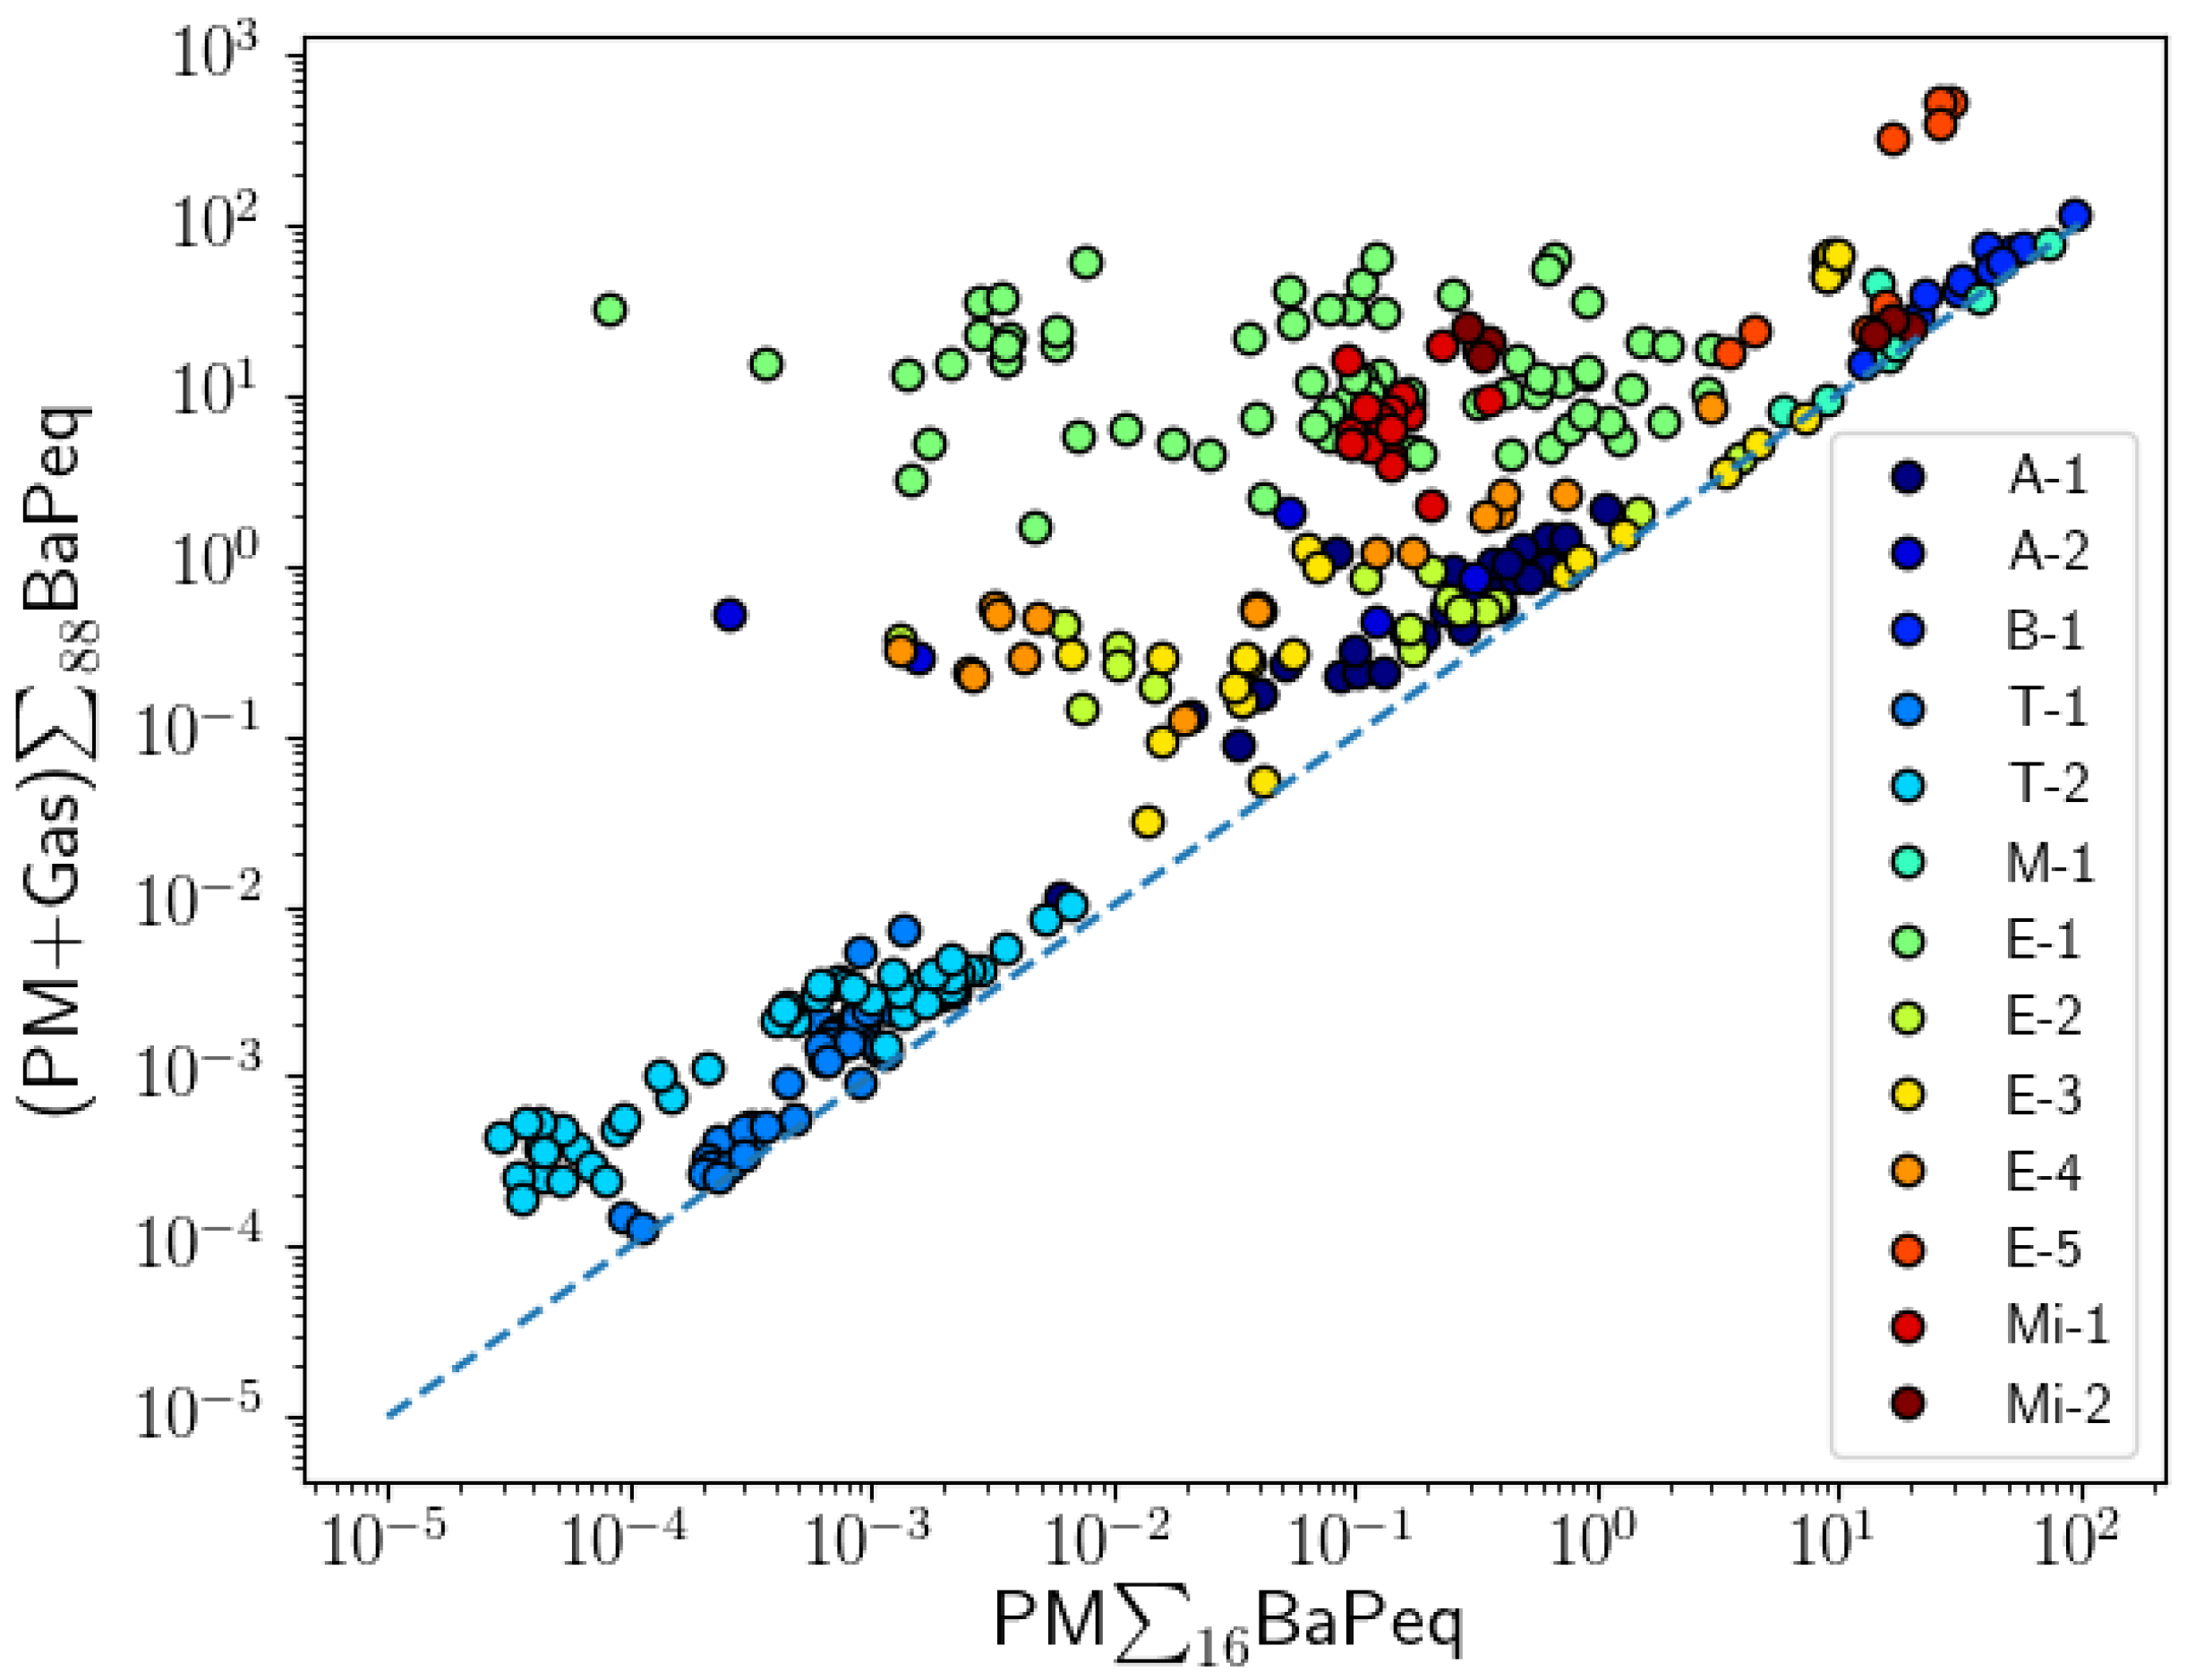
It is clear that the “PM-only analysis” approach could significantly underestimate the carcinogenic potency of PAH mixtures. Similar conclusions have been presented by Ramirez et al. [60]. In their work, 18 gas and particle-phase PAHs have been analyzed in air samples collected near industrial cities, and the contribution of gas-phase PAHs to the total BaPeq was found to be significant (34–86%). The 16 EPA PAHs could still be used for toxicity predictions if their BaPeq toxicity correlates well with the BaPeq toxicity of all PAH compounds in the mixture. Correlation coefficients of PM∑16BaPeq with (PM + Gas)∑88BaPeq are presented in Figure 6 and Table 2. Significantly positive correlations (r > 0.8) were observed for eight projects (A-1, A-2, B-1, T-1, T-2, M-1, E-3, E-4, E-5), suggesting that the total carcinogenic potency observed in these projects could be estimated using measurements of only the 16 EPA particle-phase PAHs. However, poor correlations were observed among similar types of PAH sources: E-1 (r = 0.054) vs. E-5 (r = 0.917). This shows that applying a correction factor to PM∑16BaPeq to estimate PM∑16BaPeq may not be applicable in all conditions and could introduce a large uncertainty in toxicity estimates.
4. Conclusions
In the present study, the data of 13 different projects (650 filters and XAD cartridges, total) on the analysis of 88 gas and particle-phase PAHs were used to calculate the total BaPeq toxicity by applying a widely used TEF approach. Obtained BaPeq values were compared with those calculated for 16 EPA priority particle-phase PAHs, and we found that 16 particle-bound EPA PAHs were responsible for only 14.4% on average for the range in all projects (0.2–41.9%) and the health risk of analyzed samples was likely to have been hugely underestimated. Although there was a significant linear relationship between PM∑16BaPeq and PM∑88BaPeq as well as between PM∑16BaPeq and (PM+Gas)∑88BaPeq for a majority of the analyzed projects, the potential carcinogenic toxicity based on BaPeq concentrations for only 16 EPA particle-phase PAHs must be interpreted carefully, especially considering possible synergistic effects of PAH mixtures. Our findings on the analysis of BaPeq values for 88 gas and particle phase individual PAH compounds showed that the contribution of non-EPA PAHs such as 1- and 2-methylnaphthlalenes, benzo(e)pyrene, dibenzo(a,i)pyrene, dibenzo(a,h)pyrene, is substantial to carcinogenic potency of analyzed air samples.
Our results stress the need for data on TEF values for additional PAHs, and the incorporation of these compounds into the health risk assessment. Measurements of gas-phase PAHs are also recommended, because of the strong contribution of the gas phase to the total BaPeq toxicity of atmospheric PAHs.
Supplementary Materials
The following are available online at www.mdpi.com/2305-6304/5/3/17/s1, Table S1: EPA priority PAHs and TEF coefficients, Table S2: TEFs assigned to 88 gas and particle phase PAHs analyzed for 9 different projects, Table S3: BaPeq calculated for samples collected for different projects, Table S4: Ratios of BaPeq calculated for samples collected for different projects, Figure S1: Top six PAHs that have highest BaPeq concentrations in particle-phase samples, Figure S2: Top six PAHs that have highest BaPeq concentrations in gas-phase samples.
Acknowledgments
The presented projects were supported by the National Science Foundation (NSF) under Grant no. AGS1544425, NASA ROSES under Grant nos. NNX15AI48G; the Desert Research Institute’s Wildland Fire Science Center (WFSC), Institute Project Assignments Internal Award (IPA, DRI), DRI’s EDGES program, TetraTech Inc., the National Institute for Occupational Safety and Health (NIOSH), and the Health Effects Institute (HEI 4947-RFPA14-1/15-1). We thank Eric Fujita for supervising some of the projects, Adam Watts for providing biomass fuels to perform controlled combustion experiments, Dave Campbell, Chiranjivi Bhattarai, and Deep Sengupta for technical assistance with collecting PAH containing samples from different sources, and Anna Cunningham and Mark McDaniel for technical support in PAH extraction and analysis.
Author Contributions
V. Samburova, B. Zielinska, and A. Khlystov designed and performed experiments, field studies, and data collection. V. Samburova summarized data and wrote the paper. A. Khlystov designed the plots. A. Khlystov and B. Zielinska provided input on interpretation of results. V. Samburova and A. Khlystov revised the manuscript.
Conflicts of Interest
The authors declare no conflicts of interest.
References
- Zhang, Y.X.; Tao, S. Global atmospheric emission inventory of polycyclic aromatic hydrocarbons (PAHs) for 2004. Atmos. Environ. 2009, 43, 812–819. [Google Scholar] [CrossRef]
- Yuan, H.S.; Tao, S.; Li, B.G.; Lang, C.; Cao, J.; Coveney, M.R. Emission and outflow of polycyclic aromatic hydrocarbons from wildfires in China. Atmos. Environ. 2008, 42, 6828–6835. [Google Scholar] [CrossRef]
- See, S.W.; Balasubramanian, R.; Rianawati, E.; Karthikeyan, S.; Streets, D.G. Characterization and source apportionment of particulate matter < or = 2.5 micrometer in Sumatra, Indonesia, during a recent peat fire episode. Environ. Sci. Technol. 2007, 41, 3488–3494. [Google Scholar] [CrossRef] [PubMed]
- Nikolaou, K.; Masclet, P.; Mouvier, G. Sources and chemical reactivity of polynuclear aromatic hydrocarbons in the atmosphere—A critical review. Sci. Total Environ. 1984, 32, 103–132. [Google Scholar] [CrossRef]
- Raga, G.B.; Baumgardner, D.; Ulke, A.G.; Brizuela, M.T.; Kucienska, B. The environmental impact of the Puyehue-Cordon Caulle 2011 volcanic eruption on Buenos Aires. Nat. Hazards Earth Syst. Sci. 2013, 13, 2319–2330. [Google Scholar] [CrossRef] [Green Version]
- Stogiannidis, E.; Laane, R. Source characterization of polycyclic aromatic hydrocarbons by using their molecular indices: An overview of possibilities. In Reviews of Environmental Contamination and Toxicology; Springer: Berlin, Germany, 2015; pp. 49–133. [Google Scholar]
- Venkatesan, M.I. Occurrence and possible sources of perylene in marine sediments—A review. Mar. Chem. 1988, 25, 1–27. [Google Scholar] [CrossRef]
- Suess, M.J. The environmental load and cycle of polycyclic aromatic hydrocarbons. Sci. Total Environ. 1976, 6, 239–250. [Google Scholar] [CrossRef]
- Peters, K.E.; Walters, C.C.; Moldowan, J.M. The Biomarker Guide: Biomarkers and Isotopes in the Environment and Human History; Cambridge University Press: New York, NY, USA, 2005; Volume 1. [Google Scholar]
- Bakhtiari, A.R.; Zakaria, M.P.; Yaziz, M.I.; Lajis, M.N.H.; Bi, X.; Rahim, M.C.A. Vertical distribution and source identification of polycyclic aromatic hydrocarbons in anoxic sediment cores of Chini Lake, Malaysia: Perylene as indicator of land plant-derived hydrocarbons. Appl. Geochem. 2009, 24, 1777–1787. [Google Scholar] [CrossRef]
- Zielinska, B.; Sagebiel, J.; Arnott, W.P.; Rogers, C.F.; Kelly, K.E.; Wagner, D.A.; Lighty, J.S.; Sarofim, A.F.; Palmer, G. Phase and size distribution of polycyclic aromatic hydrocarbons in diesel and gasoline vehicle emissions. Environ. Sci. Technol. 2004, 38, 2557–2567. [Google Scholar] [CrossRef] [PubMed]
- Zielinska, B.; Sagebiel, J.; McDonald, J.D.; Whitney, K.; Lawson, D.R. Emission rates and comparative chemical composition from selected in-use diesel and gasoline-fueled vehicles. J. Air Waste Manag. Assoc. 2004, 54, 1138–1150. [Google Scholar] [CrossRef] [PubMed]
- Fujita, E.M.; Zielinska, B.; Campbell, D.E.; Arnott, W.P.; Sagebiel, J.C.; Mazzoleni, L.; Chow, J.C.; Gabele, P.A.; Crews, W.; Snow, R. Variations in speciated emissions from spark-ignition and compression-ignition motor vehicles in California’s south coast air basin. J. Air Waste Manag. Assoc. 2007, 57, 705–720. [Google Scholar] [CrossRef] [PubMed]
- Liu, W.X.; Dou, H.; Wei, Z.C.; Chang, B.; Qiu, W.X.; Liu, Y.; Tao, S. Emission characteristics of polycyclic aromatic hydrocarbons from combustion of different residential coals in North China. Sci. Total Environ. 2009, 407, 1436–1446. [Google Scholar] [CrossRef] [PubMed]
- McDonald, J.D.B.; Zielinska, E.; Fujita, M.; Sagebiel, J.C.; Chow, J.C.; Watson, J.G. Fine particle and gaseous emission rates from residential wood combustion. Environ. Sci. Technol. 2000, 34, 2080–2091. [Google Scholar] [CrossRef]
- Johansson, L.S.; Leckner, B.; Gustavsson, L.; Cooper, D.; Tullin, C.; Potter, A. Emission characteristics of modern and old-type residential boilers fired with wood logs and wood pellets. Atmos. Environ. 2004, 38, 4183–4195. [Google Scholar] [CrossRef]
- Oanh, N.T.K.; Reutergardh, L.B.; Dung, N.T. Emission of polycyclic aromatic hydrocarbons and particulate matter from domestic combustion of selected fuels. Environ. Sci. Technol. 1999, 33, 2703–2709. [Google Scholar] [CrossRef]
- Medeiros, P.M.; Simoneit, B.R.T. Source Profiles of Organic Compounds Emitted upon Combustion of Green Vegetation from Temperate Climate Forests. Environ. Sci. Technol. 2008, 42, 8310–8316. [Google Scholar] [CrossRef] [PubMed]
- Kakareka, S.V.; Kukharchyk, T.I.; Khomich, V.S. Study of PAH emission from the solid fuels combustion in residential furnaces. Environ. Pollut. 2005, 133, 383–387. [Google Scholar] [CrossRef] [PubMed]
- Hays, M.D.; Fine, P.M.; Geron, C.D.; Kleeman, M.J.; Gullett, B.K. Open burning of agricultural biomass: Physical and chemical properties of particle-phase emissions. Atmos. Environ. 2005, 39, 6747–6764. [Google Scholar] [CrossRef]
- Tian, J.; Chow, J.C.; Cao, J.; Han, Y.; Ni, H.; Chen, L.W.A.; Wang, X.; Huang, R.J.; Moosmueller, H.; Watson, J.G. A biomass combustion chamber: Design, evaluation, and a case study of wheat straw combustion emission tests. Aerosol Air Qual. Res. 2015, 15, 2104–2114. [Google Scholar] [CrossRef]
- Yang, H.H.; Tsai, C.H.; Chao, M.R.; Su, Y.L.; Chien, S.M. Source identification and size distribution of atmospheric polycyclic aromatic hydrocarbons during rice straw burning period. Atmos. Environ. 2006, 40, 1266–1274. [Google Scholar] [CrossRef]
- Godoi, A.F.L.; Ravindra, K.; Godoi, R.H.M.; Andrade, S.J.; Santiago, -S.M.; van Vaeck, L.; van Grieken, R. Fast chromatographic determination of polycyclic aromatic hydrocarbons in aerosol samples from sugar cane burning. J. Chromatogr. A 2004, 1027, 49–53. [Google Scholar] [CrossRef] [PubMed]
- Tiwari, M.; Sahu, S.K.; Bhangare, R.C.; Ajmal, P.Y.; Pandit, G.G. Estimation of polycyclic aromatic hydrocarbons associated with size segregated combustion aerosols generated from household fuels. Microchem. J. 2013, 106, 79–86. [Google Scholar] [CrossRef]
- Singh, D.P.; Gadi, R.; Mandal, T.K.; Saud, T.; Saxena, M.; Sharma, S.K. Emissions estimates of PAH from biomass fuels used in rural sector of Indo-Gangetic Plains of India. Atmos. Environ. 2013, 68, 120–126. [Google Scholar] [CrossRef]
- Venkataraman, C.; Negi, G.; Sardar, S.B.; Rastogi, R. Size distributions of polycyclic aromatic hydrocarbons in aerosol emissions from biofuel combustion. J. Aerosol Sci. 2002, 33, 503–518. [Google Scholar] [CrossRef]
- Masclet, P.; Mouvier, G.; Nikolaou, K. Relative decay index and sources of polycyclic aromatic hydrocarbons. Atmos. Environ. 1986, 20, 439–446. [Google Scholar] [CrossRef]
- Harrison, R.M.; Smith, D.J.T.; Luhana, L. Source apportionment of atmospheric polycyclic aromatic hydrocarbons collected from an urban location in Birmingham, UK. Environ. Sci. Technol. 1996, 30, 825–832. [Google Scholar] [CrossRef]
- Shen, H.Z.; Huang, Y.; Wang, R.; Zhu, D.; Li, W.; Shen, G.F.; Wang, B.; Zhang, Y.Y.; Chen, Y.C.; Lu, Y.; et al. Global Atmospheric Emissions of Polycyclic Aromatic Hydrocarbons from 1960 to 2008 and Future Predictions. Environ. Sci. Technol. 2013, 47, 6415–6424. [Google Scholar] [CrossRef] [PubMed]
- Pacyna, J.M.; Breivik, K.; Munch, J.; Fudala, J. European atmospheric emissions of selected persistent organic pollutants, 1970–1995. Atmos. Environ. 2003, 37, S119–S131. [Google Scholar] [CrossRef]
- Breivik, K.; Vestreng, V.; Rozovskaya, O.; Pacyna, J.M. Atmospheric emissions of some POPs in Europe: A discussion of existing inventories and data needs. Environ. Sci. Policy 2006, 9, 663–674. [Google Scholar] [CrossRef]
- Lammel, G.; Heil, A.; Stemmler, I.; Dvorska, A.; Klanova, J. On the Contribution of Biomass Burning to POPs (PAHs and PCDDs) in Air in Africa. Environ. Sci. Technol. 2013, 47, 11616–11624. [Google Scholar] [CrossRef] [PubMed]
- Ravindra, K.; Sokhi, R.; van Grieken, R. Atmospheric polycyclic aromatic hydrocarbons: Source attribution, emission factors and regulation. Atmos. Environ. 2008, 42, 2895–2921. [Google Scholar] [CrossRef] [Green Version]
- Petry, T.; Schmid, P.; Schlatter, C. The use of toxic equivalency factors in assessing occupational and environmental health risk associated with exposure to airborne mixtures of polycyclic aromatic hydrocarbons (PAHs). Chemosphere 1996, 32, 639–648. [Google Scholar] [CrossRef]
- International Agency for Research on Cancer. Working Group on the Evaluation of Carcinogenic Risks to Humans, IARC monographs on the evaluation of carcinogenic risks to humans. Ingested nitrate and nitrite, and cyanobacterial peptide toxins. In IARC Monographs on the Evaluation of Carcinogenic Risks to Humans; World Health Organisation: Geneva, Switzerland, 2010; Volume 94. [Google Scholar]
- Thamaraiselvan, R.; Rajendran, P.; Nandakumar, N.; Lokeshkumar, B.; Rajendran, P.; Nishigaki, I. Exposure to polycyclic aromatic hydrocarbons with special focus on cancer. Asian Pac. J. Trop. Biomed. 2015, 5, 182–189. [Google Scholar]
- Baird, W.M.; Hooven, L.A.; Mahadevan, B. Carcinogenic polycyclic aromatic hydrocarbon-DNA adducts and mechanism of action. Environ. Mol. Mutagen. 2005, 45, 106–114. [Google Scholar] [CrossRef] [PubMed]
- Abbas, I.; Garçon, G.; Saint, -G.F.; Andre, V.; Gosset, P.; Billet, S.; Goff, J.L.; Verdin, A.; Mulliez, P.; Sichel, F. Polycyclic aromatic hydrocarbons within airborne particulate matter (PM2.5) produced DNA bulky stable adducts in a human lung cell coculture model. J. Appl. Toxicol. 2013, 33, 109–119. [Google Scholar] [CrossRef] [PubMed]
- Armstrong, B.; Hutchinson, E.; Unwin, J.; Fletcher, T. Lung cancer risk after exposure to polycyclic aromatic hydrocarbons: A review and meta-analysis. Environ. Health Perspect. 2004, 112, 970–978. [Google Scholar] [CrossRef] [PubMed]
- Poirier, M.C. Linking DNA adduct formation and human cancer risk in chemical carcinogenesis. Environ. Mol. Mutagen. 2016, 57, 499–507. [Google Scholar] [CrossRef] [PubMed]
- Farmer, P.B. Molecular epidemiology studies of carcinogenic environmental pollutants—Effects of polycyclic aromatic hydrocarbons (PAHs) in environmental pollution on exogenous and oxidative DNA damage. Mutat. Res. Rev. Mutat. Res. 2003, 544, 397–402. [Google Scholar] [CrossRef]
- Srogi, K. Monitoring of environmental exposure to polycyclic aromatic hydrocarbons: A review. Environ. Chem. Lett. 2007, 5, 169–195. [Google Scholar] [CrossRef]
- Chen, S.-C.; Liao, C.-M. Health risk assessment on human exposed to environmental polycyclic aromatic hydrocarbons pollution sources. Sci. Total Environ. 2006, 366, 112–123. [Google Scholar] [CrossRef] [PubMed]
- Boström, C.; Gerde, P.; Hanberg, A.; Jernström, B.; Johansson, C.; Kyrklund, T.; Rannug, A.; Törnqvist, M.; Victorin, K.; Westerholm, R. Cancer risk assessment, indicators, and guidelines for polycyclic aromatic hydrocarbons in the ambient air. Environ. Health Perspect. 2002, 110 (Suppl. S3), 451–488. [Google Scholar] [CrossRef] [PubMed]
- Liu, Y.N.; Tao, S.; Dou, H.; Zhang, T.W.; Zhang, X.L.; Dawson, R. Exposure of traffic police to polycyclic aromatic hydrocarbons in Beijing, China. Chemosphere 2007, 66, 1922–1928. [Google Scholar] [CrossRef] [PubMed]
- Mandalakis, M.; Tsapakis, M.; Tsoga, A.; Stephanou, E.G. Gas-particle concentrations and distribution of aliphatic hydrocarbons, PAHs, PCBs and PCDD/Fs in the atmosphere of Athens (Greece). Atmos. Environ. 2002, 36, 4023–4035. [Google Scholar] [CrossRef]
- Gregoris, E.; Argiriadis, E.; Vecchiato, M.; Zambon, S.; de Pieri, S.; Donateo, A.; Contini, D.; Piazza, R.; Barbante, C.; Gambaro, A. Gas-particle distributions, sources and health effects of polycyclic aromatic hydrocarbons (PAHs), polychlorinated biphenyls (PCBs) and polychlorinated naphthalenes (PCNs) in Venice aerosols. Sci. Total Environ. 2014, 476, 393–405. [Google Scholar] [CrossRef] [PubMed]
- Li, J.; Zhang, G.; Li, X.D.; Qi, S.H.; Liu, G.Q.; Peng, Z.X. Source seasonality of polycyclic aromatic hydrocarbons (PAHs) in a subtropical city, Guangzhou, South China. Sci. Total Environ. 2006, 355, 145–155. [Google Scholar] [CrossRef] [PubMed]
- Lee, B.-K. Sources, distribution and toxicity of polyaromatic hydrocarbons (PAHs) in particulate matter. In Air Pollution; Sciyo: Brussels, Belgium, 2010. [Google Scholar]
- OFR. Office of the Federal Registration (OFR) Appendix A: Priority Pollutants; Federal Register: Washington, DC, USA, 1982.
- Nisbet, I.C.T.; LaGoy, P.K. Toxic equivalency factors (TEFs) for polycyclic aromatic hydrocarbons (PAHs). Regul. Toxicol. Pharm. 1992, 16, 290–300. [Google Scholar] [CrossRef]
- Tiwari, M.; Sahu, S.K.; Pandit, G.G. Inhalation Risk Assessment of PAH Exposure Due to Combustion Aerosols Generated from Household Fuels. Aerosol Air Qual. Res. 2015, 15, 582–590. [Google Scholar] [CrossRef]
- Lakhani, A. Source Apportionment of Particle Bound Polycyclic Aromatic Hydrocarbons at an Industrial Location in Agra, India. Sci. World J. 2012, 781291. [Google Scholar] [CrossRef] [PubMed]
- Kim, J.Y.; Lee, J.Y.; Kim, Y.P.; Lee, S.B.; Jin, H.C.; Bae, G.N. Seasonal characteristics of the gaseous and particulate PAHs at a roadside station in Seoul, Korea. Atmos. Res. 2012, 116, 142–150. [Google Scholar] [CrossRef]
- US Agency for Toxic Substances and Disease Registry. Toxicological Profile for Naphthalene, 1-Methylnaphthalene, and 2-Methylnaphthalene; US Department of Health and Human Services, Agency for Toxic Substances and Disease Registry: Atlanta, GA, USA, 2005.
- Vainio, H.; Heseltine, E.; Wilbourn, J. Priorities for Future IARC Monographs on the Evaluation of Carcinogenic Risks to Humans. Environ. Health Perspect. 1994, 102, 590–591. [Google Scholar] [CrossRef] [PubMed]
- Abdo, M.; Grumbein, S.; Chou, B.J.; Herbert, R.K. Toxicity and carcinogenicity study in F344 rats following 2 years of whole-body exposure to naphthalene vapors. Inhal. Toxicol. 2001, 13, 931–950. [Google Scholar]
- Jia, C.; Batterman, S. A critical review of naphthalene sources and exposures relevant to indoor and outdoor air. Int. J. Environ. Res. Public Health 2010, 7, 2903–2939. [Google Scholar] [CrossRef]
- Possanzini, M.; di Palo, V.; Gigliucci, P.; Scianò, M.C.T.; Cecinato, A. Determination of phase-distributed PAH in Rome ambient air by denuder/GC-MS method. Atmos. Environ. 2004, 38, 1727–1734. [Google Scholar] [CrossRef]
- Ramírez, N.; Cuadras, A.; Rovira, E.; Marcé, R.M.; Borrull, F. Risk assessment related to atmospheric polycyclic aromatic hydrocarbons in gas and particle phases near industrial sites. Environ. Health Perspect. 2011, 119, 1110–1116. [Google Scholar] [CrossRef]
- U.S. Environmental Protection Agency. Provisional Guidance for Quantitative Risk Assessment of Polycyclic Aromatic Hydrocarbons; Office of Research and Development: Washington, DC, USA, 1993.
- Collins, J.F.; Brown, J.P.; Dawson, S.V.; Marty, M.A. Risk assessment for benzo [a] pyrene. Regul. Toxicol. Pharm. 1991, 13, 170–184. [Google Scholar] [CrossRef]
- McDonald, J.D.; Eide, I.; Seagrave, J.C.; Zielinska, B.; Whitney, K.; Lawson, D.R.; Mauderly, J.L. Relationship between composition and toxicity of motor vehicle emission samples. Environ. Health Perspect. 2004, 112, 1527–1538. [Google Scholar] [CrossRef]
- Samy, S.; Zielinska, B. Secondary organic aerosol production from modern diesel engine emissions. Atmos. Chem. Phys. 2010, 10, 609–625. [Google Scholar] [CrossRef]
- He, J.; Zielinska, B.; Balasubramanian, R. Composition of semi-volatile organic compounds in the urban atmosphere of Singapore: Influence of biomass burning. Atmos. Chem. Phys. 2010, 10, 11401–11413. [Google Scholar] [CrossRef] [Green Version]
- Rinehart, L.R.; Fujita, E.M.; Chow, J.C.; Magliano, K.; Zielinska, B. Spatial distribution of PM 2.5 associated organic compounds in central California. Atmos. Environ. 2006, 40, 290–303. [Google Scholar] [CrossRef]
- McDonald, J.D.; Zielinska, B.; Fujita, E.M.; Sagebiel, J.C.; Chow, J.C.; Watson, J.G. Emissions from charbroiling and grilling of chicken and beef. J. Air Waste Manag. Assoc. 2003, 53, 185–194. [Google Scholar] [CrossRef]
- Kameda, Y.; Shirai, J.; Komai, T.; Nakanishi, J.; Masunaga, S. Atmospheric polycyclic aromatic hydrocarbons: Size distribution, estimation of their risk and their depositions to the human respiratory tract. Sci. Total Environ. 2005, 340, 71–80. [Google Scholar] [CrossRef] [PubMed]
- International Programme on Chemical Safety. OMS Environmental Health Criteria 202: Selected Non-Heterocyclic Polycyclic Aromatic Hydrocarbons World Health Organisation; World Health Organisation: Geneva, Switzerland, 1998. [Google Scholar]
- Black, R.R.; Aurell, J.; Holder, A.; George, I.J.; Gullett, B.K.; Hays, M.D.; Geron, C.D.; Tabor, D. Characterization of gas and particle emissions from laboratory burns of peat. Atmos. Environ. 2016, 132, 49–57. [Google Scholar] [CrossRef]
- Cereceda, -B.F.; Fadic, X.; Llanos, A.L.; Dominguez, A.M.; Guevara, J.L.; Vidal, V.; Diaz-Robles, L.A.; Schiappacasse, L.N.; Etcharren, P. Obtaining polycyclic aromatic hydrocarbon concentration ratios and molecular markers for residential wood combustion: Temuco, a case study. J. Air Waste Manag. Assoc. 2012, 62, 44–51. [Google Scholar] [CrossRef]
- Vasilakos, C.; Levi, N.; Maggos, T.; Hatzianestis, J.; Michopoulos, J.; Helmis, C. Gas-particle concentration and characterization of sources of PAHs in the atmosphere of a suburban area in Athens, Greece. J. Hazard. Mater. 2007, 140, 45–51. [Google Scholar] [CrossRef] [PubMed]
- Muendo, M.; Hanai, Y.; Kameda, Y.; Masunaga, S. Polycyclic aromatic hydrocarbons in urban air: Concentration levels, patterns, and source analysis in Nairobi, Kenya. Environ. Forensics 2006, 7, 147–157. [Google Scholar] [CrossRef]
- Delgado-Saborit, J.M.; Stark, C.; Harrison, R.M. Carcinogenic potential, levels and sources of polycyclic aromatic hydrocarbon mixtures in indoor and outdoor environments and their implications for air quality standards. Environ. Int. 2011, 37, 383–392. [Google Scholar] [CrossRef] [PubMed]
- Bandowe, B.A.M.; Meusel, H.; Huang, R.J.; Ho, K.F.; Cao, J.J.; Hoffmann, T.; Wilcke, W. PM25-bound oxygenated PAHs, nitro-PAHs and parent-PAHs from the atmosphere of a Chinese megacity: Seasonal variation, sources and cancer risk assessment. Sci. Total Environ. 2014, 473, 77–87. [Google Scholar] [CrossRef] [PubMed]
- Allen, J.O.; Dookeran, K.M.; Smith, K.A.; Sarofim, A.F.; Taghizadeh, K.; Lafleur, A.L. Measurement of polycyclic aromatic hydrocarbons associated with size-segregated atmospheric aerosols in Massachusetts. Environ. Sci. Technol. 1996, 30, 1023–1031. [Google Scholar] [CrossRef]
- LAWA. Los Angeles World Airports Environmental Services Division, Phase III of the LAX Air Quality and Source Apportionment Study. 2013. Available online: https://www.lawa.org/uploadedFiles/OurLAX/pdf/Vol 2 - Phase III LAX AQSAS 2013 06 18s_v2.pdf (accessed on 7 August 2017).
- Samburova, V.; Connolly, J.; Gyawali, M.; Yatavelli, R.L.N.; Watts, A.C.; Chakrabarty, R.K.; Zielinska, B.; Moosmüller, H.; Khlystov, A. Polycyclic aromatic hydrocarbons in biomass-burning emissions and their contribution to light absorption and aerosol toxicity. Sci. Total Environ. 2016, 568, 391–401. [Google Scholar] [CrossRef] [PubMed]
- Zielinska, B.; Campbell, D.; Lawson, D.R.; Ireson, R.G.; Weaver, C.S.; Hesterberg, T.W.; Larson, T.; Davey, M.; Liu, L.J.S. Detailed characterization and profiles of crankcase and diesel particulate matter exhaust emissions using speciated organics. Environ. Sci. Technol. 2008, 42, 5661–5666. [Google Scholar] [CrossRef] [PubMed]
- OEHHA. Benzo[a]pyrene as a Toxic Air Contaminant. Part B. Health Effects of Benzo[a]pyrene; Office of Environmental Health Hazard Assessment, California Environmental Protection Agency, Air Toxicology and Epidemiology Section: Berkeley, CA, USA, 1993.
- Peters, C.A.; Knightes, C.D.; Brown, D.G. Long-term composition dynamics of PAH-containing NAPLs and implications for risk assessment. Environ. Sci. Technol. 1999, 33, 4499–4507. [Google Scholar] [CrossRef]
- Yang, Y.; Guo, P.; Zhang, Q.; Li, D.; Zhao, L.; Mu, D. Seasonal variation, sources and gas/particle partitioning of polycyclic aromatic hydrocarbons in Guangzhou, China. Sci. Total Environ. 2010, 408, 2492–2500. [Google Scholar] [CrossRef] [PubMed]
- Pankow, J.F. An absorption model of the gas/aerosol partitioning involved in the formation of secondary organic aerosol. Atmos. Environ. 1994, 28, 189–193. [Google Scholar] [CrossRef]
- Lemieux, C.L.; Lambert, I.B.; Lundstedt, S.; Tysklind, M.; White, P.A. Mutagenic hazards of complex polycyclic aromatic hydrocarbon mixtures in contaminated soil. Environ. Toxicol. Chem. 2008, 27, 978–990. [Google Scholar] [CrossRef] [PubMed]
- Donnelly, K.C.; Lingenfelter, R.; Cizmas, L.; Falahatpisheh, M.H.; Qian, Y.; Tang, Y.; Garcia, S.; Ramos, K.; Tiffany-Castiglioni, E.; Mumtaz, M.M. Toxicity assessment of complex mixtures remains a goal. Environ. Toxicol. Pharmacol. 2004, 18, 135–141. [Google Scholar] [CrossRef] [PubMed]
Figure 1.
BaPeq ratios of 16 U.S Environmental Protection Agency (EPA) particle-phase PAHs to 88 particle-phase PAHs (BaPeq(%)I = PM∑16EPABaPeq/PM∑88BaPeq); orange lines—mean values of BaPeq(%)I; green triangles—median values of BaPeq(%)I.
Figure 1.
BaPeq ratios of 16 U.S Environmental Protection Agency (EPA) particle-phase PAHs to 88 particle-phase PAHs (BaPeq(%)I = PM∑16EPABaPeq/PM∑88BaPeq); orange lines—mean values of BaPeq(%)I; green triangles—median values of BaPeq(%)I.
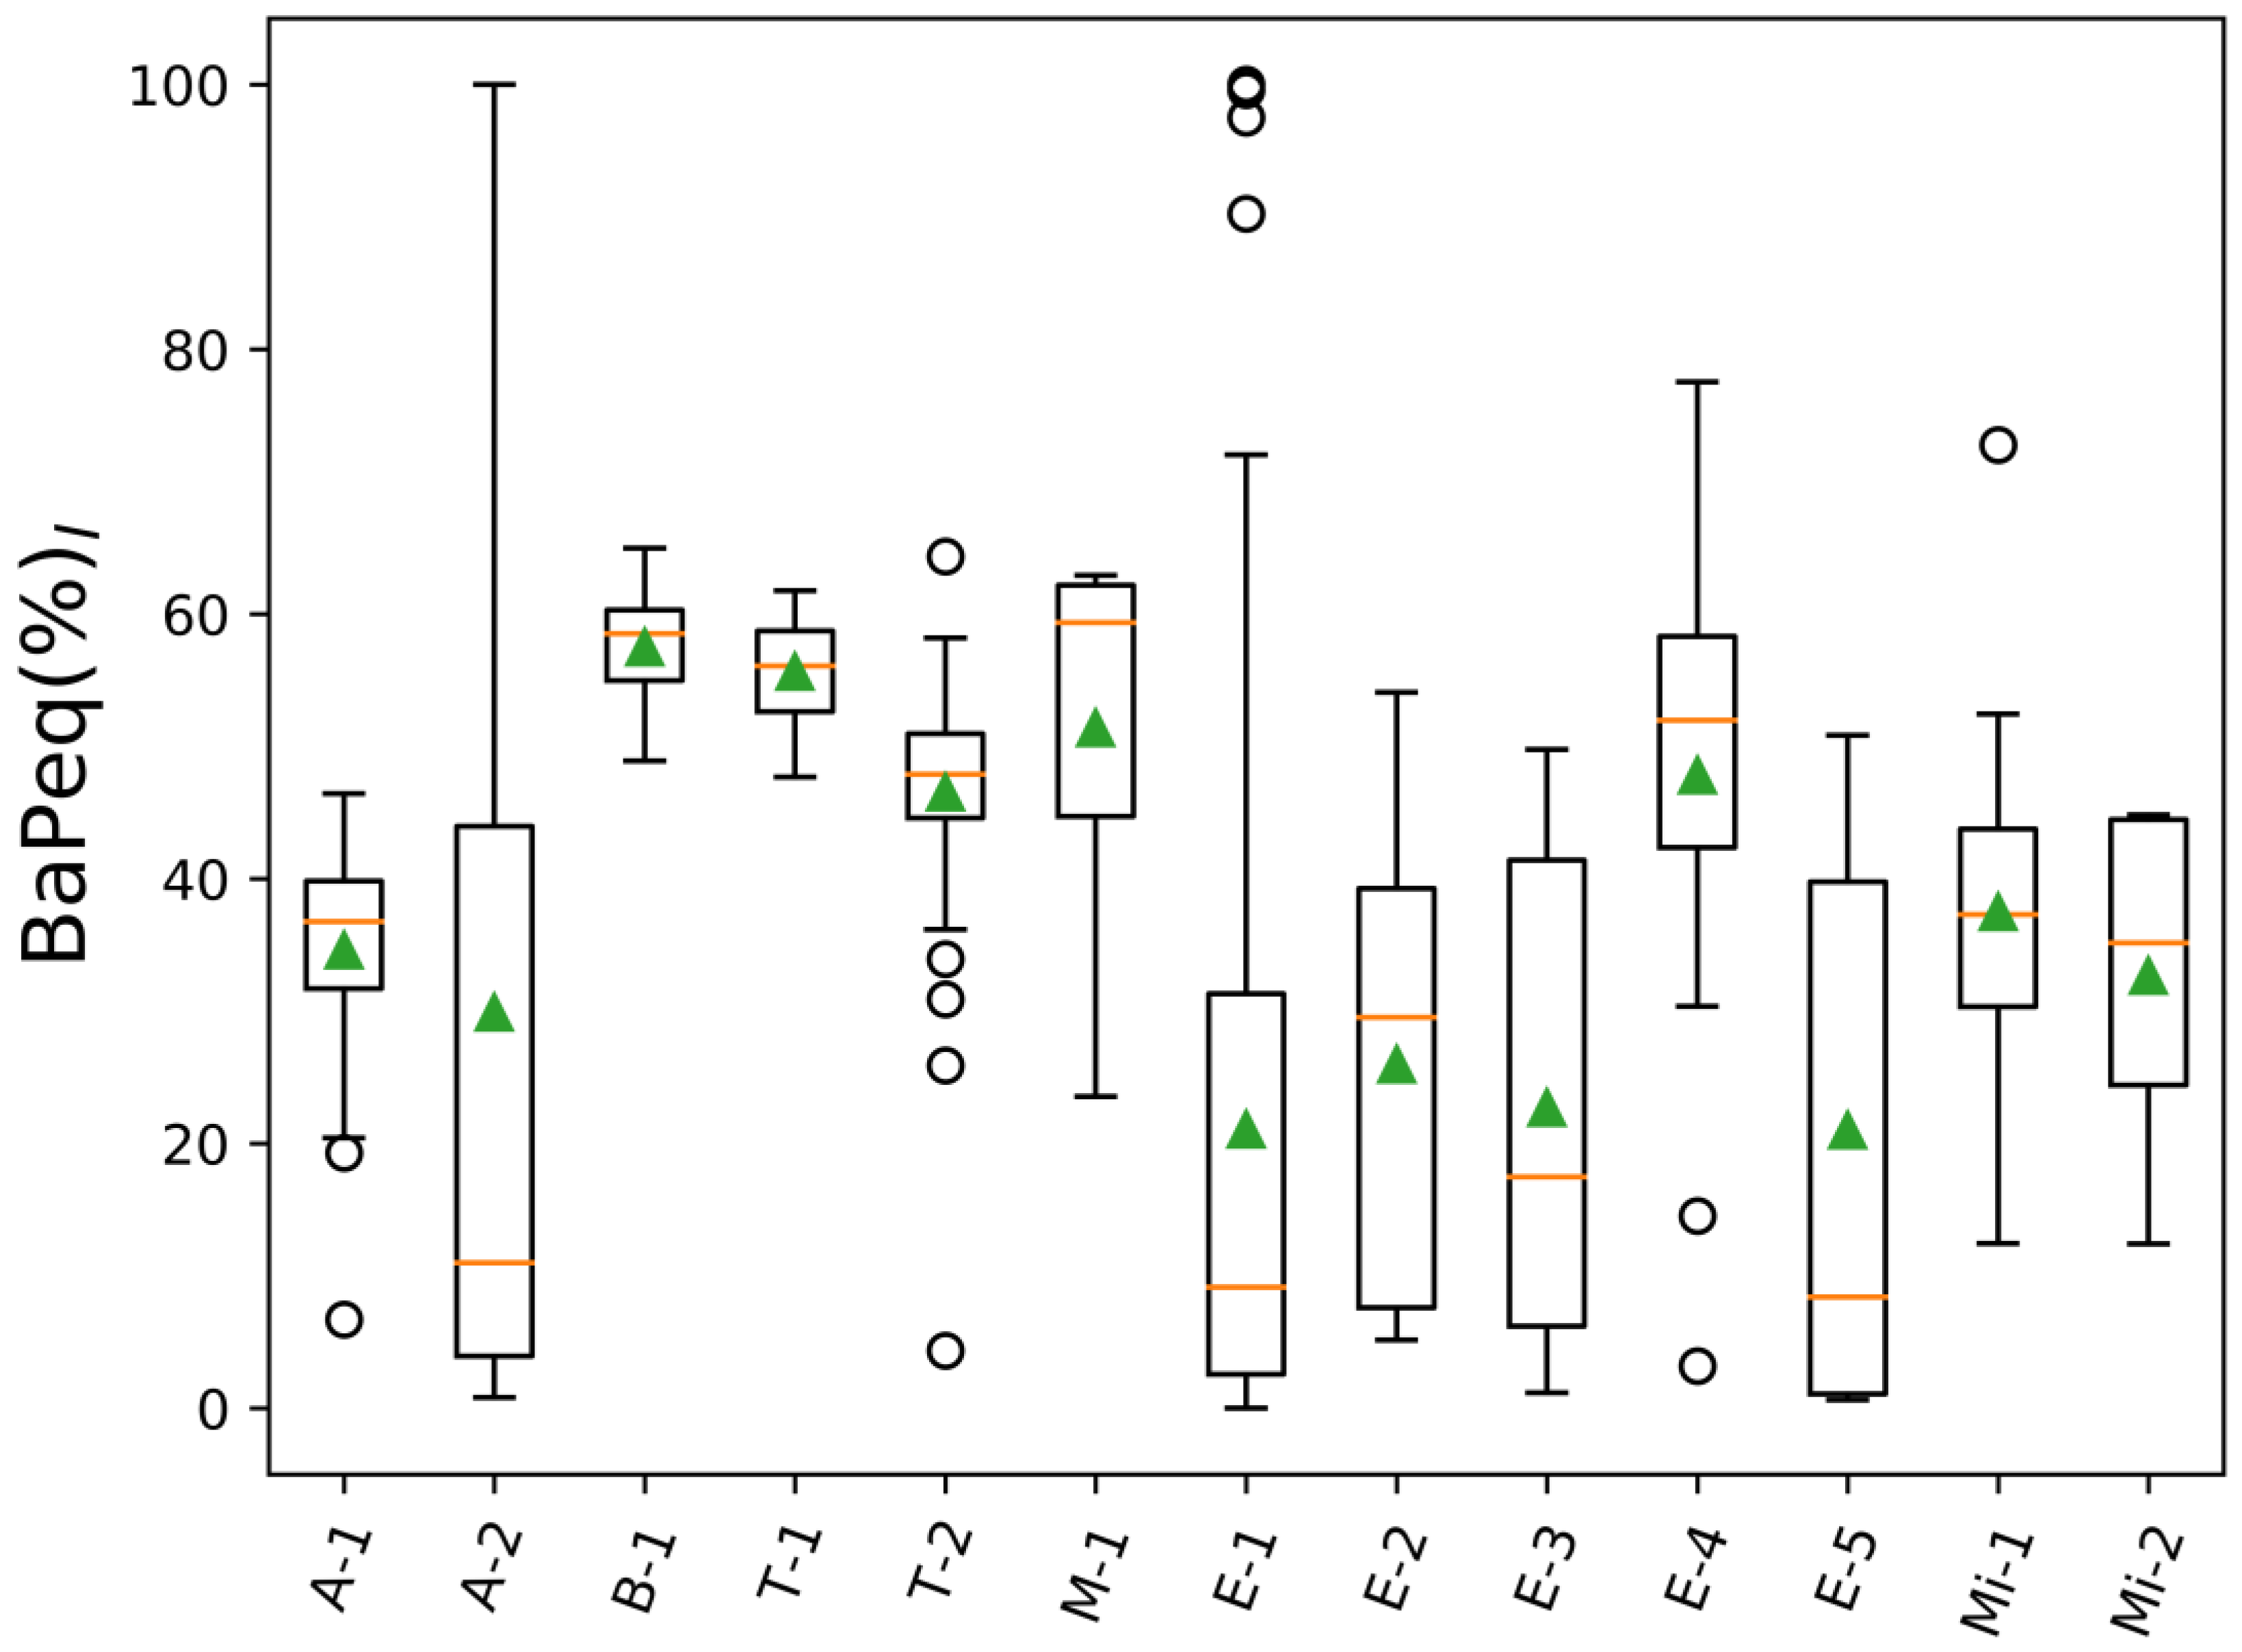
Figure 2.
Correlation between BaPeq of 88 PAHs in particle-phase (PM) and 16 EPA particle-phase PAHs analyzed for 13 projects (Table 1).
Figure 2.
Correlation between BaPeq of 88 PAHs in particle-phase (PM) and 16 EPA particle-phase PAHs analyzed for 13 projects (Table 1).

Figure 3.
BaPeq ratios of 16 EPA priority particle-phase PAHs to 16 EPA priority PAHs in both gas and particle phases (BaPeq(%)II = PM∑16EPABaPeq/(PM + Gas)∑16EPABaPeq); orange lines—mean values of BaPeq(%)II; green triangles—median values of BaPeq(%)II.
Figure 3.
BaPeq ratios of 16 EPA priority particle-phase PAHs to 16 EPA priority PAHs in both gas and particle phases (BaPeq(%)II = PM∑16EPABaPeq/(PM + Gas)∑16EPABaPeq); orange lines—mean values of BaPeq(%)II; green triangles—median values of BaPeq(%)II.

Figure 4.
BaPeq ratios of 16 EPA particle-phase PAHs to 88 PAHs for both gas and particle phases: BaPeq(%)III = PM∑16EPABaPeq/(PM + Gas)∑88BaPeq; orange lines—mean values of BaPeq(%)III; green triangles—median values of BaPeq(%)III.
Figure 4.
BaPeq ratios of 16 EPA particle-phase PAHs to 88 PAHs for both gas and particle phases: BaPeq(%)III = PM∑16EPABaPeq/(PM + Gas)∑88BaPeq; orange lines—mean values of BaPeq(%)III; green triangles—median values of BaPeq(%)III.
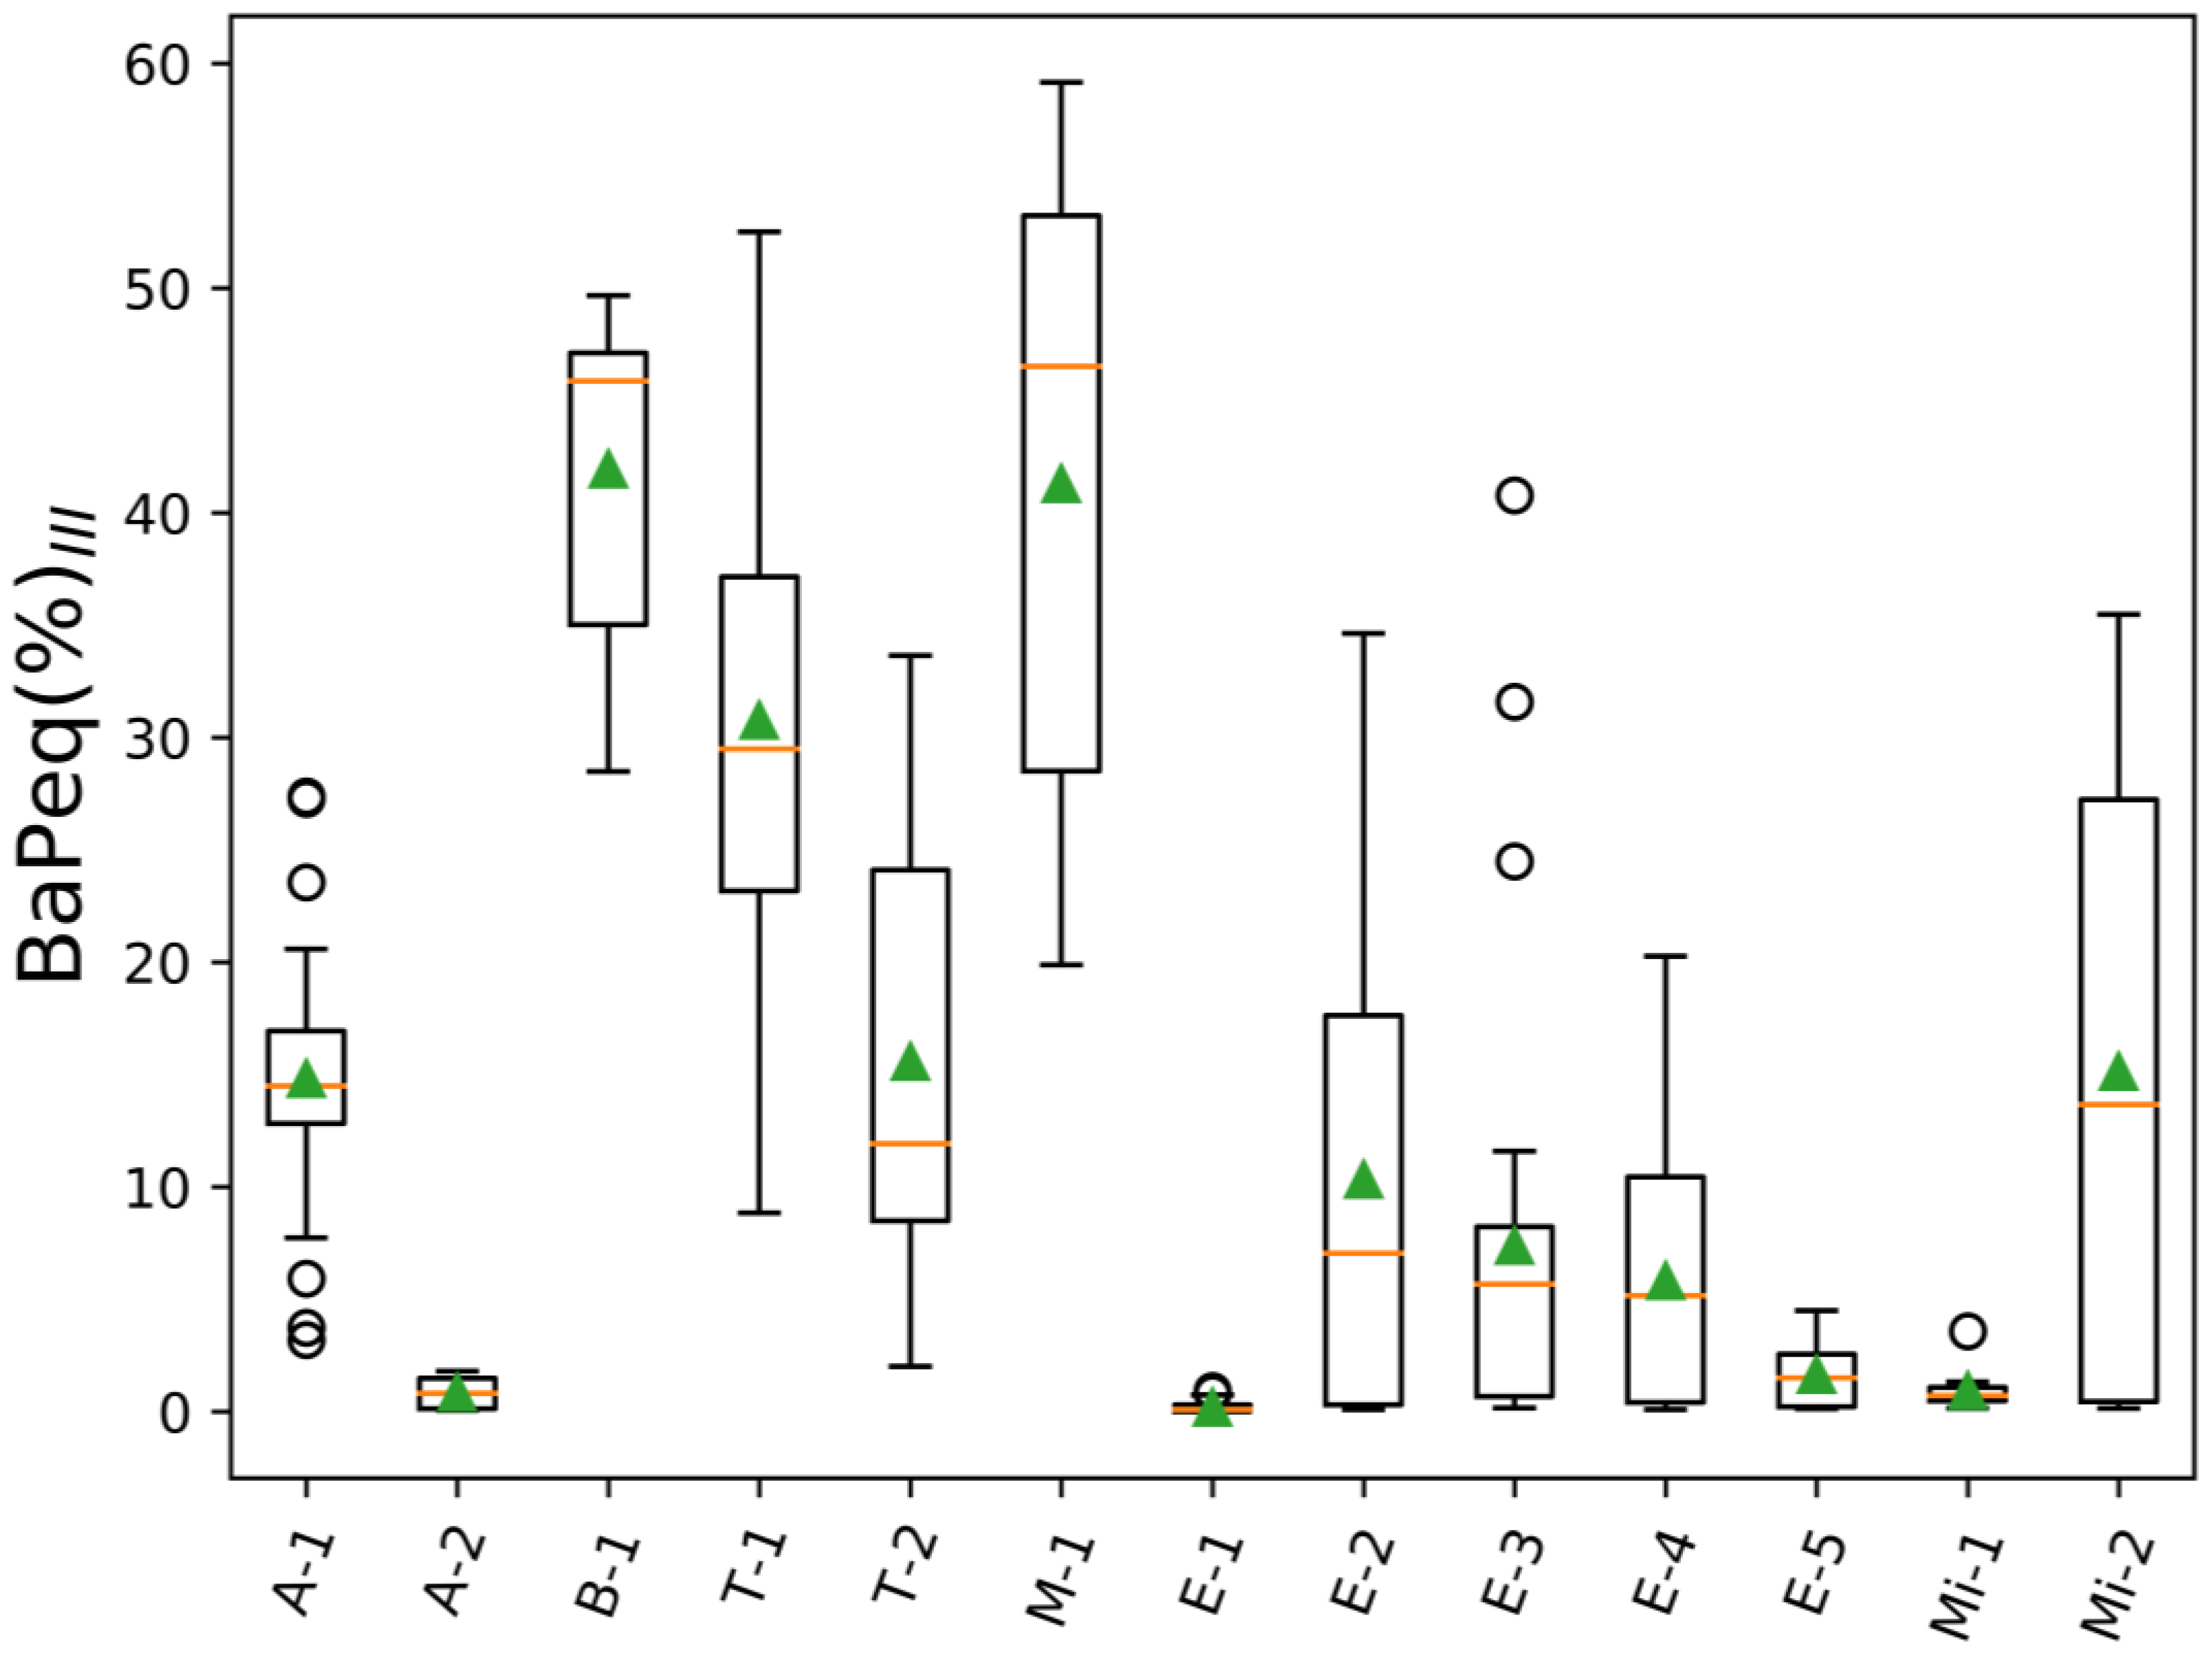
Figure 5.
Top six PAHs that have highest BaPeq concentration levels in both gas and particle phases.
Figure 5.
Top six PAHs that have highest BaPeq concentration levels in both gas and particle phases.
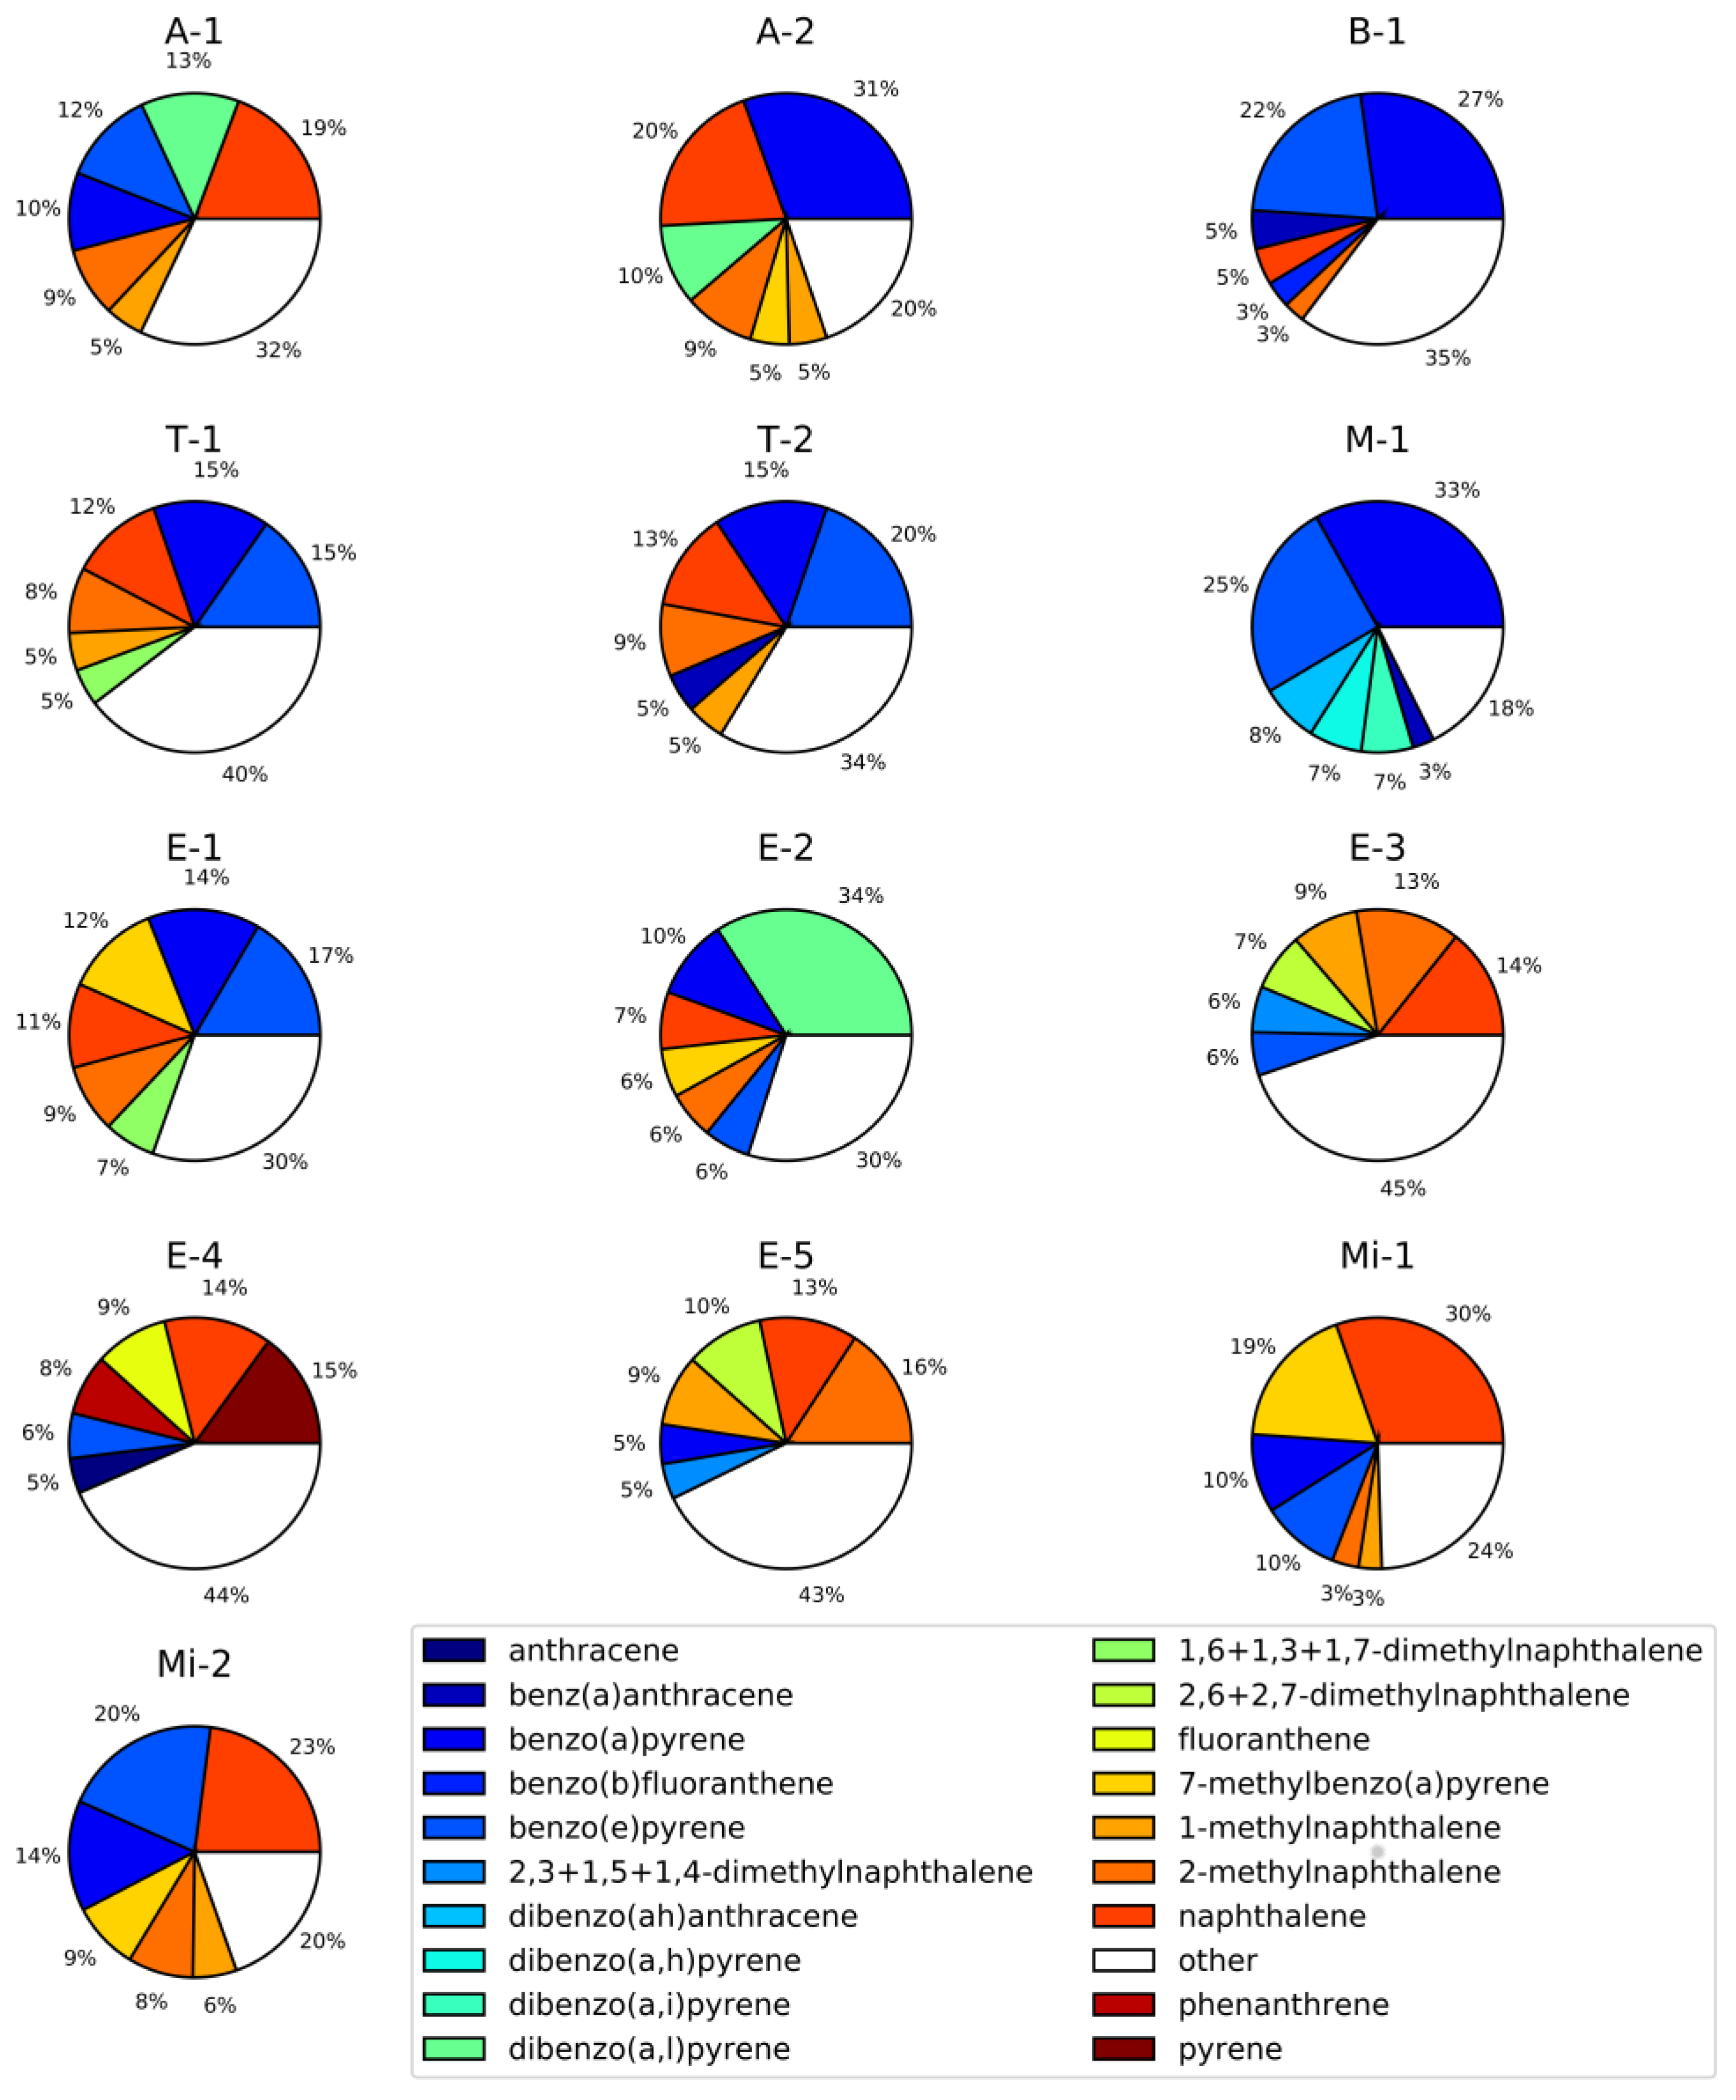
Figure 6.
BaPeq correlation between 16 EPA particle-phase PAHs and 88 PAHs in both gas and particle phases.
Figure 6.
BaPeq correlation between 16 EPA particle-phase PAHs and 88 PAHs in both gas and particle phases.


Table 1.
List of projects and number of collected filter and XAD samples that were analyzed for PAHs in particle and gas phases, respectively.
Table 1.
List of projects and number of collected filter and XAD samples that were analyzed for PAHs in particle and gas phases, respectively.
| Project Abbreviation and Reference | Sample Source | Description | Number of Samples | |
|---|---|---|---|---|
| Filters | XAD | |||
| A-1 [77] | Ambient urban air | LAX airport (CA) | 44 | 44 |
| A-2 | Ambient urban air | Reno city (NV) | 6 | 6 |
| B-1 [78] | Controlled biomass burning | DRI combustion chamber (NV) | 11 | 11 |
| T-1 | Tunnel/car emissions | Fort McHenry tunnel (MD), winter 2015 | 46 | 46 |
| T-2 | Tunnel/car emissions | Fort McHenry tunnel (MD), summer 2015 | 50 | 50 |
| M-1 | Meat cooking | - | 7 | 7 |
| E-1 | Engine emissions | Heavy and light duty engines | 71 | 71 |
| E-2 | Engine emissions | Engine emissions (Cummins) | 16 | 16 |
| E-3 | Engine emissions | Engine emissions (Cummins) | 26 | 26 |
| E-4 | Engine emissions | Engine emissions (Cummins) | 17 | 17 |
| E-5 | Engine emissions | Emissions from heavy heavy-duty diesel engines (model year 2007) | 9 | 9 |
| Mi-1 | Mining | Mining operation facility | 16 | 16 |
| Mi-2 | Mining | Mining operation facility | 6 | 6 |
Table 2.
BaPeq correlations of 16 EPA priority particle-phase PAHs (PM∑16BaPeq) with a BaPeq of 88 particle-phase PAHs (PM∑88BaPeq) and BaPeq of both particle- and gas-phase PAHs. The calculations were performed using Spearman’s correlation.
Table 2.
BaPeq correlations of 16 EPA priority particle-phase PAHs (PM∑16BaPeq) with a BaPeq of 88 particle-phase PAHs (PM∑88BaPeq) and BaPeq of both particle- and gas-phase PAHs. The calculations were performed using Spearman’s correlation.
| Project | PM∑16BaPeq/PM∑88BaPeq | PM∑16BaPeq/(PM + GAS)∑88BaPeq | ||
|---|---|---|---|---|
| r_Value | p_Value | r_Value | p_Value | |
| A-1 | 0.917 | 0.0000 | 0.841 | 0.0000 |
| A-2 | 0.657 | 0.1562 | 0.829 | 0.0416 |
| B-1 | 0.991 | 0.0000 | 0.936 | 0.0000 |
| T-1 | 0.981 | 0.0000 | 0.848 | 0.0000 |
| T-2 | 0.987 | 0.0000 | 0.919 | 0.0000 |
| M-1 | 0.893 | 0.0068 | 0.857 | 0.0137 |
| E-1 | 0.507 | 0.0000 | 0.054 | 0.6580 |
| E-2 | 0.982 | 0.0000 | 0.688 | 0.0032 |
| E-3 | 0.888 | 0.0000 | 0.857 | 0.0000 |
| E-4 | 0.941 | 0.0000 | 0.838 | 0.0000 |
| E-5 | 0.917 | 0.0005 | 0.917 | 0.0005 |
| Mi-1 | 0.450 | 0.0803 | −0.297 | 0.2639 |
| Mi-2 | 0.943 | 0.0048 | 0.543 | 0.2657 |
© 2017 by the authors. Licensee MDPI, Basel, Switzerland. This article is an open access article distributed under the terms and conditions of the Creative Commons Attribution (CC BY) license (http://creativecommons.org/licenses/by/4.0/).
Share and Cite
MDPI and ACS Style
Samburova, V.; Zielinska, B.; Khlystov, A. Do 16 Polycyclic Aromatic Hydrocarbons Represent PAH Air Toxicity? Toxics 2017, 5, 17. https://doi.org/10.3390/toxics5030017
AMA Style
Samburova V, Zielinska B, Khlystov A. Do 16 Polycyclic Aromatic Hydrocarbons Represent PAH Air Toxicity? Toxics. 2017; 5(3):17. https://doi.org/10.3390/toxics5030017
Chicago/Turabian StyleSamburova, Vera, Barbara Zielinska, and Andrey Khlystov. 2017. "Do 16 Polycyclic Aromatic Hydrocarbons Represent PAH Air Toxicity?" Toxics 5, no. 3: 17. https://doi.org/10.3390/toxics5030017
Note that from the first issue of 2016, this journal uses article numbers instead of page numbers. See further details here.