
Air Quality in the Harbin-Changchun Metropolitan Area in Northeast China: Unique Episodes and New Trends

1
State Key Laboratory of Urban Water Resource and Environment, School of Environment, Harbin Institute of Technology, Harbin 150090, China
2
Key Laboratory of Environmental Optics and Technology, Anhui Institute of Optics and Fine Mechanics, Chinese Academy of Sciences, Hefei 230031, China
*
Authors to whom correspondence should be addressed.
Toxics 2021, 9(12), 357; https://doi.org/10.3390/toxics9120357
Submission received: 11 November 2021
/
Revised: 9 December 2021
/
Accepted: 15 December 2021
/
Published: 17 December 2021
(This article belongs to the Special Issue Sources, Atmospheric Transformation and Dispersion of Aerosol Particles)
Abstract
:Because of the unique geographical, climate, and anthropogenic emission characteristics, it is meaningful to explore the air pollution in the Harbin-Changchun (HC) metropolitan area. In this study, the Air Quality Index (AQI) and the corresponding major pollutant were investigated for the HC cities, based on the air quality data derived from the China National Environmental Monitoring Center. The number of days with the air quality level of “good” gradually increased during recent years, pointing to an improvement of the air quality in HC. It was also found that ozone, a typical secondary pollutant, exhibited stronger inter-city correlations compared to typical primary pollutants such as carbon monoxide and nitrogen dioxide. In addition, for nearly all the HC cities, the concentrations of fine particulate matter (PM2.5) decreased substantially in 2020 compared to 2015. However, this was not the case for ozone, with the most significant increase of ozone observed for HC’s central city, Harbin. This study highlights the importance of ozone reduction for further improving HC’s air quality, and the importance of agricultural fire control for eliminating heavily-polluted and even off-the-charts PM2.5 episodes.
1. Introduction
Air pollution has been paid more and more attention by many studies due to its association with a variety of adverse health effects [1,2,3,4,5,6]. To improve air quality, the Chinese government formulated the new air quality standard (GB3095-2012) in 2012, issued the “Air Pollution Prevention and Control Action Plan” in 2013, and made the “Three-year Action Plan aims for Blue Skies” in 2018 [5,7,8,9,10]. China’s Ministry of Environmental Protection (MEP) and local environmental protection bureaus have established a relatively complete ground detection system [1,5,10]. The six criteria air pollutants (Particulate Pollutants; PM2.5 and PM10. Gaseous Pollutants; SO2, NO2, CO, and O3) can be continuously monitored by ground-based monitoring stations after 2013 and the open-access data can be obtained at the MEP [2,4,9]. According to China’s action plans, local governments began to implement different control policies for various sources of air pollutants, such as coal burning, road traffic, and open biomass burning (OBB) [5,10,11]. Air pollution in economically developed urban agglomerations such as the Beijing Tianjin Hebei (BTH), Yangtze River Delta (YRD), and Pearl River Delta (PRD) regions has improved significantly due to the government’s action plans [4,12,13,14,15,16,17]. With in-depth research on air pollution, scholars began to study air pollution in different regions of China to fill the gaps in this region, such as the Harbin-Changchun (HC) region [9,18,19,20,21,22,23].
HC is located in the Northeast of China [8]. Compared with other study areas, HC is unique in that it has experienced a heating season of up to half a year [9,22]. Due to the low temperature in winter (~−20 °C), the air pollutant components in this region have their unique regional characteristics [7]. The first feature in HC is the heavy use of fossil fuels, especially coal which is the primary energy source during the six-month heating period in urban areas [21]. The second feature is that heating in rural areas requires a large number of crop straws which also sends some air pollutants into the atmosphere [10]. Furthermore, the crop residue was usually burned directly by farmers to ensure the next spring tillage, which made a large number of air pollutants released into the atmosphere [24,25]. The phenomenon of OBB in HC is very common and has been investigated by many studies [11,22,23,26,27,28,29,30]. Because of the unique geographical, climate, and anthropogenic characteristics, it is very meaningful to study the composition of air pollutants in HC [31,32].
In this work, we used the six criteria air pollutants in 11 cities of HC from 2015 to 2020 obtained from MEP to calculate the Air Quality Index (AQI) and the major pollutants according to the HJ633-2012. The air pollution situation in HC is discussed according to the calculated data (AQI and the major pollutants). This paper also discussed whether the annual average of the six criteria air pollutants had reached the Grade II standards. In addition, the influences of OBB and dust weather on six criteria air pollutants in HC were discussed by using the characteristic ratios of PM2.5/SO2 and PM10/PM2.5. The correlation between 11 cities and the coordinated control of PM2.5 and O3 are discussed in the last part of the paper.
2. Materials and Methods
2.1. Study Areas
The Harbin-Changchun (HC) megalopolis, located in the Northeast of China, is the only national-level city cluster with an exceeding six months’ heating period. The HC consists of 11 cities, of which Harbin (HRB), Daqing (DQ), Qiqihar (QQHR), Suihua (SH), and Mudanjiang (MDJ) belong to Heilongjiang Province, and Changchun (CC), Jilin (JL), Siping (SP), Liaoyuan (LY), Songyuan (SY), and Yanbian (YB) belong to Jilin Province. Inner Mongolia and Mongolia are located in the northwest of HC, and the northeast side of the HC is connected to Russia.
2.2. Air Quality Data
The concentrations data of the six criteria air pollutants (PM2.5, PM10, SO2, CO, NO2, and O3-8 h) were downloaded from the publishing website of China Air Quality Online Monitoring and Analysis Platform (https://www.aqistudy.cn/, accessed on 16 December 2021). The locations of 58 monitoring stations in HC can be found in previous studies [2]. According to the GB3095-2012 (https://www.mee.gov.cn/ywgz/fgbz/bz/bzwb/dqhjbh/dqhjzlbz/201203/t20120302_224165.shtml, accessed on 16 December 2021), the O3-8 h refers to the arithmetic mean of the average concentration for 8 consecutive hours, also known as the 8-h moving average. The detection methods of the six criteria air pollutants have been stipulated in China Environmental Protection Standards HJ655-2013 (http://www.mee.gov.cn/ywgz/fgbz/bz/bzwb/jcffbz/201308/t20130802_256855.shtml, accessed on 16 December 2021) and HJ193-2013 (http://www.mee.gov.cn/ywgz/fgbz/bz/bzwb/jcffbz/201308/t20130802_256856.shtml, accessed on 16 December 2021) which was also displayed in Supplementary Material S1.
2.3. The Calculate of Air Quality Index (AQI) and Major Pollutant
According to the HJ633-2012 (http://www.mee.gov.cn/ywgz/fgbz/bz/bzwb/jcffbz/201203/t20120302_224166.shtml, accessed on 16 December 2021), the Air Quality Index (AQI) can be calculated according to the Equations (1) and (2). In Equation (1), the IAQIP represents the individual air quality index (IAQI) of pollutant item P. The CP represents the mass concentration of pollutant item P. The BPHi and BPLo represent the highest and lowest values of the concentration interval with CP in Table 1, respectively. The IAQIHi and IAQILo represent the IAQI values corresponding to BPHi and BPLo in Table 1, respectively.
After IAQI of each pollutant is calculated, the value of AQI is taken from the maximum value of each IAQI, the equation is shown in Equation (2).
AQI = max {IAQI1, IAQI2, IAQI3, ∙∙∙, IAQIn}
The major pollutant refers to the pollutant with the largest IAQI when AQI is greater than 50. The pollutants with IAQI greater than 100 are non-attainment standard pollutants. The details of the calculation method for AQI can also be found in Wang et al. (2014) [1].
3. Results
3.1. Overview of Air Pollutants
The Air Quality Index (AQI) of 11 cities in HC was calculated according to the HJ633-2012. The air quality is divided into six levels (good, moderate, lightly polluted, moderately polluted, heavily polluted, and severely polluted) corresponding to the range of AQI (0–50, 51–100, 101–150, 151–200, 200–300, and >300). Besides, the Chinese Ambient Air Quality Standards (GB3095-2012) stipulates the Grade I standards and Grade II standards for the region I (nature reserves, scenic spots, and other areas requiring special protection) and region II (residential areas, commercial traffic, and mixed residential areas, cultural areas, industrial areas, and rural areas), respectively. The Grade I standard for PM2.5, PM10, SO2, and NO2 is 15, 40, 20, and 40 µg/m3, respectively. The Grade II standard for PM2.5, PM10, SO2, and NO2 is 35, 70, 60, and 40 µg/m3, respectively. There is no annual average standard for CO and O3. This part mainly discusses whether the annual average of the six criteria air pollutants has reached the Grade II standards, the annual variation of six of air quality levels, and the annual change of the non-attainment days (AQI > 100).
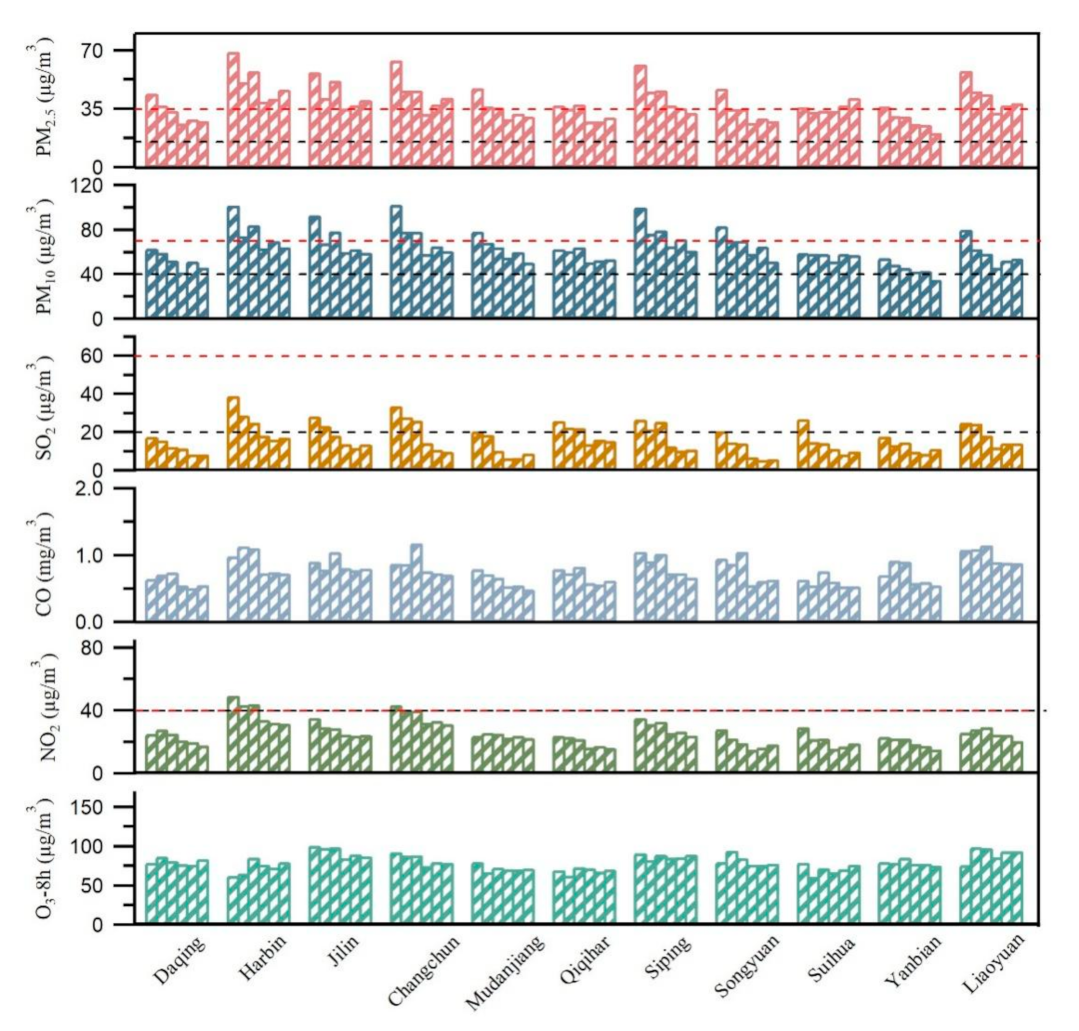
The annual average of the six criteria air pollutants in HC was displayed in Figure 1. The red dotted line represents Grade II standards, and the black dotted line represents the Grade I standards. The inter-annual variation of PM2.5 showed a downward trend but the annual average in Harbin, Jilin, Changchun, and Liaoyuan still exceeded the Grade II standard (35 µg/m3). The annual average of PM2.5 in Daqing, Mudanjiang, Qiqihar, Siping, and Songyuan had years exceeding the Grade II standard before 2017 but reached the standard after 2018. It is worth mentioning that the annual average concentration of PM2.5 in Yanbian is lower than the standard in all years. However, the annual average concentration of PM2.5 in Suihua remained stable, but slightly exceeded the Grade II standard in 2019 (37.03 µg/m3) and 2020 (41.57 µg/m3). The inter-annual variation trend of PM10 is similar to PM2.5. The annual average concentration of PM10 in Daqing, Qiqihar, Suihua, and Yanbian was lower than the Grade II standard (70 µg/m3) in all years. Harbin, Changchun, Jilin, and Siping reached the Grade II standard after 2018. The annual average concentration of PM10 in Songyuan and Liaoyuan exceeded the standard only in 2015. The annual average of SO2 in all cities reached the Grade II standard (60 µg/m3) from 2015 to 2020. Only provincial capitals (Harbin and Changchun) failed to reach the Grade II standard (40 µg/m3) for NO2 before 2017. According to the comparison between the average annual concentration of pollutants and the Grade II standards, PM2.5 and PM10 are the main air pollutants in HC. It should be noted that SO2 and NO2 declined during the COVID-19 lockdown period compared to other years according to the Figures S1 and S2. These results are similar to the results of Kazuyuki. (2021) [33], which showed about 20% of NOx reduction was estimated in January and February 2020 for the whole of China using the global data assimilation.
Based on the AQI system, the air quality is divided into six levels. The inter-annual change of six different polluted days in different cities of HC from 2015 to 2020 is shown in Figure 2a. As shown in Figure 2a, it can be seen that the air quality in HC was gradually improving, mainly reflected in the obvious increase in the number of days with the level of “good”. The total non-attainment days (AQI > 100) and the major pollutants in the 11 cities of HC during 2015 to 2020 are shown in Figure 2b. The number of days with PM2.5 as the major pollutant was the largest in the whole year. In addition, the inter-annual variation of the total non-attainment days showed a trend of fluctuating decline.
3.2. The Major Pollutant
The proportion of the major pollutants during non-attainment periods in the 11 cities of HC is shown in Figure S3. The proportion of the days with PM2.5 as the major pollutant exceeded 50% in all cities. The proportion of PM10 as the major pollutant was higher in the western cities (Siping, Songyuan, and Daqing) than in other cities of HC. O3 was also one of the major pollutants but CO, NO2, and SO2 as the major pollutants rarely appeared in HC. In terms of the proportion of the major pollutants, the main pollutant in HC was PM2.5.
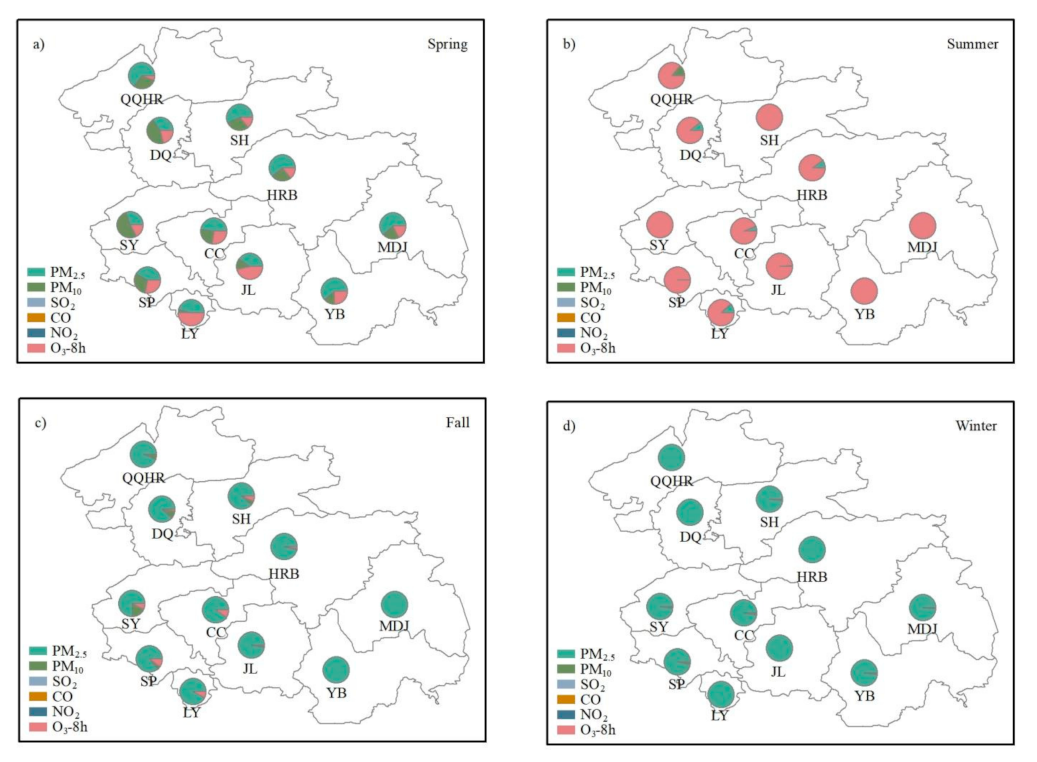
The proportion of the major pollutants in different seasons during non-attainment periods is shown in Figure 3a–d. In spring (From 1 March to 31 May), the proportion of PM2.5 as the major pollutant was usually the highest, which was displayed in Figure 3a. In Siping, Songyuan, and Daqing, the proportion of PM10 as the major pollutant was higher than in other cities. Based on our previous research [2], this may be influenced by the dust weather from Inner Mongolia, especially in spring. O3 was also one of the major pollutants in spring. The formation of O3 is influenced by precursor concentrations such as VOCs and photochemical reactions [5,34]. The photochemical reactions in spring and summer (From 1 June to 31 August) are usually higher than those in autumn and winter, which is the reason why the high proportion of O3 as the major pollutant often occurs in spring and summer. As shown in Figure 3b, the major pollutant in summer was O3. According to Figure 3c,d, the main pollutant in fall (From 1 September to 30 November) and winter (From 1 December to 28/29 February) was particulate matter, especially PM2.5.
3.3. The Pollution Characteristics of HC during Special Pollution Periods
3.3.1. The Pollution Characteristics of Dust Weather
Sandstorms are very common in northeast China, this has been reported by many studies [35,36]. The main pollutant brought by dust weather is particulate matter (especially PM10), and the ratio of PM10 to PM2.5 is a good indicator to distinguish dust weather. To discuss the influence of dust weather, scatter plots of PM10 and PM2.5 were made in the left part of Figure 4. It is clearly seen that the red dots have a significantly higher ratio of PM10/PM2.5. When discussing the impact of dust weather, the data we select is only non-attainment data (Total 3570 points). Case B was divided under the condition that PM10 did not meet the daily Grade II standard (150 µg/m3) and the ratio of PM10/PM2.5 was greater than 2.7. The rest of the polluted weather was Case A. In this way, Case B which was greatly affected by dust can be segmented to discuss the pollution characteristics of the two Cases. The pie charts on the right of Figure 4 showed the percentages of the two Cases in different seasons. According to the pie charts, the data of Case B mainly comes from the spring period, which also proves that our division is relatively accurate.
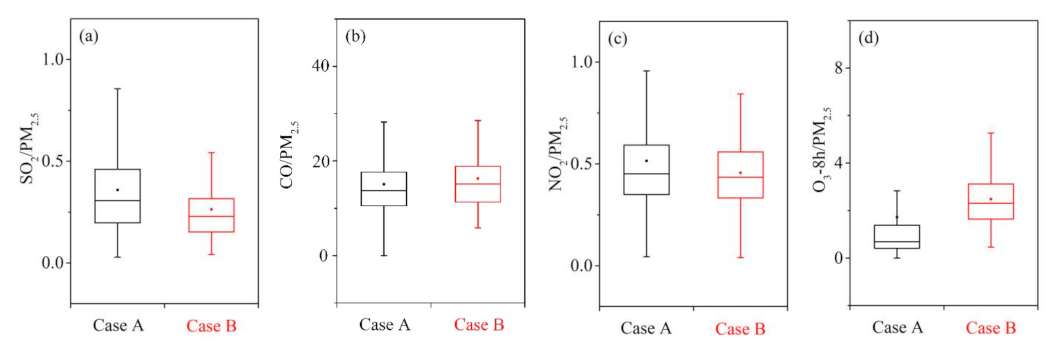
According to the classification of Case A and B, the ratio of SO2/PM2.5, CO/PM2.5, NO2/PM2.5, and O3/PM2.5 is discussed in Figure 5a–d. The SO2/PM2.5 ratio of Case B is slightly lower than that of Case A according to Figure 5a. As shown in Figure 5b,c, there are no significant differences in CO/PM2.5 and NO2/PM2.5 ratios between Case A and B. As shown in Figure 5d, the ratio of O3/PM2.5 in Case B is significantly higher than that of Case A, which seems to be an uncommon phenomenon because the contribution of dust to the O3 generated by the secondary reaction is limited. The formation of O3 is influenced by precursor concentrations such as VOCs and photochemical reactions [5,34]. According to the characteristics of Case B, almost all data are taken from spring. Therefore, the reason for the high O3/PM2.5 in Case B should be the strong photochemical reactions in spring that lead to the production of O3.
3.3.2. The Pollution Characteristics of Open Biomass Burning (OBB)
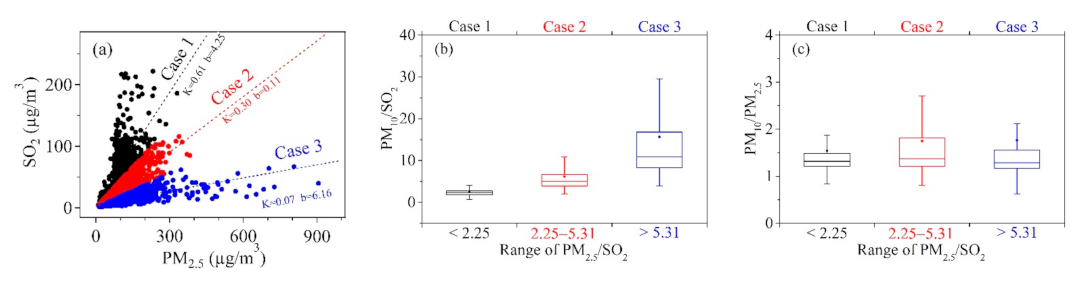
The grain yield in HC is very competitive in China [37]. After harvest, the crop residue was usually burned directly by farmers to ensure the next spring tillage, which leads to a lot of OBB phenomena. In Beijing, heavy pollution can be caused by adverse diffusion meteorological conditions [12] or the growth of secondary aerosols [38] rather than OBB. Regional transport (the western part of Jiangsu province) is one of the main reasons of the haze period in the YRD region [39,40]. During the haze period in the PRD region, the descending motion is prevailing in the planetary boundary layer (PBL) [41]. However, heavy haze events caused by large-scale OBB are common in HC, but rarely occur in BTH, YRD, and PRD regions which have unique episodes of HC. According to published reports, the emission factors of PM2.5 from biomass combustion are much higher than SO2 [42,43,44]. According to the results of Cao et al. (2008) [42], the ratio of PM2.5/SO2 produced by stove combustion is 132.75 for corn straw and 34.89 for rice straw, respectively. The PM2.5/SO2 ratio of agricultural residues was 10.5 which was measured by Andreae (2019) [43]. Xu et al. (2019) also summarized the emission factors of various crops (corn, rice, and wheat), and the PM2.5/SO2 ratio in these emission factors was all greater than 10 [44]. According to previous stove combustion experiments, the PM2.5/SO2 ratio produced by biomass combustion is relatively high (higher than 10). In the observation experiment, the PM2.5/SO2 ratio also increased when there were more fire points. In addition, in previous studies, PM2.5/SO2 frequency distribution presents a bimodal distribution when the concentration of PM2.5 is higher than 115 µg/m3 [2]. Therefore, PM2.5/SO2 is effective in distinguishing OBB, especially on heavy pollution days. Based on previous research results, this paper divided three Cases (Case 1, Case 2, and Case 3) by the PM2.5/SO2 ratio, which was displayed in Figure 6a. The contribution of OBB to Case 1, Case 2, and Case 3 is gradually increasing. It is worth noting that the heavy pollution with PM2.5 greater than 500 µg/m3 all occurred in Case 1, which had a relatively large contribution from OBB. This phenomenon is a unique characteristic of HC.
The ratio of PM10/SO2 and PM10/PM2.5 for Case 1, Case 2, and Case 3 was displayed in Figure 6b,c, respectively. In Case 3, the contribution of biomass combustion is relatively large, the PM10/SO2 ratio is the highest, but the PM10/PM2.5 ratio is not. This indicates that the concentration of particulate matter (PM2.5 and PM10) increases during OBB periods, but the increase of the fine particulate (PM2.5) is more evident than the coarse particulate (PM10).
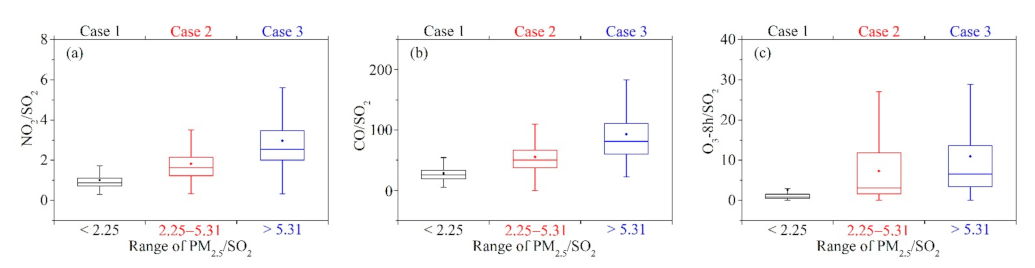
In Figure 7a–c, the ratio of NO2/SO2, CO/SO2, and O3-8 h/SO2 in three Cases was discussed. The ratios of NO2/SO2 and CO/SO2 showed an increasing trend from Case 1 to Case 3. Nitrogen fertilizer is one of the main fertilizers of crops. It is normal for a relatively high NO2/SO2 ratio to appear in Case 3. Biomass combustion, especially incomplete combustion, produces a large amount of CO [22,27]. According to the results of Cheng et al. (2020), the ratio of EC/CO (the tracer to identify flaming and smoldering) is small in the Case that contributes more to OBB which indicates the OBB in HC tends to incomplete combustion [8]. Therefore, the increasing trend of CO/SO2 ratio from Case 1 to Case 3 is credible. Compared with Case 1, the ratio of O3-8 h/SO2 in Case 2 and Case 3 are also higher. This may be due to the large amount of VOCs emitted by OBB, and the increase of ozone precursors which leads to the increase in the concentration of O3.
3.4. The Correlation between 11 Cities and the Coordinated Control of PM2.5 and O3
3.4.1. The Pearson Correlation Coefficients between 11 Cities
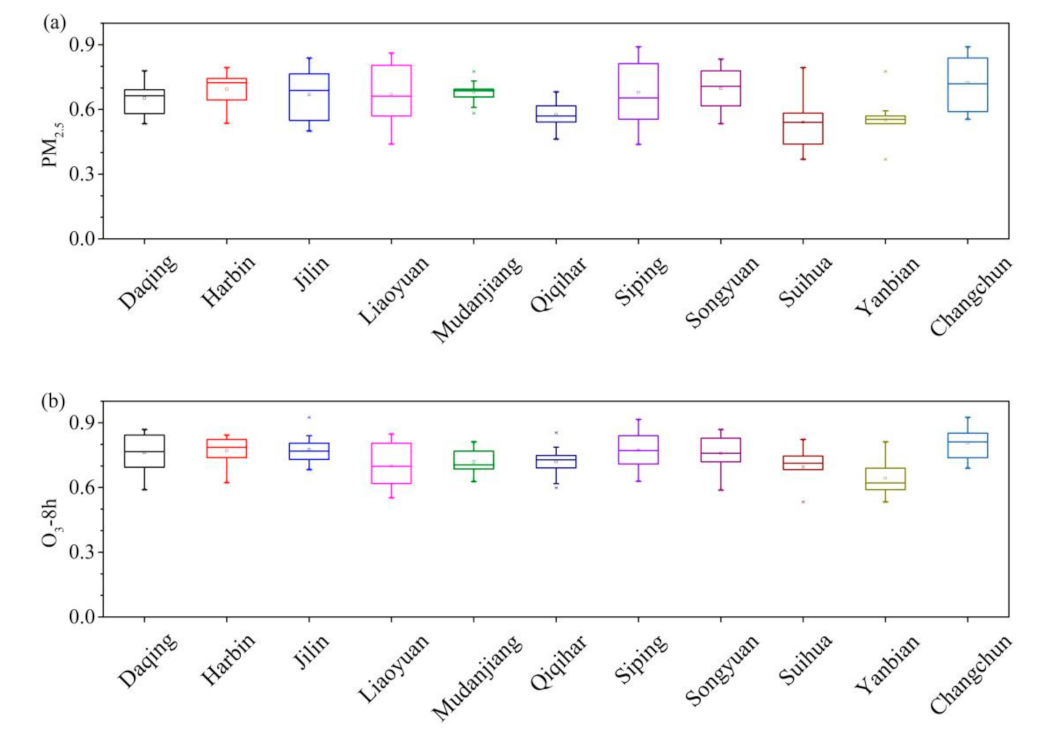
This part mainly discusses the Pearson correlation coefficients of various pollutants in 11 cities of HC. Tables S1–S7 represents the Pearson correlation coefficients of AQI, PM2.5, PM10, SO2, CO, NO2, and O3-8 h, respectively. In order to clearly understand the Pearson correlation coefficients in HC, the different pollutants’ correlation coefficients of each city and the other 10 cities are made into a box plot. The Pearson correlation coefficients of PM2.5, O3-8 h, AQI, PM10, SO2, CO, and NO2 in each city were shown in Figure 8a,b and Figure S4a–e, respectively. The Pearson correlation coefficients of all pollutants in HC are high. The regional Pearson correlation coefficients of secondary pollutant (O3-8 h) are higher than that of primary pollutant (PM2.5).
3.4.2. The Coordinated Control of PM2.5 and O3
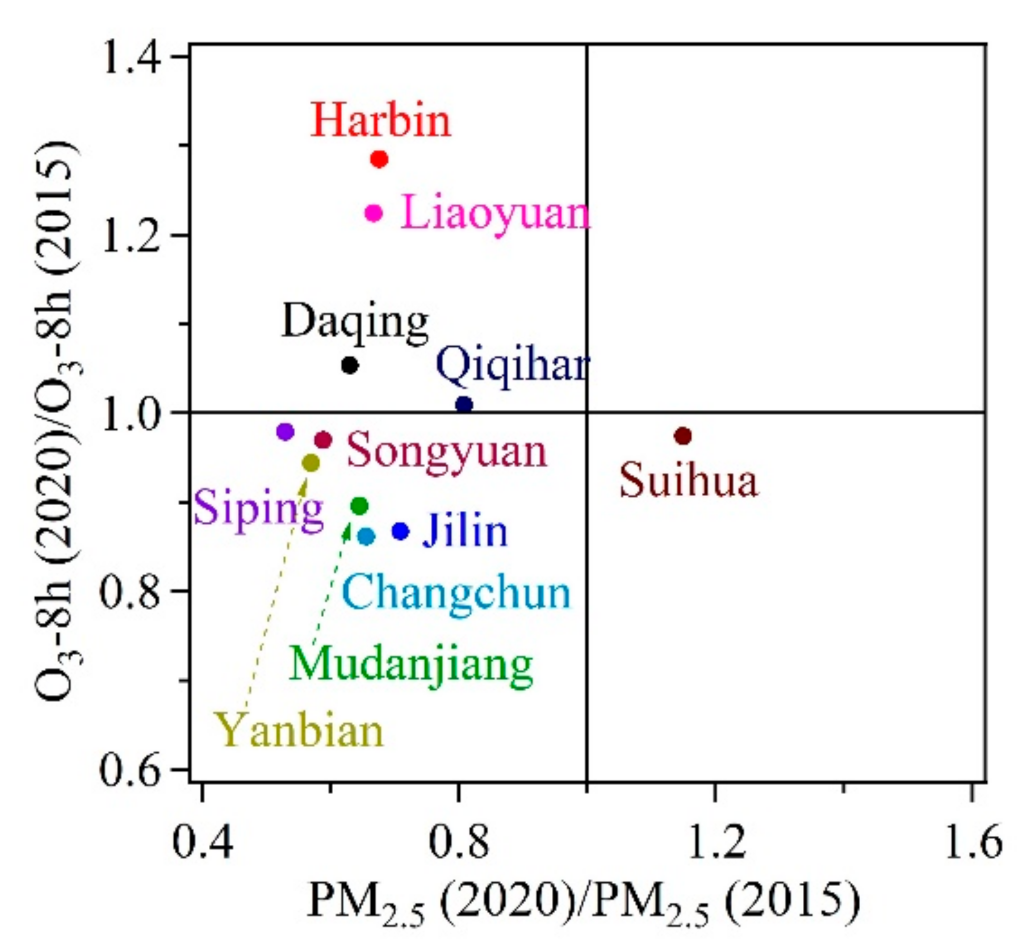
A quadrant graph is made by taking the ratio of PM2.5 in 2020 to PM2.5 in 2015 as the X-axis and the ratio of O3 in 2020 to O3 in 2015 as the Y-axis, which is displayed in Figure 9. Yanbian, Changchun, Jilin, Mudanjiang, Songyuan, and Siping showed a double downward trend in PM2.5 and O3. PM2.5 in Harbin, Liaoyuan, Daqing, and Qiqihar shows a downward trend while O3 shows an upward trend. Therefore, these cities should be paid more attention to the coordinated control of PM2.5 and O3. In Suihua, O3 shows a downward trend, but PM2.5 shows an upward trend. The city still needs to give priority to controlling the growth of PM2.5.
4. Conclusions
The air quality in HC was gradually improving, mainly reflected in the obvious increase in the number of days with the level of “good”. The inter-annual variation of the total non-attainment days (AQI > 100) showed a trend of fluctuating decline. In spring, the major pollutants in HC were PM2.5, PM10, and O3. In summer, autumn, and winter, the major pollutant was O3, PM2.5, and PM2.5, respectively. The dust weather mainly contributes to particulate pollutants but has limited contribution to gaseous pollutants. OBB has a certain contribution to all kinds of pollutants, among which the contribution to PM2.5 is higher than PM10. The correlation between pollutants in HC is high. The regional Pearson correlation coefficients of secondary pollutant (O3-8 h) are higher than that of primary pollutant (PM2.5). The cities of Harbin, Liaoyuan, Daqing, and Qiqihar should be paid more attention regarding the coordinated control of PM2.5 and O3.
Supplementary Materials
The following are available online at https://www.mdpi.com/article/10.3390/toxics9120357/s1, S1: The detection methods of the six criteria air pollutants. Figure S1: The concentration of six pollutants in HC from 2015 to 2020 in January. From left to right represent the years from 2015 to 2020, respectively, Figure S2: The concentration of six pollutants in HC from 2015 to 2020 in February. From left to right represent the years from 2015 to 2020, respectively, Figure S3: The proportion of the major pollutants during non-attainment periods in the 11 cities of HC, Figure S4: The box plot of Pearson correlation coefficient of different pollutants for each city with other cities in HC. (a) AQI, (b) PM10, (c) SO2, (d) CO, and (e) NO2, Table S1: The Pearson Correlation of AQI in HC, Table S2: The Pearson Correlation of PM2.5 in HC, Table S3: The Pearson Correlation of PM10 in HC, Table S4: The Pearson Correlation of SO2 in HC, Table S5: The Pearson Correlation of CO in HC, Table S6: The Pearson Correlation of NO2 in HC, Table S7: The Pearson Correlation of O3-8 h in HC.
Author Contributions
Y.W.: Investigation, Writing—Original Draft. Y.S.: Writing—Review & Editing. G.Z.: Validation. Y.C.: Conceptualization, Methodology, Writing—Review & Editing. All authors have read and agreed to the published version of the manuscript.
Funding
This work was supported by the National Natural Science Foundation of China (41805097).
Institutional Review Board Statement
Not applicable.
Informed Consent Statement
Not applicable.
Data Availability Statement
The mass concentration data of six air pollutants was downloaded from the China Air Quality Online Monitoring and Analysis Platform (https://www.aqistudy.cn/, accessed on 16 December 2021).
Conflicts of Interest
The authors declare no conflict of interest.
References
- Wang, Y.; Ying, Q.; Hu, J.; Zhang, H. Spatial and temporal variations of six criteria air pollutants in 31 provincial capital cities in China during 2013–2014. Environ. Int. 2014, 73, 413–422. [Google Scholar] [CrossRef]
- Wang, Y.; Sun, Y.; Zhang, Z.; Cheng, Y. Spatiotemporal variation and source analysis of air pollutants in the Harbin-Changchun (HC) region of China during 2014–2020. Environ. Sci. Ecotechnol. 2021, 8, 100126. [Google Scholar] [CrossRef]
- Li, X.; Hu, X.M.; Ma, Y.; Wang, Y.; Li, L.; Zhao, Z. Impact of planetary boundary layer structure on the formation and evolution of air-pollution episodes in Shenyang, Northeast China. Atmos. Environ. 2019, 214, 116850. [Google Scholar] [CrossRef]
- Ma, T.; Duan, F.; He, K.; Qin, Y.; Tong, D.; Geng, G.; Liu, X.; Li, H.; Yang, S.; Ye, S.; et al. Air pollution characteristics and their relationship with emissions and meteorology in the Yangtze River Delta region during 2014–2016. J. Environ. Sci. 2019, 83, 8–20. [Google Scholar] [CrossRef]
- Chu, B.; Ma, Q.; Liu, J.; Ma, J.; Zhang, P.; Chen, T.; Feng, Q.; Wang, C.; Yang, N.; Ma, H.; et al. Air pollutant correlations in China: Secondary air pollutant responses to NOx and SO2 control. Environ. Sci. Technol. Lett. 2020, 7, 695–700. [Google Scholar] [CrossRef]
- Li, X.; Ma, Y.; Wang, Y.; Wei, W.; Zhang, Y.; Liu, N.; Hong, Y. Vertical distribution of particulate matter and it’s relationship with planetary boundary layer structure in Shenyang, Northeast China. Aerosol Air Qual. Res. 2019, 19, 2464–2476. [Google Scholar] [CrossRef]
- Cheng, Y.; Yu, Q.Q.; Liu, J.M.; Zhu, S.; Zhang, M.; Zhang, H.; Zheng, B.; He, K.B. Model vs. observation discrepancy in aerosol characteristics during a half-year long campaign in Northeast China: The role of biomass burning. Environ. Pollut. 2021, 269, 116167. [Google Scholar] [CrossRef] [PubMed]
- Cheng, Y.; Yu, Q.Q.; Liu, J.M.; Du, Z.Y.; Liang, L.L.; Geng, G.N.; Zheng, B.; Ma, W.L.; Qi, H.; Zhang, Q.; et al. Strong biomass burning contribution to ambient aerosol during heating season in a megacity in Northeast China: Effectiveness of agricultural fire bans? Sci. Total Environ. 2021, 754, 142144. [Google Scholar] [CrossRef]
- Li, B.; Shi, X.F.; Liu, Y.P.; Lu, L.; Wang, G.L.; Thapa, S.; Sun, X.Z.; Fu, D.L.; Wang, K.; Qi, H. Long-term characteristics of criteria air pollutants in megacities of Harbin-Changchun megalopolis, Northeast China: Spatiotemporal variations, source analysis, and meteorological effects. Environ. Pollut. 2020, 267, 115441. [Google Scholar] [CrossRef] [PubMed]
- Li, L.; Wang, K.; Chen, W.W.; Zhao, Q.L.; Liu, L.J.; Liu, W.; Liu, Y.; Jiang, J.Q.; Liu, J.M.; Zhang, M.D. Atmospheric pollution of agriculture-oriented cities in Northeast China: A case in Suihua. J. Environ. Sci. 2020, 97, 85–95. [Google Scholar] [CrossRef] [PubMed]
- Chen, W.; Tong, D.Q.; Zhang, S.; Zhang, X.; Zhao, H. Local PM10 and PM2.5 emission inventories from agricultural tillage and harvest in Northeastern China. J. Environ. Sci. 2017, 57, 15–23. [Google Scholar] [CrossRef] [PubMed]
- Long, X.; Bei, N.F.; Wu, J.R.; Li, X.; Feng, T.; Xing, L.; Zhao, S.Y.; Cao, J.J.; Tie, X.X.; An, Z.S.; et al. Does afforestation deteriorate haze pollution in Beijing-Tianjin-Hebei (BTH), China? Atmos. Chem. Phys. 2018, 18, 10869–10879. [Google Scholar] [CrossRef] [Green Version]
- Li, X.; Wu, J.R.; Elser, M.; Feng, T.; Cao, J.J.; El-Haddad, I.; Huang, R.J.; Tie, X.X.; Prevot, A.S.H.; Li, G.H. Contributions of residential coal combustion to the air quality in Beijing-Tianjin-Hebei (BTH), China: A case study. Atmos. Chem. Phys. 2018, 18, 10675–10691. [Google Scholar] [CrossRef] [Green Version]
- Wang, H.; Li, J.W.; Gao, M.; Chan, T.C.; Gao, Z.Q.; Zhang, M.Y.; Li, Y.B.; Gu, Y.F.; Chen, A.B.; Yang, Y.J.; et al. Spatiotemporal variability in long-term population exposure to PM2.5 and lung cancer mortality attributable to PM2.5 across the Yangtze River Delta (YRD) region over 2010-2016: A multistage approach. Chemosphere 2020, 257, 127153. [Google Scholar] [CrossRef] [PubMed]
- Shu, L.; Wang, T.J.; Xie, M.; Li, M.M.; Zhao, M.; Zhang, M.; Zhao, X.Y. Episode study of fine particle and ozone during the CAPUM-YRD over Yangtze River Delta of China: Characteristics and source attribution. Atmos. Environ. 2019, 203, 87–101. [Google Scholar] [CrossRef]
- Kong, L.W.; Hu, M.; Tan, Q.W.; Feng, M.; Qu, Y.; An, J.L.; Zhang, Y.H.; Liu, X.G.; Cheng, N.L. Aerosol optical properties under different pollution levels in the Pearl River Delta (PRD) region of China. J. Environ. Sci. 2020, 87, 49–59. [Google Scholar] [CrossRef] [PubMed]
- Yan, F.H.; Chen, W.H.; Jia, S.G.; Zhong, B.Q.; Yang, L.M.; Mao, J.Y.; Chang, M.; Shao, M.; Yuan, B.; Situ, S.; et al. Stabilization for the secondary species contribution to PM2.5 in the Pearl River Delta (PRD) over the past decade, China: A meta-analysis. Atmos. Environ. 2020, 242, 117817. [Google Scholar] [CrossRef]
- Zhao, H.; Che, H.; Zhang, L.; Gui, K.; Ma, Y.; Wang, Y.; Wang, H.; Zheng, Y.; Zhang, X. How aerosol transport from the North China plain contributes to air quality in Northeast China. Sci. Total Environ. 2020, 738, 139555. [Google Scholar] [CrossRef]
- Cheng, Y.; Yu, Q.Q.; Cao, X.B.; Yan, C.Q.; Zhong, Y.J.; Du, Z.Y.; Liang, L.L.; Ma, W.L.; Qi, H.; Zheng, M.; et al. Strong impacts of legitimate open burning on brown carbon aerosol in Northeast China. Environ. Sci. Technol. Lett. 2021, 8, 732–738. [Google Scholar] [CrossRef]
- Zhang, Y.L.; Kawamura, K.; Agrios, K.; Lee, M.; Salazar, G.; Szidat, S. Fossil and nonfossil sources of organic and elemental carbon aerosols in the outflow from Northeast China. Environ. Sci. Technol. 2016, 50, 6284–6292. [Google Scholar] [CrossRef]
- Zhang, J.; Liu, L.; Wang, Y.; Ren, Y.; Wang, X.; Shi, Z.; Zhang, D.; Che, H.; Zhao, H.; Liu, Y.; et al. Chemical composition, source, and process of urban aerosols during winter haze formation in Northeast China. Environ. Pollut. 2017, 231, 357–366. [Google Scholar] [CrossRef]
- Li, Y.; Liu, J.; Han, H.; Zhao, T.; Zhang, X.; Zhuang, B.; Wang, T.; Chen, H.; Wu, Y.; Li, M. Collective impacts of biomass burning and synoptic weather on surface PM2.5 and CO in Northeast China. Atmos. Environ. 2019, 213, 64–80. [Google Scholar] [CrossRef]
- Zhao, H.; Tong, D.Q.; Gao, C.; Wang, G. Effect of dramatic land use change on gaseous pollutant emissions from biomass burning in Northeastern China. Atmos. Res. 2015, 153, 429–436. [Google Scholar] [CrossRef]
- Cao, F.; Zhang, S.C.; Kawamura, K.; Liu, X.; Yang, C.; Xu, Z.; Fan, M.; Zhang, W.; Bao, M.; Chang, Y.; et al. Chemical characteristics of dicarboxylic acids and related organic compounds in PM2.5 during biomass-burning and non-biomass-burning seasons at a rural site of Northeast China. Environ. Pollut. 2017, 231, 654–662. [Google Scholar] [CrossRef] [PubMed]
- Cao, F.; Zhang, S.C.; Kawamura, K.; Zhang, Y.L. Inorganic markers, carbonaceous components and stable carbon isotope from biomass burning aerosols in Northeast China. Sci. Total Environ. 2016, 572, 1244–1251. [Google Scholar] [CrossRef]
- Wang, L.; Jin, X.; Wang, Q.; Mao, H.; Liu, Q.; Weng, G.; Wang, Y. Spatial and temporal variability of open biomass burning in Northeast China from 2003 to 2017. Atmos. Ocean. Sci. Lett. 2020, 13, 240–247. [Google Scholar] [CrossRef] [Green Version]
- Yin, S.; Wang, X.; Zhang, X.; Zhang, Z.; Xiao, Y.; Tani, H.; Sun, Z. Exploring the effects of crop residue burning on local haze pollution in Northeast China using ground and satellite data. Atmos. Environ. 2019, 199, 189–201. [Google Scholar] [CrossRef]
- Wang, Q.; Wang, L.; Li, X.; Xin, J.; Liu, Z.; Sun, Y.; Liu, J.; Zhang, Y.; Du, W.; Jin, X.; et al. Emission characteristics of size distribution, chemical composition and light absorption of particles from field-scale crop residue burning in Northeast China. Sci. Total Environ. 2020, 710, 136304. [Google Scholar] [CrossRef]
- Yang, G.; Zhao, H.; Tong, D.Q.; Xiu, A.; Zhang, X.; Gao, C. Impacts of post-harvest open biomass burning and burning ban policy on severe haze in the Northeastern China. Sci. Total Environ. 2020, 716, 136517. [Google Scholar] [CrossRef] [PubMed]
- Ma, G.; Zhao, T.; Kong, S.; Bao, Y.; Chen, C.; Gong, S.; Guo, J.; Yu, C.; Wu, M.; Chang, J.; et al. Variations in FINN emissions of particulate matters and associated carbonaceous aerosols from remote sensing of open biomass burning over Northeast China during 2002–2016. Sustainability 2018, 10, 3353. [Google Scholar] [CrossRef] [Green Version]
- Li, L.; Wang, K.; Sun, Z.; Wang, W.; Zhao, Q.; Qi, H. Bottom-Up emission inventory and its spatio-temporal distribution from paved road dust based on field investigation: A case study of Harbin, Northeast China. Atmosphere 2021, 12, 449. [Google Scholar] [CrossRef]
- Zhang, J.; Liu, L.; Xu, L.; Lin, Q.; Zhao, H.; Wang, Z.; Guo, S.; Hu, M.; Liu, D.; Shi, Z.; et al. Exploring wintertime regional haze in Northeast China: Role of coal and biomass burning. Atmos. Chem. Phys. 2020, 20, 5355–5372. [Google Scholar] [CrossRef]
- Kazuyuki, M.; Bowman, K.; Sekiya, T.; Takigawa, M.; Neu, J.L.; Sudo, K.; Osterman, G.; Eskes, H. Global tropospheric ozone responses to reduced NOx emissions linked to the COVID-19 worldwide lockdowns. Sci. Adv. 2021, 7, eabf7460. [Google Scholar]
- Shao, P.; Xu, X.; Zhang, X.; Xu, J.; Wang, Y.; Ma, Z. Impact of volatile organic compounds and photochemical activities on particulate matters during a high ozone episode at urban, suburb and regional background stations in Beijing. Atmos. Environ. 2020, 236, 117629. [Google Scholar] [CrossRef]
- Hao, Y.; Meng, X.; Yu, X.; Lei, M.; Li, W.; Shi, F.; Yang, W.; Zhang, S.; Xie, S. Characteristics of trace elements in PM2.5 and PM10 of Chifeng, Northeast China: Insights into spatiotemporal variations and sources. Atmos. Res. 2018, 213, 550–561. [Google Scholar] [CrossRef]
- Li, X.; Ma, Y.; Wang, Y.; Liu, N.; Hong, Y. Temporal and spatial analyses of particulate matter (PM10 and PM2.5) and its relationship with meteorological parameters over an urban city in Northeast China. Atmos. Res. 2017, 198, 185–193. [Google Scholar] [CrossRef]
- Li, R.M.; Chen, W.W.; Xiu, A.J.; Zhao, H.M.; Zhang, X.L.; Zhang, S.C.; Tong, D.Q. A comprehensive inventory of agricultural atmospheric particulate matters (PM10 and PM2.5) and gaseous pollutants (VOCs, SO2, NH3, CO, NOx and HC) emissions in China. Ecol. Indic. 2019, 107, 105609. [Google Scholar] [CrossRef]
- Zhang, R.; Sun, X.; Shi, A.; Huang, Y.; Yan, J.; Nie, T.; Yan, X.; Li, X. Secondary inorganic aerosols formation during haze episodes at an urban, site in Beijing, China. Atmos. Environ. 2018, 177, 275–282. [Google Scholar] [CrossRef]
- Fu, X.; Cheng, Z.; Wang, S.; Hua, Y.; Xing, J.; Hao, J. Local and regional contributions to fine particle pollution in winter of the Yangtze River Delta, China. Aerosol. Air Qual. Res. 2016, 16, 1067–1080. [Google Scholar] [CrossRef]
- Chen, X.; Yu, S.; Wang, L.; Li, Z.; Zhang, Y.; Li, M.; Mehmood, K.; Liu, W.; Li, P.; Lichtfouse, E.; et al. Common source areas of air pollution vary with haze intensity in the Yangtze River Delta, China. Environ. Chem. Lett. 2020, 18, 965–987. [Google Scholar] [CrossRef]
- Huang, Y.; Deng, T.; Li, Z.; Wang, N.; Yin, C.; Wang, S.; Fan, S. Numerical simulations for the sources apportionment and control strategies of PM2.5 over Pearl River Delta, China, Part I: Inventory and PM2.5 sources apportionment. Sci. Total Environ. 2018, 634, 1631–1644. [Google Scholar] [CrossRef] [PubMed]
- Cao, G.L.; Zhang, X.Y.; Gong, S.L.; Zheng, F.C. Investigation on emission factors of particulate matter and gaseous pollutants from crop residue burning. J. Environ. Sci. 2008, 20, 50–55. [Google Scholar] [CrossRef]
- Andreae, M.O. Emission of trace gases and aerosols from biomass burning—An updated assessment. Atmos. Chem. Phys. 2019, 19, 8523–8546. [Google Scholar] [CrossRef] [Green Version]
- Xu, Y.; Huang, Z.; Jia, G.; Fan, M.; Cheng, L.; Chen, L.; Shao, M.; Zheng, J. Regional discrepancies in spatiotemporal variations and driving forces of open crop residue burning emissions in China. Sci. Total Environ. 2019, 671, 536–547. [Google Scholar] [CrossRef] [PubMed]
Figure 1.
The annual average values of six pollutants from left to right in different cities represent the 2015–2020 period, respectively. The red dotted line represents Grade II standard and the black dotted line represents the Grade I standard according to the GB3059-2012.
Figure 1.
The annual average values of six pollutants from left to right in different cities represent the 2015–2020 period, respectively. The red dotted line represents Grade II standard and the black dotted line represents the Grade I standard according to the GB3059-2012.

Figure 2.
The six different polluted days and the major pollutants in different cities of HC. (a) The inter-annual change of six different polluted days in different cities of HC from 2015 to 2020. (b) The total non-attainment days (AQI > 100) and the major pollutants in the 11 cities of HC during 2015 to 2020.

Figure 3.
The proportion of the major pollutants in (a) Spring, (b) Summer, (c) Fall, and (d) Winter during non-attainment periods in the 11 cities of HC.
Figure 3.
The proportion of the major pollutants in (a) Spring, (b) Summer, (c) Fall, and (d) Winter during non-attainment periods in the 11 cities of HC.

Figure 4.
The scatter plots of the PM10 and PM2.5 was displayed in (a). Case B was divided under the condition that PM10 did not meet the daily Grade II standard (150 µg/m3) and the ratio of PM10/PM2.5 was greater than 2.7. The remaining part is Case A. (b) The pie charts show the percentages of the two Cases in different seasons.
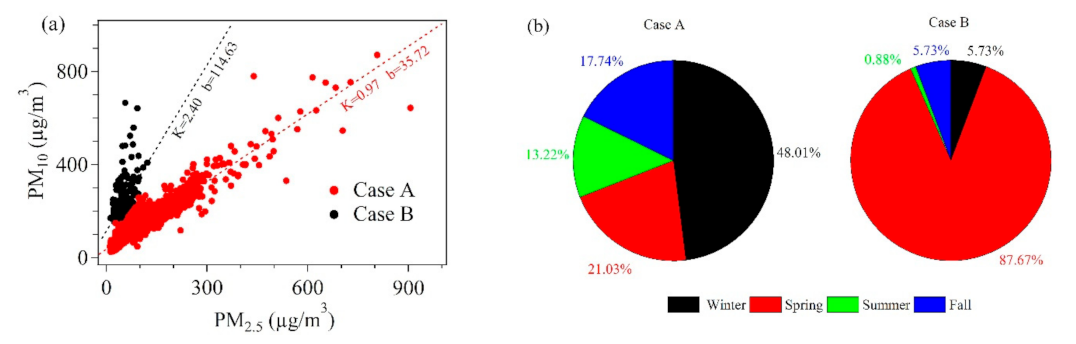
Figure 5.
The ratio characteristics of air pollutants between Case A and B. (a) SO2/PM2.5, (b) CO/PM2.5, (c) NO2/PM2.5, and (d) O3/PM2.5.
Figure 5.
The ratio characteristics of air pollutants between Case A and B. (a) SO2/PM2.5, (b) CO/PM2.5, (c) NO2/PM2.5, and (d) O3/PM2.5.

Figure 6.
(a) The scatter plots of the PM2.5 and SO2. Case1, Case2, and Case3 represent PM2.5/SO2 ratios ranging from <2.25, 2.25–5.31, and >5.31, respectively. (b) The PM10/SO2 ratio of Case 1, Case 2, and Case 3. (c) The PM10/PM2.5 ratio of Case 1, Case 2, and Case 3.
Figure 6.
(a) The scatter plots of the PM2.5 and SO2. Case1, Case2, and Case3 represent PM2.5/SO2 ratios ranging from <2.25, 2.25–5.31, and >5.31, respectively. (b) The PM10/SO2 ratio of Case 1, Case 2, and Case 3. (c) The PM10/PM2.5 ratio of Case 1, Case 2, and Case 3.

Figure 7.
The ratio characteristics of air pollutants between Case 1, Case 2, and Case 3. (a) NO2/SO2, (b) CO/SO2, (c) O3-8 h/SO2.
Figure 7.
The ratio characteristics of air pollutants between Case 1, Case 2, and Case 3. (a) NO2/SO2, (b) CO/SO2, (c) O3-8 h/SO2.

Figure 8.
The box plot of Pearson correlation coefficient of (a) PM2.5 and (b) O3-8 h. for each city with other cities in HC.
Figure 8.
The box plot of Pearson correlation coefficient of (a) PM2.5 and (b) O3-8 h. for each city with other cities in HC.

Figure 9.
The proportion of the major pollutants during non-attainment periods in the 11 cities of HC.
Figure 9.
The proportion of the major pollutants during non-attainment periods in the 11 cities of HC.

Table 1.
The individual air quality index (AQI) and corresponding pollutant concentration limits.
| IAQI | The Concentration Limits of Different Pollutants | |||||
|---|---|---|---|---|---|---|
| The 24-h Average Concentration of PM2.5 (μg/m3) | The 24-h Average Concentration of PM10 (μg/m3) | The 24-h Average Concentration of SO2 (μg/m3) | The 24-h Average Concentration of CO (mg/m3) | The 24-h Average Concentration of NO2 (μg/m3) | The 8-h Moving Average Concentration of O3 (μg/m3) | |
| 0 | 0 | 0 | 0 | 0 | 0 | 0 |
| 50 | 35 | 50 | 50 | 2 | 40 | 100 |
| 100 | 75 | 150 | 150 | 4 | 80 | 160 |
| 150 | 115 | 250 | 475 | 14 | 180 | 215 |
| 200 | 150 | 350 | 800 | 24 | 280 | 265 |
| 300 | 250 | 420 | 1600 | 36 | 565 | 800 |
| 400 | 350 | 500 | 2100 | 48 | 750 | * |
| 500 | 500 | 600 | 2620 | 60 | 940 | * |
* The IAQI of O3 is not calculated when the 8-h moving average concentration of O3 is higher than 800 μg/m3.
Publisher’s Note: MDPI stays neutral with regard to jurisdictional claims in published maps and institutional affiliations. |
© 2021 by the authors. Licensee MDPI, Basel, Switzerland. This article is an open access article distributed under the terms and conditions of the Creative Commons Attribution (CC BY) license (https://creativecommons.org/licenses/by/4.0/).
Share and Cite
MDPI and ACS Style
Wang, Y.; Sun, Y.; Zhao, G.; Cheng, Y. Air Quality in the Harbin-Changchun Metropolitan Area in Northeast China: Unique Episodes and New Trends. Toxics 2021, 9, 357. https://doi.org/10.3390/toxics9120357
AMA Style
Wang Y, Sun Y, Zhao G, Cheng Y. Air Quality in the Harbin-Changchun Metropolitan Area in Northeast China: Unique Episodes and New Trends. Toxics. 2021; 9(12):357. https://doi.org/10.3390/toxics9120357
Chicago/Turabian StyleWang, Yulong, Youwen Sun, Gerong Zhao, and Yuan Cheng. 2021. "Air Quality in the Harbin-Changchun Metropolitan Area in Northeast China: Unique Episodes and New Trends" Toxics 9, no. 12: 357. https://doi.org/10.3390/toxics9120357
Note that from the first issue of 2016, this journal uses article numbers instead of page numbers. See further details here.