1. Introduction
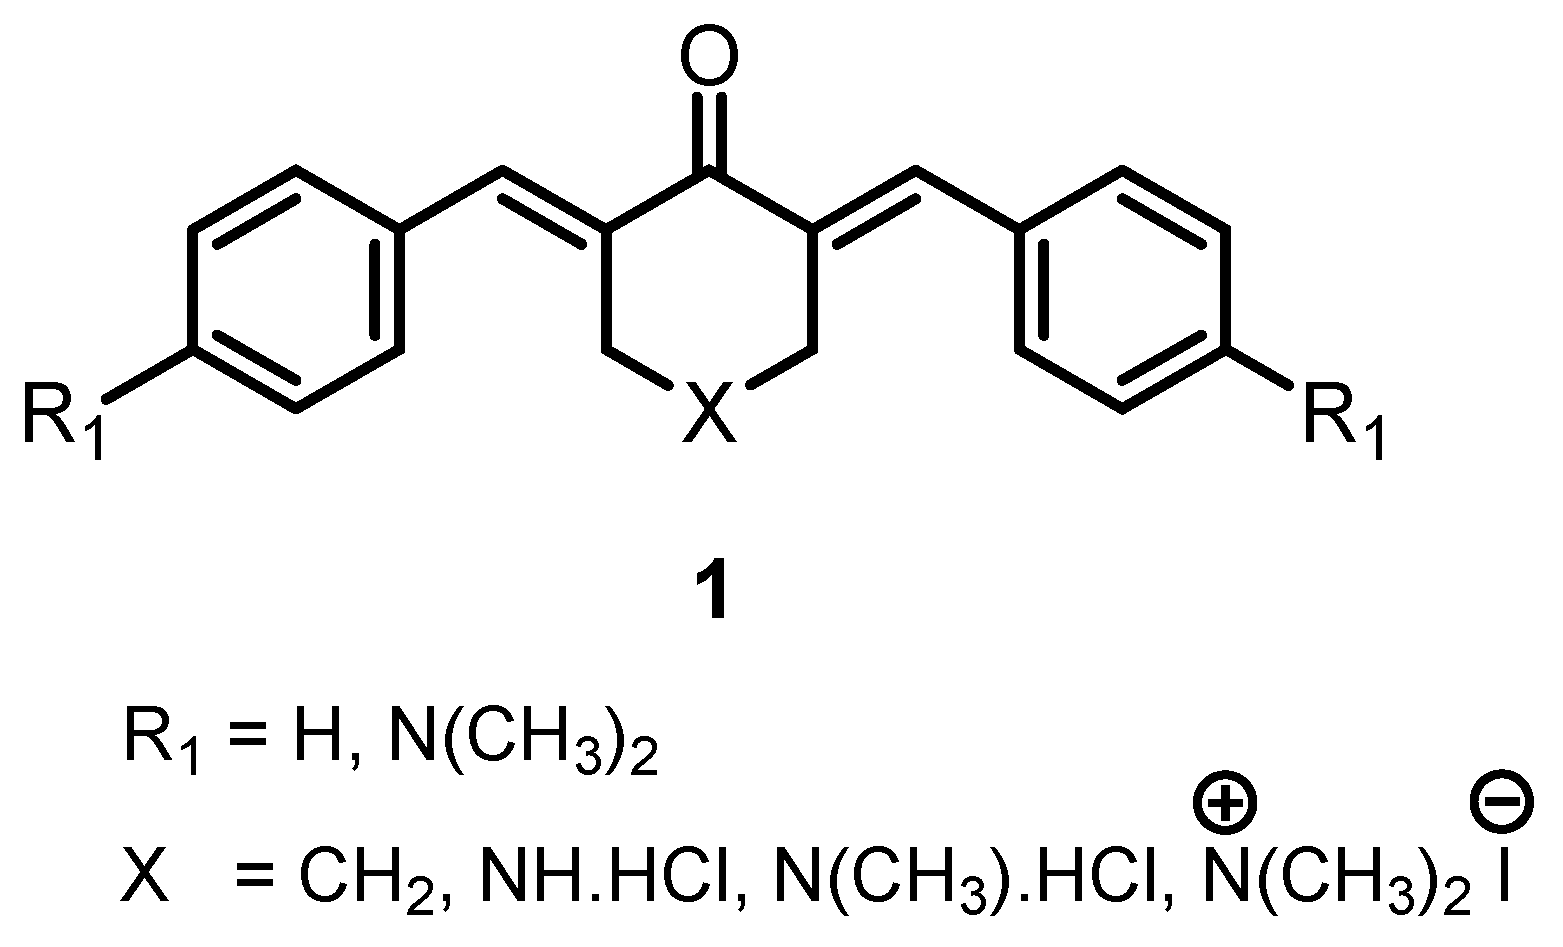
A major interest in our laboratories is the design, synthesis and antineoplastic evaluation of 1,5-diaryl-3-oxo-1,4-pentadienes mounted on a variety of scaffolds, which give rise to series
1 (
Figure 1). Most previous studies of structurally-related compounds were conducted without or with very low numbers of normal cells at the same time as cancer cell lines, making it difficult to compare tumor-specificity between compounds [
1,
2,
3,
4,
5,
6,
7,
8,
9,
10]. Among these previous 10 papers, three papers are from our research group [
5,
6,
7]. Our group used four human oral squamous cell carcinoma cell lines (Ca9-22, HSC-2, HSC-3, HSC-4) with three human normal oral mesenchymal cells (HGF, HPLF, HPC) [
5,
6] and human CRL1790 (non-malignant colon cells) [
10]. Other groups have used human HepG2 (hepatocellular carcinoma), HeLa (cervical cancer), K562 (erythroleukemia), THP-1 (monocytic leukemia), LO2 (hepatocyte cell line) [
1], HCT-116 (colorectal carcinoma), MCF-7 (breast adenocarcinoma) [
2], HepG2, MCF-7 [
3], GCIY (stomach cancer), HCT-116, DLD1 (colorectal adenocarcinoma), SW680 (colon cancer), A549 (lung carcinoma), PK1 (pig kidney epithelial cells), ACHN (renal adenocarcinoma), HUH7 (immortal cell line composed of epithelial-like, tumorigenic cells), OVK18 (ovarian cancer), MCF-7, 8505c (thyroid carcinomas), G361 (melanoma) and PC3 (prostate cancer) [
4], as well as A2780 (ovarian cancer), ACHN, HCT-116 and PC-3 and U937-GTB (leukemic monocyte lymphoma) cell lines [
8], B16 (murine melanoma) and L1210 (murine lymphoma) cells [
7] and P-388 (murine leukemia) [
8] cell lines. Thus, very few previous studies have used human oral cancer cells. Furthermore, most of these papers, except [
1], have not used appropriate normal control cells derived from the same tissues at the same time. By comparing the cytotoxicity of a total 21 compounds (
2a–
2u) against oral malignant and non-malignant cells, with two reference compounds, the present study demonstrated that
2r showed the highest tumor-specificity. One of the purposes of the present study is to prepare compounds which are easy to synthesize and have selective toxicity against oral cancer, for use in a series of our research projects for dental application [
11,
12].
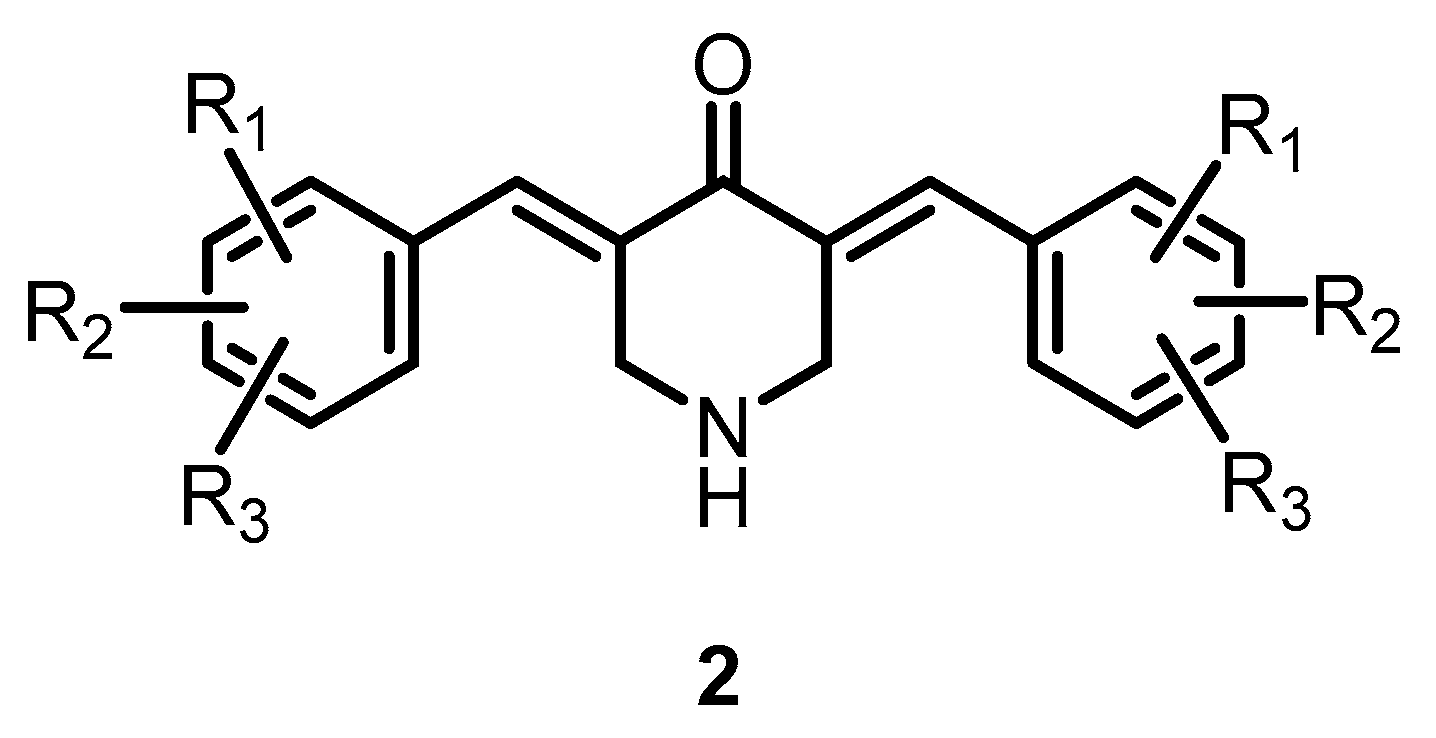
Recently, we have concentrated our efforts on 4-piperidones which have the general structure
2 as indicated in
Figure 2. First, their bioactivity is likely due to reactivity with cellular thiols. However, these dienones do not react readily, if at all, with amino and hydroxyl groups [
13,
14], which are present in nucleic acids. Thus, the possibility of these unsaturated ketones causing genotoxic effects, which are present in a number of anticancer drugs, is reduced. An important goal of this investigation was to find compounds which are more cytotoxic to neoplasms than towards non-malignant cells. If this objective is achieved, then investigations were planned in order to find correlations between various physicochemical substituents and the magnitude of antineoplastic potencies. Such cytotoxic warheads could be converted into more complex candidate anticancer agents through suitable molecular modifications. For example, the placement of a group onto the piperidyl nitrogen atom, which contains a positively charged phosphorous atom, may have a greater attraction to tumour mitochondria than to mitochondria of non-malignant cells [
15].
3. Results
The compounds in series
2 were prepared by the reaction of 4-piperidone with various aryl aldehydes. These dienones were screened against human Ca9-22, HSC-2 and HSC-4 oral squamous carcinomas (
Table 1), as well as human gingival fibroblast (HGF), human periodontal ligament fibroblasts (HPLF) and human pulp cells (HPC) (
Table 2 and
Table 3). In addition, the evaluation of series
2 was also assessed against human Colo205 and HT-29 colon cancers, CEM lymphoid leukemia cells and human Hs27 foreskin fibroblasts (
Table 4 and
Table 5).
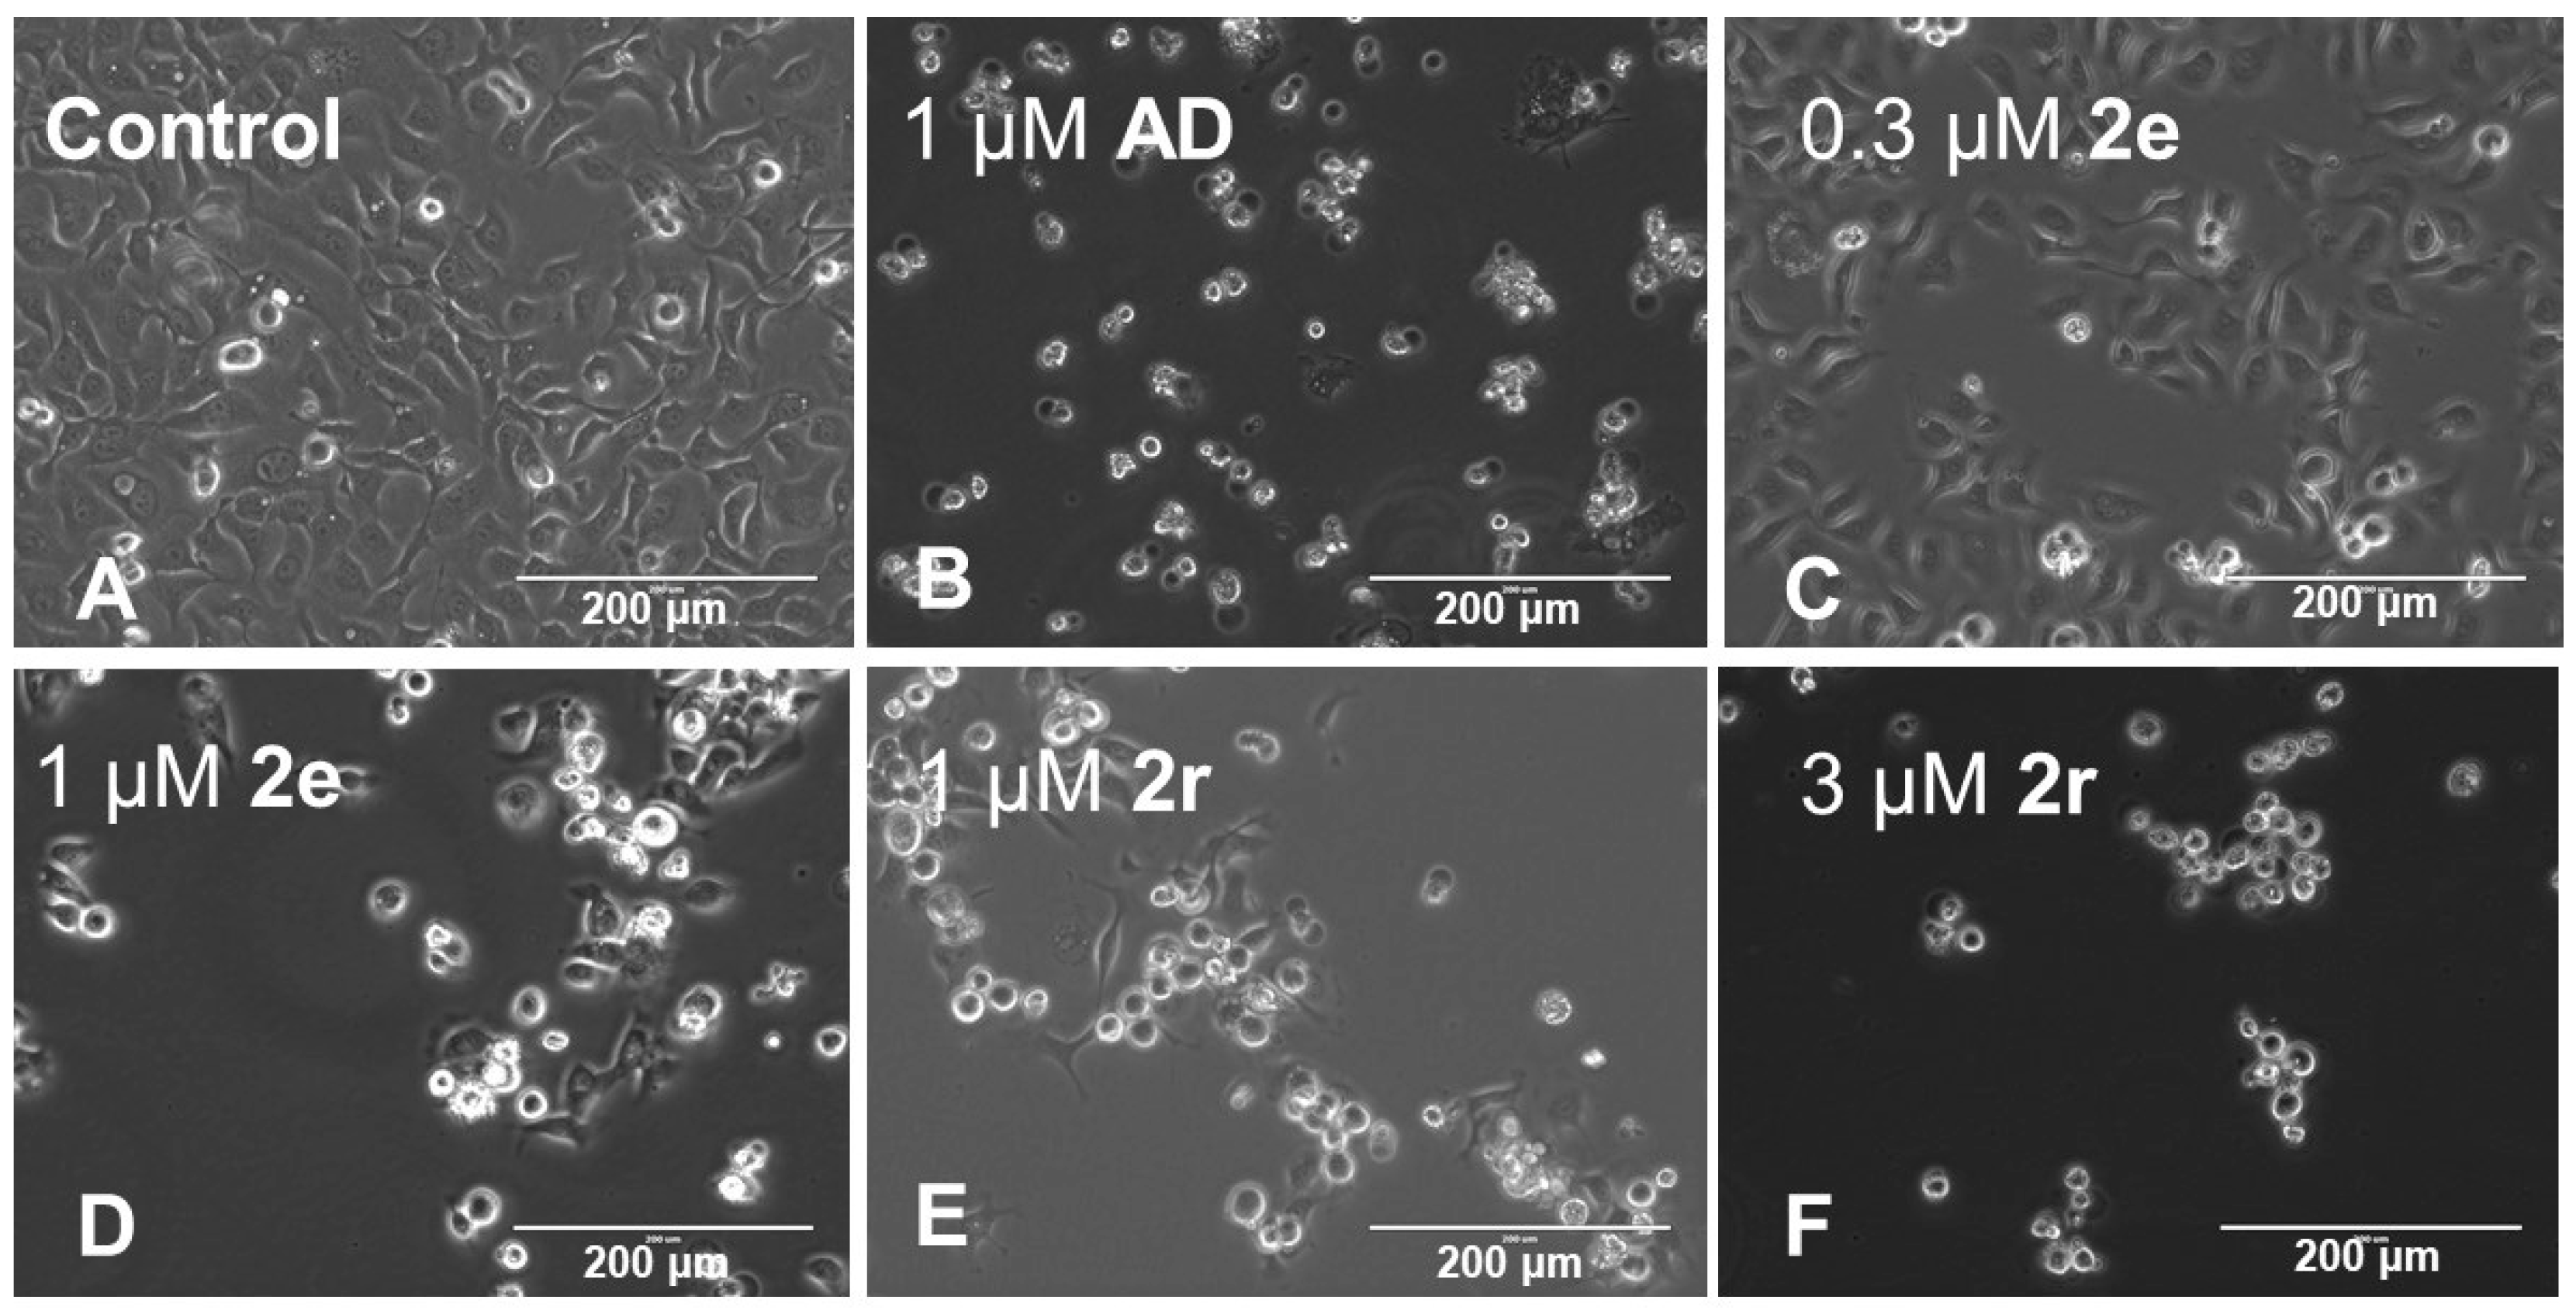
Investigations were implemented to find some of the ways that two representative compounds exert their cytotoxic potencies. Control Ca9-22 cells show a homogenous population (
Figure 4A), with no detectable amount of cleaved products of PARP and procaspase-3 (substrates of caspase 3) (lane 1 in
Figure 5) and low subG1 population levels (consisting of fragmented DNA) (1.7%) (
Table 6). When Ca9-22 cells were treated for 24 h with 1 μM actinomycin D (reference compound), apparent induction of apoptosis markers such as cell shrinkage (
Figure 4B), cleavage of PARP and procaspase (lane 2 in
Figure 5) and subG1 population accumulation (
Table 6) were confirmed. Pictures of the morphologies of the cells before the cell harvest are shown in the lower panel of
Supplementary Figure S2. Reproducible morphological changes were confirmed.
When cells were treated with a lower concentration of
2e (0.3 μM), slight cell speading (
Figure 4C), an undetectable level of cleaved products (lane 3 in
Figure 5) and minor levels of subG1 (2.2%) (
Table 6) were observed. When
2e concentration was increased to 1 μM, cell shrinkage (
Figure 4D), cleavage products (lane 4 in
Figure 5) and subG1 accumulation (9.3%) were more apparent. A similar magnitude of changes in these markers was observed in the cells treated with
2r (1 μM) (
Figure 4E, lane 5 in
Figure 5 and
Table 6). It should be noted that the percentage of G2/M was the highest in the cells treated with
2e (1 μM) and
2r (1 μM) (50.2 and 57.9%, respectively) (
Table 6). When
2r concentration was increased up to 3 μM, more marked cell shrinkage (
Figure 4F), caspase-3 activation (cleavage of PARP and procaspase) (lane 6 in
Figure 5) and subG1 accumulation (24.5%), along with a decline in G2/M (29.1%) (
Table 6), were observed. These data suggest that
2e and
2r induced G2/M accumulation and then subG1 or G1 accumulation.
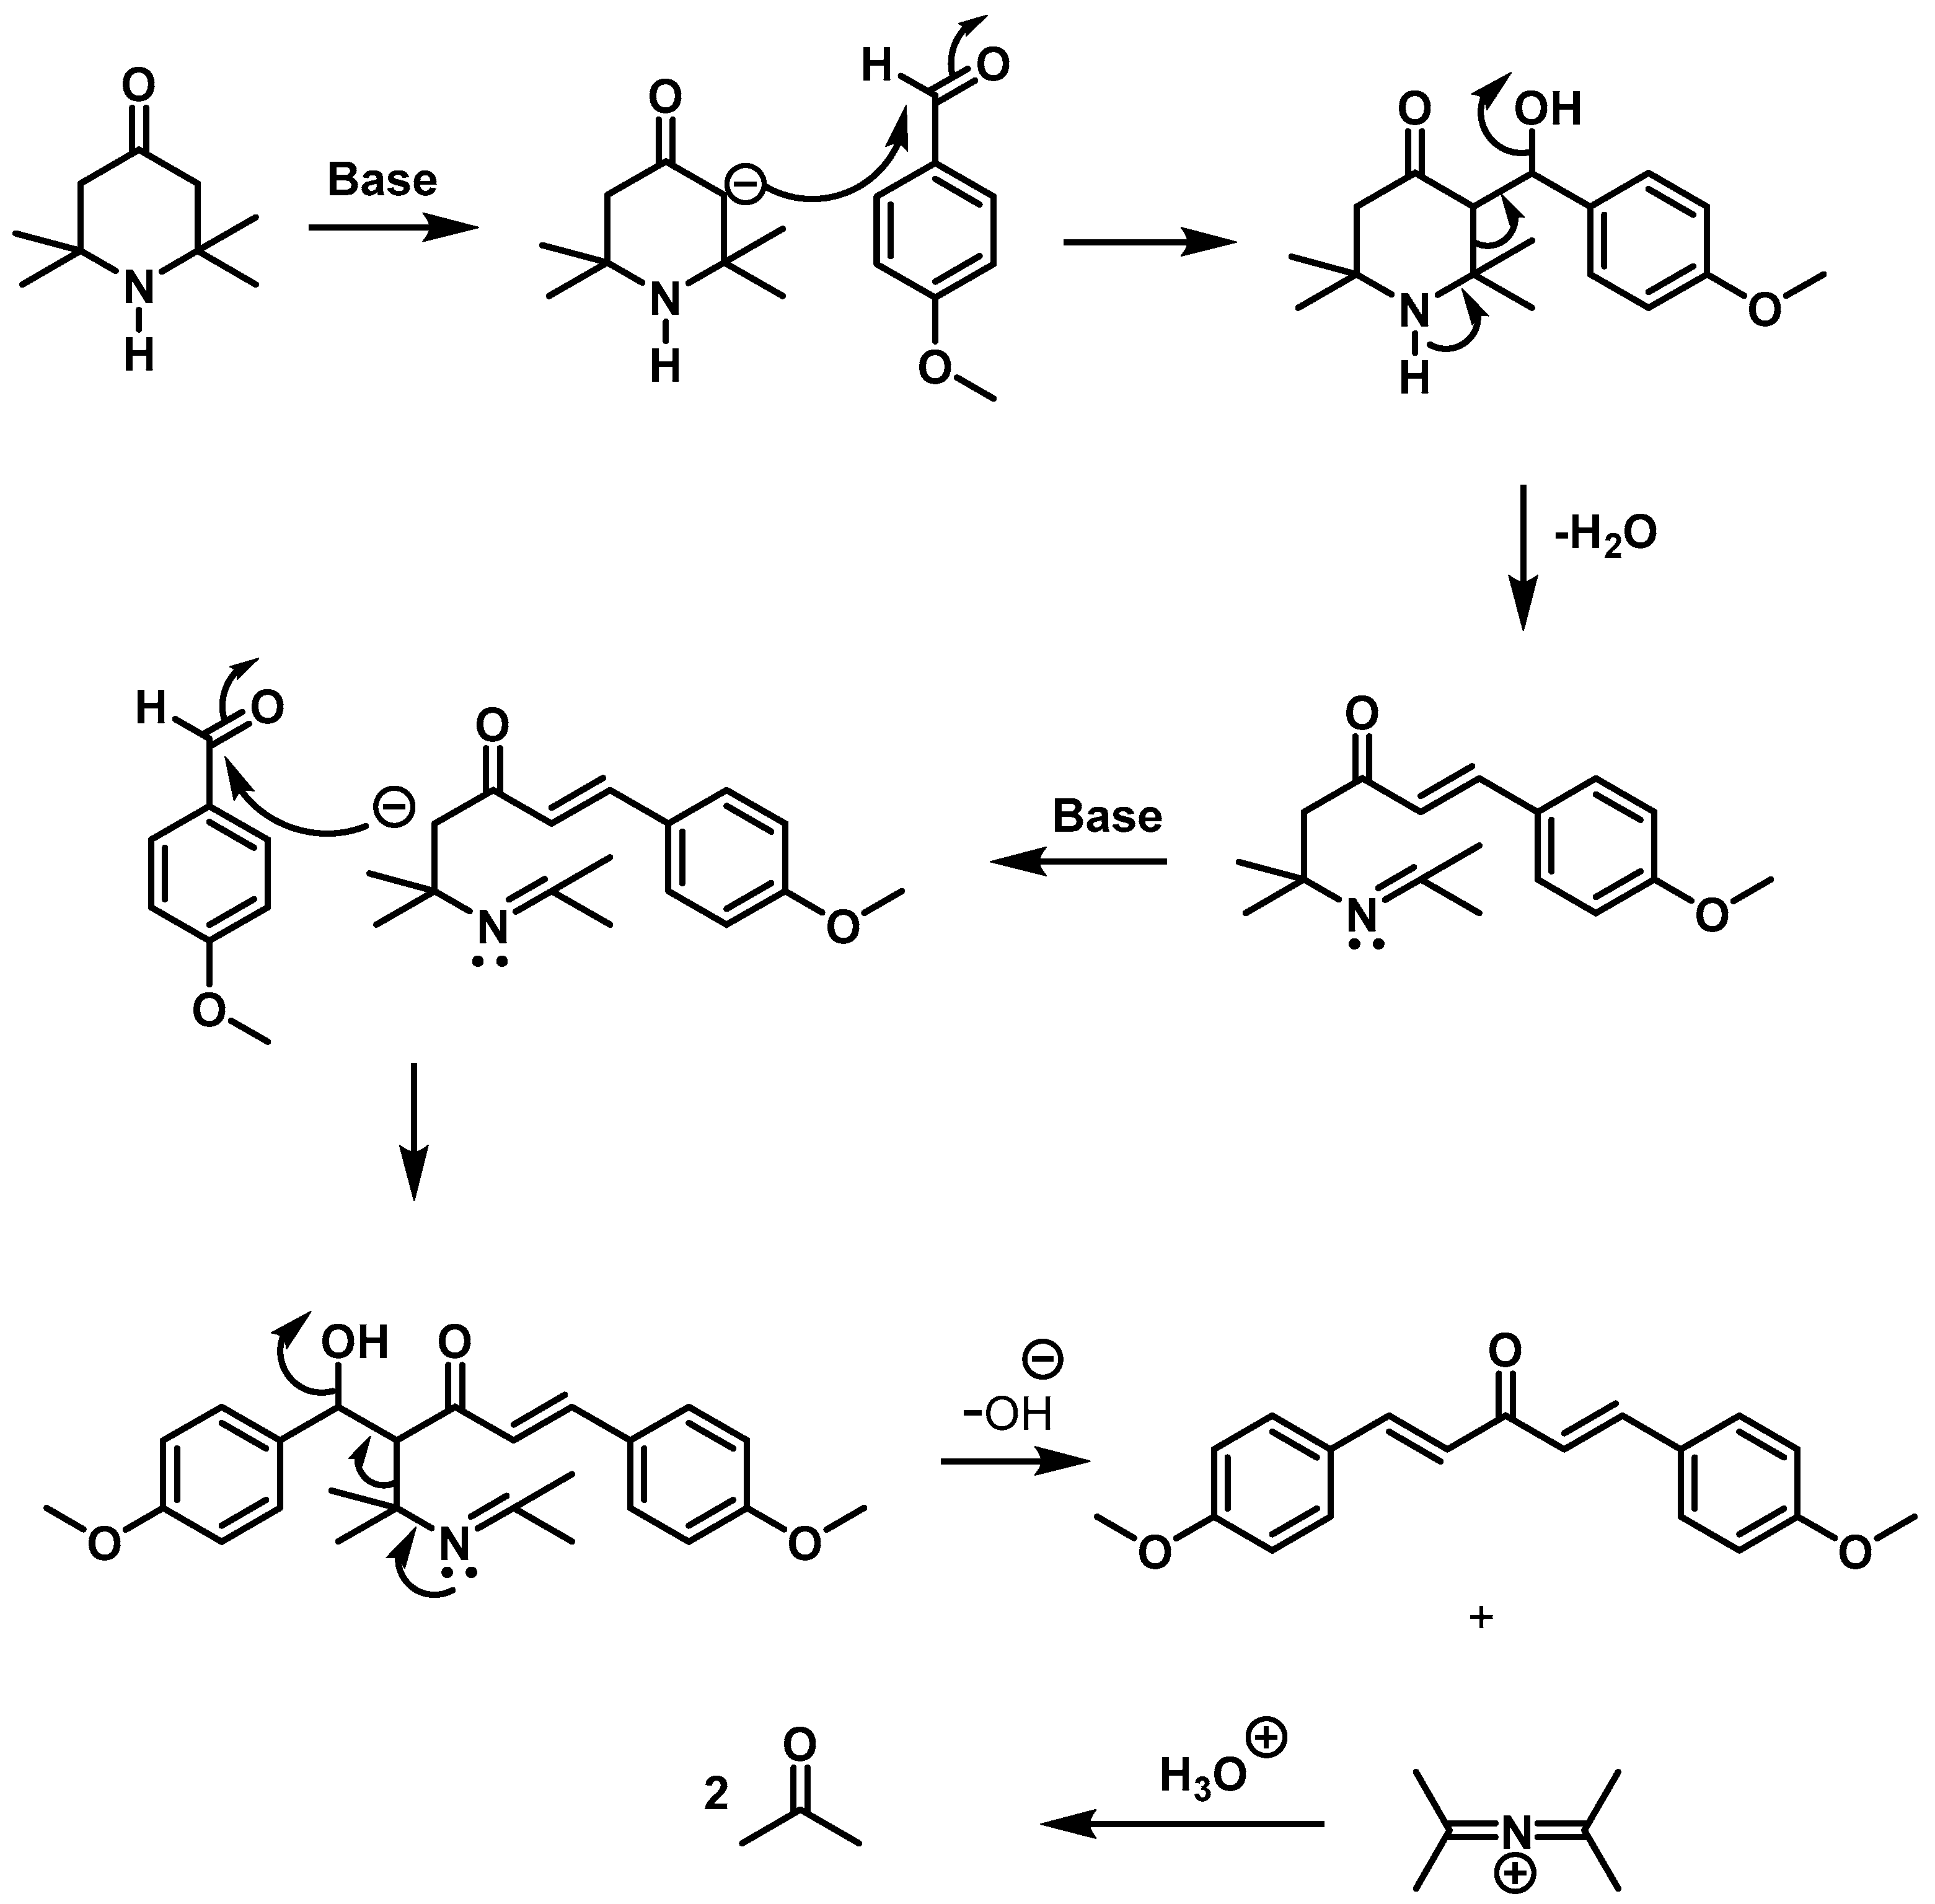
In an attempt to prepare 3,5-bis(4-methoxybenzylidene)-2,2,6,6-tetramethyl-4-piperidone, the product obtained was 1,5-bis(4-methoxyphenyl)-3-oxo-1,4-pentadiene. This reaction was shown to be a general method for preparing these acyclic derivatives, and a reaction mechanism for their formation was proposed.
4. Discussion
The compounds in series
2 were prepared by acidic catalysis of a number of aryl aldehydes with 4-piperidone using a literature procedure [
16]. The average yield is 72%. All of the compounds in series
2 were characterized by
1H and
13C NMR spectroscopy as well as mass spectrometry, and these details may be found in the
Supplemental Section of this article.
A number of different groups are present in the aryl rings of
2a–
u as indicated in
Table 1. In particular, methoxy and fluoro groups are present since they have been incorporated into a number of potent cytotoxins prepared in our laboratory [
10,
28,
29].
Table 1.
Evaluation of 2a–u against Ca9-22, HSC-2 and HSC-4 human oral squamous cell carcinoma cell lines.
Table 1.
Evaluation of 2a–u against Ca9-22, HSC-2 and HSC-4 human oral squamous cell carcinoma cell lines.
| Human Oral Squamous Cell Carcinoma Cell Lines |
|---|
| | | Ca9-22 | | HSC-2 | | HSC-4 | | Average | |
| Compound | R | CC50 (µM) a | SI b | CC50 (µM) a | SI b | CC50 (µM) a | SI b | CC50 (µM) a | SI b |
| 2a c | H | 0.27 ± 0.03 | 58.1 | 0.31 ± 0.05 | 50.6 | 0.41 ± 0.13 | 38.3 | 0.33 ± 0.07 | 49.0 |
| 2b | 2-OCH3 | 0.13 ± 0.02 | 40.3 | 0.33 ± 0.09 | 15.9 | 0.50 ± 0.04 | 10.5 | 0.32 ± 0.18 | 22.2 |
| 2c d | 3-OCH3 | 0.10 ± 0.03 | 18.2 | 0.02 ± 0.04 | 91.0 | 0.12 ± 0.02 | 15.2 | 0.08 ± 0.01 | 41.5 |
| 2d e | 4-OCH3 | 3.13 ± 0.40 | 17.8 | 7.97 ± 0.68 | 6.98 | 6.86 ± 0.77 | 8.10 | 5.99 ± 2.53 | 11.0 |
| 2e e | 3,4-(OCH3)2 | 0.02 ± 0.01 | 136 | 0.24 ± 0.04 | 11.3 | 0.07 ± 0.00 | 38.9 | 0.11 ± 0.11 | 62.1 |
| 2f d | 2,5-(OCH3)2 | 0.06 ± 0.01 | 23.3 | 0.17 ± 0.07 | 8.23 | 0.18 ± 0.08 | 7.78 | 0.14± 0.07 | 13.1 |
| 2g e | 2,4,6-(OCH3)3 | 6.90 ± 0.30 | 5.00 | 7.95 ± 0.70 | 4.34 | 8.93 ± 0.75 | 3.86 | 7.93 ± 1.08 | 4.40 |
| 2h e | 3,4,5-(OCH3)3 | 0.04 ± 0.01 | 24.3 | 0.08 ± 0.01 | 12.1 | 0.11 ± 0.03 | 8.82 | 0.08 ± 0.04 | 15.1 |
| 2i d | 3,4-OCH2O | 0.16 ± 0.07 | 102 | 0.53 ± 0.12 | 30.8 | 0.71 ± 0.22 | 23.0 | 0.47 ± 0.28 | 51.9 |
| 2j e | 2-F | 0.16 ± 0.04 | 21.4 | 0.33± 0.23 | 10.4 | 0.23 ± 0.01 | 14.9 | 0.24 ± 0.09 | 15.6 |
| 2k | 3-F | 0.07 ± 0.01 | 26.3 | 0.13 ± 0.03 | 14.2 | 0.12 ± 0.05 | 15.3 | 0.11 ± 0.03 | 18.6 |
| 2l c | 4-F | 0.14 ± 0.06 | 32.9 | 0.94 ± 1.28 | 4.90 | 0.16 ± 0.02 | 28.8 | 0.41± 0.45 | 22.2 |
| 2m | 3,4-F2 | 0.06 ± 0.03 | 41.2 | 0.14 ± 0.05 | 17.6 | 0.07 ± 0.01 | 35.3 | 0.09 ± 0.04 | 31.4 |
| 2n | 2,6-F2 | 0.17 ± 0.02 | 24.5 | 0.40 ± 0.10 | 10.4 | 0.31 ± 0.21 | 13.5 | 0.29 ± 0.11 | 16.1 |
| 2o | 2-CH3 | 0.45 ± 0.04 | 26.4 | 0.79 ± 0.19 | 15.1 | 1.05 ± 0.34 | 11.3 | 0.76 ± 0.30 | 17.6 |
| 2p | 2-NO2 | 0.13 ± 0.01 | 20.8 | 0.31 ± 0.06 | 8.71 | 0.30 ± 0.15 | 9.00 | 0.25 ± 0.10 | 12.8 |
| 2q | 3-OCH3, 4-OH | 0.61 ± 0.23 | 13.4 | 0.61± 0.08 | 13.4 | 0.63 ± 0.16 | 13.0 | 0.62 ± 0.01 | 13.3 |
| 2r | 3-OH, 4-OCH3 | 0.23 ± 0.01 | 214 | 0.29 ± 0.06 | 170 | 0.31 ± 0.12 | 159 | 0.28 ± 0.04 | 181 |
| 2s e | 4-OH | 1.67 ± 0.13 | 54.1 | 2.52 ± 0.19 | 35.9 | 3.20 ± 0.58 | 28.3 | 2.46 ± 0.77 | 39.4 |
| 2t d | 3-OH | 0.18 ± 0.01 | 28.2 | 0.21 ± 0.01 | 24.1 | 0.20 ± 0.04 | 25.4 | 0.20 ± 0.01 | 25.9 |
| 2u | 2-Cl | 0.10 ± 0.04 | 49.6 | 0.16 ± 0.02 | 31.0 | 0.25 ± 0.12 | 19.8 | 0.17 ± 0.08 | 33.5 |
| Doxorubicin | 0.24 ± 0.04 | 31.5 | 0.07 ± 0.00 | 108 | 0.08 ± 0.01 | 94.5 | 0.13 ± 0.10 | 78.0 |
| Melphalan | | 27.4 ± 6.40 | 6.30 | 13.9 ± 3.80 | 12.4 | 14.4 ± 1.70 | 12.0 | 18.6 ± 7.63 | 10.2 |
The cytotoxic properties of the compounds in series
2 were evaluated in two independent laboratories. In the first place,
2a–
u were screened against human Ca9-22, HSC-2 and HSC-4 squamous cell carcinomas, and the results are portrayed in
Table 1. No less than 86% of the CC
50 figures are submicromolar and 14% of the compounds have double-digit nanomolar CC
50 values. The dienones with average CC
50 values of less than 0.1 µM are as follows (with aryl substituents in parentheses):
2c [3-OCH
3],
2h [3,4,5-(OCH
3)
3] and
2m [3,4-F
2]. These three compounds are equipotent with doxorubicin and are much more toxic than melphalan.
There are significant differences between several pairs of structural isomers. Thus, the mean CC50 value of 2c is 75 times lower than the figure for 2d. A similar comparison between 2g and 2h indicates a 99-fold difference in potency, while the mean CC50 figure for 2t is 12 times lower than the value for 2s.
Table 2.
Evaluation of 2a–u against HGF, HPLF and HSC human normal oral cell lines.
Table 2.
Evaluation of 2a–u against HGF, HPLF and HSC human normal oral cell lines.
| Human Normal Oral Cell Lines |
|---|
| | | HGF | HPLF | HPC | Average | PSE b |
| Compound | R | CC50 (µM) a | CC50 (µM) a | CC50 (µM) a | CC50 (µM) a | |
| 2a c | H | 7.78 ± 0.85 | 17.0 ± 2.29 | 22.3 ± 2.61 | 15.7 ± 7.33 | 14,849 |
| 2b | 2-OCH3 | 2.11 ± 0.13 | 4.84 ± 3.52 | 8.77 ± 1.58 | 5.24 ± 3.35 | 6938 |
| 2c d | 3-OCH3 | 2.07 ± 0.11 | 2.47 ± 0.07 | 0.91 ± 0.08 | 1.82 ± 0.81 | 51,875 |
| 2d e | 4-OCH3 | 38.1 ± 12.4 | >100 | 28.8 ± 0.52 | >55.6 ± 38.7 | >184 |
| 2e e | 3,4-(OCH3)2 | 2.06 ± 0.16 | 2.48 ± 0.28 | 3.61 ± 2.50 | 2.72 ± 0.80 | 56,455 |
| 2f d | 2,5-(OCH3)2 | 1.29 ± 0.60 | 2.01 ± 0.27 | 0.91 ± 0.02 | 1.40 ± 0.56 | 9357 |
| 2g e | 2,4,6-(OCH3)3 | 33.9 ± 8.27 | 48.0 ± 10.4 | 21.7 ± 1.72 | 34.5 ± 13.2 | 56 |
| 2h e | 3,4,5-(OCH3)3 | 1.13 ± 0.79 | 1.28 ± 0.71 | 0.51 ± 0.20 | 0.97 ± 0.40 | 18,875 |
| 2i d | 3,4-OCH2O | 6.35 ± 0.12 | 7.91 ± 0.19 | 34.7 ± 12.2 | 16.3 ± 15.9 | 11,043 |
| 2j e | 2-F | 4.40 ± 1.32 | 3.63 ± 0.57 | 2.24 ± 1.17 | 3.42 ± 1.09 | 6500 |
| 2k | 3-F | 2.05 ± 0.16 | 2.70 ± 0.12 | 0.78 ± 0.16 | 1.84 ± 0.98 | 16,909 |
| 2l c | 4-F | 4.22 ± 1.31 | 7.07 ± 0.47 | 2.54 ± 0.14 | 4.61 ± 2.29 | 5415 |
| 2m | 3,4-F2 | 1.68 ± 0.44 | 3.69 ± 0.64 | 2.04 ± 0.97 | 2.47 ± 1.07 | 34,889 |
| 2n | 2,6-F2 | 2.07 ± 0.30 | 7.46 ± 0.38 | 2.97 ± 0.05 | 4.17 ± 2.89 | 5552 |
| 2o | 2-CH3 | 5.58 ± 0.18 | 7.27 ± 0.21 | 22.8 ± 1.85 | 11.9 ± 9.51 | 2316 |
| 2p | 2-NO2 | 1.71 ± 0.23 | 2.57 ± 0.07 | 3.82 ± 1.14 | 2.70 ± 1.06 | 5120 |
| 2q | 3-OCH3, 4-OH | 5.76 ± 1.20 | 10.8 ± 1.10 | 8.08 ± 8.51 | 8.21 ± 2.50 | 2145 |
| 2r | 3-OH, 4-OCH3 | 2.72 ± 0.18 | 54.6 ± 39.1 | 90.7 ± 16.2 | 49.3 ± 44.2 | 64,643 |
| 2s e | 4-OH | 74.0 ± 6.56 | >100 | 97.3 ± 4.62 | >90.4 ± 14.3 | >1602 |
| 2t d | 3-OH | 2.23 ± 0.06 | 3.45 ± 0.30 | 9.53 ± 5.17 | 5.07 ± 3.91 | 12,950 |
| 2u | 2-Cl | 2.25 ± 0.15 | 5.07 ± 1.99 | 7.55 ± 1.62 | 4.96 ± 2.65 | 19,706 |
| Doxorubicin | | 2.69 ± 0.35 | >10.0 | >10 ± 0.00 | >7.56 ± 4.22 | >60,000 |
| Melphalan | | 148.0 ± 0.68 | >200 | 169 ± 18.5 | >172 ± 25.8 | >55 |
An important issue to resolve when considering the development of these compounds is whether they demonstrate tumour-selective toxicity. Consequently, the dienones in series
2 were evaluated against human HGF, HPLF and HPC non-malignant cells, and these data are presented in
Table 2. Compounds causing the least toxicity, with average CC
50 values greater than 30 µM, are
2d [4-OCH
3],
2g [2,4,6-(OCH
3)
3],
2r [3-OH-4-OCH
3] and
2s [4-OH]. On the other hand, compounds causing the most toxicity with an average CC
50 value of less than 2 µM are
2c [3-OCH
3],
2f [2,5-(OCH
3)
2],
2h [3,4,5-(OCH
3)
3] and
2k [3-F].
The next phase of the investigation was to identify those compounds which demonstrate greater toxicity to neoplasms than towards non-malignant cell lines. Under clinical conditions, neoplasms are surrounded by a variety of normal cells. Hence in order to evaluate if these compounds demonstrate tumour-selective toxicity, selectivity index (SI) figures were generated which are the quotients of the average CC
50 values towards HGF, HPLF and HPC cells and the CC
50 value of the compound towards each neoplastic cell line. The data are presented in
Table 1. The results indicate that the compounds in series
2 have SI values greater than 1; hence, they demonstrate tumour-selective toxicity. The ketones with average SI figures greater than 50 are
2e [3,4-(OCH
3)
2],
2i [3,4-OCH
2O] and
2r [3-OH,4-OCH
3] and are clearly lead molecules. In particular,
2r has a greater SI figure than doxorubicin.
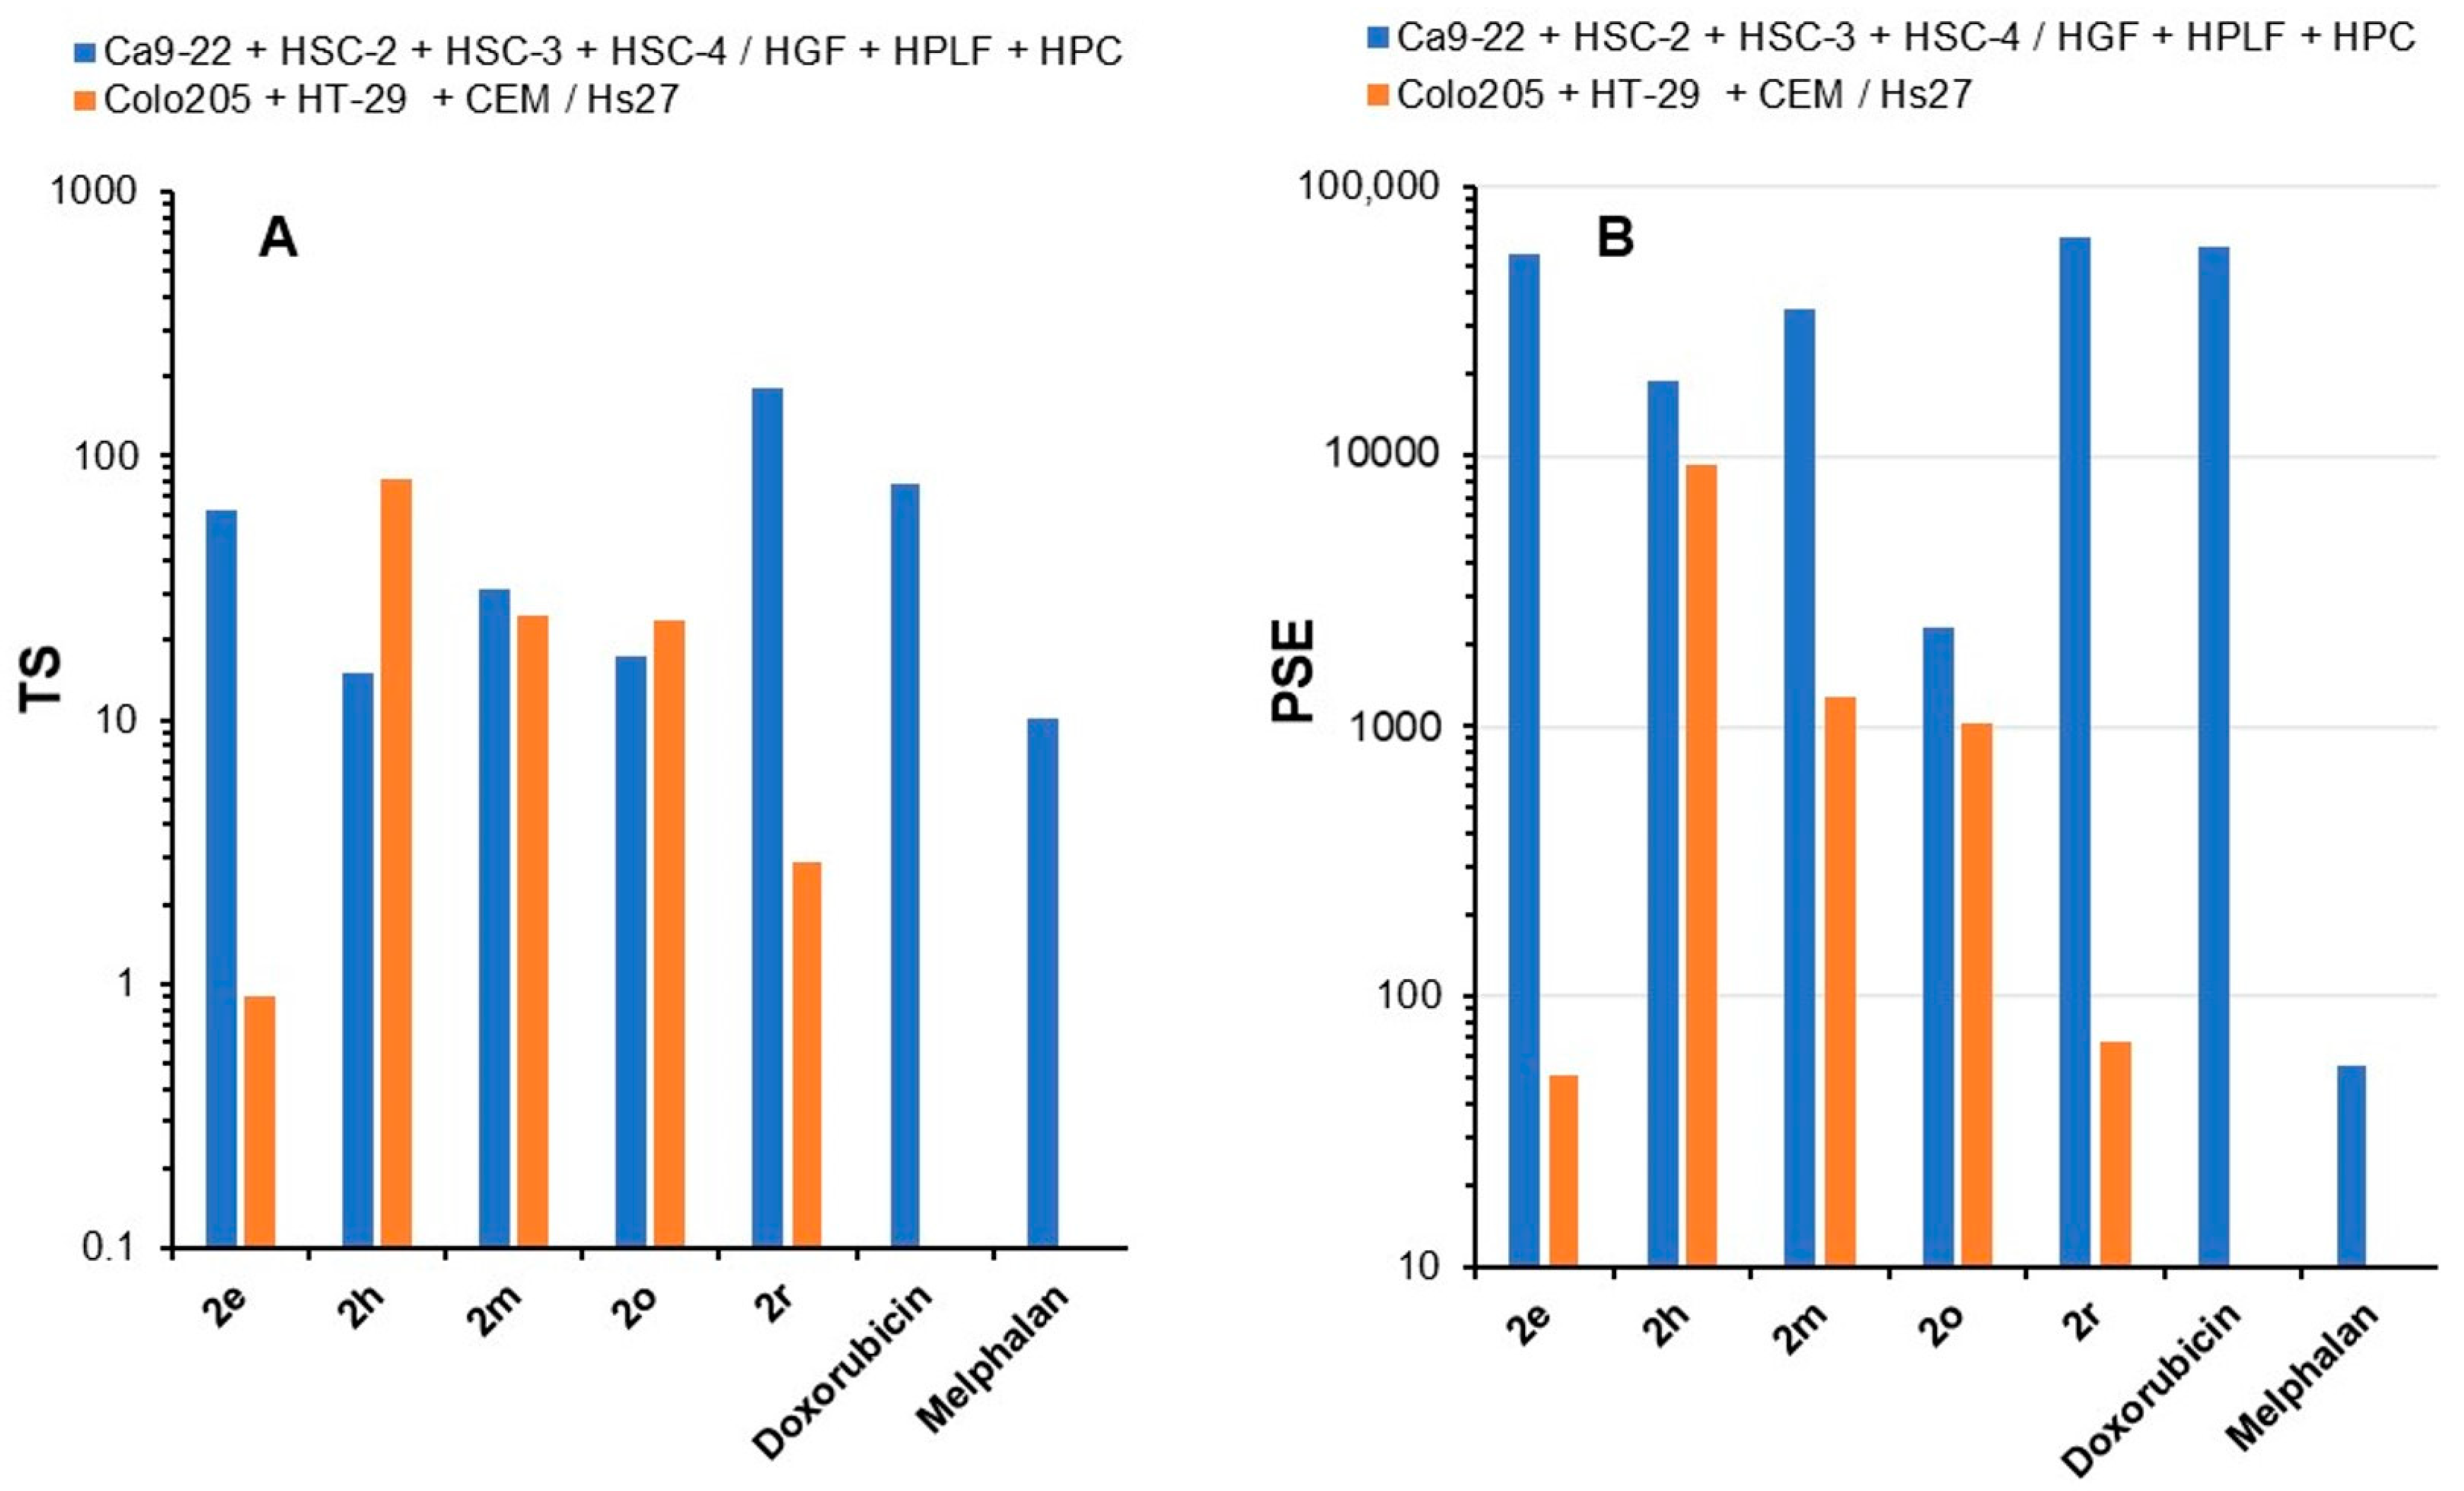
Two properties that are very important in evaluating candidate cytotoxins are their potencies and selective toxicities. In order to identify compounds with both of these desirable features, potency-selectivity expression (PSE) values were obtained. These figures are the products of the reciprocal of the average CC
50 value towards neoplastic cells multiplied by the average SI figure times 100. The PSE values of
2a–
u are presented in
Table 2. Compounds which have PSE values over 25,000 are
2c,
e,
m,
r. The dienone
2r has the highest PSE figure of 64,643, which is 30 times greater than the value of the structural isomer
2q.
A summary of the identification of lead molecules is presented in
Table 3. In particular, the 4-piperidone
2r is identified as a promising compound in three of the four bioevaluations.
Table 3.
Identification of lead molecules based on the data in
Table 1 and
Table 2.
Table 3.
Identification of lead molecules based on the data in
Table 1 and
Table 2.
| Table | Bioevaluations | Promising Compounds |
|---|
| 1 | Average CC50 values | 2c, h, m |
| 1 | Average SI figures | 2e, i, r |
| 2 | Low toxicity to normal cells | 2d, g, r, s |
| 2 | PSE | 2c, e, m, r |
The compounds in series
2 were also evaluated in a different laboratory. In this case, three human neoplastic cell lines were employed, namely, Colo205 and HT-29 colon cancers, as well as CEM leukemia cells. A non-malignant cell line, namely, human Hs27 fibroblasts, was also incorporated into the screens. The biodata generated are presented in
Table 4.
Table 4.
Evaluation of 2a–u towards Colo205, HT-29, CEM and Hs27 cells.
Table 4.
Evaluation of 2a–u towards Colo205, HT-29, CEM and Hs27 cells.
| | | Human Tumour Cell Lines | | | Normal Cell Line | |
|---|
| | | Colo205 | | HT-29 | | CEM | | Average | | Hs27 | |
| Compound | R | CC50 (µM) a | SI b | CC50 (µM) a | SI b | CC50 (µM) a | SI b | CC50 a | SI b | CC50 (µM) a | PSE c |
| 2a d | H | 10.7 ± 0.05 | 1.54 | 1.57 ± 0.21 | 10.5 | 9.29 ± 0.11 | 1.78 | 7.19 | 4.61 | 16.5 ± 0.35 | 64 |
| 2b | 2-OCH3 | 1.32 ± 0.01 | 3.10 | 3.58 ± 0.21 | 1.14 | 0.82 ± 0.09 | 4.99 | 1.91 | 3.08 | 4.09 ± 0.56 | 161 |
| 2c e | 3-OCH3 | 0.32 ± 0.11 | 13.0 | 5.58 ± 0.52 | 0.75 | 4.51 ± 0.11 | 0.92 | 3.47 | 4.89 | 4.16 ± 0.32 | 141 |
| 2d f | 4-OCH3 | 14.0 ± 0.56 | 6.84 | 12.6 ± 0.00 | 7.60 | 4.45 ± 0.03 | 21.5 | 10.4 | 12.0 | 95.7 ± 0.11 | 115 |
| 2e f | 3,4-(OCH3)2 | 1.36 ± 0.17 | 0.65 | 3.46 ± 0.46 | 0.25 | 0.49 ± 0.02 | 1.80 | 1.77 | 0.90 | 0.88 ± 0.05 | 51 |
| 2f e | 2,5-(OCH3)2 | 0.36 ± 0.01 | 1.81 | 0.84 ± 0.01 | 0.77 | 0.42 ± 0.02 | 1.55 | 0.54 | 1.37 | 0.65± 0.02 | 254 |
| 2g f | 2,4,6-(OCH3)3 | 16.9± 0.23 | 1.63 | 9.63 ± 0.32 | 2.87 | 11.0 ± 1.06 | 2.51 | 12.5 | 2.34 | 27.6 ± 0.79 | 19 |
| 2h f | 3,4,5-(OCH3)3 | 0.27 ± 0.03 | 121 | 2.03 ± 0.00 | 16.1 | 0.31 ± 0.09 | 106 | 0.87 | 81.0 | 32.7 ± 0.56 | 9310 |
| 2i e | 3,4-OCH2O | 8.84 ± 0.08 | 2.17 | 7.42± 1.33 | 2.59 | 1.88 ± 0.08 | 10.2 | 6.05 | 4.99 | 19.2 ± 2.38 | 83 |
| 2j f | 2-F | 2.94 ± 0.33 | 0.68 | 3.46 ± 0.33 | 0.58 | 0.78 ± 0.04 | 2.55 | 2.39 | 1.27 | 1.99 ± 0.17 | 53 |
| 2k | 3-F | 4.19 ± 0.15 | 0.44 | 1.73 ± 0.15 | 1.06 | 0.21 ± 0.01 | 8.76 | 2.04 | 3.42 | 1.84 ± 0.32 | 168 |
| 2l d | 4-F | 1.56 ± 0.28 | 1.21 | 5.51 ± 0.56 | 0.34 | 1.68 ± 0.25 | 1.13 | 2.92 | 0.89 | 1.89 ± 0.05 | 31 |
| 2m | 3,4-F2 | 1.81 ± 0.31 | 16.1 | 3.50 ± 0.19 | 8.34 | 0.58 ± 0.05 | 50.3 | 1.96 | 24.9 | 29.2 ± 0.08 | 1270 |
| 2n | 2,6-F2 | 2.22 ± 0.00 | 3.50 | 7.36 ± 0.88 | 1.06 | 7.88 ± 0.68 | 0.99 | 5.82 | 1.85 | 7.77 ± 0.89 | 32 |
| 2o | 2-CH3 | 1.62 ± 0.11 | 30.4 | 3.54 ± 0.42 | 13.9 | 1.82 ± 0.10 | 27.1 | 2.33 | 23.8 | 49.3 ± 0.23 | 1022 |
| 2p | 2-NO2 | 2.09 ± 0.33 | 11.6 | 2.76 ± 0.04 | 8.80 | 6.14 ± 0.56 | 3.96 | 3.66 | 8.12 | 24.3 ± 0.11 | 222 |
| 2q | 3-OCH3, 4-OH | 1.73 ± 0.15 | 1.20 | 17.8 ± 1.48 | 0.12 | 1.92 ± 0.53 | 1.08 | 7.15 | 0.80 | 2.07 ± 0.07 | 11 |
| 2r | 3-OH, 4-OCH3 | 4.58 ± 0.17 | 2.73 | 4.26 ± 0.01 | 2.93 | 4.04 ± 0.17 | 3.09 | 4.29 | 2.92 | 12.5 ± 1.61 | 68 |
| 2s f | 4-OH | 4.17 ± 0.32 | 2.08 | 19.3 ± 0.48 | 0.45 | 1.99 ± 0.10 | 4.36 | 8.49 | 2.30 | 8.68 ± 0.16 | 27 |
| 2t e | 3-OH | 2.12 ± 0.12 | 0.64 | 4.18 ± 0.36 | 0.32 | 0.43 ± 0.04 | 3.14 | 2.24 | 1.37 | 1.35 ± 0.08 | 61 |
| 2u | 2-Cl | 8.19 ± 0.17 | 0.08 | 0.89 ± 0.07 | 0.69 | 4.42 ± 0.35 | 0.14 | 4.50 | 0.30 | 0.61 ± 0.01 | 7 |
In regard to the sensitivity of the three neoplastic cell lines to the compounds in series
2, the data in
Table 4 revealed that 89% of the CC
50 values are below 10 µM, 73% are below 5 µM and 21% have submicromolar CC
50 values. The average CC
50 values were also examined. The two most potent compounds are
2f [2,5-(OCH
3)
2] and
2h [3,4,5-(OCH
3)
3]. The dienone
2f is 3 times more potent than the 3,4-dimethoxy analog
2e while
2h is 14 times more potent than
2g [2,4,6-(OCH
3)
3].
The compounds in series
2 were also screened against Hs27 fibroblasts. The compounds with the highest CC
50 values (>25 µM) are
2d,
g,
h,
m,
o. The data in
Table 4 reveal that the dimethoxy derivatives
2e and
2f are highly toxic to the fibroblasts (average CC
50 value of 0.77 µM), while the trimethoxy analogs
2g,
h are 39 times less potent (the average CC
50 value of 30.2 µM). Compounds with average SI values greater than 10 are
2d,
h,
m,
o. The large average SI value of 81.0 for
2h is noteworthy. The PSE values of series
2 were computed and are listed in
Table 4. Three compounds have PSE figures over 1000 namely
2h,
m,
o. Thus, a number of lead molecules are described in this study and are listed in
Table 5. Thus
2h is a lead molecule in all four of the bioevaluations, while
2m and
2o are promising compounds in three of the bioassays.
Table 5.
Identification of lead compounds based on the data in
Table 4.
Table 5.
Identification of lead compounds based on the data in
Table 4.
| Bioevaluations | Promising Compounds |
|---|
| Average CC50 values | 2f, h |
| Average SI values | 2d, h, m, o |
| Low toxicity to normal cells | 2d, g, h, m, o |
| PSE | 2h, m, o |
It is conceivable that the modes of action of
2a–
u towards the neoplasms are similar. In this case, the relative potencies of
2a–
u towards different neoplasms may be the same. In order to examine this possibility, use was made of Kendall’s coefficient of concordance [
31], which is a statistical method for evaluating the similarity in rank between a collection of numbers. This methodology was applied to the CC
50 values of
2a–
u against Ca9-22, HSC-2 and HSC-4 malignant cells. In this case, Kendall’s coefficient of concordance (W) is 0.7977, and a
p-value of 0.0004 indicates the order of potency towards the neoplasms is the same. Since
2g,
d,
s are outliers, plots were made omitting
2g (W = 0.7668,
p = 0.0010),
2g,
d (W = 0.7400,
p = 0.0021) and
2g,
d,
s (W = 0.7074,
p = 0.0045). The analysis was repeated with the CC
50 values of
2a–
u towards Colo205, HT-29 and CEM cells, which yielded a W value of 0.5834,
p = 0.0200. The data generated when the outliers were removed are as follows:
2g (W = 0.5324,
p = 0.0475),
2g,
d (W = 0.4942,
p = 0.0850) and
2g,
d,
s (W = 0.4788,
p = 0.1084). The effect of removing the outliers on the statistical results may be explained in the following ways. First, when one or more results are removed, statistical power is diminished. Second, Kendall’s coefficient of concordance deals with rank and is not concerned with potency differences. For example,
2g is consistently weaker in potency compared to analogs.
In view of the relative potencies found using the Ca9-22, HSC-2 and HSC-4 assays and also using Colo205, HT29 and CEM screens, Kendall’s coefficient of concordance was applied using the CC50 values of the six neoplastic cell lines. The W value is 0.6086 and the p figure is 0.0000. The W and p values when outliers are systematically removed from consideration are as follows: 0.5533, 0.0000 (excluding 2g), 0.5083, 0.0000 (excluding 2g, d) and 0.4813, 0.0001(excluding 2g, d, s). This observation has two utilities. First, it provides strong evidence that the modes of action of 2a–u are similar. Second, one is justified in taking the average CC50 values of each compound in the pursuit of finding correlations between cytotoxic potencies and the physicochemical properties of the aryl substituents.
An attempt was made to find one or more physicochemical parameters that influence cytotoxic properties. Hence, linear and semilogarithmic plots were made between the average CC
50 values of
2a–
u and the sigma/sigma star (σ/σ*), pi (π) and molecular refractivity (MR) values of the aryl substituents. These constants reflect the electronic, hydrophobic and steric properties, respectively, of the aryl groups. A summary of these results and the figures for the data generated are presented in the
Supplemental Section. In a linear plot, a negative correlation was noted between the σ/σ* values and cytotoxic potencies (
p = 0.02). No other correlations (
p < 0.05) nor trends toward correlation (
p < 0.10) were observed. Thus, potency increases as the magnitude of the electron-withdrawing properties of the aryl substituents rose. This observation may be due to the electron densities on the olefinic carbon atoms falling as the σ/σ* values rise, which increases the reactivity of the compounds towards cellular thiols, hence the extent of the cell death. Therefore, in the future, strongly electron-attracting groups should be placed in the aryl rings.
Attempts were made to find some of the ways that lead molecules exerted their cytotoxic properties. The average CC50 values of 2a–u against Ca9-22, HSC-2 and HSC-4 cells are 0.70, 1.16 and 1.18 µM, respectively, indicating that Ca9-22 cells are more sensitive to the compounds in series 2 than are HSC-2 and HSC-4 cells. Hence the mode of action studies used Ca9-22 cells. Two lead compounds 2e and 2r were chosen for bio evaluation, as these molecules display excellent cytotoxic potencies and have the best average SI and PSE figures in series 2.
Both
2e and
2r caused the mitotic arrest; i.e., the compounds inhibited various stages of mitosis and cell division. In contrast, a reference drug actinomycin D (AD) induced apoptotic bodies. These results are indicated in
Figure 4.
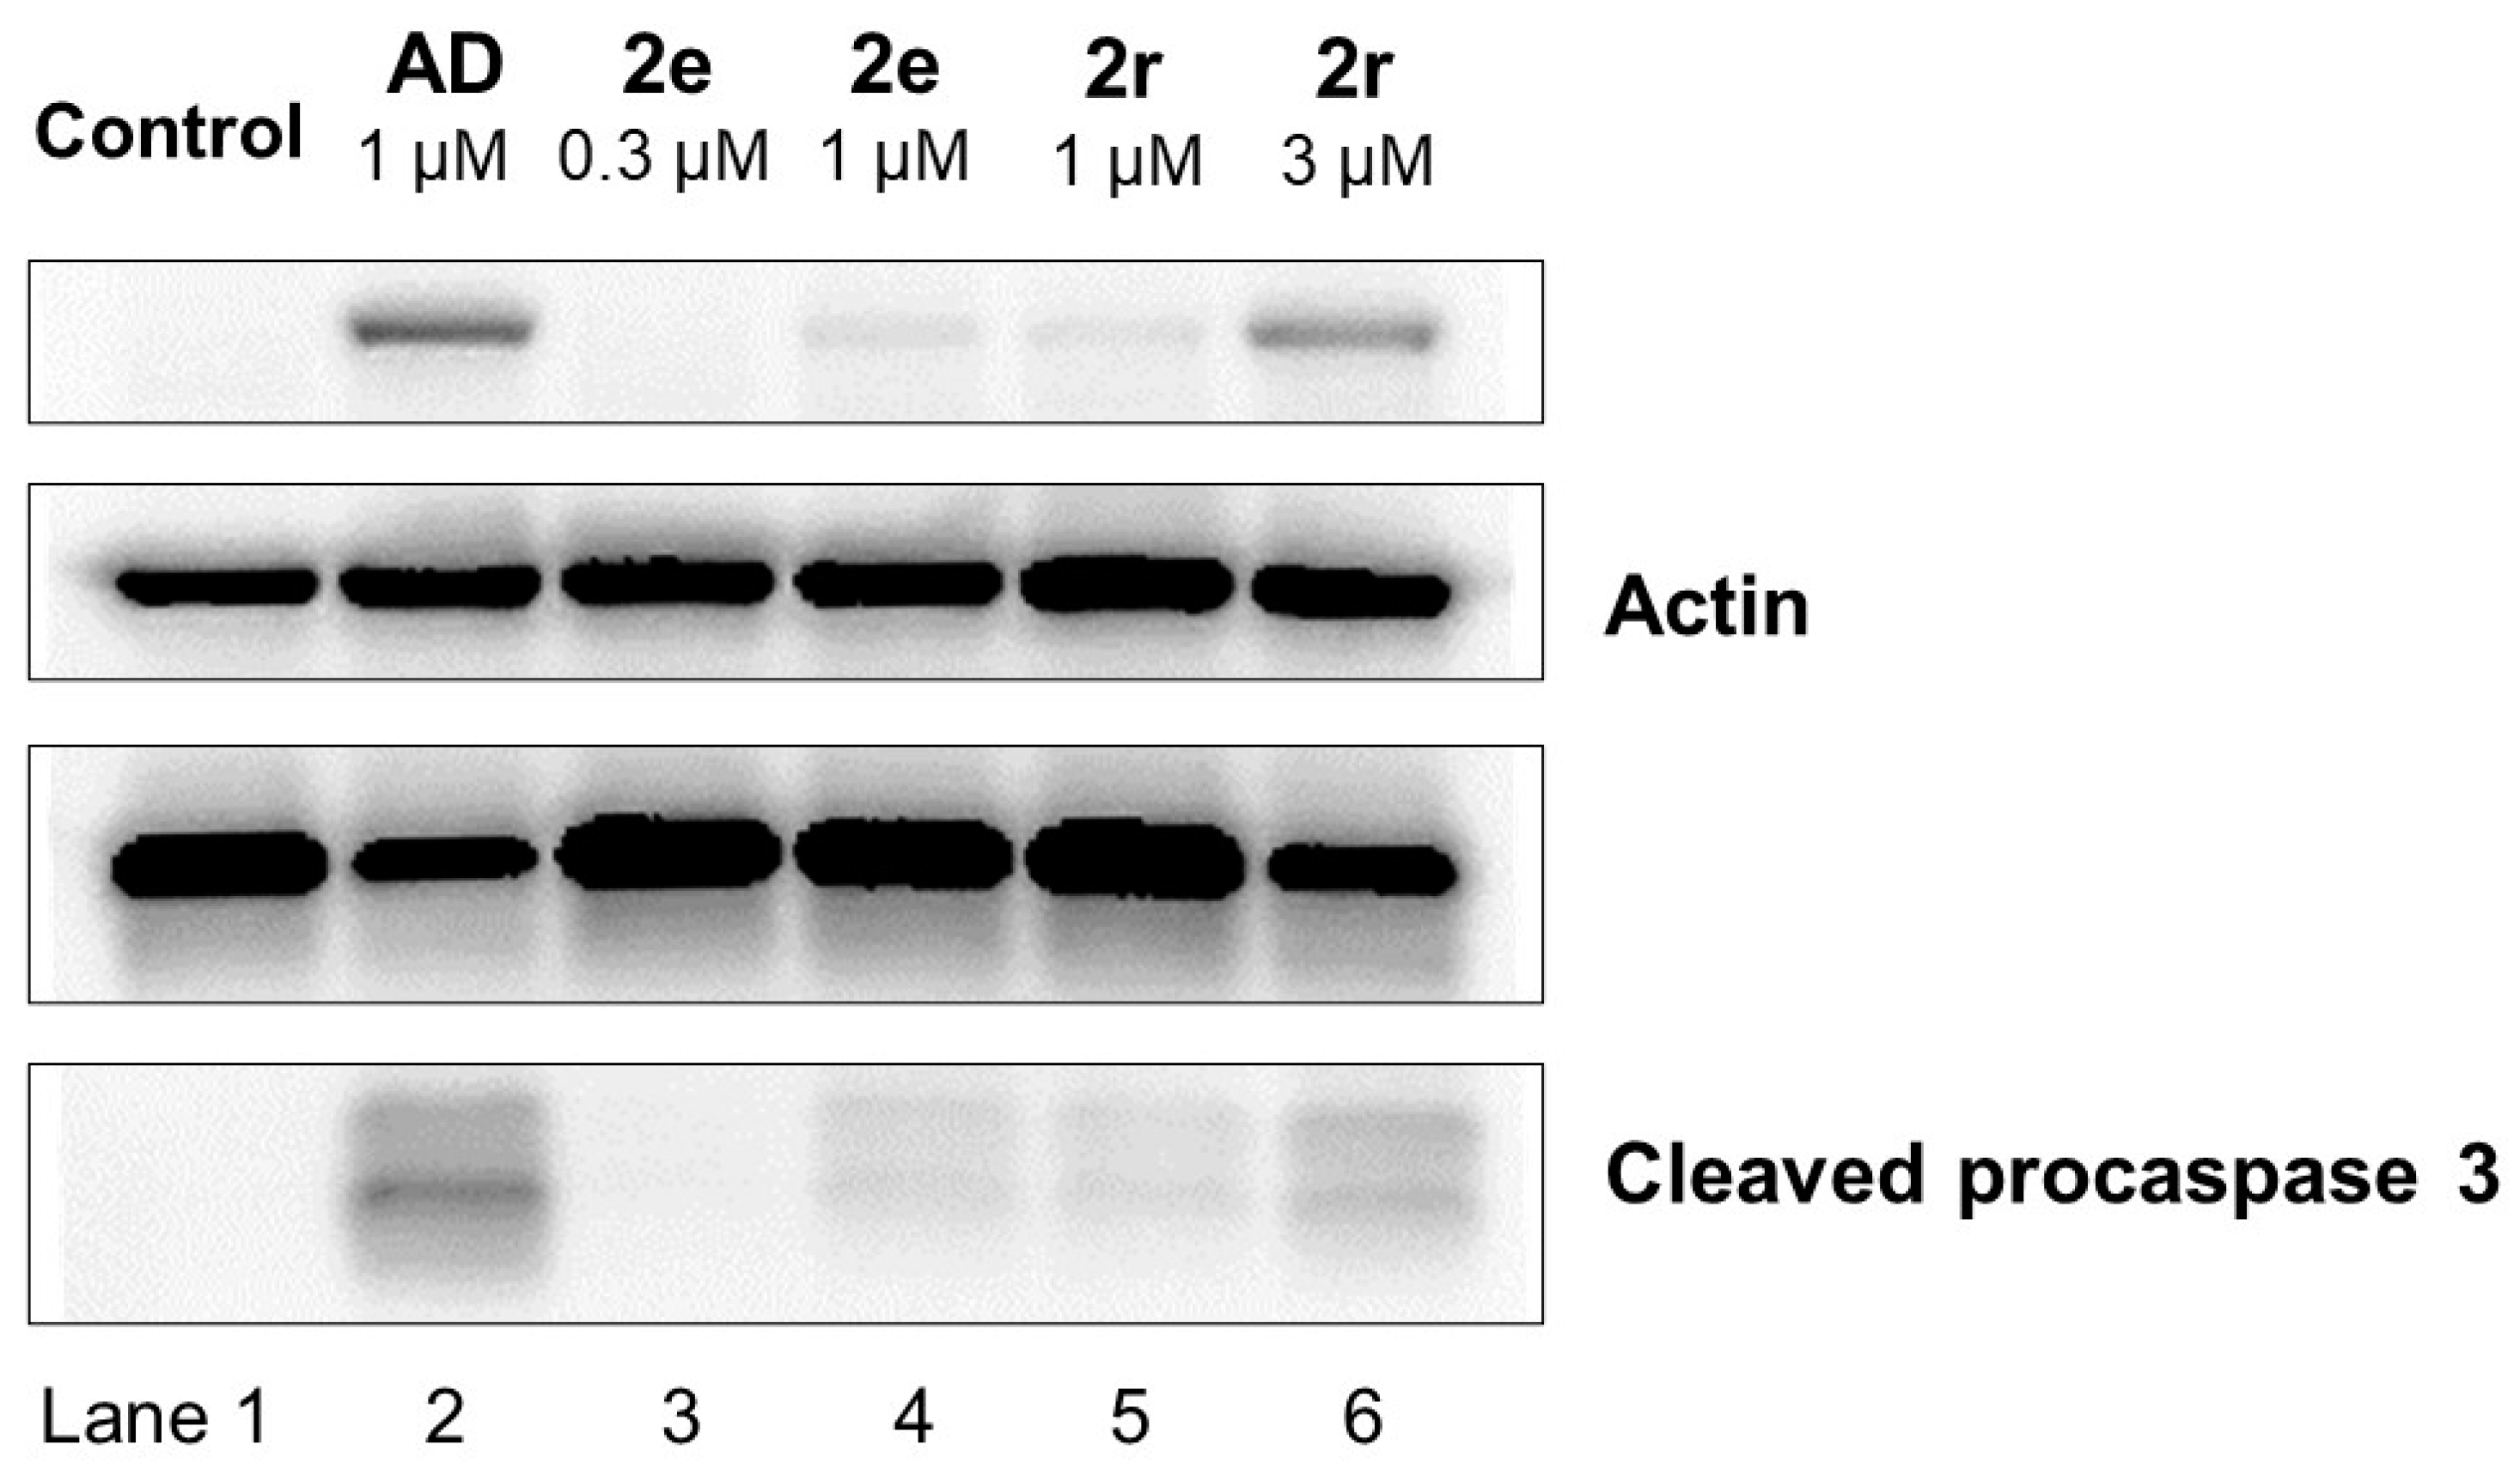
A Western blot analysis was undertaken, and the results are presented in
Figure 5. The enzyme poly(ADP-ribose)polymerase 1 (PARP 1) assists with the repair of damaged DNA. Thus, compounds which cleave PARP1 may be useful in cancer chemotherapy. As indicated in
Figure 5, at a concentration of 3 µM,
2r causes cleavage of PARP. Procaspase 3 is a precursor of caspase 3, and both of these enzymes are overexpressed in some tumours [
32]. Hence reduction in the concentration of procaspase 3 and a rise in cleaved caspase 3 are useful properties for a candidate anticancer agent to demonstrate. At a concentration of 3 µM,
2r causes a reduction in the concentration of procaspase 3 and, along with a concentration of 1 µM of
2e and
2r, shows procaspase 3 has been cleaved.
Another possible mode of action of the compounds in series
2 is their interfering with the cell cycle. The distribution of the Ca9-22 cells after treatment with
2e and
2r are given in
Table 6. The data indicated
2e and
2r increase the percentage of cells in the subG1 phase, which contributes to the toxic effects of these compounds.
Table 6.
Cell cycle distribution of Ca9-22 cells after treatment with 2e, r.
Table 6.
Cell cycle distribution of Ca9-22 cells after treatment with 2e, r.
| Compound | Distribution (%) a |
|---|
| | SubG1 | G1 | S | G2/M |
| 2e (0.3 µM) | 2.2 | 33.1 | 20.5 | 43.7 |
| 2e (1 µM) | 9.3 * | 26.1 | 14.3 | 50.2 |
| 2r (1 µM) | 11.5 * | 18.5 | 12.0 | 57.9 |
| 2r (3 µM) | 24.5 * | 35.0 | 11.4 | 29.1 |
| AD (1µM) | 15.6 * | 50.9 | 11.5 | 22.1 |
| Control | 1.7 | 33.3 | 17.0 | 47.7 |
There is a lack of coplanarity between the aryl rings and the adjacent olefinic groups. These interplanar angles θ are created between two carbon atoms of the aryl rings and the olefinic groups. These θ values are caused by non-bonded interactions between the ortho protons of the aryl ring and the equatorial hydrogen atom at locations 2 and 6 of the piperidine ring [
33]. Hence, by replacing the protons at positions 2 and 6 of the piperidine ring with methyl groups, substantial increases in the sizes of the theta values may occur. The cytotoxic potencies of such compounds could be compared with the analogs in series
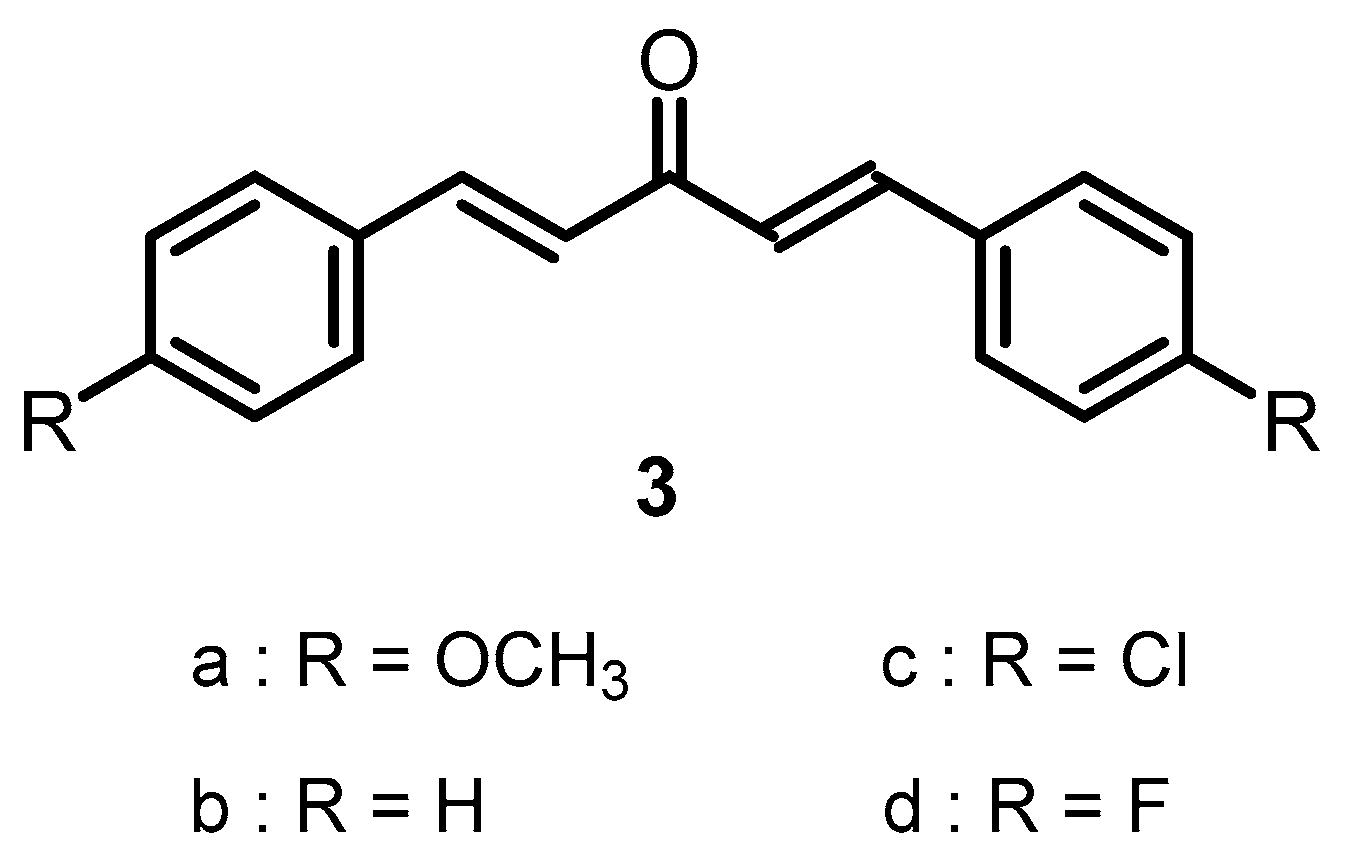
2, which have the same aryl substituents. However, there was no reaction between 4-methoxybenzaldehyde and 2,2,6,6-tetramethyl-4-piperidone when the acid catalyzation method employed in preparing series
2 was used. Under basic conditions using sodium ethoxide or sodium methoxide, a product was isolated, which was identified as 1,5-bis(4-methoxyphenyl)-1,4-pentadien-3-one
3a. A possible way in which this reaction takes place is presented in
Scheme 1. In order to explore the generality of this reaction, the unsubstituted, 4-chloro and 4-fluoro analogs of
3a (
Figure 3)were prepared in yields of 22% to 41%. In the future, acylation of the piperidyl nitrogen atom of 2,2,6,6-tetramethyl-4-piperidone prior to attempted reactions with aryl aldehydes may lead to the formation of the desired products, since this molecular modification may prevent the opening of the piperidine ring.


 ,
, 

