Article

Effect of the Chemical Composition of Mesoporous Cerium-Zirconium Oxides on the Modification with Sulfur and Gold Species and Their Application in Glycerol Oxidation

1
Faculty of Chemistry, Adam Mickiewicz University in Poznań, ul. Umultowska 89b, 61-614 Poznan, Poland
2
Wrocław Research Centre EIT+, the Polymer Materials Laboratory, ul. Stabłowicka 147, 54-066 Wroclaw, Poland
ChemEngineering 2017, 1(2), 18; https://doi.org/10.3390/chemengineering1020018
Submission received: 15 November 2017 / Revised: 8 December 2017 / Accepted: 13 December 2017 / Published: 18 December 2017

Abstract

:
Ceria, zirconia, and mixed cerium-zirconium mesoporous oxides were synthesized and used as supports for sulfur and gold species. The materials were characterised using selected advanced techniques (Inductively Coupled Plasma Optical Emission Spectrometry (ICP-OES), elemental analysis, X-ray Photoelectron Spectroscopy (XPS), X-ray Diffraction (XRD), N2 adsorption, and desorption isotherms, Ultraviolet-Visible Spectroscopy (UV-vis), Attenuated Total Reflectance-Fourier Transform Infrared (ATR-FTIR), Temperature Programmed Reduction (TPR-H2), Thermogravimetric and Differential Thermal Analysis (TG-DTA)), which allowed for monitoring of the oxidation state of metals (cerium and gold) and the surface properties of the catalysts, in particular the concentration of the components on the surface and in the bulk of materials. The interactions between gold, sulfur, and metals from oxides were considered. The goal of this work was studied the changes in the chemical composition of materials and the oxidation states of cerium species after the modification of oxides with sulfur and gold species and the estimation of the influence of these changes on the surface properties. The chemical composition of surface affects the mobility of surface oxygen and the oxidation state of cerium, which can play the role of redox sites (e.g., Ce3+/Ce4+ species), and therefore it strongly influences the adsorption of hydrogen sulfide and then gold loading. Additionally, gold catalysts modified with sulfur species were tested in the reaction of glycerol oxidation in the liquid phase at basic conditions as the test reaction of the catalytic oxidation of organic pollutants from water.

Graphical Abstract

1. Introduction

Ceria is an oxide characterised of high oxygen storage/transport capacity. This oxide is able to release oxygen under oxygen deficient environment and quickly reoxidize under oxygen rich environment, but these processes have low effectiveness under high temperatures and reductive conditions. Exhibiting a unique redox property of ceria is based on the shift from its reduced state (Ce3+) to oxidized state (Ce4+) [1]. In the oxidation processes, in the gas phase, when cerium oxide is reduced, the oxygen vacancies are refilled with air atmosphere, and then a cyclic redox process can run [2], for example, in CO hydrogenation, a certain amount of ceria can remarkably enhance the reducibility of the catalyst due to the defect sites of Ce4+-O-Ce3+ in the crystal structure. This can explain why ceria that is modified with gold, palladium, and/or copper is applied as a catalyst or a promoter in selected oxidation processes, e.g., Water Gas Shift (WGS) [3,4], methanol oxidation [5], Volatile Organic Compounds (VOCs) oxidation [6], and soot combustion [7].
The addition of zirconia stabilizes ceria and these oxides can create a ceria-zirconia solid solution in broad composition range, and ceria modification with zirconia can improve textural parameters, catalytic activity at lower temperatures, and oxygen storage/transport properties [8,9,10,11,12].
According to the literature data [13,14], the differences in the preparation process and oxygen arrangement of cerium-zirconium oxides can be responsible for the unusual promotion of the reduction in the bulk of mixed cerium-zirconium oxides. Additionally, the structural modification of oxygen anions in cerium-zirconium oxides increases the oxygen mobility in the lattice, which in turn enhances the redox properties of this catalytically interesting material in low temperature oxidation processes. It was evidenced that the separation phases between ceria in zirconia in ceria-zirconia solid solutions is at high temperatures and in the presence of high distribution of cerium or zirconium species in cerium-zirconium oxides. The incorporation of zirconium in the ceria component can lead to the forming of solid solution Ce1−xZrxO2, which can improve the catalytic properties in the oxidation processes and the forming of solid solution increases the reducibility of the oxide, leading to the increase of oxygen vacancies content and it can guarantee high activity of the catalyst and the creation of the places, in which can be adsorbed the molecules from the reaction mixture [15]. These properties were also observed after modification of oxides with other metals, e.g., gold and/or copper [16]. The improving of redox properties after the addition of zirconium to the crystal lattice of ceria was evidenced by oxygen isotopic exchange studies, and these studies confirmed that mixed cerium-zirconium oxides can react more quickly and on a larger scale than pure oxides [17].
These properties of cerium-zirconium oxides were applied in selected oxidation processes, e.g., low temperature water-gas shift [18] or steam reforming of methanol [19,20].
The theoretical and experimental studies confirmed that the addition of zirconium to the lattice of ceria induces the severe distortion of the atomic structures on the reduced and unreduced surface. It has been explained by the formation of oxygen vacancy around zirconium species and the reduction of two neighboring cerium cations by the electrons left and it leads to the removing of oxygen atom [21]. This way, the presence of zirconium atoms improves the mobility of oxygen and oxygen storage/transport properties in ceria-zirconia solid solutions. Additionally, the interaction of zirconia with other oxides can increase of Lewis acid sites (LAS) concertation on the surface of catalysts and these acid sites can play crucial role in redox reactions, e.g., hydrodeoxygenation (HDO) reaction [22,23,24,25]. The occurrence of oxygen mobility on the surface of cerium-zirconium oxides was applied in catalytic processes, e.g., CO oxidation [21], preferential oxidation (PrOx) of CO [26], the catalytic reduction of NO by CO [27], hydrogen production by methanol steam reforming [28], or methanol oxidation [29]. It has been reported in previous papers [30,31,32] that the catalysts that contain gold species supported on pure ceria or SBA-15 with ceria and loaded with additives, such as copper and zirconium species, are characterised by the strong interactions between each metals, which were based on the electron transfer between two metals and this process enhanced on the redox properties of catalysts. Moreover, the introduction of sulfur to the lattice of support and exchanging between sulfur and oxygen atoms can lead to the growth of redox properties in the catalytic system [33]. It has been reported [34,35] that gold nanoparticles can be effectively produced and stable thanks the neighborhood of sulfur species on the surface of solid materials, because gold particles were not aggregate in the presence sulfanilic acid [35]. It was reported [34] that the phenomena of electron interaction between gold and sulfur species could be investigated and applied to design the attractive materials for chemical industry, e.g., electroactive polymer monolayers.
The application of the different compositions of materials that are described in this paper, it was possible to obtain the catalysts characterised of the different surface and texture properties. For a better insight into the observed behavior, mesoporous cerium and zirconium oxides were applied in this study, as supports for gold and sulfur species.
Gold loading on mesoporous materials were applied as catalysts in the catalytic oxidation of many organic compounds [36,37,38]. The elimination of organic compounds from water, which are generally created during the variety of industrial processes, is a challenge for a chemical industry, because these compounds can be the source of environmental pollutants. This is often complicated by the fact that the real composition of wastewater is often the mixture of different toxic compounds, such as alcohols, aldehydes, hydrocarbons, etc. The development of highly effective catalysts for stationary and mobile wastewater installations is still the matter of intensive research [36,37,38,39]. Gold supported on different materials, such as activated carbons or mesopores oxides (e.g., TiO2 Al2O3, CeO2) has shown high activities in the catalytic oxidation of pollutants in the liquid and/or gas phase [37,39,40,41,42,43,44,45]. The electronic state of gold species and the size of gold particles determine the activity toward catalytic oxidation of organic compounds in such systems. Moreover, gold nanoparticles that are supported on reducible oxides can increase the mobility of lattice oxygen atoms that are involved in the reaction process.
The main aim of this work was the preparation and deep characterisation of ceria, zirconia, and mixed cerium-zirconium oxides, their modification with the chemical adsorption of hydrogen sulfide and with gold species. The materials were characterised using selected advanced techniques to know their physicochemical properties, and were tested as the catalysts in the reaction of glycerol oxidation in the liquid phase. This reaction was applied as the test reaction of the catalytic oxidation of organic pollutants from water at basic conditions.

2. Materials and Methods

2.1. Preparation of Materials

The synthesis of all mesoporous oxides were carried out using the solution of organic copolymer—Pluronic® P-123 (poly(ethylene glycol)-block-poly(propylene glycol)-block- poly(ethylene glycol), average Mn ~5800, Sigma-Aldrich (St. Louis, MO, USA)) in dried methanol (POCh (Gliwice, Poland), >99.8%).

2.1.1. Preparation of Ceria

A portion of 0.9308 g (1.60 × 10⁻⁴ mol) of Pluronic P-123 (surfactant) was dissolved in 18.4950 g (0.5759 mol) of methanol. P123 was mixed with methanol at room temperature for 1 h. Then, a powder of metal source (precursor)—40.3684 g (0.0930 mol) of cerium (III) nitrate (Ce(NO3)3⋅6H2O, ≥99.99%, Sigma-Aldrich) was added to this mixture and stirred for 4 h at room temperature. The surfactant/precursor molar ratio was 0.0017. After mixing, a clear colorless solution was obtained. The solution was transferred to three Petri dishes (Ø = 19 cm), and it was dried at 303 K for 14 days, then step by step at 313 K for 24 h, 323 K for 24 h, 333 K for 24 h, and 373 K for 24 h (a heating rate for each step was 1 K min−1). This procedure of very long drying was applied in the order to remove methanol from the mixture of metal salts and Pluronic P-123, and it was assumed that it has to guarantee that the specific surface area will be larger than 100 m2 g−1. The procedure of drying was based on laboratory tests. The final material was obtained by heating the sample at 673 K for 4 h (a heating rate of 3 K min−1). The catalyst was in the form of yellow powder.

2.1.2. Synthesis of Cerium-Zirconium Oxides

For the synthesis of mesoporous mixed cerium-zirconium oxides was assumed that 1.0000 g (1.72 × 10⁻⁴ mol) of organic template (Pluronic P-123) will be dissolved in 20.0000 g of methanol (0.624 mol, POCh, >99.8%) and the mass of each oxide after its calcination will be 16.0000 g and 100% of cerium in the oxide will be in the form of CeO2 and the molar nominal ratio of CeO2:ZrO2 will be: 4:1, 2:1, 1:1, 1:2, and 1:4. At the beginning, Pluronic P-123 was mixed with methanol at room temperature for 1 h. Then, a mixture of metal sources in the form of powder—cerium nitrate (Ce(NO3)3⋅6H2O, ≥99.99%, Sigma-Aldrich) and zirconium oxonitrate (ZrO(NO3)2xH2O, ≥99.99%, Sigma-Aldrich) were added to this mixture and the mixture was stirred for 4 h at room temperature. After mixing, a white colorless solution was obtained. The solution was transferred to three Petri dishes (Ø = ~19 cm), and the procedures of drying and calcination were the same as for pure ceria (the procedures were described in the Section 2.1.1 of this paper). The catalysts were in the form of yellow powders. At the final, five catalysts were prepared: CexZryOz(4:1), CexZryOz(2:1), CexZryOz(1:1), CexZryOz(1:2), and CexZryOz(1:4), in which the nominal values of x and y are between 0 and 1 (the total sum of x and y coefficient is 1), z is 0 ≤ z ≤ 2 and the ratio in brackets means the nominal molar ratio between ceria and zirconia in the catalysts.

2.1.3. Synthesis of Zirconia

A portion of 1.2987 g (2.24 × 10⁻⁴ mol) of Pluronic P-123 was dissolved in 25.9910 g (0.8093 mol) of methanol. P123 was mixed with methanol at room temperature for 1 h. Then, a powder of metal source—30.3304 g (0.1312 mol) zirconium oxonitrate (ZrO(NO3)2xH2O, ≥99.99%, Sigma-Aldrich) was added to this mixture and was stirred for 4 h at room temperature. After mixing, a white solution was obtained. The solution was transferred to four Petri dishes (Ø = ~19 cm), and the procedures of drying and calcination were the same as for pure ceria (the procedures were described in the Section 2.1.1 of this paper). The catalyst was in the form of white powder.
The preparation procedures of all the materials were similar, because the goals of this work were the comparison of sulfur-gold catalysts based on different supports, and the preparation of mesoporous oxides, which will be characterised by the specific surface areas larger than 100 m2 g−1.

2.1.4. Modification of Supports with Hydrogen Sulfide (H2S)

At the beginning, the portion (8.000 g) of mesoporous oxides in the form of fraction (0.5 < Ø < 1.0 mm) were put into a bed-flow reactor of quartz (Ø = 16 mm and l = 50 mm) and thermal treatment in the flow of inert gas—helium (50 cm3 min−1, Linde, 5.0 N) for 2 h at 673 K (a heating ramp—10 K min−1) to remove water and other contaminations. The adsorption of hydrogen sulfide was performed according to the procedure described below. The samples after thermal treatment in the flow of helium was treatment in the flow of gas mixture H2S/He (total flow—50 cm3 min−1, H2S/He = 4/96 v/v %, H2S, Sigma-Aldrich, 99% and He, Linde, 5.0 N) at the beginning at 303 K for 30 min, and then were heated to 673 K for 5 h (a heating ramp—10 K min−1). Then, physical adsorbed hydrogen sulfide was removed with samples in flow of pure helium (50 cm3 min−1) during cooling from 673 K to 303 K (a cooling ramp—10 K min−1) and at 303 K for 60 min. At the final, seven catalysts were prepared: CeOzS(2−z), CexZryOzS(2−z)(4:1), CexZryOzS(2−z)(2:1), CexZryOzS(2−z)(1:1), CexZryOzS(2−z)(1:2), CexZryOzS(2−z)(1:4), and ZrOzS(2−z), in which x is 0 < z < 2 and the ratios in brackets mean the nominal molar ratio between ceria and zirconia in the catalysts.

2.1.5. Modification of Samples with Gold

A portion of 4.000 g of ceria, zirconia or ceria-zirconia oxides modified with sulfur was used to the introduction of gold, according to the literature data [46]. 247 mg of tetrachloroauric acid (HAuCl4⋅3H2O, Sigma-Aldrich, to achieve nominal 3.0 wt % of gold loading) was added to 392 cm3 of distilled water. Then, urea (99%, Fluka (Honeywell Fluka, Wabsh, IN, USA), to achieve 0.42 mol dm−3) was added. The molar ratio of urea/gold was 100. The solution (pH = 2) was stirred in a quartz flask for 4 h at 353 K. Urea played the role of reducing agent of cationic gold and it stabilized the gold nanocrystals supported on the surface of materials. Then, the product was filtered and washed with 85 cm3 of aqua solution of ammonia (25%, NH3⋅H2O, Avantor (Gliwice, Poland), pure to analysis) and 345 cm3 of distilled water to reach pH = 7 and remove chlorides. Then, the product was dried at room temperature for 24 h in air.
The final material was obtained after heating in a flow of gas mixture (Ar/H2 = 90/10 v/v %, total volume—40 cm3 min−1) at 373 K for 1 h and then at 573 K for 1 h (a heating rate—5 K min−1). Thus, seven gold catalysts: Au/CeOzS(2−z), Au/CexZryOzS(2−z)(4:1), Au/CexZryOzS(2−z)(2:1), Au/CexZryOzS(2−z)(1:1), Au/CexZryOzS(2−z)(1:2), Au/CexZryOzS(2−z)(1:4), and Au/ZrOzS(2−z) were made.

2.2. Characterisation of Materials

The materials prepared were characterised using ICP-OES analysis, elemental analysis, adsorption/desorption of nitrogen, XRD, XPS, UV-vis spectroscopy, ATR-FTIR spectroscopy, TG-DTA, TEM, and TPR by H2.

2.2.1. Inductively Coupled Plasma Optical Emission Spectrometry (ICP-OES) Analysis

In order to establish the metal content (cerium, zirconium and gold), the ICP-OES analysis was applied using a Varian ICP-OES VISTA MPX equipment. Prior to analysis, the accurately weighted catalysts portion (around 15–25 mg) was treated first in 2 cm3 of fresh aqua regia (to preparation of solution were taken HCl, 35–38%, POCh and HNO3, 65%, POCh) and were brought to reflux on the heating plate in a fume hood and then 1 cm3 of sulfuric acid was added to obtain totally dissolved material. After the following addition of distilled water, the solution was analyzed by ICP-OES.

2.2.2. Elemental Analysis

Elemental analyses of the materials were carried out using an Elementar Analyzer Vario EL III (Elementar Analysensysteme GmbH, Langenselbold, Germany). The three accurately weighted catalysts portion (around 20 mg) for each sample were analyzed by thermal decomposition. This method was applied to estimate the content of sulfur.

2.2.3. Adsorption/Desorption of Nitrogen

The N2 adsorption/desorption isotherms were obtained using an ASAP 2020 Micromeritics (Micromeritics Instrument Corporation, Norcross, GA, USA) at 77 K. The samples were pretreated in situ under vacuum at 363 K for 1 h, and then at 573 K for 8 h. The surface area was calculated by the Brunauer-Emmett-Teller (BET) method. The pore volume and average of pore volume were determined from Barrett-Joyner-Halenda (BJH) method.

2.2.4. X-ray Diffraction (XRD)

XRD measurements were carried out on a Bruker AXS D8 Advance diffractometer (Bruker, Billerica, MA, USA) with Cu Kα radiation (λ = 0.154 nm), with a step size of 0.05° in the wide-angle range (21–81°). XRD analysis was used to try the estimation of the crystallization state and the average size of metallic gold particles using the Scherrer formula [47].

2.2.5. X-ray Photoelectron Spectroscopy (XPS)

Photoelectron spectra were recorded using an Ultra High Vacuum (UHV) System (Specs, Germany). The study was conducted using X-ray Al Kα = 1486.6 eV with the parameters of the lamp: 14.5 kV, 20 mA. Measurements were carried out in vacuum of approximately 5.0 × 10⁻⁹ mbar in the chamber of the analyzer. The spectra were recorded for the energy range from 1100 eV to 0 eV in increments of 0.4 eV, the energy transition CAE = 100 eV. The X-ray Photoelectron (XP) spectra for metal species were recorded in increments of 0.1 eV, at the energy transition CAE = 30 eV and time counts 50 ms. The number of scans of the range that were measured was chosen to correspond to a given signal to noise ratio. The powder sample was put on the conductive tape, which was adhered to the carrier surface and positioned in perpendicular to the axis of the analyzer. The X-ray source was set at an angle of 60° to the plane of the surface. The area of the samples analyzed corresponded to the size of the aperture of the analyzer used (large area), ca. 50 mm2. Deconvolution of XP spectra was carried out using OMNIC 8.0™ software. Band intensities were estimated by calculating the integral of each band after smoothing and baseline correction, then set the deconvolution parameters for the experimental curve using the software —Gaussian function, signal sensitivity: small and base line: linear. Atomic ratios were computed from the intensity ratios normalized by atomic sensitivity factors. An estimated error of ±0.1 eV can be assumed for all of the measurements.

2.2.6. Ultraviolet-Visible Spectroscopy (UV-vis)

The spectra were recorded for fresh samples before and after their modification with sulfur hydrogen and gold on a Varian-Cary 300 Scan UV-vis spectrophotometer equipment with a high-speed Czerny-Turner monochromator, two light sources—halogen lamp (tungsten) with quartz window for Visible range and deuterium lamp for UV range and a high-sensitivity photomultiplier detector. Powder samples were put into a cell with a quartz window (the diameter of this window was Ø = 10 nm). The measurements were conducted in the range of 800–190 nm. The parameters of measurements were: the resolution—0.4 nm and 1525 points collected by 61 s (25 points s−1). Spectralon™ was used as the reference material. The spectra were recorded using the Kubelka-Munk model, which is applied for the analysis of inhomogeneous materials as powders with the propagation of UV-vis beam differs significantly from the propagation of light in a homogeneous material, e.g., homogenous silica. The intensity and the positons of UV-vis bands in the spectra can give information about the coordination of cerium, zirconium, and gold species, and they can prove the oxidation state of metals.

2.2.7. Attenuated Total Reflectance-Fourier Transform Infrared (ATR-FTIR)

The ATR-FTIR spectra were recorded using the Vertex 70 (Bruker) FTIR spectrophotometer (resolution 4 cm−1, number of scans = 64, in the range 4000–400 cm−1). Samples were put into the Platinum ATR diamond F vacuum A225/Q equipment, which was connected to the spectrophotometer. Spectra were recorded for all of the samples at room temperature (RT). The spectrum without any sample (“background spectrum”) was scanned and subtracted from all of the recorded spectra. The spectra were recorded before and after the thermal treatment of samples at 373 K for 24 h in air conditions.

2.2.8. Thermogravimetric and Differential Thermal Analysis (TG-DTA)

Thermogravimetric analyses of the solids were carried out in air atmosphere using SETARAM SETSYS-12 apparatus (SETARAM Instrumentation, Caluire, France), with a temperature ramp 5 K min−1.

2.2.9. Transmission Electron Microscopy (TEM)

The powders were deposited on a grid that was covered with a holey carbon film and transferred to JEOL 2000 electron microscope (JEOL, Tokyo, Japan) operating at 80 kV. Before measurement, samples were made in the form of a suspension in 1-butanol. The size of particles was estimated using ImageJ™ 1.46r software.

2.2.10. Temperature Programmed Reduction (TPR-H2)

The temperature-programmed reduction (TPR) of all the samples was carried out using the flow of mixture gases H2 and He (10 vol % H2 in He) as a reducing agent (flow rate = 40 cm3 min−1). A sample (20 mg) in the form of powder was packed in a quartz tube (Ø = 5 mm), treated in a flow of helium at 373 K for 4 h and cooled to room temperature (RT). Then the sample was heated at a rate of 5 K min−1 to 1073 K in the presence of the reducing mixture. Hydrogen consumption was measured by a thermal conductivity (TCD) detector.

2.3. Catalytic Activity—Glycerol Oxidation

The glycerol oxidation experiments were performed in a 30 cm3 batch reactor that was made by Parr Company (USA). The oxidation reactions were carried out with oxygen under pressure 6 atm, at 333 K. 0.200 g of NaOH (POCh, 99%, NaOH/glycerol molar ratio = 2), and 0.050 g of gold catalyst were added to aqua solution of glycerol (0.230 g glycerol, Sigma-Aldrich, 99%). Glycerol was dissolved earlier in 25.000 g of distilled water.
The reaction mixture was stirred at 600 rpm for 5 h at selected temperature. The quantitative analyses of the reaction mixtures were performed by high performance liquid chromatography (HPLC). The analysis was carried out using a HPLC chromatograph (Waters 600) equipped with ultraviolet (UV) and refractive index (RI) detectors. The reactant and the products were separated on an ion exclusion column (IC-Pak Ion Exclusion 7.8 × 300 mm—Waters) heated at 308 K. The eluent was a solution of H2SO4 (0.0004 M). The samples were taken at the end of the reactions, 1 mL of solution after reaction was injected and 5 μL of this solution was analyzed.

3. Results and Discussion

3.1. Chemical Composition of Materials

The contents of chemical elements in the catalysts were estimated using ICP-OES, elemental analysis, and XPS measurements (Table 1, Table 2, Table 3 and Table 4). The first technique (ICP-OES) allowed for the evaluation of cerium, zirconium, and gold contents in the bulk materials (Table 1 and Table 2). The second (elemental analysis) was used to the estimation of sulfur content in the bulk materials (Table 3).
The last (XPS) provided the information about gold (Table 2), cerium, zirconium, sulfur, and oxygen contents on the external surface of materials, and it was applied to define the stoichiometric formulas of catalysts (Table 4). The results of ICP-OES analysis show the difference between the nominal (assumed) and real (measured) contents of metals in the materials (Table 1). The real molar ratio between ceria and zirconia for all of the supports was around 50% higher than the nominal molar ratio. This difference can suggest the inhomogeneous composition of materials and/or the presence of oxygen vacancies in the crystal lattice of catalysts, which can be created by the partial removal of oxygen atoms from the crystal structure.
The results of XPS study can suggest the presence of oxygen vacancies, because the value of stoichiometric coefficient for oxygen designated by this method is lower than the assumed stoichiometric coefficient (Table 4). The total introduction of sulfur species to oxides was estimated using elemental analysis (Table 3).
The highest sulfur content (1197 μmol S g−1) and the highest concentration of sulfur on the surface of materials (21 μmol S m−2) were measured for support based on pure ceria. In the case of the highest concentration of sulfur in the total volume of materials, this parameter was obtained by CexZryOzS(2−z)(1:2) (135.3 μmol S m−3). The real molar ratio between CeO2 and ZrO2 was 0.94 in this support and the amount of sulfur per m3 of catalyst was higher than in the case of materials based on pure ceria or pure zirconia. It can suggest the presence of the synergetic effect based on the electron interaction between cerium and zirconium species can lead to higher yield of hydrogen sulfide (H2S) adsorption to the pores of material.
It confirmed the results of the theoretical and experimental studies, that the presence of zirconium species in the crystal structure of ceria can induce the formation of oxygen vacancy around zirconium species [21]. These vacancies can be the places where sulfur atoms are located during the chemical adsorption of hydrogen sulfide. The presence of zirconium species also had positive effect on the stability of sulfur species after the modification oxides with gold species, because materials with high zirconium content were characterised of the smallest decrease of sulfur content (at around 33–57%) than in the case of materials based on cerium oxides (the decrease was around 63–71%). It can be explained by the partial blocking of pores by the metallic gold particles, which were the biggest in the material based on pure zirconia (Table 2). Additionally, the materials with high zirconium content were characterised of smaller average pore size than the materials with high cerium content (Table 4). The X-ray photoelectron spectroscopy (XPS) was applied to measure metals content on the external surface of catalysts (to around 3–10 nm into the studied materials). The comparison of the results of gold content estimated using the ICP-OES and XPS techniques was used to the description of the location of gold species in studied catalysts (Table 2). It was observed the increase of gold content on the external surface with the growth of zirconium content. It can be explained by the decrease of average pore diameter with the increase of zirconium concentration, which was confirmed by the results of the adsorption and desorption of nitrogen (Table 4). It could be also by the partial blocking of pores by gold particles, which was evidenced by the increase of average metallic gold particles loading on the surface of materials with the growth of zirconium content estimated using XRD and TEM (Table 2). Gold species were preferentially localized on the surface of all the materials, whereas, the location of zirconium species depended strongly on the presence of gold in the bulk of materials.
The prepared cerium-zirconium oxides were studied using the XPS method to the determination of stoichiometric formulas and to estimate the possibility of oxygen vacancies presence in the crystal lattice of materials. The stoichiometric formulas of oxides before and after their modification with sulfur and gold species were shown in Table 4. The stoichiometric coefficients of oxygen on the external surfaces of materials were lower than the nominal value (2.00), independently of the presence or the absence of sulfur species. It can suggest the presence of oxygen vacancies in the mesoporous oxides on the external surface before and after their modification with hydrogen sulfur and gold.
The lower values of stoichiometric coefficient for oxygen in the chemical formulas were noted for the catalysts based on the mixed cerium-zirconium oxides, than pure ceria or pure zirconia. The addition of sulfur led to the decrease of oxygen content and it can be explained by the exchanging between oxygen and sulfur atoms from the crystal structure of oxides during the chemical adsorption of hydrogen sulfide. The possibility of exchanging between these two elements was reported in the literature [48,49,50,51].

3.2. Characterisation of Materials

3.2.1. Texture and Structure Properties

The positive effect of the addition cerium species to support on the texture parameters (the growth of surface area, total pore volume, and average pore size) was confirmed by the results of the adsorption and desorption of nitrogen (Table 4). It can be explained by the better dissolution of cerium nitrate in the solution of methanol and Pluronic P-123, than zirconium oxonitrate during the preparation of oxides, and also the longer crystallization of ceria than zirconia. It can be a reason why the real molar ratios between ceria and zirconia on the external surface of catalysts, which were estimated using the XPS, were higher, than the nominal molar ratios (Table 1). The modification of oxides by sulfur species led to the significant decrease of surface area (from around 30% in the case of pure zirconia to around 45% in pure ceria) and the increase of average pore diameter (excluding CexZryOz(1:4) and ZrO2).
It suggests that hydrogen sulfide was adsorbed mainly in the internal pores of materials. After the modification of materials with gold, the surface area increased to the values similar before the modification with hydrogen sulfide. It can be explained by the partial removal of sulfur species during the thermal treatment of supports after gold loading, and the results of elemental analysis can confirm this phenomena (Table 3). The XRD diffraction analysis showed that ceria in all of the samples with cerium were in the form of cubic (JCPDS ICDD PDF Card–00-043-1002) and zirconia in the samples with zirconium species crystallized in the form of monoclinic (JCPDS ICDD PDF Card–00-007-0343) or tetragonal (JCPDS ICDD PDF Card–00-042-1164) (Figure 1).
It is worth to note, that very small changes in the XRD patterns are observed after the modification of oxides with hydrogen sulfide, because the position and intensities of reflections are very similar before and after the treatment of hydrogen sulfide (excluding CexZryOz(1:1)).
It is worth to note, that the XRD method can be used to estimate the size of crystal phase of particles, which are larger than 5 nm. It means that particles, which are smaller than 5 nm, cannot give any reflections in the XRD patterns. The reflections due to metallic gold particles were observed in the XRD patterns recorded for all of the samples that are modified with this metal (Figure 1). The average size of metallic gold particles was calculated using the Scherrer’s formula (Table 2) [47]. The results show that the increase of specific surface area (Table 4) and cerium content (Table 1) had a positive effect on the decrease of the average size of gold particles, but this correlation was not linear, because gold particles were much smaller in the case of Au/CexZryOzS(2−z)(1:2), than Au/CexZryOzS(2−z)(1:1) (in the case of gold particles estimated using the Scherrer’s formula [47]). It can be explained by the changes in the average size of pore diameter (Table 4). The decrease of pore diameters favored the agglomeration of gold on the external surface of catalysts. The comparison of gold content in the bulk and on the external surface of materials shows that gold was preferentially located on the external surface in all of the catalysts (Table 2), especially in Au/ZrOzS(2−z).
The TEM images confirmed the presence of metallic gold particles in the materials that were modified with gold and the mesoporous structure of the obtained catalysts (Table 2 and Figure S1). The results that were obtained using TEM show that the increase of zirconia content in mixed cerium-zirconium oxides had positive effect on the decrease of the average gold particles, and a better dispersion of gold particles (from 5.3 nm in Au/CexZryOzS(2−z)(1:1) to 4.7 nm in Au/CexZryOzS(2−z)(1:4)). It can suggest that the direct contact gold, sulfur, and zirconium species can protect gold particles in their agglomeration. It means that the size of gold particles loading on ceria, zirconia, and mixed cerium-zirconium oxides can be controlled by the chemical composition of supports.

3.2.2. The Oxidation State of Metal Species

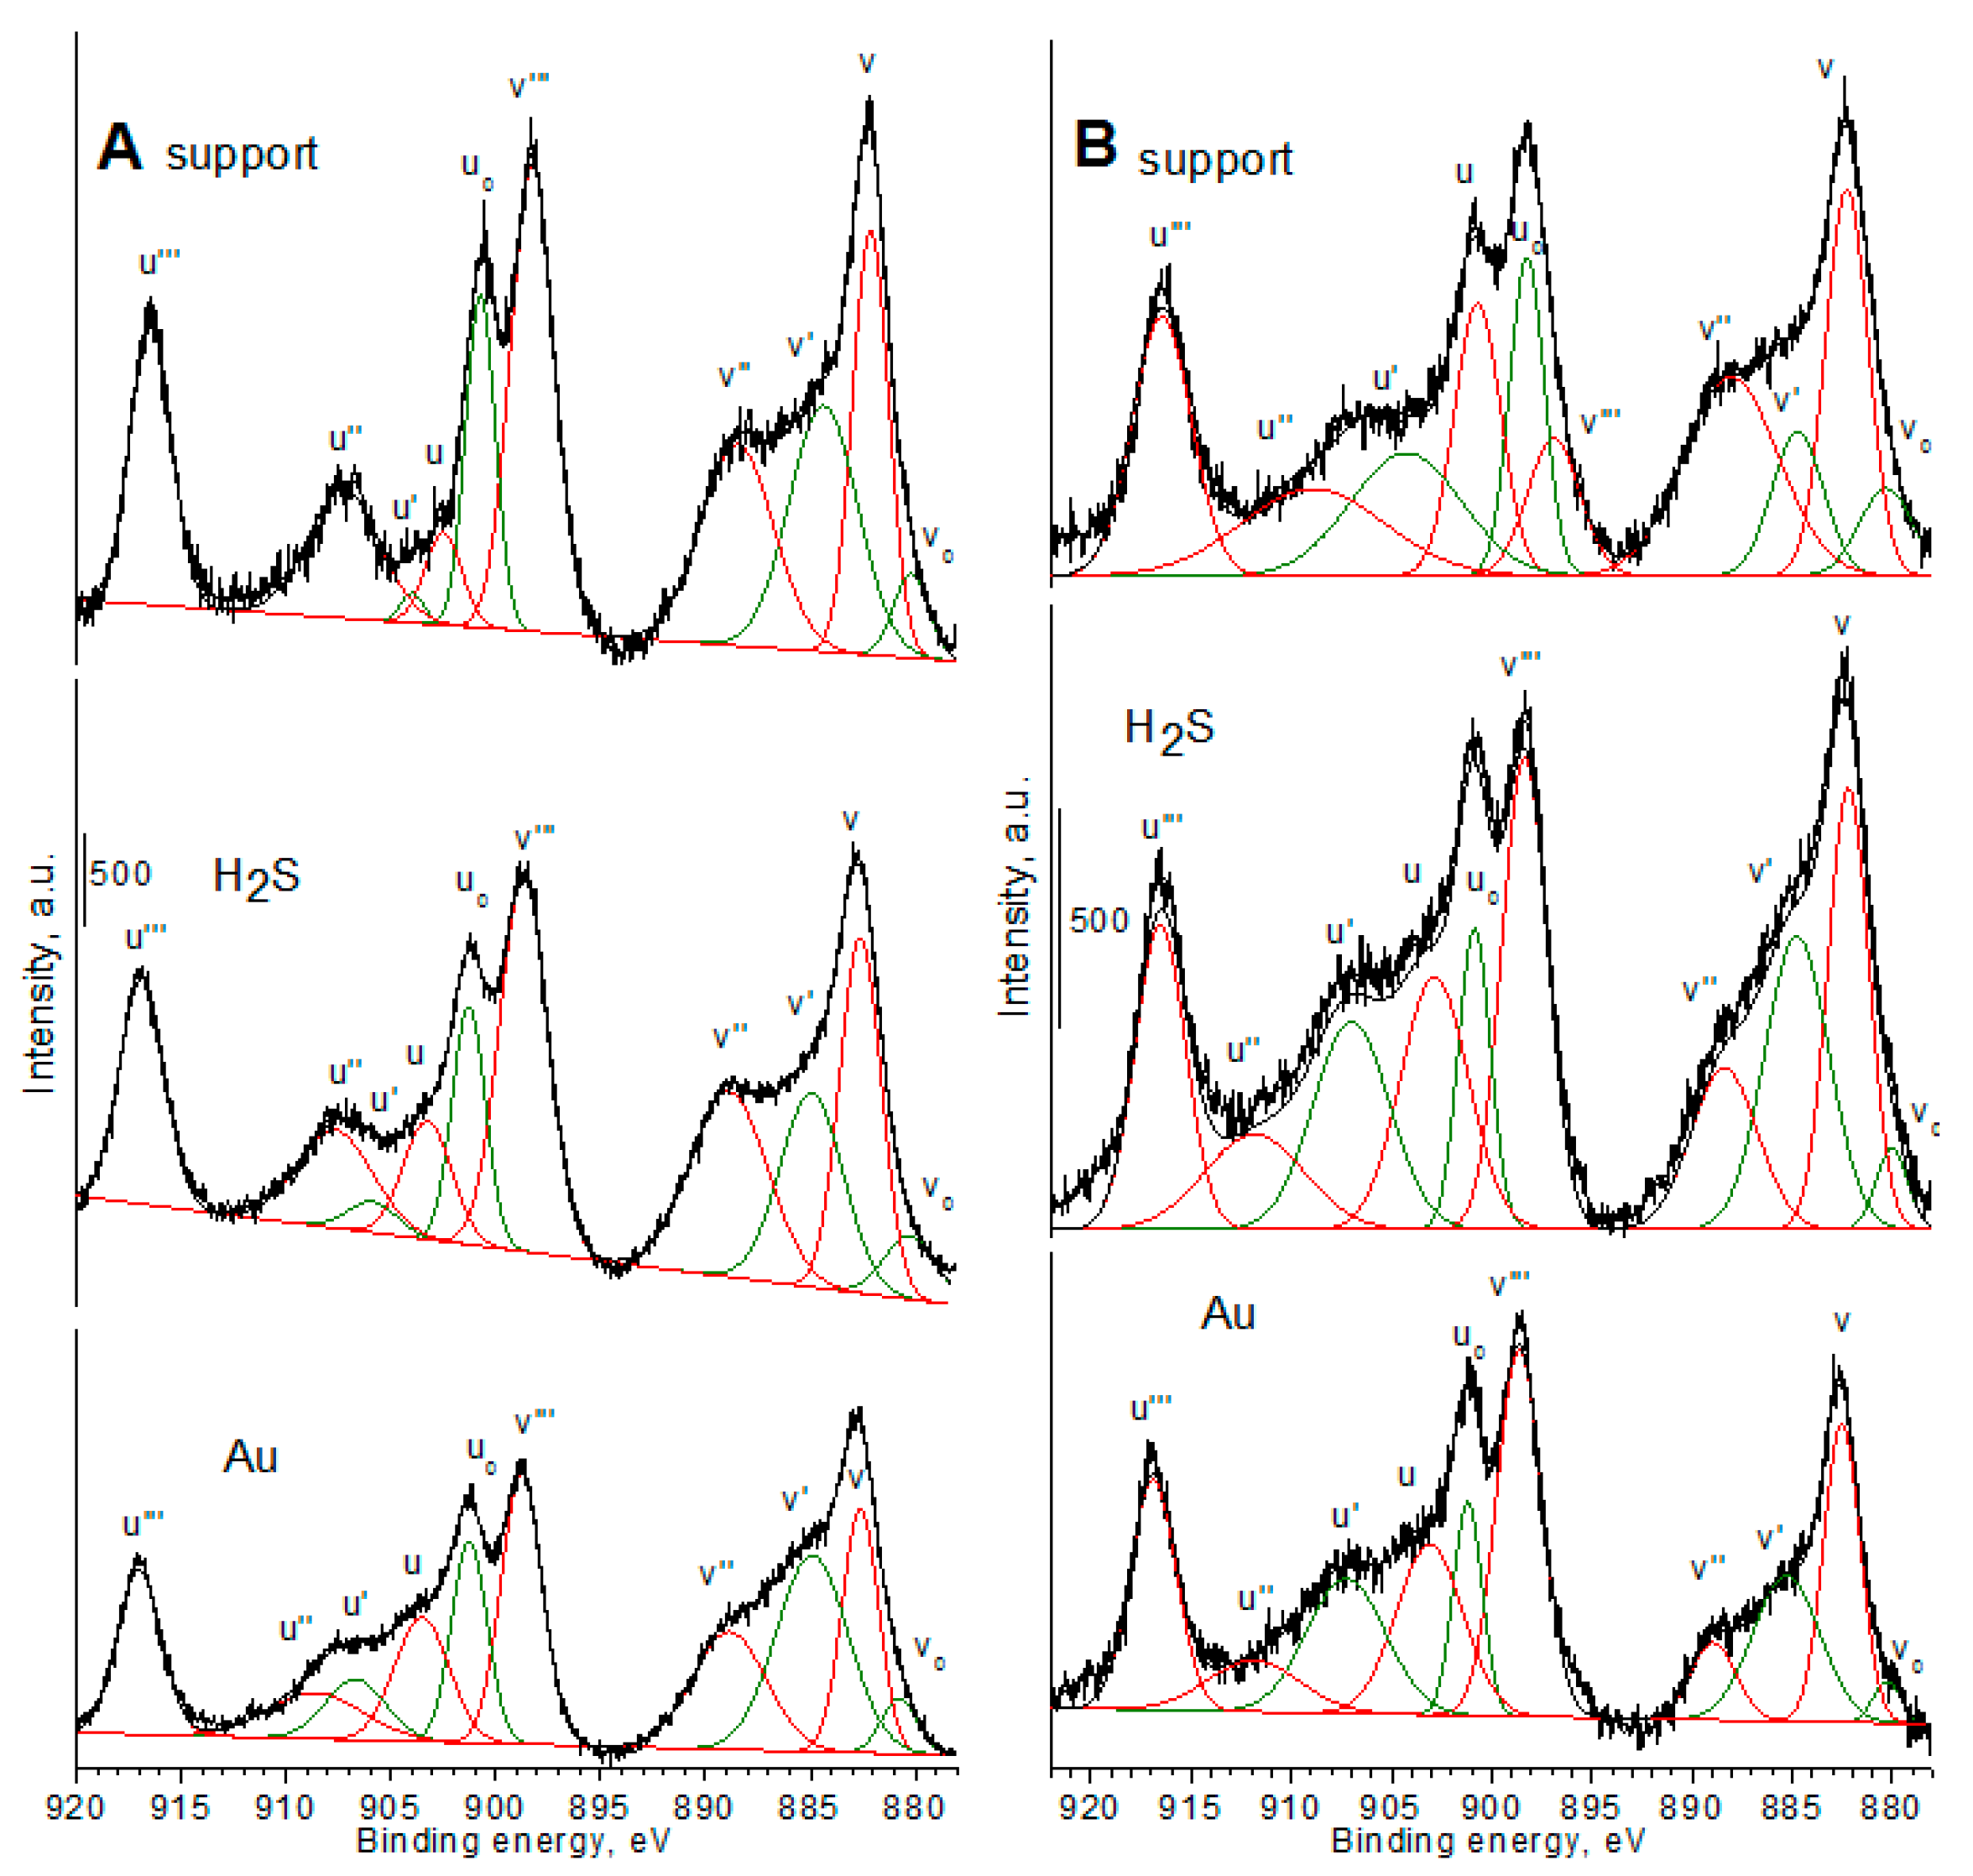
The main form of cerium species on the external surface of studied samples was Ce4+ (Table 5). The occurred differences between the catalysts can be explained by the partial reduction of cerium species (from Ce4+ to Ce3+) during the flow of inert gas (helium) before the modification of materials with hydrogen sulfide. The phenomenon of cerium species reduction during the activation of catalysts in the flow of inert gas was explained in earlier studies [32]. The presence of zirconium species in the support led to the easier reduction of cerium species in the mixed oxides before their modification with sulfur and gold species. In the case of mixed cerium-zirconium oxides that were modified with sulfur species, the increase of zirconium content promoted also the reduction of cerium species.
The distribution of metallic gold (Au0) species that were estimated using the XPS method was higher in the catalysts based on mixed cerium-zirconium oxides than pure ceria or zirconia (Table 5). It can suggest the presence of synergetic effect supported on the electron interaction between cerium and zirconium atoms, which led to the reduction of gold species. In the case of pure ceria or zirconia modified with sulfur and gold, the distribution of anionic gold species on the external surface of metallic gold particles ((Au0)δ) was higher than in the mixed cerium-zirconium oxides (Table 5 and Table 6). It is worth to note, that in earlier study [32], gold loading on the external surface of ceria, zirconia, and mixed cerium-zirconium oxides was in the form of metallic (Au0) and cationic species (Auδ+). The anionic species ((Au0)δ) were current only in the bimetallic copper-gold catalysts [32]. It suggests that the sulfur species can play the same role as copper species in the bimetallic copper-gold catalysts. Sulfur species (e.g., as like thiol groups -SH) can reduce gold species, and they are oxidized to sulfate groups (e.g., as like sulfonic groups –SO3).
The results of TG-DTA, XPS, and ATR-FTIR measurements confirmed the presence of both groups in the materials modified with hydrogen sulfide. It is worth to note that the mixed oxides modified with sulfur were characterised also by the lower values of stoichiometric coefficient of oxygen in chemical formulas estimated using XPS than pure ceria or zirconia (Table 4).
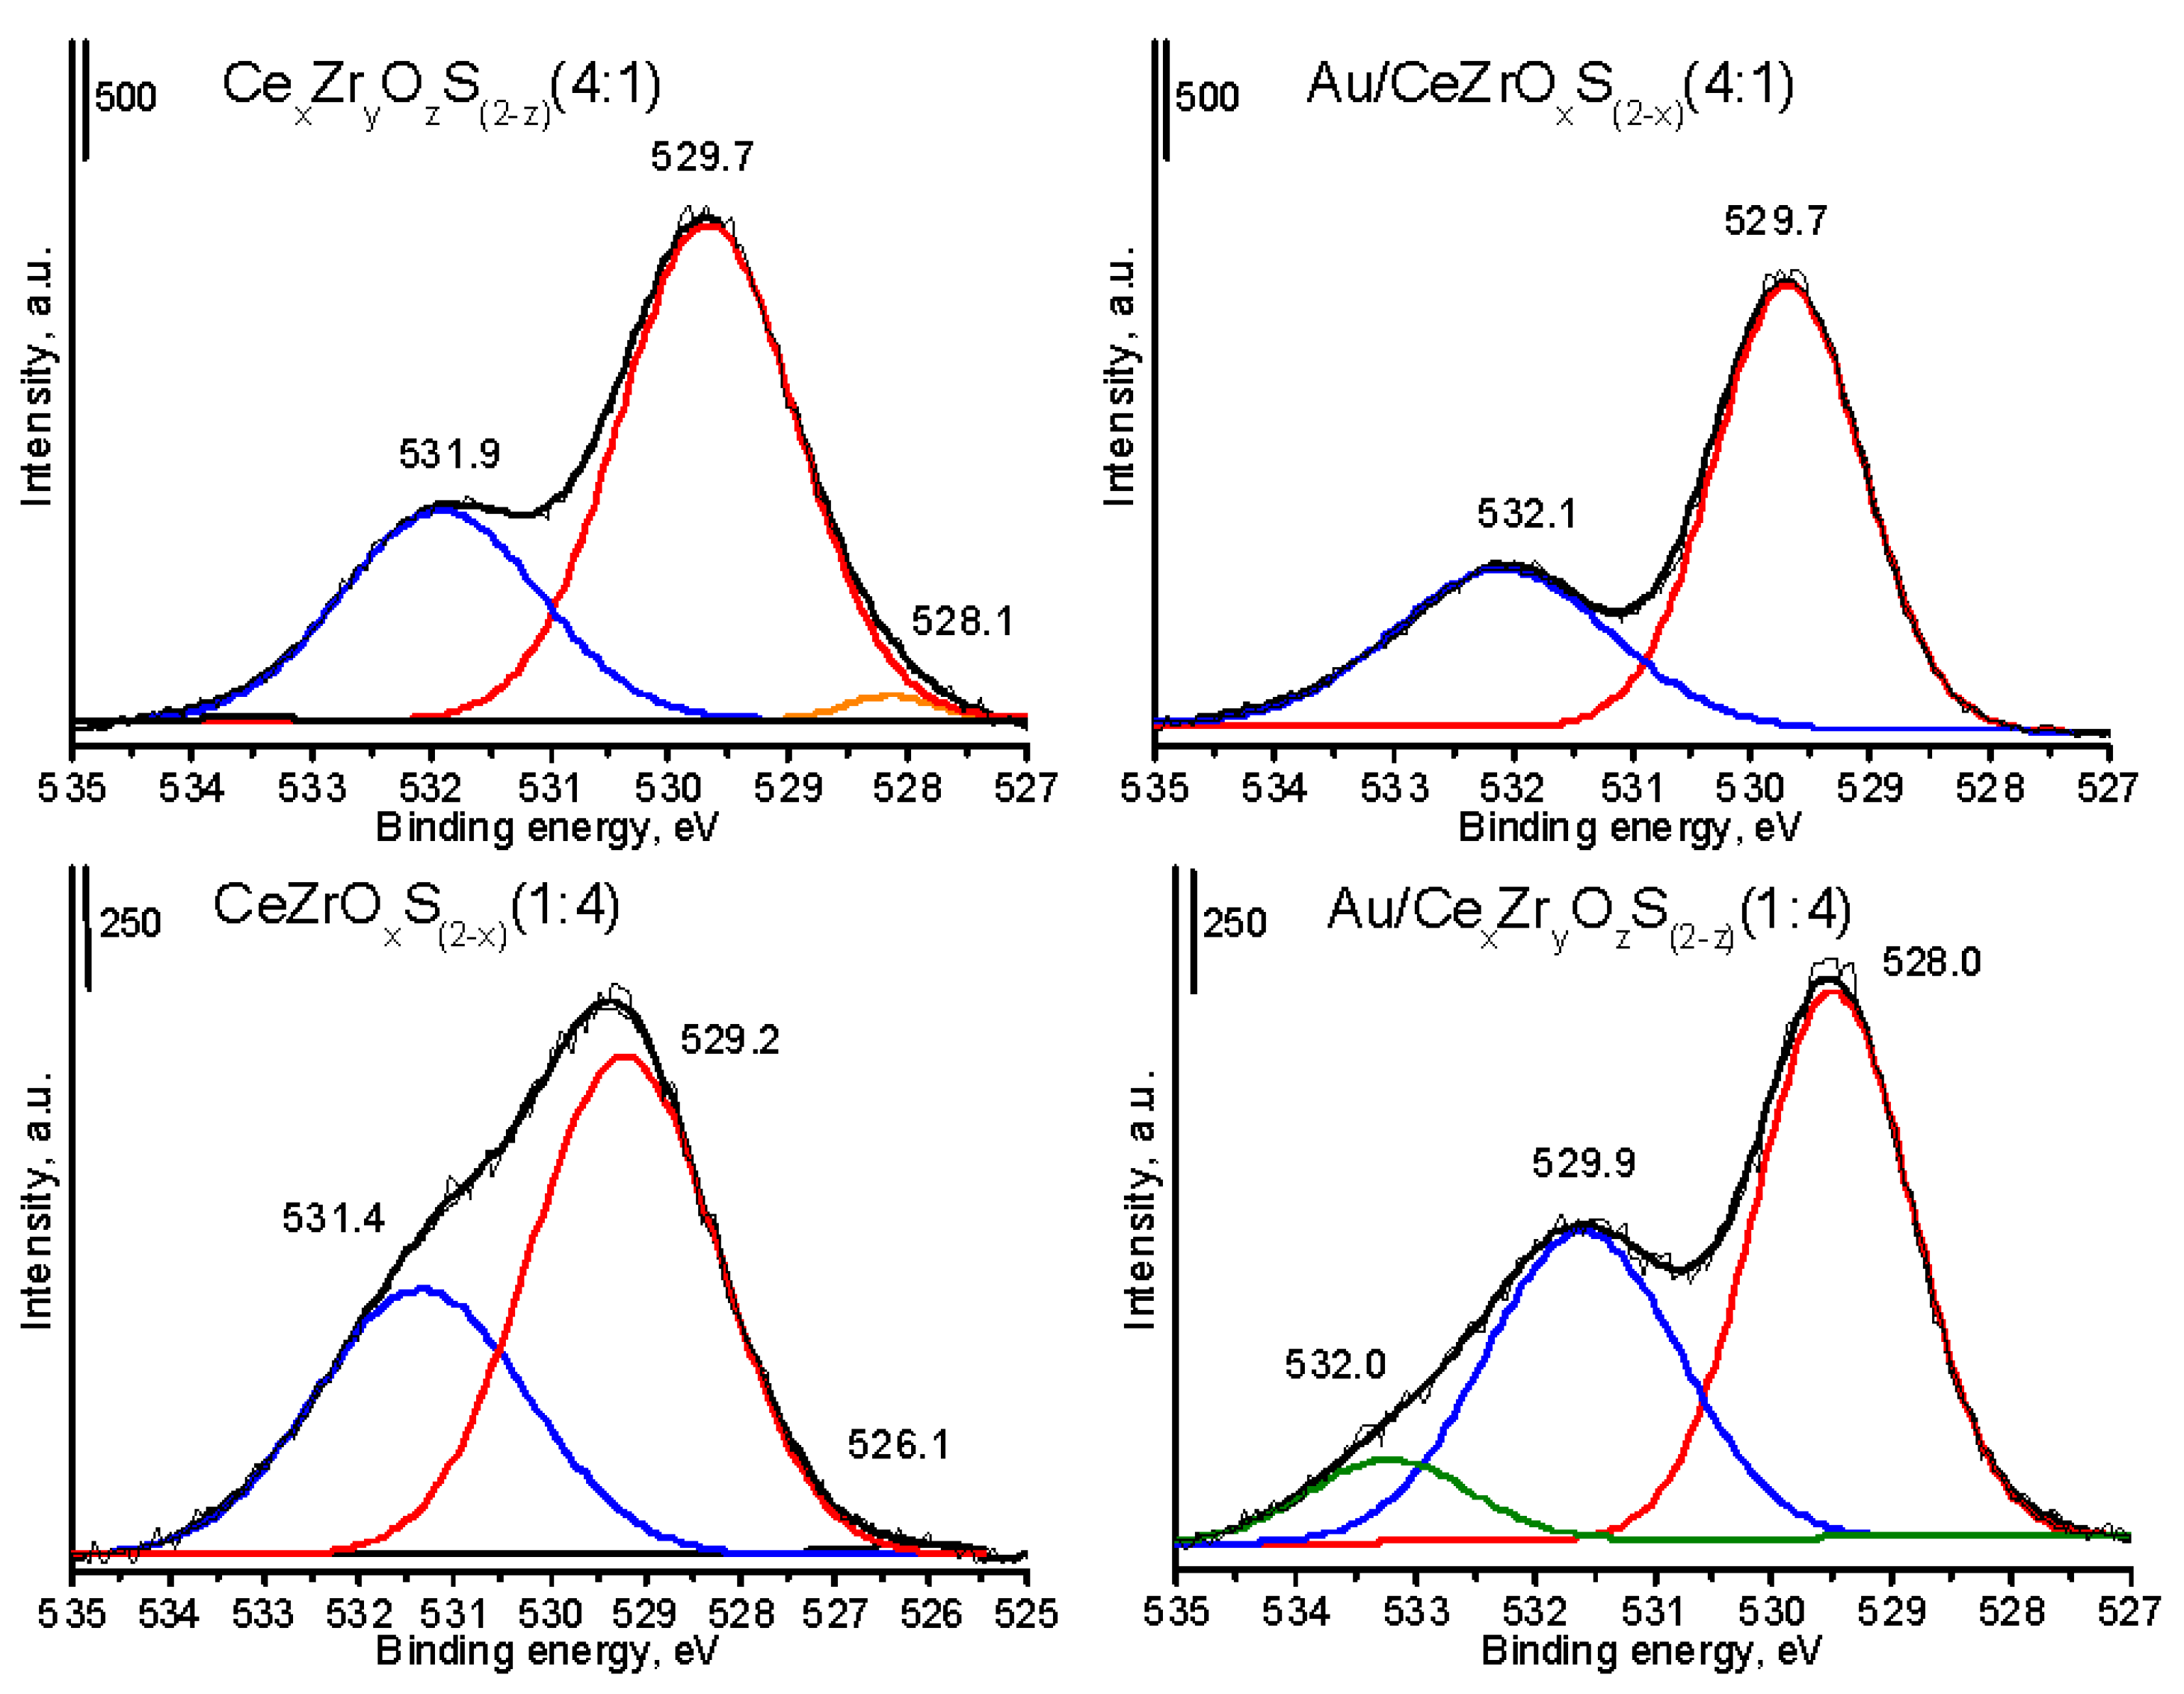
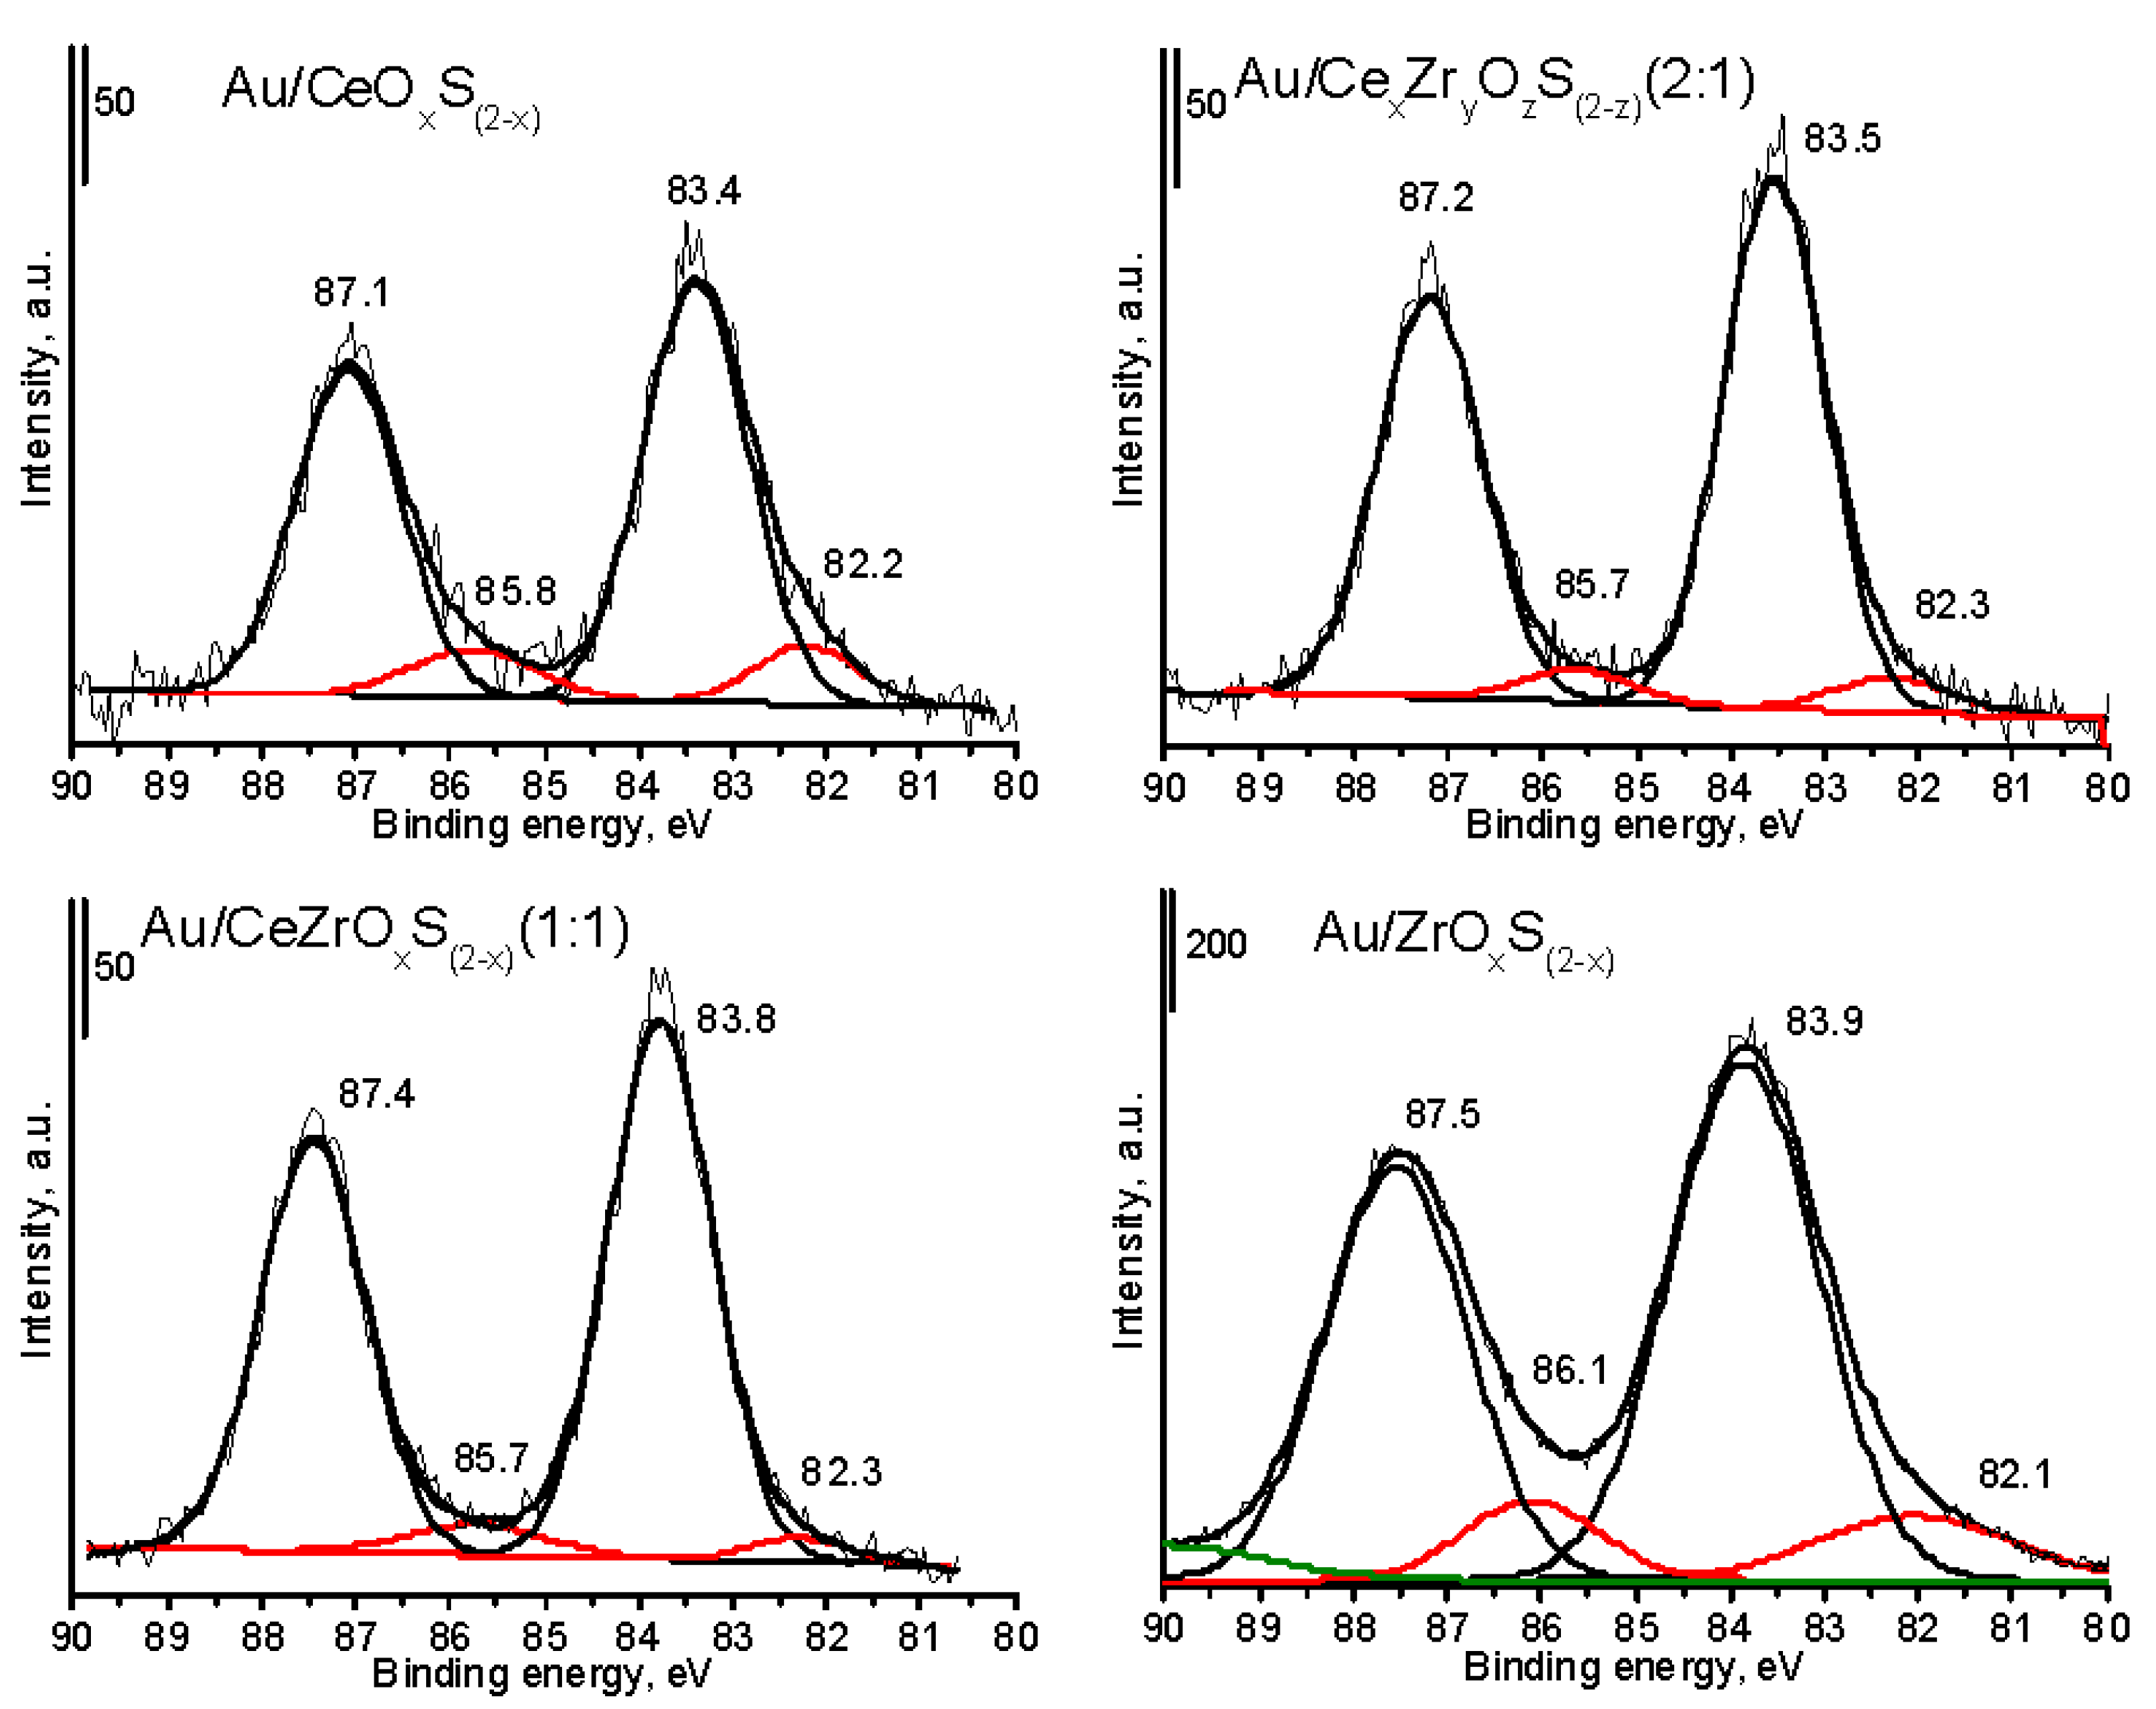
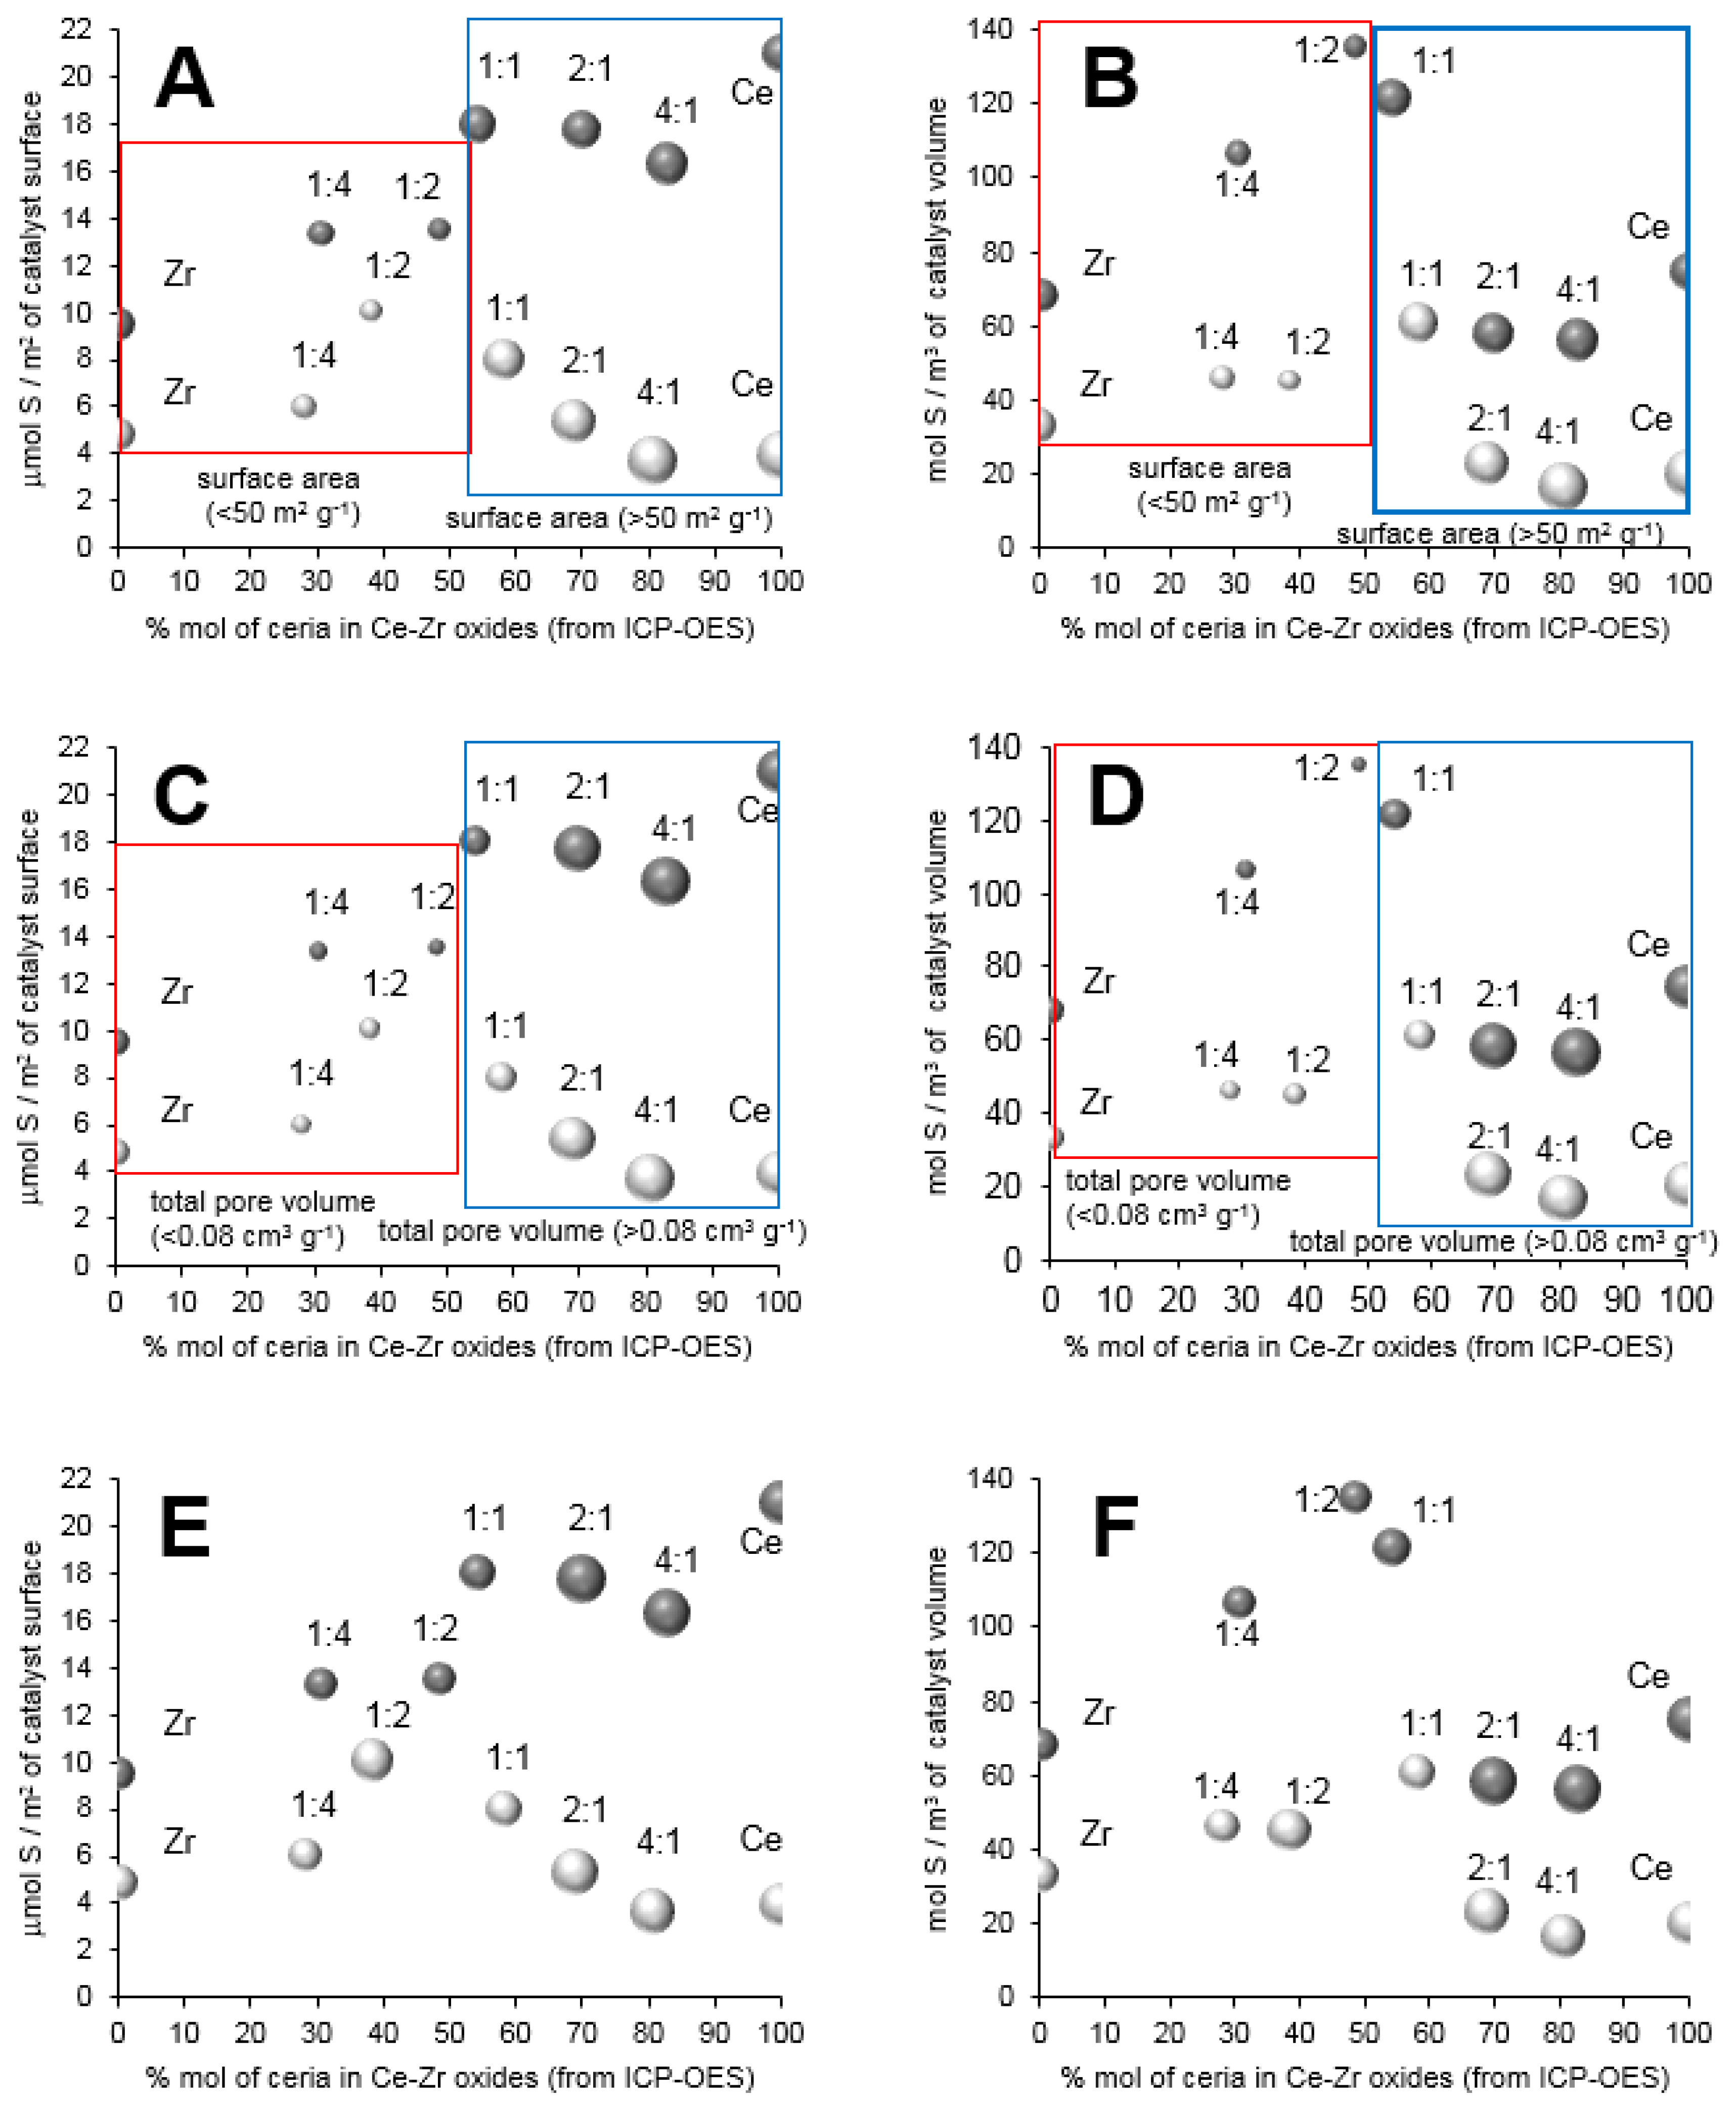
The XPS spectra (Figure 2, Figure 3 and Figure 4 and Figures S2–S5) were recorded for the assessment of oxidation state of chemical elements, and proved the changes in the contents of oxygen and sulfur. The increase of sulfur content (Table 3) led to the decrease of gold content on an external surface (Table 2). The comparison of zirconium and sulfur contents showed that the growth of zirconium concentration on external surface led to the decrease of sulfur on the surface of materials. The correlations between sulfur content on square meter of materials or cubic meter of pore volume of catalysts and the molar ratio of oxides for selected surface parameters were shown in Figure 5.
The molar ratio between ceria and zirconia around 1 in mixed oxides led to the highest sulfur content (on the external surface) on square meter of materials that were modified with gold species. The lack of linear correlation between sulfur content and cerium or zirconium content proved that the chemical composition of supports influenced on the surface parameters. This parameter could play a crucial role in the possibility of the migration of gold species to the bulk of materials, and the agglomeration of sulfur species on the external surface during the thermal adsorption of hydrogen sulfide.
The largest surface specific area of materials were measured for the materials based on pure ceria CeO2 and mixed oxide CexZryOz(4:1). The decrease of specific surface area below 30 m2 g−1 and the average pore size below 9.0 nm (in the case of CexZryOzS(2−z)(1:2) and CexZryOzS(2−z)(1:4)) led to the increase of gold content (above 3.0 at % and sulfur below 3.5 at %). If the specific surface area was around 40 m2 g−1 and the average pore size was around 6.0 nm (in ZrOzS(2−z)), then the gold and sulfur contents on the external surface were higher. It can suggest that the presence of zirconium species had positive effect on the migration of gold and sulfur species on the external surface. The XP spectra for O 2p region showed that the chemical composition of supports influenced on the distribution of the bands due to oxygen species (Figure 3). The high cerium content in the mixed cerium-zirconium oxides led to the shift of a main band to the lower values of binding energy (BE) and the lower distribution of the area of band at 531–532 eV. It can suggest a stronger interaction between oxygen and zirconium species and easier removal from the crystal structure of oxygen atoms, which were in the neighborhood of cerium atoms. The XP spectra of Au 4f region recorded for selected gold catalysts (Figure 4) showed that the presence of cerium can lead to the shift of the bands in the XP spectra to the lower values of binding energy (Table 6).
It can be explained by the stronger interaction between cerium and gold species and the easier reducibility of cerium species, as confirmed by TPR by H2 study.
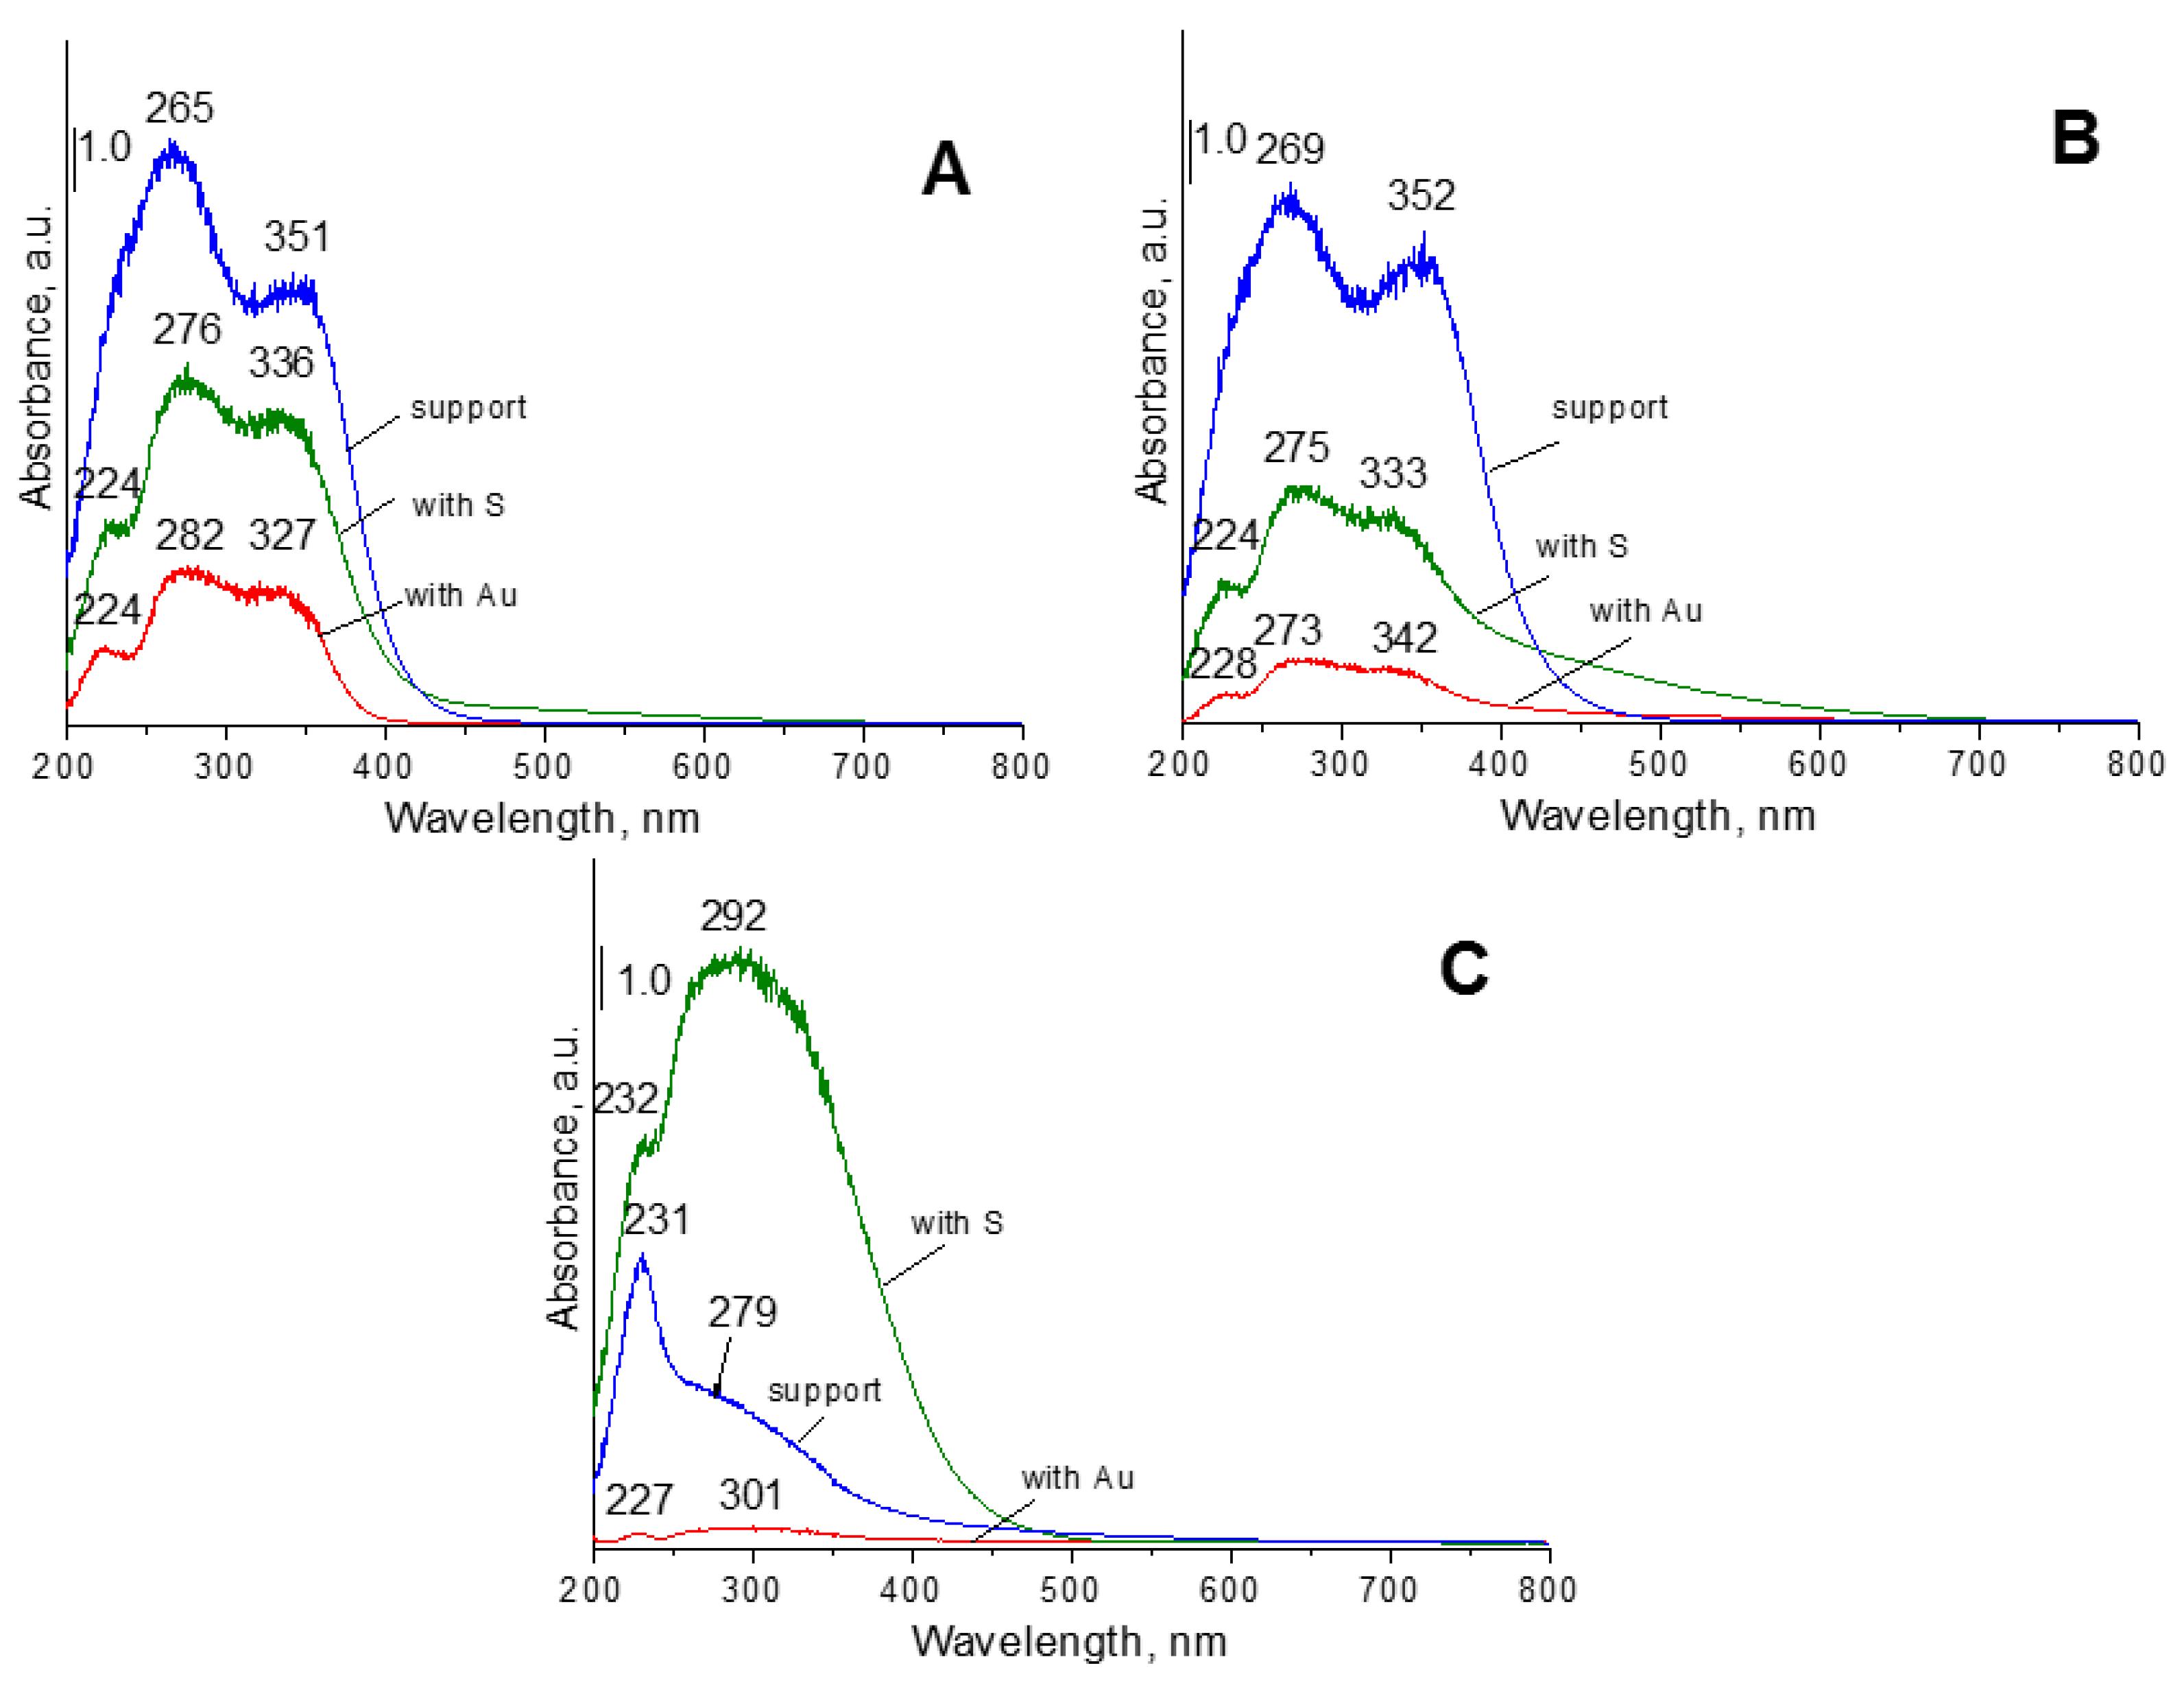
UV-vis spectroscopy is a method, which can be used to the estimation of oxidation state and the coordination of metals. Figure 6 and Figure S6 display the UV-vis spectra of selected calcined catalysts that are studied in this work. In the case of samples with cerium species, the bands in the range of 200–400 nm can be due to the ligand-metal charge transfer (LMCT) between oxygen ions (O2) to cerium cations (Ce4+). According to the literature data [21,52], the position of a band coming from ligand to metal charge transfer depends on the ligand field symmetry surrounding the cerium center.
It can explain why the charge transfer from oxygen ions to cerium cations requires higher energy of tetra-coordinated cerium cations than that of e.g., hexa-coordinated or octa-coordinated species. In the UV-vis spectra recorded for the materials with cerium species are seen tree bands at around 225, 265, and 350 nm in the UV-vis spectra recorded for the catalysts with cerium (Figure 6A,B) can be assigned to the different LMCT: in crystalline ceria (from O2− to Ce4+), from oxygen species O2− to cerium cations Ce4+ in tetrahedral coordination, and with a higher coordination number than four, respectively. The shape of the UV-vis spectra recorded for samples with cerium species after modification with hydrogen sulfide changed and the intensity of the bands decreased, but the band at around 225 nm is not covered by the band at around 265 nm.
The UV-vis spectra recorded for samples based on zirconia (Figure 6C) show a band around 230 and 280 nm, which can be due to the LMCT from oxygen ions (O2−) to zirconium ions (Zr4+) with octahedral configuration in zirconia crystallites. In the case of catalysts based on pure zirconia, after its modification with sulfur species, the intensity of band at around 292 nm increased significantly. For support with sulfur, the band at ca. 220 nm is visible. It can suggest the presence of the new kind of coordination of zirconium species by sulfur and/or oxygen atoms.
The discussed UV-vis region (200–400 nm) is also typical of the LMCT of gold species (Au3+ and Au+ ions) with ligands [52,53,54,55,56,57,58,59], or for the absorption bands due to the transition of electrons between molecular orbitals of the few-atomic clusters Aun (n < 10). It means that this region cannot be used to the identification of the form of cationic gold species. The range of 500–580 nm can be applied to the estimation of metallic gold nanoparticles (Figure S6). The bands in this region can be due to the optical absorption of the light excited oscillating conductivity electrons of metallic gold particles [60,61]. The positions of bands above 500 nm can give information about the kind of metallic gold species, e.g., a band at 567 nm (Figure S6) can be due to the plasmon resonance in metallic gold particles [62]. This band was found only in the catalyst that was modified with gold based on pure ceria. It can suggest that the composition of the support can determine the presence and the position of this band.
It is worth to note that the modification of the catalysts with gold led to the decrease of the intensity of these bands, which were assigned to cerium species. It can confirm that the decrease of cerium species contents on the external surface upon the modification of catalysts with gold, which was documented by XPS study.

3.2.3. The Form of Sulfuric Species

The XPS, TG-DTA, TPR by H2, and ATR-FTIR measurements were applied to the identification of the form of sulfuric species.
The comparison of selected XP spectra recorded for the region of sulfur species (S 2p) (Figure S1) showed the shift of binding energy (BE) to higher values after the modification of samples with gold species (Table 5). According to the literature data [63], the bands of XPS spectra at around 168 eV could be correspond to sulfur species as oxidized sulfur groups. It was reported [64] that the bands at 167.4 and 168.7 eV can be attributed to sulfur in sulfonyl (S–O) and/or sulfate (S=O) groups, respectively, and these groups are generated in the presence of oxygen. It was published in [65,66,67] that the band at 168.1 eV can be assigned to the binding energy of sulfur in sulfonic groups (–SO3H). The results of BE present in Table 5 showed that after the modification of oxides with hydrogen sulfide, sulfonyl, and/or sulfonic groups could be located on the external surface of materials. The increase of zirconium content favored the presence of sulfonyl groups (S–O) and higher cerium content led to the growth of the distribution of sulfate groups (S=O). These differences can be explained by the changes in the coordination of metal (cerium and zirconium) species and the oxidation state of cerium species. The loading of gold on the surface of samples with high zirconium content changed the main form sulfonyl groups (S–O) to sulfate groups (S=O). In the mixed oxides [CexZryOzS(−z)(2:1); CexZryOzS(2−z)(1:1); CexZryOzS(2−z)(1:2)] before and after their modification with gold, sulfonic groups were the main form of sulfur species on the external surface. These materials were characterised by the molar ratio between CeO2 and ZrO2 in the range 0.62 and 2.20 (according to the XPS study), and it suggests the positive effect of interaction between cerium and zirconium species on the creation of sulfonic groups.
The oxides before and after their modification with hydrogen sulfide and gold species were studied using TG-DTA in the flow of air in the order to know the form of sulfur species on the surface of catalysts and to estimate their thermal stability. The analysis of TGA and DTA profiles of samples that were modified with sulfur showed that this chemical element was in several forms (Figure S7). In the supports modified with sulfur, in which the nominal (assumed) content of ceria was higher than zirconia [CeOzS(2−z), CexZryOzS(2−z)(4:1) and CexZryOzS(2−z)(2:1)] were observed two peaks. The first peak at lower temperature was more intense than the second at higher temperature. The first peak, at around 500 K, could be described to thiol groups (-SH), and the second peak at around 850 K could be due to sulfonic groups (–SO3H). In the case of samples with higher amount of zirconium after the catalysts modification with sulfur species (CexZryOzS(2−z)(2:1), (CexZryOzS(2−z)(1:1), (CexZryOzS(2−z)(1:2) and CexZryOzS(2−z)(1:4)) were observed two peaks at around 500 and 600 K, which could be due to two forms of thiol groups being located on the external surface and in the bulk of samples, respectively. In the case of ZrOzS(2−z), only one intense peak in the DTA profile was seen, which could be due to sulfonic groups on the external surface. The results of DTA confirmed that the chemical composition of supports had influence on the chemical adsorption of hydrogen sulfide.
The samples were heated in the flow of inert gas (helium) before the adsorption of hydrogen sulfur, and then the modification of sulfur species was performed in the flow of the mixture of gases (helium and hydrogen sulfur). The lack of oxygen in the flow of gases before and during the modification of samples can suggest that the mechanism of modification thiol groups to sulfonic groups which was based on the exchanging between hydrogen atoms from hydrogen sulfide and oxygen atoms from the structure of oxides. This mechanism assumes the presence of oxygen vacancies in the structure of materials created during the activation of materials in the flow of inert gas and it is according to the literature data [32]. The comparison of the stoichiometric formulas of oxides before and after their modification with sulfur species confirms lower oxygen distribution on the external surface after the adsorption of hydrogen sulfur (Table 4). The increase of signals in the temperature range of 500–1000 K with the maximum at around 700 K was observed in the case of selected TGA profiles. These wide peaks were seen for CexZryOzS(2−z)(2:1), CexZryOzS(2−z)(1:1), CexZryOzS(2−z)(1:2), and CexZryOzS(2−z)(1:4). For the same samples, were observed peaks at around 600 K in the DTA profiles, which can be due to the thiol groups in the bulk materials (Figure S7).
The catalysts were characterised using a temperature programmed reduction (TPR) by hydrogen in the order to know the redox properties of samples. The TPR profiles were shown in Figure S8. The maximums of hydrogen consumption depend on the chemical composition of samples and the size of crystals. The TPR profile of pure ceria shows the consumption of hydrogen in the wide temperature range of 450–700 K, with the maximum at 522 K, which can be due to the reduction of cerium species (from Ce4+ to Ce3+). The consumption of hydrogen at this temperature can prove the presence of small cerium oxides particles, which are smaller than in the mixed cerium-zirconium oxides. The broad temperature range of hydrogen consumption suggests that the crystals of ceria are characteristic of the broad range of sizes. The modification of ceria with hydrogen sulfide led to the disappearance of hydrogen consumption at lower temperature. After medication of ceria with gold and sulfur species, a very weak peak is observed in the broad temperature range (500–900 K). It can suggest that sulfur and gold species covered the external surface of supports, and the oxidized cerium species (Ce4+) were not able to reduce to the reduced form of cerium (Ce3+). The addition of zirconium led to the increase of temperature, in which hydrogen is consumed or the disappearance of this process. It means that the presence of zirconium leads to the protection of cerium species against their reduction at lower temperature.
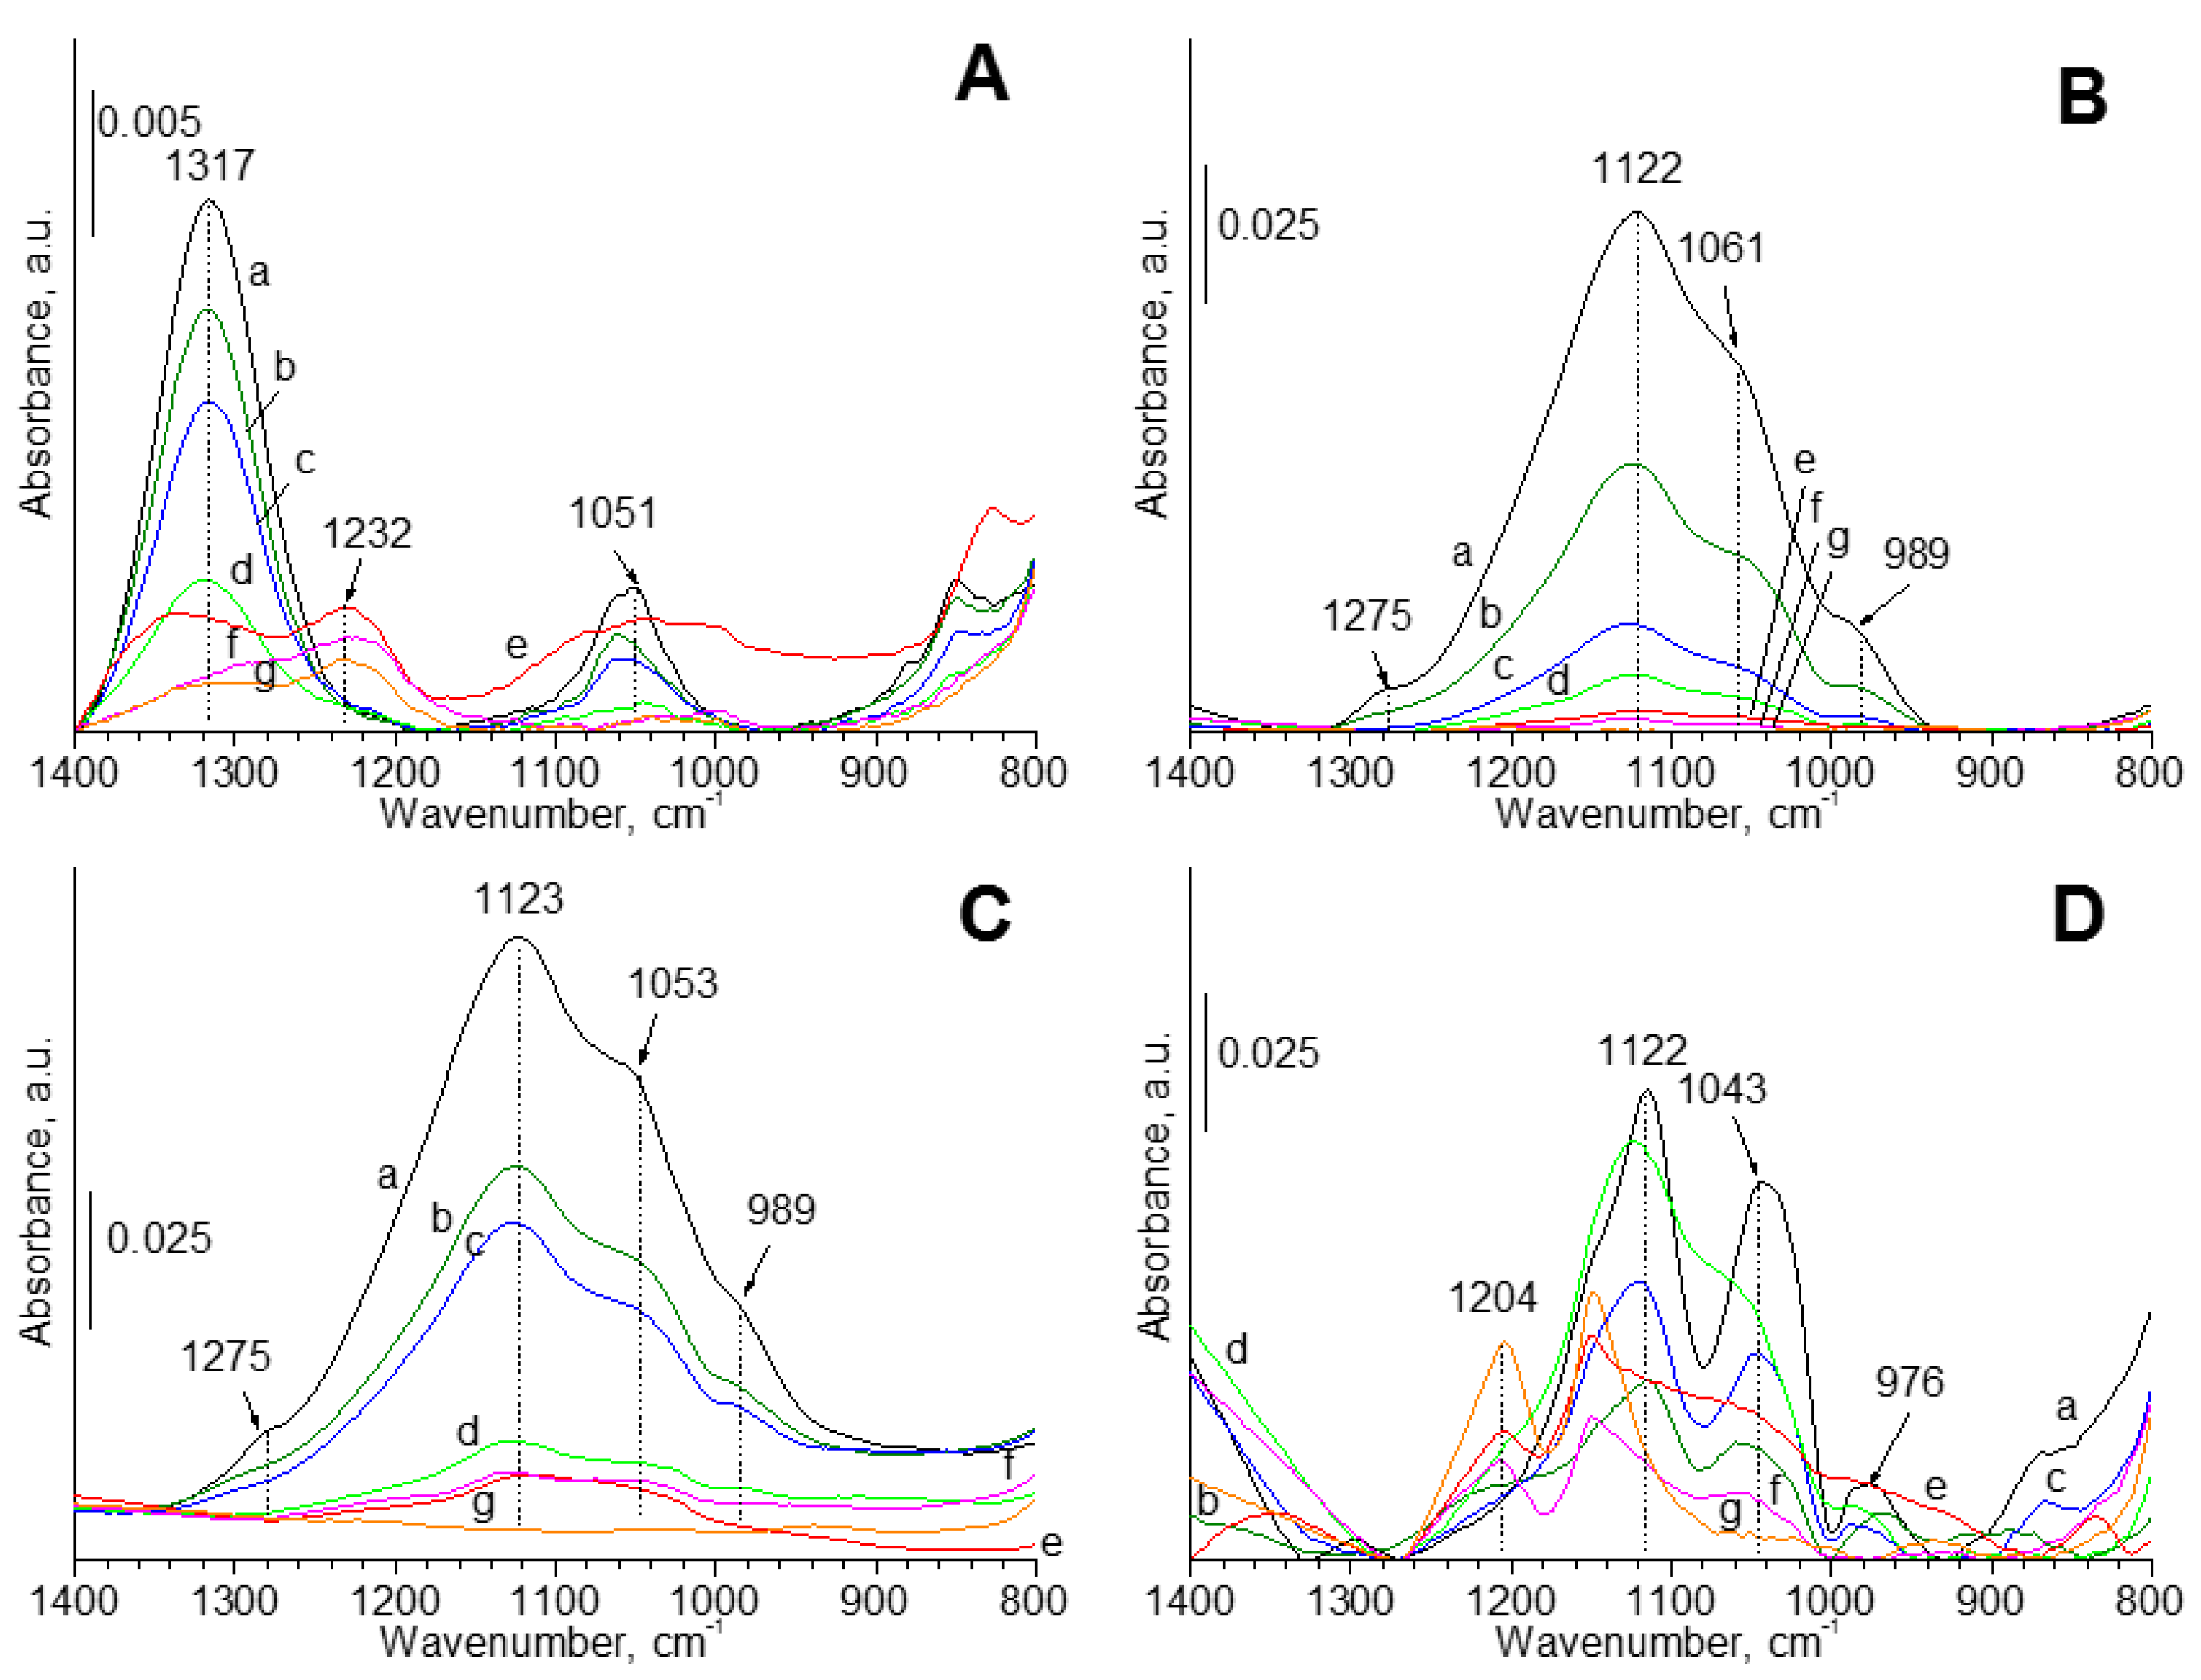
The ATR-FTIR spectra were recorded at room temperature in the atmosphere of air for all of the samples (Figure 7). In the case of samples that are modified with hydrogen sulfide, four bands in the region of 1400–800 cm−1 were observed. The most intense band at 1122 cm−1 was not observed on the spectra of pure oxides. The intensity of this band was also smaller in the case of samples modified with sulfur and gold. The increase of cerium content had a positive effect on the increase of intensity of this band. The sulfur content increased with the growth of cerium content, so it can suggest that the band at 1122 cm−1 can be assigned to the sulfur species. It has been reported [68] that this band can be assigned to the symmetric stretching band of the sulphone groups, as like (–O–SO2).

3.3. Catalytic Activity—Glycerol Oxidation

Catalytic glycerol oxidation was performed at 600 rpm, because a physical diffusion did not have crucial influence on the catalytic reaction at this stirring speed (this value was set on the base of earlier study [69]). Therefore, further experiments were carried out using this stirring speed.
The results of the catalytic oxidation of glycerol at 333 K in a basic aqueous solution under pure oxygen for gold catalysts with sulfur species are shown in Table 7. All of the gold catalysts achieved high yield to gaseous products, which could not analyzed using a HPLC device.
According to the literature data [70,71], the changes of gold dispersion and its electronic state can play a role in the increasing of catalyst activity and selectivity to glyceric acid. The correlation between the increase of glycerol conversion, the increase of gold dispersion, and the decrease of selectivity to glyceric acid for small gold particle size (e.g., 2.7 nm) was observed in [64]. In this work, the higher selectivity to glyceric acid was achieved over gold loading on supports based on pure ceria [Au/CeOzS(2−z)], or with small amount of zirconia [Au/CexZryOzS(2−z)(4:1)]. The selectivities to other oxidation products, such as oxalic and tartronic, were observed, but the values of these selectivities were traces (<0.5%). According to the literature data [72,73], glycerol can be oxidized to glyceric acid at basic conditions over gold catalysts by the initial formation of glyceraldehyde, which is rapidly oxidized to glyceric acid. The presence of tartronic and oxalic acids can be explained by over-oxidation or transformation of glyceric acid.
The interaction between chemical elements in gold catalysts influences the activity and selectivity in glycerol oxidation. It has been reported [74,75,76,77,78] that the chemical nature of the support and active phase (e.g., palladium-gold, platinum-gold) determine the species formed on the surface during the oxidation process in the liquid phase. In the case of materials that are modified with sulfur and gold, the increase of zirconium content promoted the transformation of glycerol to tartronic acid. The highest selectivity to glyceric acid was observed for Au/CexZryOzS(2−z)(4:1). In this catalyst, the values of the total pore volume and the specific surface were the biggest (Table 4), and it can suggest that the parameters of structure can limit the diffusion of glycerol molecules to active sites. The TOFs were calculated for all of the samples (Table 7) and higher TOFs values were achieved for gold catalysts modified with sulfur with high zirconium distribution in the support, because the highest value was achieved over Au/CexZryOzS(2−z)(1:4). It can prove the strong interaction between reagents molecules and gold, sulfur and zirconium species during glycerol oxidation. The analysis of elemental analysis of selected gold catalysts confirmed that the sulfur species were present in the studied materials after glycerol oxidation, because the content of sulfur decreased from 342 to 230 μmol g−1 in the case of Au/CeOzS(2−z), and from 199 to 185 μmol g−1 in the case of Au/ZrOzS(2−z). It confirms that the composition of support affected the strength of bonding between transition metal atoms from the support and sulfur species.
The addition of sulfur led to the reduction of gold to in the form of gold with the negative charge on the metallic particles loading on the external surface of catalysts, and it was confirmed by XPS study (Table 5). It is worth to note that the increasing of zirconium content in mixed oxides promoted the growth of distribution of sulfonic species, because the highest distribution of sulfonic species measured using XPS study was achieved by Au/CexZryOzS(2−z)(1:4). It is worth to note that it was observed the increase of metallic gold (excluding Au/CeOzS(2−z)) and sulfonic groups (–SO3H) (excluding Au/CeOzS(2−z) and Au/CexZryOzS(2−z)(1:4)) distribution on the external surface of catalysts after the reaction of glycerol oxidation. The values of binding energies of Au 4f, S 2p, and Zr 3d species changed slightly after the reaction. It means that the energy of bonds between atoms with the active phase and supports are similar before and after reaction, and these materials characterised the chemical stability during the reaction of glycerol oxidation in the liquid phase.
The main products of glycerol oxidation are gaseous products, and it suggests that glycerol molecules were adsorbed strongly on the metallic gold species loading on ceria, zirconia, or mixed cerium-zirconium oxides. Additionally, the results of XPS, UV-vis, ATR-FTIR, TPR by H2, and TG-DTA measurements suggest that these materials were characterised of oxygen vacancies, and additionally, sulfur species as like sulfonic groups could promote the adsorption of glycerol molecules during the oxidation process.

4. Conclusions

The chemical adsorption of hydrogen sulfide on the surface of ceria, zirconia, or the mixed cerium-zirconium oxides can be the effective method of modification with sulfur species. The texture properties (specific surface area and average pore volume) and the chemical composition had influence on the effective adsorption and the incorporation of sulfur species in the bulk of oxides. The increase of cerium content in the mixed oxides led to the growth of surface area and average pore diameter, and also to the higher sulfur content. It means that the control of molar ratio between cerium and zirconium contents in mixed oxides can be used in the preparation of oxides that are modified with the assumed sulfur content. The chemical composition, the structure, and texture parameters also influenced the loading and the average size of metallic gold particles on the surface of materials. The increase of cerium content led to an increase of average pore diameter and an easier migration of metallic gold particles into the pores of materials, and also to the decrease of the average size of gold particles estimated using the Scherer’s formula. The chemical composition of supports and their modification with sulfur and gold species influenced the catalytic activity in glycerol oxidation at basic conditions.
It was evidenced that the presence of cerium led to the increase of glycerol conversion in its oxidation and selectivity to glyceric acid. The catalysts obtained mainly selectivity to gaseous products. It means that gold catalysts that are modified with sulfur species could be applied in the purification of water from the organic waste, which are difficult to remove in the presence of alkali media, e.g., in the purification of water during the production of paper [79].

Supplementary Materials

The following are available online at www.mdpi.com/2305-7084/1/2/18/s1, Figure S1: TEM images recorded for the supports without (image on the left) and with (image on the right) S species after modification with Au. Support based on: (a) CeO2, (b) CexZryOz(4:1), (c) CexZryOz(2:1), (d) CexZryOz(1:1), (e) CexZryOz(1:2), (f) CexZryOz(1:4), (g) ZrO2. The lines in the images correspond to 50 nm, Figure S2: XP spectra recorded for S 2p species for samples before and after modification with Au, Figure S3: XP spectra recorded for O 1s species for samples before and after modification with Au, Figure S4: XP spectra recorded for Zr 3d species for selected Ce-Zr oxides and zirconia with S before and after modification with Au, Figure S5: XP spectra recorded for Zr 3d species for Ce-Zr oxides, Figure S6: UV-vis spectra of samples before and after their modification of H2S and after Au deposition for the spectral region of metallic gold species, Figure S7: TG-DTA profiles of the oxides modified with sulfur species without gold species, Figure S8: The TPR H2 profiles performed for the catalysts.

Acknowledgments

The author would like to acknowledge the National Science Centre in Cracow in Poland for the financial support of this study (grants No. 2014/13/N/ST5/01282 and 2015/16/T/ST5/00263) and Maria Ziolek (Adam Mickiewicz University in Poznan, the Faculty of Chemistry) for a fruitful discussion and value remarks.

Author Contributions

P. Kaminski conceived, designed and performed all experiments, analysed all data, contributed reagents/materials/analysis tools and wrote the paper.

Conflicts of Interest

The author declares no conflict of interest.

References

  1. Ming, H.; Baker, B.G.; Jasieniak, M. Characterisation of cobalt Fischer–Tropsch catalysts: 2. Rare earth-promoted cobalt-silica gel catalysts prepared by wet impregnation. Appl. Catal. A Gen. 2010, 381, 216–225. [Google Scholar] [CrossRef]
  2. Zeng, S.; Du, Y.; Su, H.; Zhang, Y. Promotion effect of single or mixed rare earths on cobalt-based catalysts for Fischer–Tropsch synthesis. Catal. Commun. 2011, 13, 6–9. [Google Scholar] [CrossRef]
  3. Carter, J.H.; Althahban, S.; Nowicka, E.; Freakley, S.J.; Morgan, D.J.; Shah, P.M.; Golunski, S.; Kiely, C.J.; Hutchings, G.J. Synergy and anti-synergy between palladium and gold in nanoparticles dispersed on a reducible support. ACS Catal. 2016, 6, 6623–6633. [Google Scholar] [CrossRef] [PubMed]
  4. Tao, F.; Ma, Z. Water-gas shift on gold catalysts: Catalysts systems and fundamental studies. Phys. Chem. Chem. Phys. 2013, 37, 15260–15270. [Google Scholar] [CrossRef] [PubMed]
  5. Rousseau, S.; Marie, O.; Bazin, P.; Daturi, M.; Verdier, S.; Harle, V. Investigation of methanol oxidation over Au/catalysts using operando IR spectroscopy: Determination of the active sites, intermediate/spectator species, and reaction mechanism. J. Am. Chem. Soc. 2010, 132, 10832–10841. [Google Scholar] [CrossRef] [PubMed]
  6. Aboukaïs, A.; Skaf, M.; Hany, S.; Cousin, R.; Aouad, S.; Labaki, M.; Abi-Aad, E. A comparative study of Cu, Ag and Au doped CeO2 in the total oxidation of volatile organic compounds (VOCs). Mater. Chem. Phys. 2016, 177, 570–576. [Google Scholar] [CrossRef]
  7. Wang, J.; Cheng, L.; An, W.; Xu, J.; Men, Y. Boosting soot combustion efficiencies over CuO-CeO2 catalysts with a 3DOM structure. Catal. Sci. Technol. 2016, 6, 7342–7350. [Google Scholar] [CrossRef]
  8. Aneggi, E.; de Leitenburg, C.; Dolcetti, G.; Trovarelli, A. Promotional effect of rare earths and transition metals in the combustion of diesel soot over CeO2 and CeO2-ZrO2. Catal. Today 2006, 114, 40–47. [Google Scholar] [CrossRef]
  9. Damyanova, S.; Pawelec, B.; Arishtirova, K.; Martinez Huerta, M.V.; Fierro, J.L.G. The effect of CeO2 on the surface and catalytic properties of Pt/CeO2-ZrO2 catalysts for methane dry reforming. Appl. Catal. B Environ. 2009, 89, 149–159. [Google Scholar] [CrossRef]
  10. Kambolis, A.; Matralis, H.; Trovarelli, A.; Papadopoulou, C. Ni/CeO2-ZrO2 catalysts for the dry reforming of methane. Appl. Catal. A Gen. 2010, 377, 16–26. [Google Scholar] [CrossRef]
  11. Kašpar, J.; Di Monte, R.; Fornasiero, P.; Graziani, M.; Bradshaw, H.; Norman, C. Dependency of the oxygen storage capacity in zirconia-ceria solid solutions upon textural properties. Top. Catal. 2001, 16, 83–87. [Google Scholar] [CrossRef]
  12. Terribile, D.; Trovarelli, A.; de Leitenburg, C.; Primavera, A.; Dolcetti, G. Catalytic combustion of hydrocarbons with Mn and Cu-doped ceria–zirconia solid solutions. Catal. Today 1999, 47, 133–140. [Google Scholar] [CrossRef]
  13. Kaspar, J.; Fornasiero, P.; Balducci, G.; Di Monte, R.; Hickey, N.; Sergo, V. Effect of ZrO2 content on textural and structural properties of CeO2-ZrO2 solid solutions made by citrate complexation route. Inorg. Chim. Acta 2003, 349, 217–226. [Google Scholar] [CrossRef]
  14. Masui, T.; Peng, Y.M.; Machida, K.; Adachi, G. Reduction behavior of CeO2-ZrO2 solid solution prepared from cerium zirconyl oxalate. Chem. Mater. 1998, 10, 4005–4009. [Google Scholar] [CrossRef]
  15. Grau-Crespo, R.; de Leeuw, N.H.; Hamad, S.; Waghmare, U.V. Phase separation and surface segregation in ceria–zirconia solid solutions. Proc. R. Soc. A 2011, 467, 1925–1938. [Google Scholar] [CrossRef]
  16. Laguna, O.H.; Pérez, A.; Centeno, M.A.; Odriozola, J.A. Synergy between gold and oxygen vacancies in gold supported on Zr-doped ceria catalysts for the CO oxidation. Appl. Catal. B Environ. 2015, 176–177, 385–395. [Google Scholar] [CrossRef]
  17. Madier, Y.; Descorme, C.; Le Govic, A.M.; Duprez, D. Oxygen mobility in CeO2 and CexZr(1−x)O2 compounds: Study by CO transient oxidation and O-18/O-16 isotopic exchange. J. Phys. Chem. B 1999, 103, 10999–11006. [Google Scholar] [CrossRef]
  18. Vindigni, F.; Manzoli, M.; Tabakova, T.; Idakiev, V.; Boccuzzi, F.; Chiorino, A. Gold catalysts for low temperature water-gas shift reaction: Effect of ZrO2 addition to CeO2 support. Appl. Catal. B Environ. 2015, 125, 507–515. [Google Scholar] [CrossRef]
  19. Vidal, H.; Kašpar, J.; Pijolat, M.; Colon, G.; Bernal, S.; Cordón, A.; Perrichon, V.; Fally, F. Redox behavior of CeO2–ZrO2 mixed oxides: I. Influence of redox treatments on high surface area catalysts. Appl. Catal. B Environ. 2000, 27, 49–63. [Google Scholar] [CrossRef]
  20. Pojanavaraphan, C.; Luengnaruemitchai, A.; Gulari, E. Catalytic activity of Au-Cu/CeO2-ZrO2 catalysts in steam reforming of methanol. Appl. Catal. A Gen. 2013, 456, 135–143. [Google Scholar] [CrossRef]
  21. Olmos, C.M.; Chinchilla, L.E.; Delgado, J.J.; Hungría, A.B.; Blanco, G.; Calvino, J.J.; Chen, X. CO oxidation over bimetallic Au-Pd supported on ceria-zirconia catalysts: Effects of oxidation temperature and Au:Pd molar ratio. Catal. Lett. 2016, 146, 144–156. [Google Scholar] [CrossRef]
  22. Zhang, X.; Wang, T.; Ma, L.; Zhang, Q.; Hyang, X.; Yu, Y. Production of cyclohexane from lignin degradation compounds over Ni/ZrO2-SiO2 catalysts. Appl. Energy 2013, 112, 533–538. [Google Scholar] [CrossRef]
  23. Zhang, X.; Zhang, Q.; Chen, L.; Xu, Y.; Wang, T.; Ma, L. Effect of calcination temperature of Ni/SiO2-ZrO2 catalyst on its hydrodeoxygenation of guaiacol. Chin. J. Catal. 2014, 35, 302–309. [Google Scholar] [CrossRef]
  24. Bui, V.N.; Laurenti, D.; Delichère, P.; Geantet, C. Hydrodeoxygenation of guaiacol: Part II: Support effect for CoMoS catalysts on HDO activity and selectivity. Appl. Catal. B Environ. 2011, 101, 246–255. [Google Scholar] [CrossRef]
  25. Yakovlev, V.A.; Khromova, S.A.; Sherstyuk, O.V.; Dundich, V.O.; Ermakov, D.Y.; Novopashina, V.M.; Lebedev, M.Y.; Bulavchenko, O.; Parmon, V.N. Development of new catalytic systems for upgraded bio-fuels production from bio-crude-oil and biodiesel. Catal. Today 2009, 144, 362–366. [Google Scholar] [CrossRef]
  26. Morfin, F.; Ait-Chaou, A.; Lomello, M.; Rousset, J.-L. Influence of the partner oxide on the catalytic properties of Au/CexZr1-x highly loaded gold catalysts. J. Catal. 2015, 331, 210–216. [Google Scholar] [CrossRef]
  27. Liu, L.; Yao, Z.; Liu, B.; Dong, L. Correlation of structural characteristics with catalytic performance of CuO/CexZr1−xO2 catalysts for NO reduction by CO. J. Catal. 2010, 275, 45–60. [Google Scholar] [CrossRef]
  28. Baneshi, J.; Haghighi, M.; Jodeiri, N.; Abdollahifar, M.; Ajamein, H. Homogeneous precipitation synthesis of CuO-ZrO2-CeO2-Al2O3 nanocatalyst used in hydrogen production via methanol steam reforming for fuel cell applications. Energy Convers. Manag. 2014, 87, 928–937. [Google Scholar] [CrossRef]
  29. Castellanos, I.; Bazin, P.; Thomas, S.; Marie, O.; Daturi, M. A relevant estimation of the TOF for methanol oxidation over Au/CeO2: A combined SSITKA and FTIR operando contribution. Top. Catal. 2016, 59, 337–346. [Google Scholar] [CrossRef]
  30. Kaminski, P.; Ziolek, M. Surface and catalytic properties of Ce-, Zr-, Au-, Cu-modified SBA-15. J. Catal. 2014, 312, 249–262. [Google Scholar] [CrossRef]
  31. Kaminski, P.; Ziolek, M.; Campo, B.; Daturi, M. FTIR spectroscopic study of CO oxidation on bimetallic catalysts. Catal. Today 2015, 243, 218–227. [Google Scholar] [CrossRef]
  32. Kaminski, P.; Ziolek, M. Mobility of gold, copper and cerium species in Au, Cu/Ce, Zr-oxides and its impact on total oxidation of methanol. Appl. Catal. B Environ. 2016, 187, 328–341. [Google Scholar] [CrossRef]
  33. Kauppi, E.I.; Honkala, K.; Krause, A.O.I.; Kanervo, J.M.; Lefferts, L. ZrO2 acting as a redox catalyst. Top. Catal. 2016, 59, 823–832. [Google Scholar] [CrossRef]
  34. Tagowska, M.; Mazur, M.; Krysinski, P. Covalently and ionically immobilised monomers on the gold surface. Synthetic Met. 2004, 140, 29–35. [Google Scholar] [CrossRef]
  35. Choleva, T.G.; Kappi, F.A.; Tsogas, G.Z.; Vlessidis, A.G.; Giokas, D.L. In-situ suspended aggregate microextraction of gold nanoparticles from water samples and determination by electrothermal atomic absorption spectrometry. Talanta 2016, 151, 91–99. [Google Scholar] [CrossRef] [PubMed]
  36. Contreras, S.; Yalfani, M.S.; Medina, F.; Sueiras, J.E. Effect of support and second metal in catalytic in-situ generation of hydrogen peroxide by Pd-supported catalysts: Application in the removal of organic pollutants by means of the Fenton process. Water Sci. Technol. 2011, 63, 2017–2024. [Google Scholar] [CrossRef] [PubMed]
  37. Milone, C.; Fazio, M.; Pistone, A.; Galvagno, S. Catalytic wet air oxidation of p-coumaric acid on CeO2, platinum and gold supported on CeO2 catalysts. Appl. Catal. B Environ. 2006, 68, 28–37. [Google Scholar] [CrossRef]
  38. Yu, X.; Huo, Y.; Yang, J.; Chang, S.; Ma, Y.; Huang, W. Reduced graphene oxide supported Au nanoparticles as an efficient catalyst for aerobic oxidation of benzyl alcohol. Appl. Surf. Sci. 2013, 280, 450–455. [Google Scholar] [CrossRef]
  39. Ayati, A.; Ahmadpour, A.; Bamoharram, F.F.; Tanhaei, B.; Mänttäri, M.; Sillanpää, M. A review on catalytic applications of Au/TiO2 nanoparticles in the removal of water pollutant. Chemosphere 2014, 107, 163–174. [Google Scholar] [CrossRef] [PubMed]
  40. Andreeva, D.; Petrova, P.; Sobczak, J.W.; Ilieva, L.; Abrashev, M. Gold supported on ceria and ceria–alumina promoted by molybdena for complete benzene oxidation. Appl. Catal. B Environ. 2006, 67, 237–245. [Google Scholar] [CrossRef]
  41. Delannoy, L.; Fajerwerg, K.; Lakshmanan, P.; Potvin, C.; Methivier, C.; Louis, C. Supported gold catalysts for the decomposition of VOC: Total oxidation of propene in low concentration as model reaction. Appl. Catal. B Environ. 2010, 94, 117–124. [Google Scholar] [CrossRef]
  42. Gluhoi, A.C.; Bogdanchikova, N.; Nieuwenhuys, B.E. The effect of different types of additives on the catalytic activity of Au/Al2O3 in propene total oxidation: Transition metal oxides and ceria. J. Catal. 2005, 229, 154–162. [Google Scholar] [CrossRef]
  43. Karakalos, S.; Zugic, B.; Stowers, K.J.; Biener, M.M.; Biener, J.; Friend, C.M.; Madi, R.J. Catalytic production of methyl acrylates by gold-mediated cross coupling of unsaturated aldehydes with methanol. Surf. Sci. 2016, 652, 58–66. [Google Scholar] [CrossRef]
  44. Skrzyńska, E.; Zaid, S.; Girardon, J.-S.; Capron, M.; Dumeignil, F. Catalytic behaviour of four different supported noble metals in the crude glycerol oxidation. Appl. Catal. A Gen. 2015, 499, 89–100. [Google Scholar] [CrossRef]
  45. Solsona, B.; Garcia, T.; Murillo, R.; Mastral, A.M.; Ndifor, E.N.; Hetrick, C.E.; Amiridis, M.D.; Taylor, S.H. Ceria and gold/ceria catalysts for the abatement of polycyclic aromatic hydrocarbons: An in situ DRIFTS study. Top. Catal. 2009, 52, 492–500. [Google Scholar] [CrossRef]
  46. Smolentseva, E.; Simakov, A.; Beloshapkin, S.; Estrada, M.; Vargas, E.; Sobolev, V.; Kenzhin, R.; Fuentes, S. Gold catalysts supported on nanostructured Ce-Al-O mixed oxides prepared by organic sol-gel. Appl. Catal. B Environ. 2012, 115–116, 117–128. [Google Scholar] [CrossRef]
  47. Bergeret, G.; Gallezot, P. Handbook of Heterogeneous Catalysis; Ertl, G., Knozinger, H., Weitkamp, J., Eds.; VCH: Weinheim, Germany, 1997; Volume 2, pp. 439–464. ISBN 9783527610044. [Google Scholar]
  48. Kauppi, E.I.; Rönkkönen, E.H.; Airaksinen, S.M.K.; Rasmussen, S.B.; Bañares, M.A.; Krause, A.O.I. Influence of H2S on ZrO2-based gasification gas clean-up catalysts: MeOH temperature-programmed reaction study. Appl. Catal. B Environ. 2012, 111–112, 605–613. [Google Scholar] [CrossRef]
  49. Kauppi, E.I.; Kanervo, J.M.; Lehtonen, J.; Lefferts, L. Interaction of H2S with ZrO2 and its influence on reactivity of surface oxygen. Appl. Catal. B Environ. 2015, 164, 360–370. [Google Scholar] [CrossRef]
  50. Toops, T.J.; Crocker, M. New sulfur adsorbents derived from layered double hydroxides: II. DRIFTS study of COS and H2S adsorption. Appl. Catal. B Environ. 2008, 82, 199–207. [Google Scholar] [CrossRef]
  51. Ziolek, M.; Kujawa, J.; Saur, O.; Lavalley, J.C. Influence of hydrogen sulfide adsorption on the catalytic properties of metal oxides. J. Mol. Catal. A Gen. 1995, 97, 49–55. [Google Scholar] [CrossRef]
  52. Escamilla-Perea, L.; Nava, R.; Pawelec, B.; Rosmaninho, M.G.; Peza-Ledesma, C.L.; Fierro, J.L.G. SBA-15-supported gold nanoparticles decorated by CeO2: Structural characteristics and CO oxidation activity. Appl. Catal. A Gen. 2010, 381, 42–53. [Google Scholar] [CrossRef]
  53. Laha, S.C.; Mukerjee, P.; Sainkar, S.R.; Kumar, R. Cerium containing MCM-41-type mesoporous materials and their acidic and redox catalytic properties. J. Catal. 2002, 207, 213–223. [Google Scholar] [CrossRef]
  54. Pestryakov, A.N.; Lunin, V.V.; Kharlanov, A.N.; Kochubey, D.I.; Bogdanchikova, N.E.; Stakheev, A.Y. Influence of modifying additives on electronic state of supported gold. J. Mol. Struct. 2002, 642, 129–136. [Google Scholar] [CrossRef]
  55. Pestryakov, A.N.; Lunin, V.V.; Kharlanov, A.N.; Bogdanchikova, N.E.; Tuzovskaya, I.V. Electronic state of gold in supported clusters. Eur. Phys. J. D 2003, 24, 307–309. [Google Scholar] [CrossRef]
  56. Simakov, A.; Bogdanchikova, N.; Tuzovskaya, I.; Smoletseva, E.; Pestryakov, A.; Farias, M.; Avalos, M. Complex Mediums VI: Light and Complexity; McCall, M.W., Dewar, G., Noginov, M.A., Eds.; Society of Photo Optical: Bellingham, WA, USA, 2005; p. 101. ISBN 978-0819459299. [Google Scholar]
  57. Smolentseva, E.; Bogdanchikova, N.; Simakov, A.; Pestryakov, A.; Tuzovskaya, I.; Avalos, M.; Farías, M.H.; Díaz, J.A.; Gurin, V. Influence of copper modifying additive on state of gold in zeolites. Surf. Sci. 2006, 600, 4256–4259. [Google Scholar] [CrossRef]
  58. Smolentseva, E.; Bogdanchikova, N.; Simakov, A.; Pestryakov, A.; Avalos, M.; Farias, M.H.; Tompos, A.; Gurin, V. Catalytic activity of gold nanoparticles incorporated into modified zeolites. J. Nanosci. Nanotechnol. 2007, 7, 1882–1886. [Google Scholar] [CrossRef] [PubMed]
  59. Tuzovskaya, I.V.; Simakov, A.V.; Pestryakov, A.N.; Bogdanchikova, N.E.; Gurin, V.V.; Farías, M.H.; Tiznado, H.J.; Avalos, M. Co-existence of various active gold species in Au-mordenite catalyst for CO oxidation. Catal. Commun. 2007, 8, 977–980. [Google Scholar] [CrossRef]
  60. Feldheim, D.L.; Foss, C.A. Metal Nanoparticles: Synthesis, Characterisation and Applications; Dekker, B.M., Ed.; CRC Press: Boca Raton, FL, USA, 2002; ISBN 9780824706043. [Google Scholar]
  61. Pestryakov, A.; Tuzovskaya, I.; Smolentseva, E.; Bogdanchikova, N.; Jentoft, F.; Knop-Gericke, A. Formation of gold nanoparticles in zeolites. Int. J. Mod. Phys. B 2005, 19, 2321–2326. [Google Scholar] [CrossRef]
  62. Pestryakov, A.N.; Lunin, V.V.; Bogdanchikova, N.; Temkin, O.N.; Smolentseva, E. Active states of gold in small and big metal particles in CO and methanol selective oxidation. Fuel 2013, 110, 48–53. [Google Scholar] [CrossRef]
  63. Galindo-Hernández, F.; Wang, J.A.; Gómez, R.; Bokhimi, X.; Lartundo, L.; Mantilla, A. Structural modifications in Au/Al2O3-CeO2 mixed oxides as a function of Ce4+ content and its effects in the mineralization of the herbicide diuron. J. Photochem. Photobiol. A Chem. 2012, 243, 23–32. [Google Scholar] [CrossRef]
  64. Quan, B.; Yu, S.-H.; Chung, D.Y.; Jin, A.; Park, J.H.; Sung, Y.-E.; Piao, Y. Single source precursor-based solvothermal synthesis of heteroatom-doped graphene and its energy storage and conversion applications. Sci. Rep. 2004, 4, 5639. [Google Scholar] [CrossRef] [PubMed]
  65. Gracia-Espino, E.; Hu, G.; Shchukarev, A.; Wågberg, T. Understanding the interface of six-shell cuboctahedral and icosahedral palladium clusters on reduced graphene oxide: Experimental and theoretical study. J. Am. Chem. Soc. 2014, 136, 6626–6633. [Google Scholar] [CrossRef] [PubMed]
  66. Shen, J.G.C.; Kalantar, T.H.; Herman, R.G.; Roberts, J.E.; Klier, K. Synthesis and characterisation of [NaO3SOCH2CH2OSO3Na] and its anchored form: Surface-grafted acid groups on zirconium hydroxide. Chem. Mater. 2001, 13, 4479–4485. [Google Scholar] [CrossRef]
  67. Shen, J.G.C.; Herman, R.G.; Klier, K. Sulfonic acid-functionalized mesoporous silica: Synthesis, characterisation, and catalytic reaction of alcohol coupling to ethers. J. Phys. Chem. B 2002, 106, 9975–9978. [Google Scholar] [CrossRef]
  68. Petit, C.; Seredych, M.; Bandosz, T.J. Revisiting the chemistry of graphite oxides and its effect on ammonia adsorption. J. Mater. Chem. 2009, 19, 9176–9185. [Google Scholar] [CrossRef]
  69. Kaminski, P.; Ziolek, M.; van Bokhoven, J.A. Mesoporous cerium–zirconium oxides modified with gold and copper – synthesis, characterisation and performance in selective oxidation of glycerol. RSC Adv. 2017, 7, 7801–7819. [Google Scholar] [CrossRef]
  70. Behr, A.; Eilting, J.; Irawadi, K.; Leschinski, J.; Linder, F. Improved utilisation of renewable resources: New important derivatives of glycerol. Green Chem. 2008, 10, 13–30. [Google Scholar] [CrossRef]
  71. Ketchie, W.C.; Fang, Y.-L.; Wong, M.S.; Murayama, M.; Davis, R.J. Influence of gold particle size on the aqueous-phase oxidation of carbon monoxide and glycerol. J. Catal. 2007, 250, 94–101. [Google Scholar] [CrossRef]
  72. Rodriguez, A.A.; Williams, C.T.; Monnier, J.R. Selective liquid-phase oxidation of glycerol over Au-Pd/C bimetallic catalysts prepared by electroless deposition. Appl. Catal. A Gen. 2014, 475, 161–168. [Google Scholar] [CrossRef]
  73. Zheng, Y.; Chen, X.; Shen, Y. Commodity chemicals derived from glycerol, an important biorefinery feedstock. Chem. Rev. 2008, 108, 5253–5277. [Google Scholar] [CrossRef] [PubMed]
  74. Demirel, S.; Kern, P.; Lucas, M.; Claus, P. Oxidation of mono-and polyalcohols with gold: Comparison of carbon and ceria supported catalysts. Catal. Today 2007, 122, 292–300. [Google Scholar] [CrossRef]
  75. Ketchie, W.C.; Murayama, M.; Davis, R.J. Promotional effect of hydroxyl on the aqueous phase oxidation of carbon monoxide and glycerol over supported Au catalysts. Top. Catal. 2007, 44, 307–317. [Google Scholar] [CrossRef]
  76. Kim, Y.S.; Wang, F.; Hickner, M.; Zawodzinski, T.A.; McGrath, J.E. Fabrication and characterisation of heteropolyacid (H3PW12O40)/directly polymerized sulphonated poly(arylene ether sulphone) copolymer composite membranes for higher temperature fuel cell applications. J. Membr. Sci. 2003, 212, 263–282. [Google Scholar] [CrossRef]
  77. Ketchie, W.C.; Murayama, M.; Davis, R.J. Selective oxidation of glycerol over carbon-supported AuPd catalysts. J. Catal. 2007, 250, 264–273. [Google Scholar] [CrossRef]
  78. Villa, A.; Veith, G.M.; Prati, L. Selective oxidation of glycerol under acidic conditions using gold catalysts. Angew. Chem. Int. Ed. 2010, 49, 4499–4502. [Google Scholar] [CrossRef] [PubMed]
  79. Font, X.; Caminal, G.; Gabarrell, X.; Romero, S.; Vicent, M.T. Black liquor detoxification by laccase of Trametes versicolor pellets. J. Chem. Technol. Biotechnol. 2003, 78, 548–554. [Google Scholar] [CrossRef]
Figure 1. X-ray Diffraction (XRD) patterns of selected samples before and after H2S adsorption and after Au deposition, where ■—means the crystal phase of metallic gold particles, ●—cubic crystal phase of ceria (pattern for CeO2), □—tetragonal crystal phase of zirconia (pattern for ZrO2(T)) and ○—monoclinic crystal phase of zirconia (pattern for ZrO2(M)).
Chemengineering 01 00018 g001
Figure 2. XP spectra recorded for Ce three-dimensional (3d) species for selected oxides before (support) and after modification with sulfur (H2S) and gold species (Au). The spectra were recorded for the catalysts based on: (A) CexZryOz(4:1); and, (B) CexZryOz(1:1). The XP spectra of Ce3+ and Ce4+ species were marked using green and red line, respectively.
Chemengineering 01 00018 g002
Figure 3. XP spectra recorded for O 1s species for selected Ce-Zr oxides before and after modification with Au.
Chemengineering 01 00018 g003
Figure 4. XP spectra recorded for Au 4f species for selected Ce-Zr oxides modified with S and Au.
Chemengineering 01 00018 g004
Figure 5. The correlation between sulfur content (as μmol m−2 of catalyst surface or mol m−3 of catalyst volume) and the contents of metals in oxides (as % mol of ceria in Ce-Zr oxides estimated using ICP-OES, when was assumed that 100% of Ce was in the form of CeO2) for selected surface parameters ((A,B) for surface area, (C,D) for total pore volume, (E,F) for average pore size). The size of points is correlated to the values of the surface parameters. Dark points are described to the catalysts modified with sulfur and light points are due to the catalyst with sulfur and gold species and the ratios mean the nominal molar ratio CeO2:ZrO2 of supports, Ce, Zr stand for CeO2, ZrO2, respectively.
Chemengineering 01 00018 g005
Figure 6. Ultraviolet-Visible Spectroscopy (UV-vis) spectra of selected materials ((A) ceria CeO2; (B) ceria-zirconia CexZryOz(1:1); (C) zirconia ZrO2) before (blue line) and after (green line) modification of H2S and after Au deposition (red line).
Chemengineering 01 00018 g006
Figure 7. Attenuated Total Reflectance-Fourier Transform Infrared (ATR-FTIR) spectra recorded for oxides: (A) before and (B) after adsorption of H2S on the surface; (C) after adsorption of H2S on the surface and the heating the supports with sulfur at 373 K for 24 h in air; (D) with sulfur species after their modification with gold species. The ATR-FTIR spectra were recorded for samples based on the supports: (a) CeO2, (b) CexZryOz(4:1), (c) CexZryOz(2:1), (d) CexZryOz(1:1), (e) CexZryOz(1:2), (f) CexZryOz(1:4), and (g) ZrO2.
Chemengineering 01 00018 g007
Table 1. The comparison between real and nominal molar ratio CeO2:ZrO2 in prepared oxides. The results were estimated using Inductively Coupled Plasma Optical Emission Spectrometry (ICP-OES). It was assumed that 100% of Ce species are in the form of CeO2.
Support before ModificationNominal Molar Ratio CeO2:ZrO2Real Molar Ratio CeO2:ZrO2
Pure Oxideafter Modification with Auafter Modification with Safter Modification with S and Au
CexZryOz(4:1)4.007.064.974.804.12
CexZryOz(2:1)2.003.332.482.312.20
CexZryOz(1:1)1.001.861.221.181.39
CexZryOz(1:2)0.500.700.560.940.62
CexZryOz(1:4)0.250.340.330.440.39
Table 2. The content of gold and size of its particles.
CatalystGold Concentration, wt %Crystal Size of Au Particles, nm
Nominalfrom ICP-OESfrom XPSfrom XRD afrom TEM b
Au/CeOzS(2−z)3.00.43.116.25.0
Au/CexZryOzS(2−z)(4:1)3.00.66.813.85.1
Au/CexZryOzS(2−z)(2:1)3.00.53.416.35.0
Au/CexZryOzS(2−z)(1:1)3.00.54.928.15.3
Au/CexZryOzS(2−z)(1:2)3.00.313.219.35.0
Au/CexZryOzS(2−z)(1:4)3.00.212.629.14.7
Au/ZrOzS(2−z)3.01.020.431.34.8
a from the Scherer’s formula, calculated for the gold particles >5 nm. b the TEM images can give the information about all small crystals loaded on the surface of materials.
Table 3. The influence of texture parameters on sulfur species content in samples.
Catalystμmol S/g of Catalystμmol S/m2 of Catalyst Surfacemol S/m3 of Catalyst Volume
CeOzS(2−z)119721.074.8
CexZryOzS(2−z)(4:1)112716.356.3
CexZryOzS(2−z)(2:1)104617.758.1
CexZryOzS(2−z)(1:1)97318.0121.6
CexZryOzS(2−z)(1:2)27113.5135.3
CexZryOzS(2−z)(1:4)32013.3106.7
ZrOzS(2−z)4099.568.2
Au/CeOzS(2−z)342 (29%) 13.9 (19%) 120.1 (27%) 1
Au/CexZryOzS(2−z)(4:1)331 (29%) 13.7 (23%) 116.6 (29%) 1
Au/CexZryOzS(2−z)(2:1)391 (37%) 15.4 (30%) 123.0 (40%) 1
Au/CexZryOzS(2−z)(1:1)489 (50%) 18.0 (44%) 161.1 (50%) 1
Au/CexZryOzS(2−z)(1:2)181 (67%) 110.1 (74%) 145.3 (33%) 1
Au/CexZryOzS(2−z)(1:4)139 (43%) 16.0 (45%) 146.3 (43%) 1
Au/ZrOzS(2−z)199 (49%) 14.9 (51%) 133.2 (49%) 1
ZrO2 modified with H2S 265 (32.5)2.7 (13.5)no data
1 in brackets are % of sulfur which was still after modification with gold. 2 comparison for sample presented in [48], but the adsorption of hydrogen sulfide was carried out for 0.1 g of pure zirconia (which a specific surface area was 24 m2 g−1) for 1 h at 673 K and in the bracket was put a hypothetical amount after 5 h.
Table 4. Stoichiometric formulas of oxides estimated using X-ray Photoelectron Spectroscopy (XPS) measurements and texture parameters.
CatalystStoichiometric FormulaSurface Area, m2 g−1 3Total Pore Volume, cm3 g−1 4Average Pore Diameter, nm 4
Nominal 1from XPS Analysis 2
CeO2Ce1.00O2.00no data1040.188.2
CeOzS(2−z)Ce1.00OzS(2−z)Ce1.00O1.53S0.25(1.78)570.1610.2
Au/CeOzS(2−z)Au/Ce1.00OzS(2−z)Au0.03/Ce1.00O1.01S0.09(1.10)870.178.6
CexZryOz(4:1)Ce0.80Zr0.20O2.00Ce0.80Zr0.04O0.58980.229.5
CexZryOzS(2−z)(4:1)Ce0.80Zr0.20OzS(2−z)Ce0.80Zr0.06O0.91S0.12(1.03)690.2011.0
Au/CexZryOzS(2−z)(4:1)Au/Ce0.80Zr0.20OzS(2−z)Au0.05/Ce0.80Zr0.06O1.12S0.13(1.25)900.2010.0
CexZryOz(2:1)Ce0.67Zr0.33O2.00Ce0.67Zr0.34O0.71870.189.8
CexZryOzS(2−z)(2:1)Ce0.67Zr0.33OzS(2−z) Ce0.67Zr0.41O1.03S0.14(1.17) 590.1811.5
Au/CexZryOzS(2−z)(2:1)Au/Ce0.67Zr0.33OzS(2−z) Au0.03/Ce0.67Zr0.43O0.79S0.14(0.93)730.1710.4
CexZryOz(1:1)Ce0.50Zr0.50O2.00Ce0.50Zr0.54O1.24730.085.7
CexZryOzS(2−z)(1:1)Ce0.50Zr0.50OzS(2−z) Ce0.50Zr0.46O1.05S0.12(1.17) 540.086.3
Au/CexZryOzS(2−z)(1:1)Au/Ce0.50Zr0.50OzS(2−z) Au0.04/Ce0.50Zr0.44O1.05S0.10(1.15)610.086.1
CexZryOz(1:2)Ce0.33Zr0.67O2.00Ce0.33Zr0.21O0.45260.034.8
CexZryOzS(2−z)(1:2)Ce0.33Zr0.67OzS(2−z) Ce0.33Zr0.31O0.65S0.04(0.69)200.025.2
Au/CexZryOzS(2−z)(1:2)Au/Ce0.33Zr0.67OzS(2−z) Au0.04/Ce0.33Zr0.17O0.71S0.04(0.75)180.049.0
CexZryOz(1:4)Ce0.20Zr0.80O2.00Ce0.20Zr0.48O0.78270.034.9
CexZryOxS(2−z)(1:4)Ce0.20Zr0.80OzS(2−z) Ce0.20Zr0.76O1.19S0.03(1.22)240.034.9
Au/CexZryOzS(2−z)(1:4)Au/Ce0.20Zr0.80OzS(2−z) Au0.08/Ce0.20Zr0.71O1.06S0.05(1.11)230.035.5
ZrO2Zr1.00O2.00no data460.065.9
ZrOzS(2−z)Zr1.00OzS(2−z)Zr1.00O1.35S0.05(1.40)430.065.6
Au/ZrOzS(2−z)Au/Zr1.00OzS(2−z) Au0.16/Zr1.00O1.46S0.16(1.62)410.066.1
1 z—stoichiometric coefficient can be 0 < z < 2. 2 in brackets is the sum of the values of stoichiometric coefficients for oxygen and sulfur. 3 calculating by BET method. 4 calculating with BJH adsorption.
Table 5. Distribution of species from XPS study and the binding energy (BE) and the form of species on the external surface of samples.
CatalystDistribution of Species, %Binding Energy (BE) and Form of Species, eV
Ce SpeciesAu SpeciesS SpeciesAu SpeciesS SpeciesZr Species
Ce3+Ce4+(Au0)δAu0–SH–SO3H(Au0)δAu0–SH–SO3HZr4+ (3d5/2/3d3/2)
CeO2n.d. 1n.d. 1---------/-
CeOzS(2−z)4852--793---168.8-/-
Au/CeOzS(2−z)27731288217982.283.4166.0169.4-/-
Au/CeOzS(2−z) 231691783267482.483.4166.1168.2-/-
CexZryOz(4:1)2971--------181.9/184.2
CexZryOzS(2−z)(4:1)2674--1189--166.9169.0182.4/184.9
Au/CexZryOzS(2−z)(4:1)3664397297182.484.2165.4169.6182.6/184.8
Au/CexZryOzS(2−z)(4:1) 237630100694-84.3165.5168.7182.6/184.9
CexZryOz(2:1)2278--------181.9/184.2
CexZryOzS(2−z)(2:1)3367--1189--165.0168.6182.0/184.4
Au/CexZryOzS(2−z)(2:1)2575793247682.383.5165.0168.2181.9/184.4
Au/CexZryOzS(2−z)(2:1) 2326879389282.583.5164.9168.2181.9/194.4
CexZryOz(1:1)3169--------181.9/184.3
CexZryOzS(2−z)(1:1)3466--2080--163.4168.3181.9/184.3
Au/CexZryOzS(2−z)(1:1)3268496287282.383.8162.7168.9182.3/184.6
Au/CexZryOzS(2−z)(1:1) 2326801001585-83.7165.2168.8182.2/184.6
CexZryOz(1:2)2674--------181.9/184.2
CexZryOzS(2−z)(1:2)3070--2080--166.6168.4181.9/184.3
Au/CexZryOzS(2−z)(1:2)38621090208082.983.8166.0168.4182.1/184.5
Au/CexZryOzS(2−z)(1:2) 2366401001387-83.7166.2168.4182.1/184.5
CexZryOz(1:4)3169--------182.6/185.0
CexZryOzS(2−z)(1:4)3664--1882--165.7167.3181.7/184.1
Au/CexZryOzS(2−z)(1:4)3763892198182.483.9167.0169.2182.4/184.7
Au/CexZryOzS(2−z)(1:4) 23268168479382.983.9167.1168.9182.4/184.8
ZrO2----------n.d. 1/n.d. 1
ZrOzS(2−z)----3070--162.4167.2182.0/184.4
Au/ZrOzS(2−z)--1486514982.183.9163.4169.4182.3/185.0
Au/ZrOxS(2−z) 2--991396182.384.0162.6169.6182.5/185.0
1 n.d.—no data. 2 after glycerol oxidation at 333 K for 5 h at basic conditions.
Table 6. The content of chemical elements on external surface before and after the modification of supports with gold species.
SupportElement Content, at % 1
AuSCeZrO
beforeafterbeforeafterbeforeafterbeforeafterbeforeafter
CeOzS(2z)-1.28.94.435.947.0--55.147.3
CexZryOzS(2z)(4:1)-2.46.46.142.337.03.22.748.151.7
CexZryOzS(2z)(2:1)-1.36.36.829.632.418.420.945.638.6
CexZryOzS(2z)(1:1)-1.65.54.523.523.721.420.649.549.6
CexZryOzS(2z)(1:2)-4.43.23.125.025.423.312.748.654.4
CexZryOzS(2z)(1:4)-3.91.62.29.29.534.833.954.550.5
ZrOzS(2z)-5.62.15.9--41.736.056.252.5
1 the element content (at %) calculated estimated using XPS analysis.
Table 7. The results of glycerol oxidation over gold catalysts at basic conditions at 333 K for 5 h. The oxides modified with sulfur were not active.
CatalystGLY 1 Conversion, %Selectivity, %Yield, % 2TOF, h−1 3
GLA 1OA 1TA 1Gaseous Products 1GLA 1OA 1TA 1
Au/CeOzS(2−z)672<0.5-98955-310
Au/CexZryOzS(2z)(4:1)722<0.5-98946-212
Au/CexZryOzS(2z)(2:1)691<0.5-99928-251
Au/CexZryOzS(2z)(1:1)67<0.5<0.5-1005446-244
Au/CexZryOzS(2z)(1:2)67<0.5<0.5-1004258-458
Au/CexZryOzS(2z)(1:4)70<0.5--100100--544
Au/ZrOzS(2−z)69--<0.5100--100124
1 GLY—glycerol, GLA—glyceric acid, OA—oxalic acid, TA—tartronic acid, gaseous products—mainly CO2. 2 yield was calculated only for liquid products of glycerol oxidation which were in the solution after reaction. 3 TOF was calculated as the number of glycerol moles reacted on one mole of gold per one hour (after 5 h of the reaction).