1. Introduction
Scientific evidence suggests that the world’s atmosphere has experienced an increase in temperatures [
1,
2,
3] and because Chile is in a climate transition zone [
4], the phenomenon of climate change could have a very high impact in this South American country, particularly for the availability and use of surface water resources. Thus, the influence of this phenomenon on peak-flow behaviors could increase, as this important hydrologic variable is extremely sensitive to climatic behaviors [
5,
6].
Hydrological variables such as rainfall and runoff are impacted by climate change, raising concerns about their behavior in future scenarios, because they are directly influenced by broad temporal and spatial phenomena [
7,
8]. In this sense, Carrasco et al. [
9,
10], for example, analyzed the tendencies of the 0 °C isotherm in central Chile, a climatic variable that directly affects the snow–glacial hydrologic behavior, concluding that it has increased its elevation over time, i.e., there has been an increase in temperature [
9,
11,
12] and, consequently, the volume that was previously precipitated as snow is now most likely transformed directly into surface runoff.
Floods are natural processes, with no periodicity and caused by a significant and sudden increase in flowrates in a fluvial system, which involves a rise of water levels that can overflow river banks and then progressively occupy the land above it, flowing into the surrounding land [
13,
14,
15,
16,
17]. According to Paoli et al. [
18], floods that occur in hydrological terms have a different degree of risk and a different probability of exceedance, depending on peak-flow rates, volumes, or durations considered.
Countless studies around the world focusing on hydrological tendencies have been carried out in recent decades, many of which confirming clear behavioral changes (e.g., [
19,
20,
21,
22]). In Chile, however, this important topic is not well understood. Among the most relevant conclusions are those by Novoa et al. [
19,
20], who analyzed streamflow tendencies in the Coquimbo region (northern Chile), finding mostly positive tendencies, most likely due to glacier melting processes. Similarly, Pellicciotti et al. [
21] analyzed mean monthly streamflow rates for the Aconcagua river (Valparaíso region, Central Chile), finding negative tendencies in surface water production, a conclusion supported by Givovich [
23] and Martínez et al. [
22], who verified similar behaviors for mean annual and monthly streamflow rates, respectively. Souvignet et al. [
24], on the other hand, studied annual and seasonal temperature, precipitation, and flow tendencies in the Coquimbo region, concluding that only two out of the nine watersheds involved had a negative and significant annual tendency. Seasonally speaking, winter had more significant tendencies (in three watersheds). Nevertheless, the authors considered a time period ending in 2006, which motivates the need to revisit these studies using recent hydrological data, particularly in the context of a climate change scenario and given the current megadrought that is straining Chile’s freshwater resources to the breaking point.
Therefore, it is crucial to determine if streamflows (min, mean, and max) of watersheds in central Chile have had significant variation in recent decades, which may potentially be driven by climate change. In this context, this study intends to evaluate streamflow trends for different temporal periods and in different watersheds in central Chile.
2. Materials and Methods
2.1. Study Area
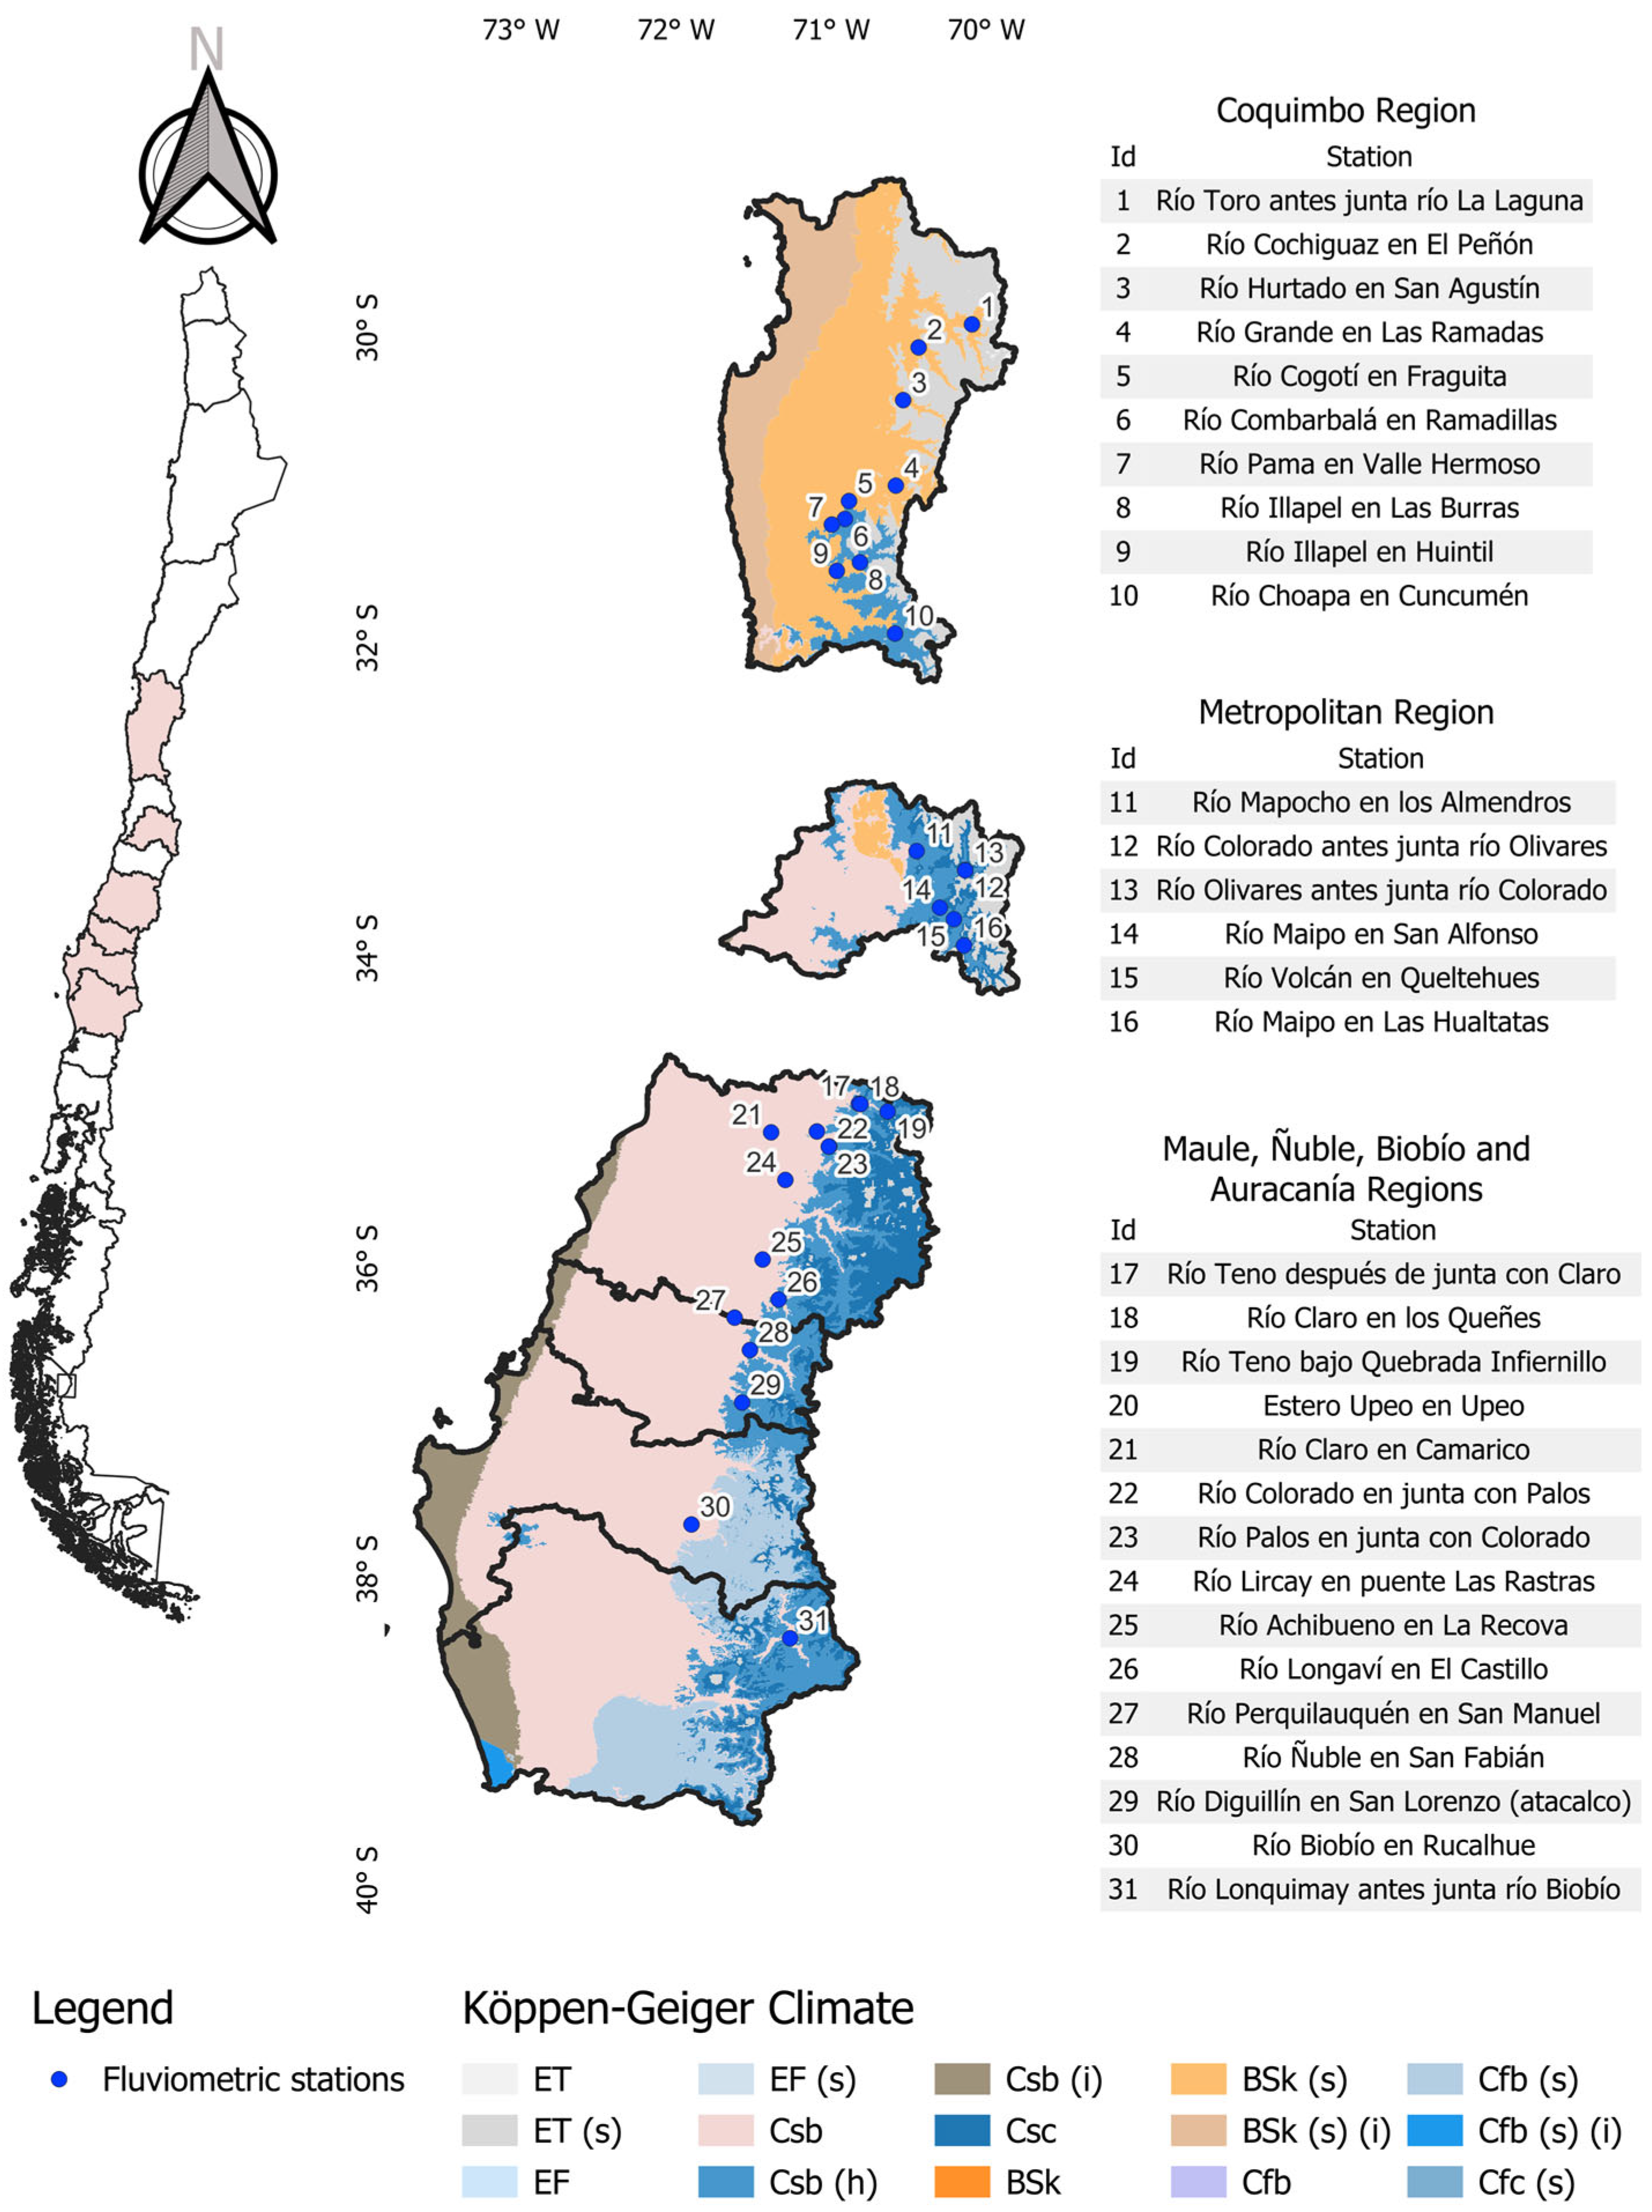
The study area comprised 31 watersheds (or fluviometric stations) distributed within central Chile, all distributed in the Coquimbo, Metropolitana, Maule, Ñuble, Biobío, and Araucanía administrative regions (
Figure 1). In terms of climate, according to the Köppen–Geiger climate classification [
25], the Coquimbo region presents a cold, arid climate between 29°00′ and 30°00′ south latitude, and a warm, arid climate between 30°00′ and 32°00′ south latitude. The remaining regions (Metropolitana, Maule, Ñuble, Biobío, and Araucanía) share a Mediterranean oceanic climate type, characterized by wet winters and long dry summers. However, the Metropolitana region has a semiarid climate type as well, whereas Maule and Biobío have humid and subhumid climates, respectively. As illustrated in
Figure 1, a small portion of the study area is classified as tundra climate. Thus, each region differs from each other in terms of area and climate (
Table 1).
2.2. Dataset
The information used for this study was obtained from the General Water Directorate (DGA) and includes daily mean streamflows and monthly minimum, mean, and maximum streamflow rates. Stations from watersheds without anthropic intervention (such as the upstream presence of reservoirs or irrigation channels) were selected from DGA’s hydrological database. Moreover, the stations represent very diverse drainage areas, ranging from 113 to 7044 km2. Finally, no data completion was carried out where missing data were encountered in the series. Furthermore, the DGA periodically collects, manages, and verifies the quality of the instruments and data.
Table 2 shows the fluviometric stations and the years used in the study, based on the data provided by the DGA, for each station.
Table 2 shows the number of fluviometric stations with historic data, which were divided between the years involved (1984–2021) and the years for which it was extended for a second analysis, with 40 years (1975–2021) and with 46 years (1969–2021), given the available data.
Table 2 shows the total number of stations analyzed for periods between 1984 and 2021, and with a further 9 and 15 years of extension, respectively. By extending the data series 9 more years, the analysis period 1975–2021 was defined; however, the number of stations that could be analyzed was reduced to 20. Similarly, by extending the data series 15 more years, the period 1969–2021 was defined and the number of stations available for analysis was reduced to 18.
Hence, the data series used in this study represented mostly data from recent fluviometric stations, many of which began collecting data in the 1980s, even though there were even newer stations available. All of these stations were considered valid only for the analysis of the 1984–2021 period, with a minimum of 26 years of records. Notwithstanding the above, and due to the length of the data series, they were not considered for the analysis of the two extended periods. For the purposes of this study, stations from 1969 onwards were considered.
2.3. Trend Analysis
The two-tailed nonparametric Mann–Kendall trend analysis [
27,
28] was used to evaluate maximum flow trends over the study periods, considering the different geographical scenarios. This test makes it possible to determine if the series have a negative or positive trend in the monthly and annual flows. The analysis was carried out using the Mann–Kendall python package [
29]. This test checks for a possible null hypothesis of any trend, H
0, that is, the observations x
i are ordered in a random way in time. On the contrary, the alternative hypothesis H
1 indicates that there is a positive or negative tendency. For its calculation, this test first requires the Kendall S statistic and its variance. With both values, a standardized Z statistic is obtained when the sample size is greater than (or equal to) 8, whose sign and value determine the orientation and significance of the tendency, respectively. For the
S statistic, the following expression was used:
where the function
sgn(
xj −
xk) is described as:
where
xj and
xk are consecutive values from the variable under study. Then, the variance
VAR(
S) is described as:
Finally, Z is calculated with both values, with one of the following expressions, depending on
S:
The Mann–Kendall test, with significance levels of α = 0.05 (or 95% confidence intervals), was applied to the maximum flows of 31 basins, considering the 1984–2021 period (31 years), obtaining the trends (Z-values) at monthly and annual levels. Subsequently, an additional study interval (1975–2021) was considered, and a second data addition was made (1969–2021), applying in both cases the Mann–Kendall trend analysis.
Since many Mann–Kendall tests were conducted simultaneously, it was necessary to control the false positive rate due to the risk of inflated rates of Type I errors. The FDR (false discovery rate) procedure [
30,
31] was used in this study.
The Theil–Sen test or Sen’s slope estimator [
32] was used to determine the magnitude of the trends. Like the Mann–Kendall test, this is a nonparametric method that is particularly effective for handling outliers, and there is no requirement to assume the data follow a normal distribution. The Theil–Sen test can be calculated using the following median function:
where
yj and
yi represent the flow of the
jth and
ith years, respectively. When
> 0, the time series shows an increasing trend, otherwise, a decreasing trend.
Additionally, the trends of the quantiles (e.g., quartile, quintile, decile, percentile) of the daily mean flows were evaluated using the Mann–Kendall test for the three time periods considered in this study. Using this approach helps to visualize trends in the lower part of the distribution (first decile), in the center (fifth decile), and in the upper part (tenth decile) [
33]. This technique is known as the quantile–Kendall procedure or visualization [
34,
35]. This method is a statistical procedure based on a quantile regression analysis. The traditional regression analysis is expanded upon by studying the relationships between the variables at different quantiles of the distribution, giving a more comprehensive understanding of the data trends, beyond the minimum, mean, and maximum values. The first step is to rank or segment the daily flow series into quantiles and estimate the direction and magnitude of the slopes of each of these quantiles using the Mann–Kendall test and Sen’s slope estimator, respectively. By using the quantile–Kendall procedure, it is possible to analyze nonlinear trends and mitigate the potential effects of any skew due to extreme values or outliers that might disproportionately influence the trend analysis. This contributes to a more complete understanding of the underlying phenomena and offers valuable insights for understanding complex interactions in the dataset. This method was written in the Python programming language, by extending an existing freely available Mann–Kendall software library [
29].
Finally, the characteristics of the flows were evaluated as a function of the Pacific decadal oscillation (PDO); for this purpose, the data series were decomposed into their monthly principal components and correlated with the PDO values. This was performed for both arid–semiarid zone basins and humid–subhumid zone basins.
4. Discussion
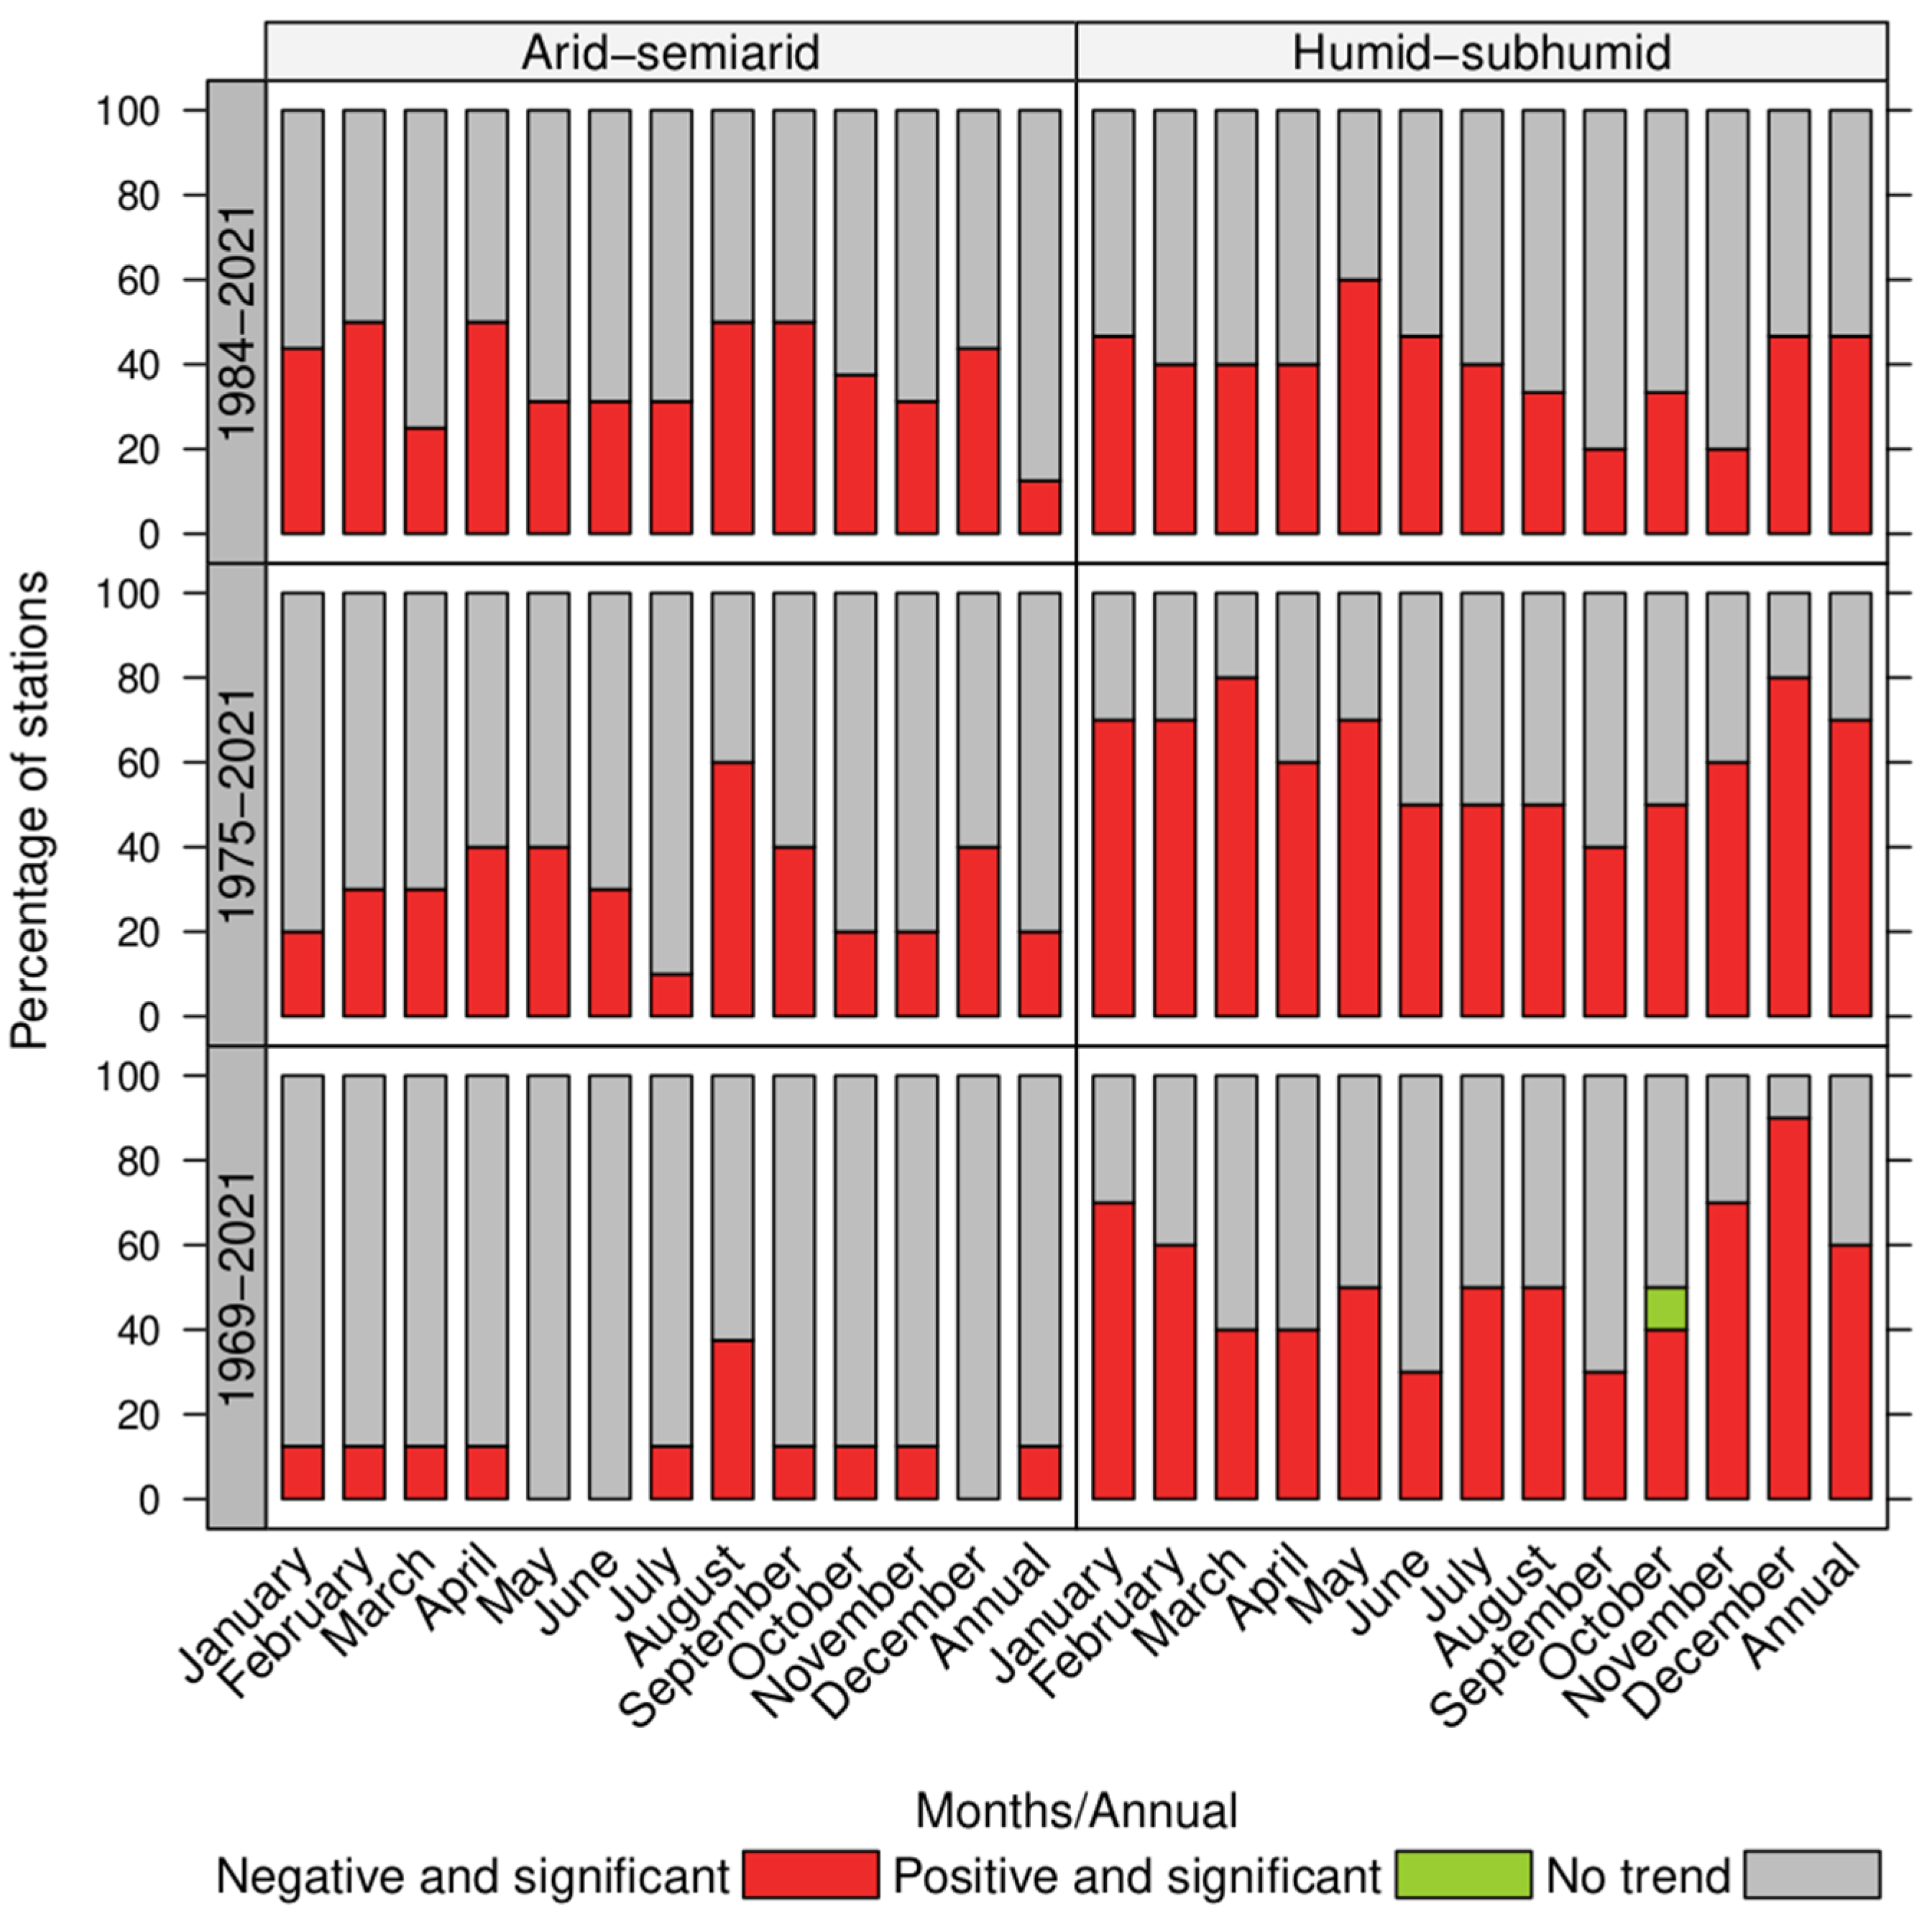
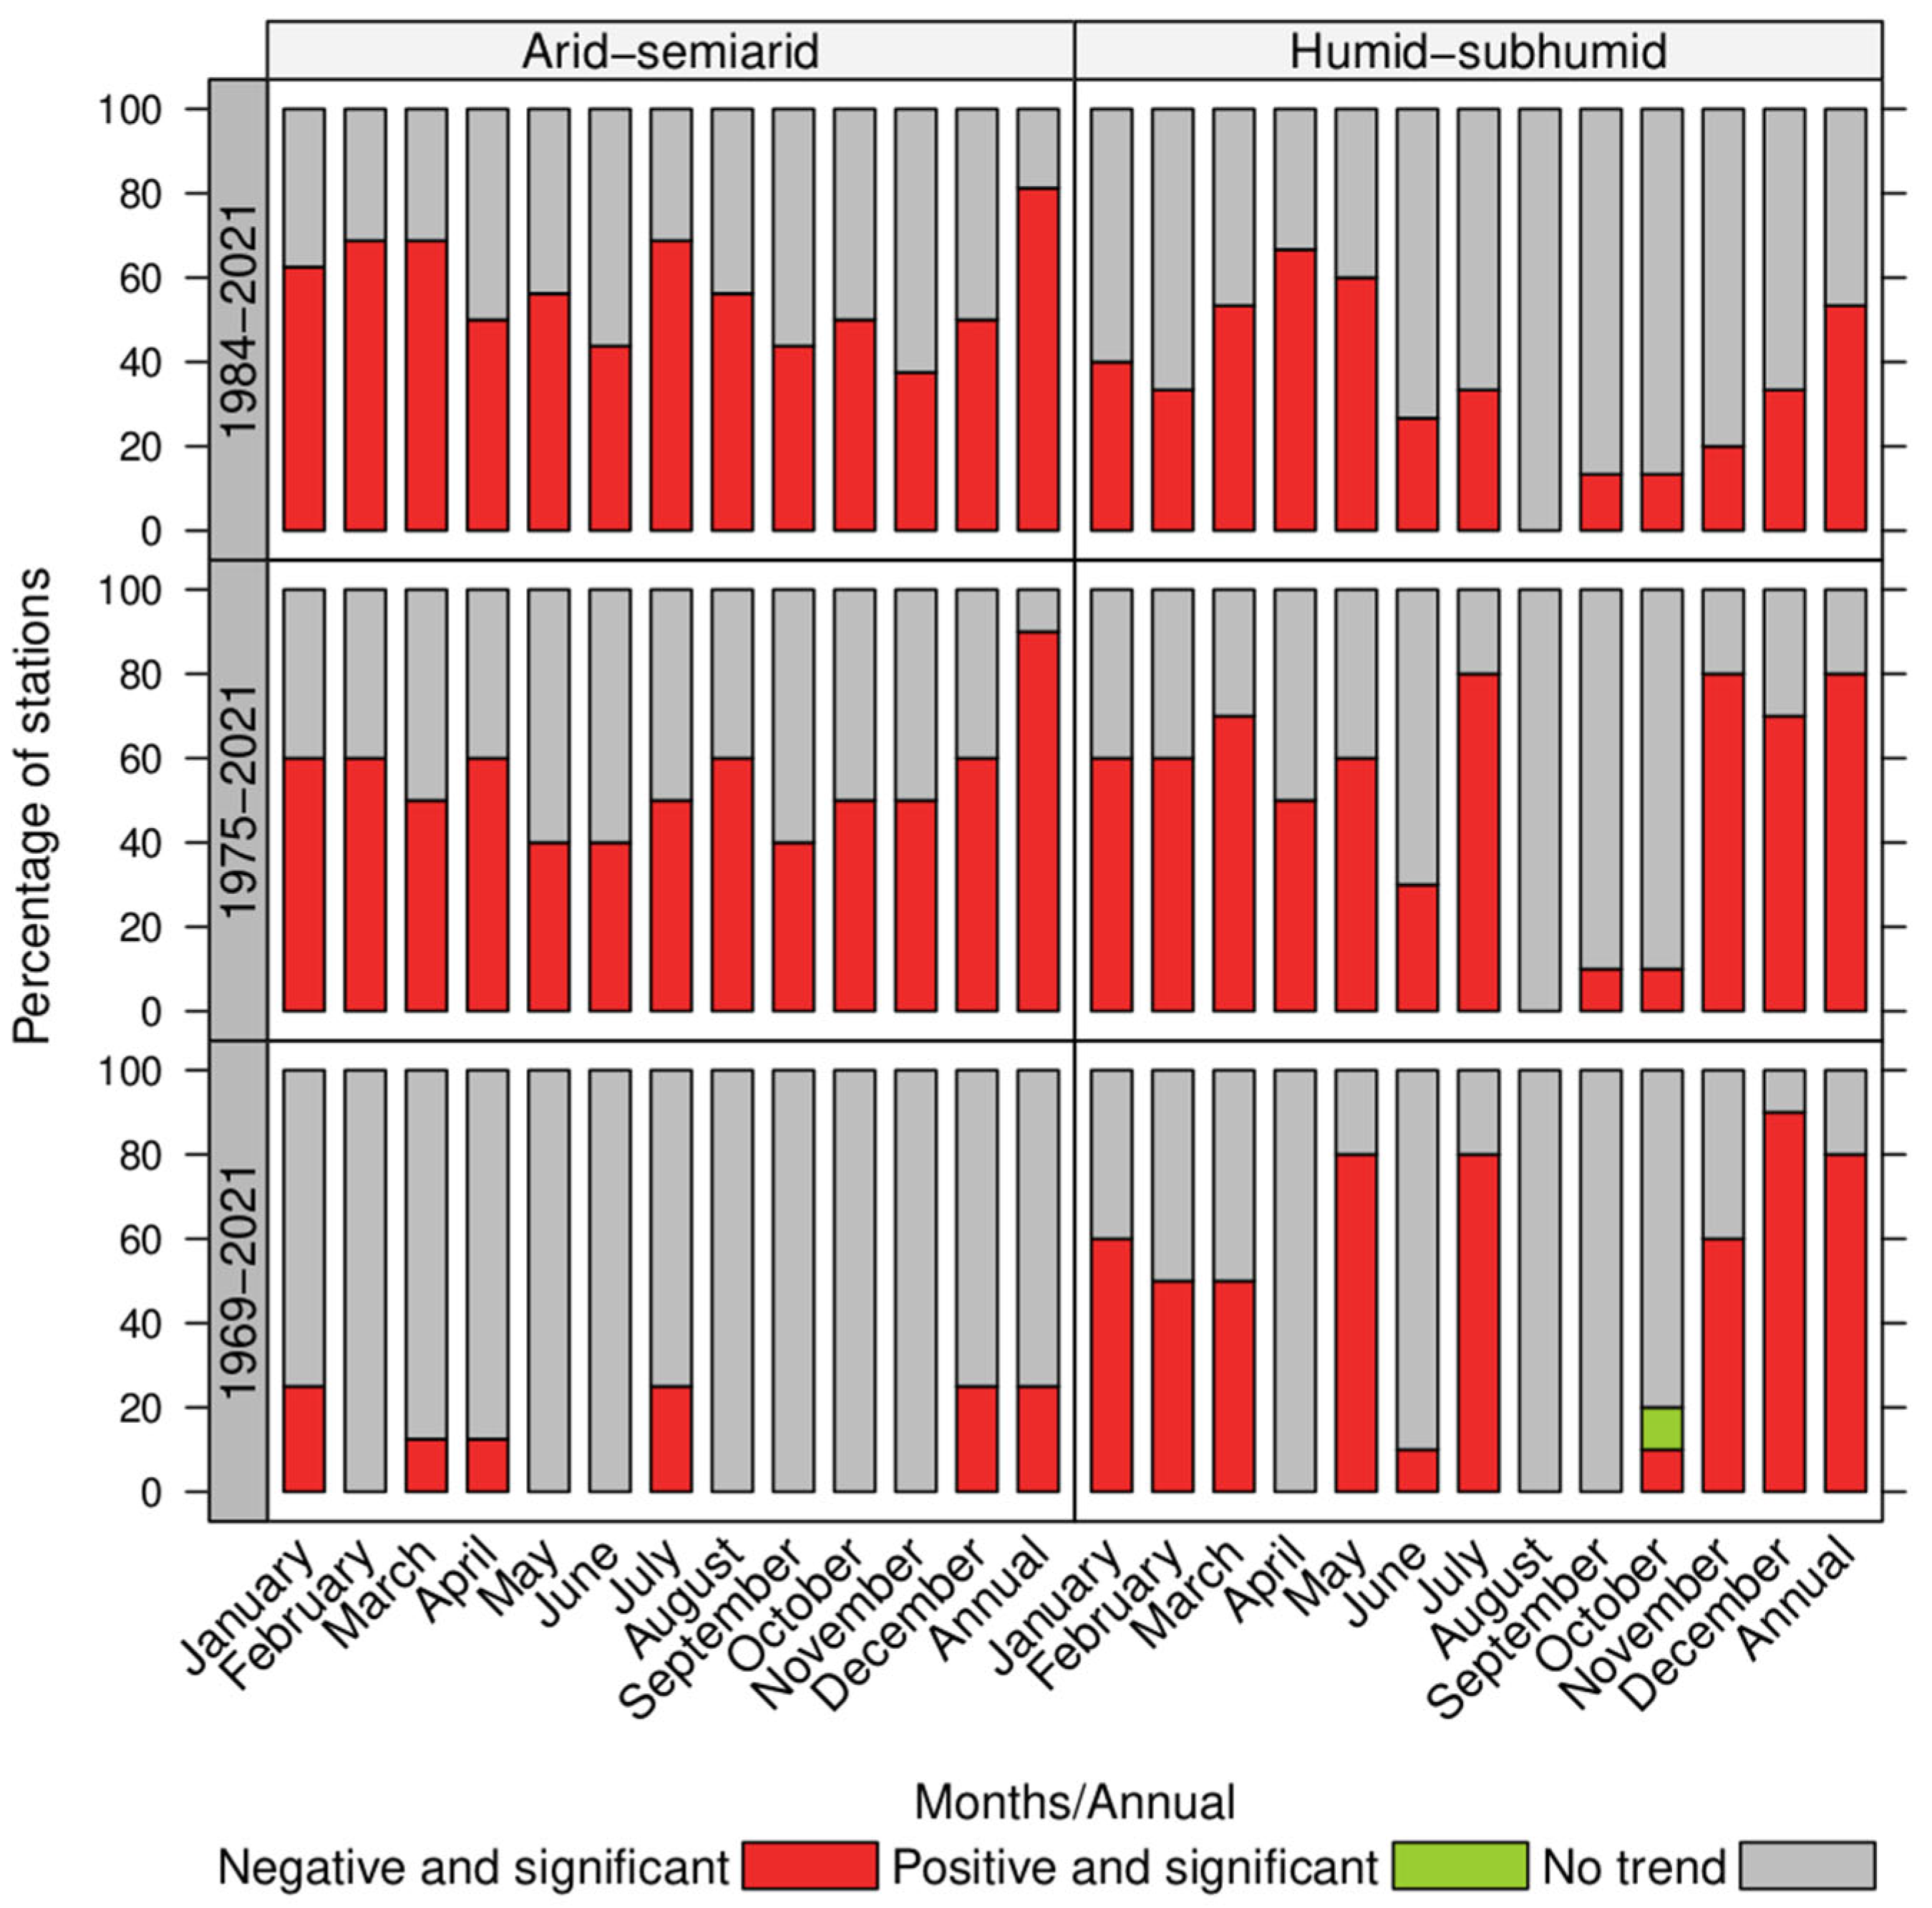
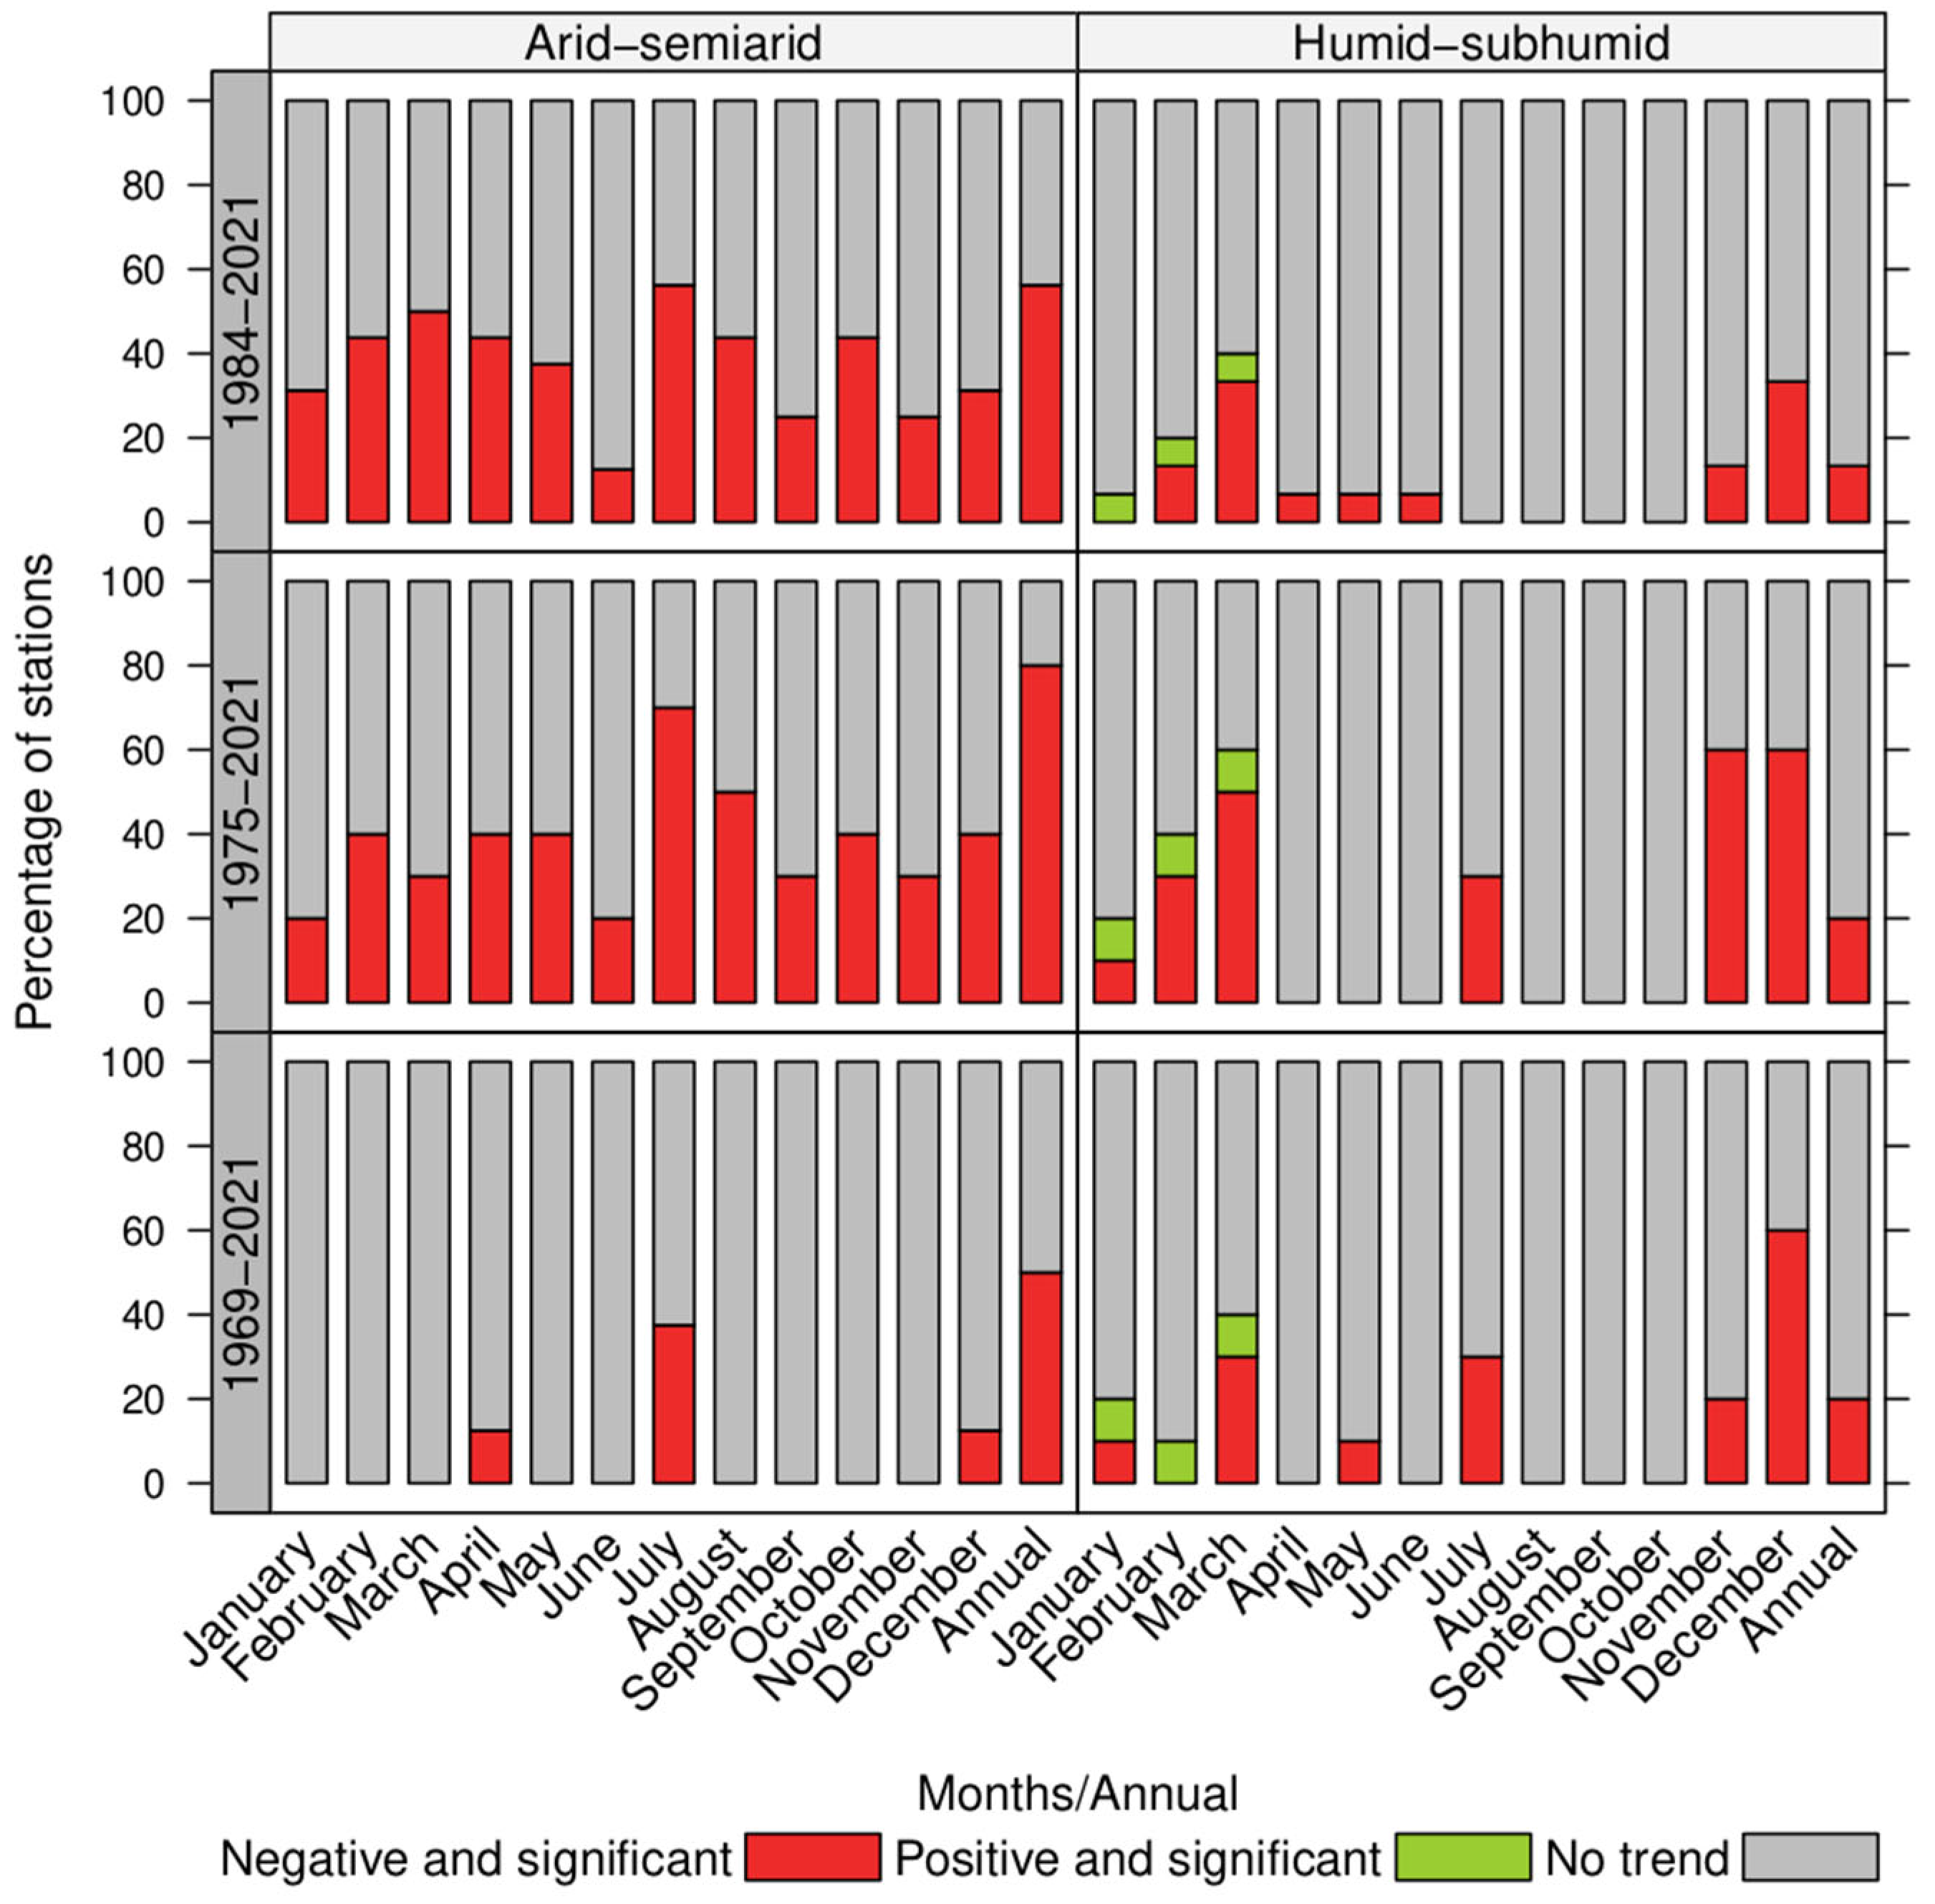
From the results at the annual scale, it is possible to observe that there was no clearly defined pattern in the behavior of the min, mean, and maximum flows in both climatic zones. However, the minimum, mean, and maximum flows in the arid–semiarid zone showed a reduction in the number of significant negative trends when the number of years of data considered increased. At the monthly scale, the flow trends in the arid–semiarid zone varied significantly as the length of the analyzed data was modified, which was not the case in the humid–subhumid zone.
To verify this, the data series were correlated with the PDO, showing that the effect of this climatic factor was more noticeable in the arid–semiarid zone, and this could explain some of the variation in the number of significant negative trends in the flow rates found for the summer months (
Table 4,
Table 5 and
Table 6).
An important element that emerged from this study was that the results of temporal trends (in this case relative to flows) varied according to the length of the time series considered, an element that has already been highlighted by other authors such as Pellicciotti et al. [
21], Valdés et al. [
36] and Pizarro et al. [
37]. This is highly relevant because the availability of the data series is extremely variable on a national scale and, in general, in different regions of the world. As a consequence, it is essential to consider flow time series of similar length in order to establish comparisons that are fair and unbiased from a scientific and statistical point of view. In this context, the results achieved in the arid–semiarid zone indicated that the high proportion of significant negative trends found at the monthly level was drastically reduced by incorporating a greater number of years into the series and this seemed to indicate a cyclic effect on the behaviors of the flow rates. Likewise, it is likely that the significant trends found in the 1984–2021 period were influenced by the current megadrought described in recent studies (e.g., [
38]), since a decrease in precipitation has an impact on flow rates. These results are consistent with those reported by Nuñez et al. [
39], who found that the flow behavior in the Coquimbo region was influenced by the (warm and cold) phases of the PDO, decreasing in the cold phase. This further supports the influence of climatic factors on the behaviors of flows, as reported by Pellicciotti et al. [
21], Martínez et al. [
22], and Rodgers et al. [
40].
In the case of the humid–subhumid zone, the negative and significant trends that were found in the first analyzed period had a much lower value compared to the arid–semiarid zone at a monthly level. This indicates that the negative trends were much smaller in areas with a greater humidity within the country (between latitudes 34°43′ S and 38°30′ S), and this would indicate a greater stability of the maximum flows than the one reflected in the arid–semiarid zone, for the same time period analyzed. However, the stations of Ñuble in San Fabián and Biobío in Rucalhue showed decreases of approximately 10% and 30%, respectively, in decile 10 of the daily mean flow (i.e., the maximum flow values of the daily mean flow were decreasing over time) and this can also be seen in the results of the maximum flows of the humid–subhumid zone (quantile–Kendall plots in
Supplementary Materials). These trends could be explained by an increase in snowmelt contributions to the flow, although the degree of their influence on the summer flow in these basins needs to be further investigated.
The results found in this study differ from those published by Novoa [
19,
20], where a positive trend was found in the maximum and average flows in the Claro river basin (Coquimbo region). This disparity can be explained by the different temporal resolutions and by the statistical test used to evaluate trends in the flows. Novoa [
19,
20] used the least-squares method to find the slope of the time series, whereas this study was based on the Mann–Kendall test, which, unlike least squares, is not affected by the presence of extreme values in the series. Moreover, Pellicciotti et al. [
21] analyzed annual and monthly flow tendencies in the Aconcagua River basin (Valparaíso region; semiarid zone of the country), using the Mann–Kendall test. The authors found negative trends in both temporal resolutions, similar to the results found in this study. Additionally, Givovich [
23] and Martínez et al. [
22] studied mean flow tendencies (monthly and annual) in the same region, suggesting decreases in water production in the upper part of the Aconcagua river basin and positive trends in its lower portion. The latter could be explained by the outcrop of underground flows and glacial melting (as previously mentioned), although the authors did not present evidence of any of these possibilities.
From an international perspective, Rodgers et al. [
40] analyzed streamflow trends in south–southeastern United States, verifying the variation as a function of the time period considered (1950–2015; 1960–2015; 1970–2015; 1980–2015; 1990–2015; and 2000–2015). Broadly speaking, the authors found that the most recent time period showed the highest number of significant negative trends. The results of this research show a similar behavior in the observed trends, particularly in the daily mean flows (see
Table 3 and plots in
Supplementary Materials), where the arid–semiarid zone showed a higher frequency of significant negative trends. These behavioral similarities within a climatic zone are an interesting aspect to investigate, since they were found in two different climatic zones, as described in Rodgers et al. [
32] and this study. This pattern is somewhat unexpected and may be an effect of global climate change, so it is important to continue investigating the flow patterns in different climatic zones.
Based on results from this study, it is important to note that there are relevant differences between the studied basins and their geographic location, and this variability should be considered when planning and managing water resources and the territory.
One of the limitations of this study is that not all the stations have information for the three analyzed periods and, therefore, it is not possible to indicate whether in the last period, there was an increase in the negative significant trends of these stations. Similarly, another factor to consider is the impact of illegal human extractions on circulating flow rates. Pizarro et al. [
33] identified that overuse is one of the main factors influencing the decrease in water supply in the Coquimbo region. Based on the above, watersheds with low intervention were selected to mitigate the impacts of this factor.
5. Conclusions
From the obtained results, it is possible to conclude that the trends of the analyzed flows (minimum, mean and maximum) were mainly negative during the analyzed periods, and this was supported by evaluating the tendency of the daily mean flows. This would suggest, as a first approximation, that the flows decreased at a monthly level. Additionally, the number of significant negative trends varied depending on the period analyzed, especially if the flows were broken down into their monthly or daily mean levels. This effect was more pronounced in the arid–semiarid zone.
A second conclusion is that it was necessary to increase the length of the data series, especially to include older time periods, because this indicated the presence of similar phenomena experienced in the past and thus reflected that similar events had previously been observed.
Finally, the correlation between the PDO and the monthly streamflow component may be a factor that explains the variation in the number of significant negative trends identified, a finding that was more clearly observed in the arid–semiarid zone and during summer months. However, further research is needed to quantify the influence of each factor on streamflow trends, and it would be interesting to study temporal changes in the magnitude of the trends. This could potentially offer a more insightful perspective that goes further than just testing for the presence or absence of trends, but also its associated dynamics and progressive attributes.


