Article

Geospatial Insights into Aridity Conditions: MODIS Products and GIS Modeling in Northeast Brazil

by
Jhon Lennon Bezerra da Silva
1,*,
Marcos Vinícius da Silva
2,
Alexandre Maniçoba da Rosa Ferraz Jardim
2,3,
Pabrício Marcos Oliveira Lopes
2,
Henrique Fonseca Elias de Oliveira
1,
Josef Augusto Oberdan Souza Silva
1,
Márcio Mesquita
1,4,
Ailton Alves de Carvalho
5,
Alan Cézar Bezerra
5,
José Francisco de Oliveira-Júnior
6,
Maria Beatriz Ferreira
7,
Iara Tamires Rodrigues Cavalcante
8,
Elania Freire da Silva
9 and
Geber Barbosa de Albuquerque Moura
2
1
Cerrado Irrigation Graduate Program, Goiano Federal Institute—Campus Ceres, GO-154, km 218–Zona Rural, Ceres 76300-000, Goiás, Brazil
2
Department of Agricultural Engineering, Federal Rural University of Pernambuco, Dom Manoel de Medeiros Avenue, s/n, Dois Irmãos, Recife 52171-900, Pernambuco, Brazil
3
Institute of Biosciences, São Paulo State University (Unesp), Rio Claro 13506-900, São Paulo, Brazil
4
Department of Agronomy, Federal University of Goiás (UFG), Nova Veneza, Km 0. Campus Samambaia–UFG, Goiânia 74690-900, Goiás, Brazil
5
Academic Unit of Serra Talhada, Rural Federal University of Pernambuco (UFRPE). Av. Gregório Ferraz Nogueira, S/n, Serra Talhada 56909-535, Pernambuco, Brazil
6
Institute of Atmospheric Sciences (ICAT), Federal University of Alagoas (UFAL), Maceió 57072-260, Alagoas, Brazil
7
Department of Forest Science, Federal Rural University of Pernambuco (UFRPE), Dom Manoel de Medeiros Avenue, s/n, Dois Irmãos, Recife 52171-900, Pernambuco, Brazil
8
Department of Animal Production, National Institute of the Semiarid (INSA), Av. Francisco Lopes de Almeida, s/n–Serrotão, Campina Grande 58434-700, Paraiba, Brazil
9
Department of Agricultural and Forestry Sciences, Federal Rural University of the Semi-Arid, Mossoró 59625-900, Rio Grande do Norte, Brazil
*
Author to whom correspondence should be addressed.
Hydrology 2024, 11(3), 32; https://doi.org/10.3390/hydrology11030032
Submission received: 26 January 2024 / Revised: 22 February 2024 / Accepted: 23 February 2024 / Published: 26 February 2024
(This article belongs to the Special Issue GIS Modelling of Evapotranspiration with Remote Sensing)

Abstract

:
Northeast Brazil (NEB), particularly its semiarid region, represents an area highly susceptible to the impacts of climate change, including severe droughts, and intense anthropogenic activities. These stresses may be accelerating environmental degradation and desertification of soil in NEB. The main aim of this study was to gain geospatial insights into the biophysical parameters of surface energy balance and actual evapotranspiration on a multi-temporal scale, aiming to detect and analyze the spectral behavioral patterns of areas vulnerable to degradation processes, based on thematic maps at the surface, for NEB and mainly the semiarid region of NEB from 2000 to 2019. Geospatial data from 8-day MODIS sensor products were used, such as surface reflectance (Terra/MOD09A1 and Aqua/MYD09A1), surface temperature (Terra/MOD11A2 and Aqua/MYD11A2), and actual evapotranspiration (Terra/MOD16A2 and Aqua/MYD16A2), version 6. Therefore, in this study, pixel-to-pixel values were processed by calculating the average pixel statistics for each year. From the reflectance product, digital processing of the surface albedo and spectral vegetation indices was also carried out, using computational programming scripts and machine learning algorithms developed via the Google Earth Engine (GEE) platform. The study also presents a seasonal analysis of these components and their relationships over 20 years. Through vegetation indices and statistical correlations, a new predictive model of actual evapotranspiration was developed. The quantitative and spatiotemporal spectral patterns of the parameters were assessed through descriptive statistics, measures of central tendency and dispersion, and statistical error analyses and correlation indices. Thematic maps highlighted the pixel-to-pixel results, with patterns of high temperature distribution mainly in the central and northeastern part of NEB and the semiarid region of NEB, highlighting the formation of persistent heat islands over time. Meanwhile, in these areas, the maps of actual evapotranspiration showed a drastic reduction due to the lesser availability of energy. Over time, the semiarid region of NEB presented areas with little and/or no vegetation cover, which were highly well-defined between the years 2012 and 2019, confirming that these areas are extremely vulnerable to degradation and desertification processes due to significant loss of vegetative and water resilience. The components of energy balance were highly interconnected to climatological and environmental conditions, showing the severe results of drought and accentuation of the water deficit in NEB, presenting a greater condition of aridity in the semiarid region of NEB over time.

1. Introduction

The changing conditions for semiarid and arid regions at global and regional levels must be constantly monitored and updated due to the accelerated increase in these areas, causing various imbalances and scarcity problems [1,2]. At a global level, the intensification of extreme climate change events mainly affects rainfall rates, driving severe droughts. In addition, the impacts caused by human activities also accelerate and lead to significant changes [3,4,5,6], with emphasis for semiarid areas of Brazil, such as the Northeast Region (NEB) and Brazilian Semiarid Region, where studies on the detection of vulnerabilities related to environmental degradation processes and soil desertification, based on radiation and energy balance components, help to understand the dynamics of these factors over time [7,8,9,10,11,12,13,14,15,16].
Environmental stresses, such as the increase in desertified regions and degraded areas within irrigated perimeters, are frequently observed in the context of the BSR [17,18,19,20,21,22,23]. These tensions are predominantly caused by anthropogenic and natural actions, resulting in soil degradation and loss of agricultural land, especially in the BSR, which is inherently sensitive to erosive processes due to its sparse vegetation and concentrated precipitation regime [24,25,26,27]. Additionally, these phenomena impact the microclimate in various locations through biophysical parameters and energy flows [28]. In these areas, hydrological processes undergo changes, such as alterations in water infiltration and storage capacity, influencing vegetation development [29].
Specifically, for regions of NEB, besides being historical, droughts have been frequent, providing extreme and highly dynamic climatic and hydrological conditions [13,14,30,31,32,33,34]. It is noteworthy that NEB and its sub-regions are associated with various large-scale and complex climatic phenomena, characterized by a set of meteorological phenomena and climatological conditions that cause instability in rainfall [9,35,36,37,38,39,40,41,42,43]. Factors such as drought, the condition of semiaridity, and pronounced water deficit are reflections of climatic variability (e.g., high variability and lack of rain for most of the year), where the precipitation is generally sparse in space and time, of high intensity and short duration [15,32,33,44,45,46].
NEB has an economy mainly based on agricultural activities, the service sector, industry, and tourism, accounting for an average of 13.5% of Brazil’s gross domestic product (GDP) between 2002 and 2017. This positions it as the third most participative region among the larger regions in the country [47]. Nevertheless, a substantial portion of the NEB area depends on and lacks the necessary conditions for meaningful and participatory action planning, as well as effective water and soil management. This shortfall significantly hinders its developmental potential, ultimately affecting the quality of life of the local population [16,34]. NEB has predominantly the Caatinga biome, located in the BSR, considered the most populous semiarid region in the world. In addition to the effects of climate change, anthropogenic pressures have been intensifying soil degradation and biodiversity loss over time. In recent decades, the native vegetation of the Caatinga has been replaced mainly by pasture areas, rainfed agriculture, and irrigated perimeters [25,34,48,49,50]. Therefore, there is a need to expand, update, and define the patterns of its biophysical conditions for more efficient decision making, thus mitigating the effects of environmental changes and socioeconomic impacts over time.
It is necessary to understand the processes of surface energy balance, as well as to comprehend the spectral behavioral pattern of vegetation through biophysical parameters and energy fluxes, such as vegetation indices, albedo and surface temperature, and mainly evapotranspiration. These aspects are fundamental for adequate planning of water and soil conservation projects [11,14,15,26,28,51]. In this regard, research focused on the development and improvement of models of the evapotranspiration of native vegetation and agricultural areas stands out [12,49,52,53,54]. It is essential for watershed management and widely necessary for climatological, meteorological, and hydrological modeling, as it has a direct influence on the hydrological cycle and water availability and is associated with land cover and land use (LULC) conditions and patterns. Evapotranspiration is also strongly linked to irrigated agriculture, being essential for the management and adequate dimensioning of irrigation projects in a sector that demands and consumes high water capacity. For beyond this planning, there are more effective and sustainable management measures for water resources in arid and semiarid regions [11,23,50,54,55,56,57].
The parameters of albedo and surface temperature are crucial mainly because they are associated with LULC. In other words, they can serve as sensitive indicators of the changes in vegetation cover, as well as land use and occupation. These parameters are influenced by alterations in the global, regional, and local climate, such as climate change events and the effects of drought [21,58,59].
Studying LULC spatiotemporally is essential, and the use of geotechnologies associated with the Geographic Information System (GIS) represents significant advancements in understanding the changing conditions in NEB. In this context, orbital remote sensing techniques stand out as efficient tools for detecting spectral responses, capable of quantifying and assessing climatic and environmental conditions. Overall, these technologies provide effective support in earth sciences research applications. Remote sensing yields results through products extracted from satellite data, such as those obtained from the Moderate Resolution Imaging Spectroradiometer—MODIS [12,15,18,44,50,56,60,61,62]. For example, the GEE platform of GIS operates with the applicability of cloud-based digital processing, using algorithms, machine learning operations, and computational mathematical modeling [63], offering effective applications at low operational cost [14].
With the need for further advancements in this regard, it is important to explore new tools, methods, and practical technologies to meet demands such as the absence of large-scale and over time environmental and hydrological data. The objective of this research is to enhance the spatiotemporal monitoring of biophysical conditions in NEB through the high applicability of GIS modeling and remote sensing climatic and environmental products from the MODIS sensor, gaining geospatial insights into the biophysical parameters of surface energy balance and actual evapotranspiration on a multi-temporal scale, aiming to detect and analyze mainly the spectral behavioral patterns of areas vulnerable to environmental degradation processes in Northeast Brazil, with a focus on the semiarid region of NEB, from 2000 to 2019.

2. Materials and Methods

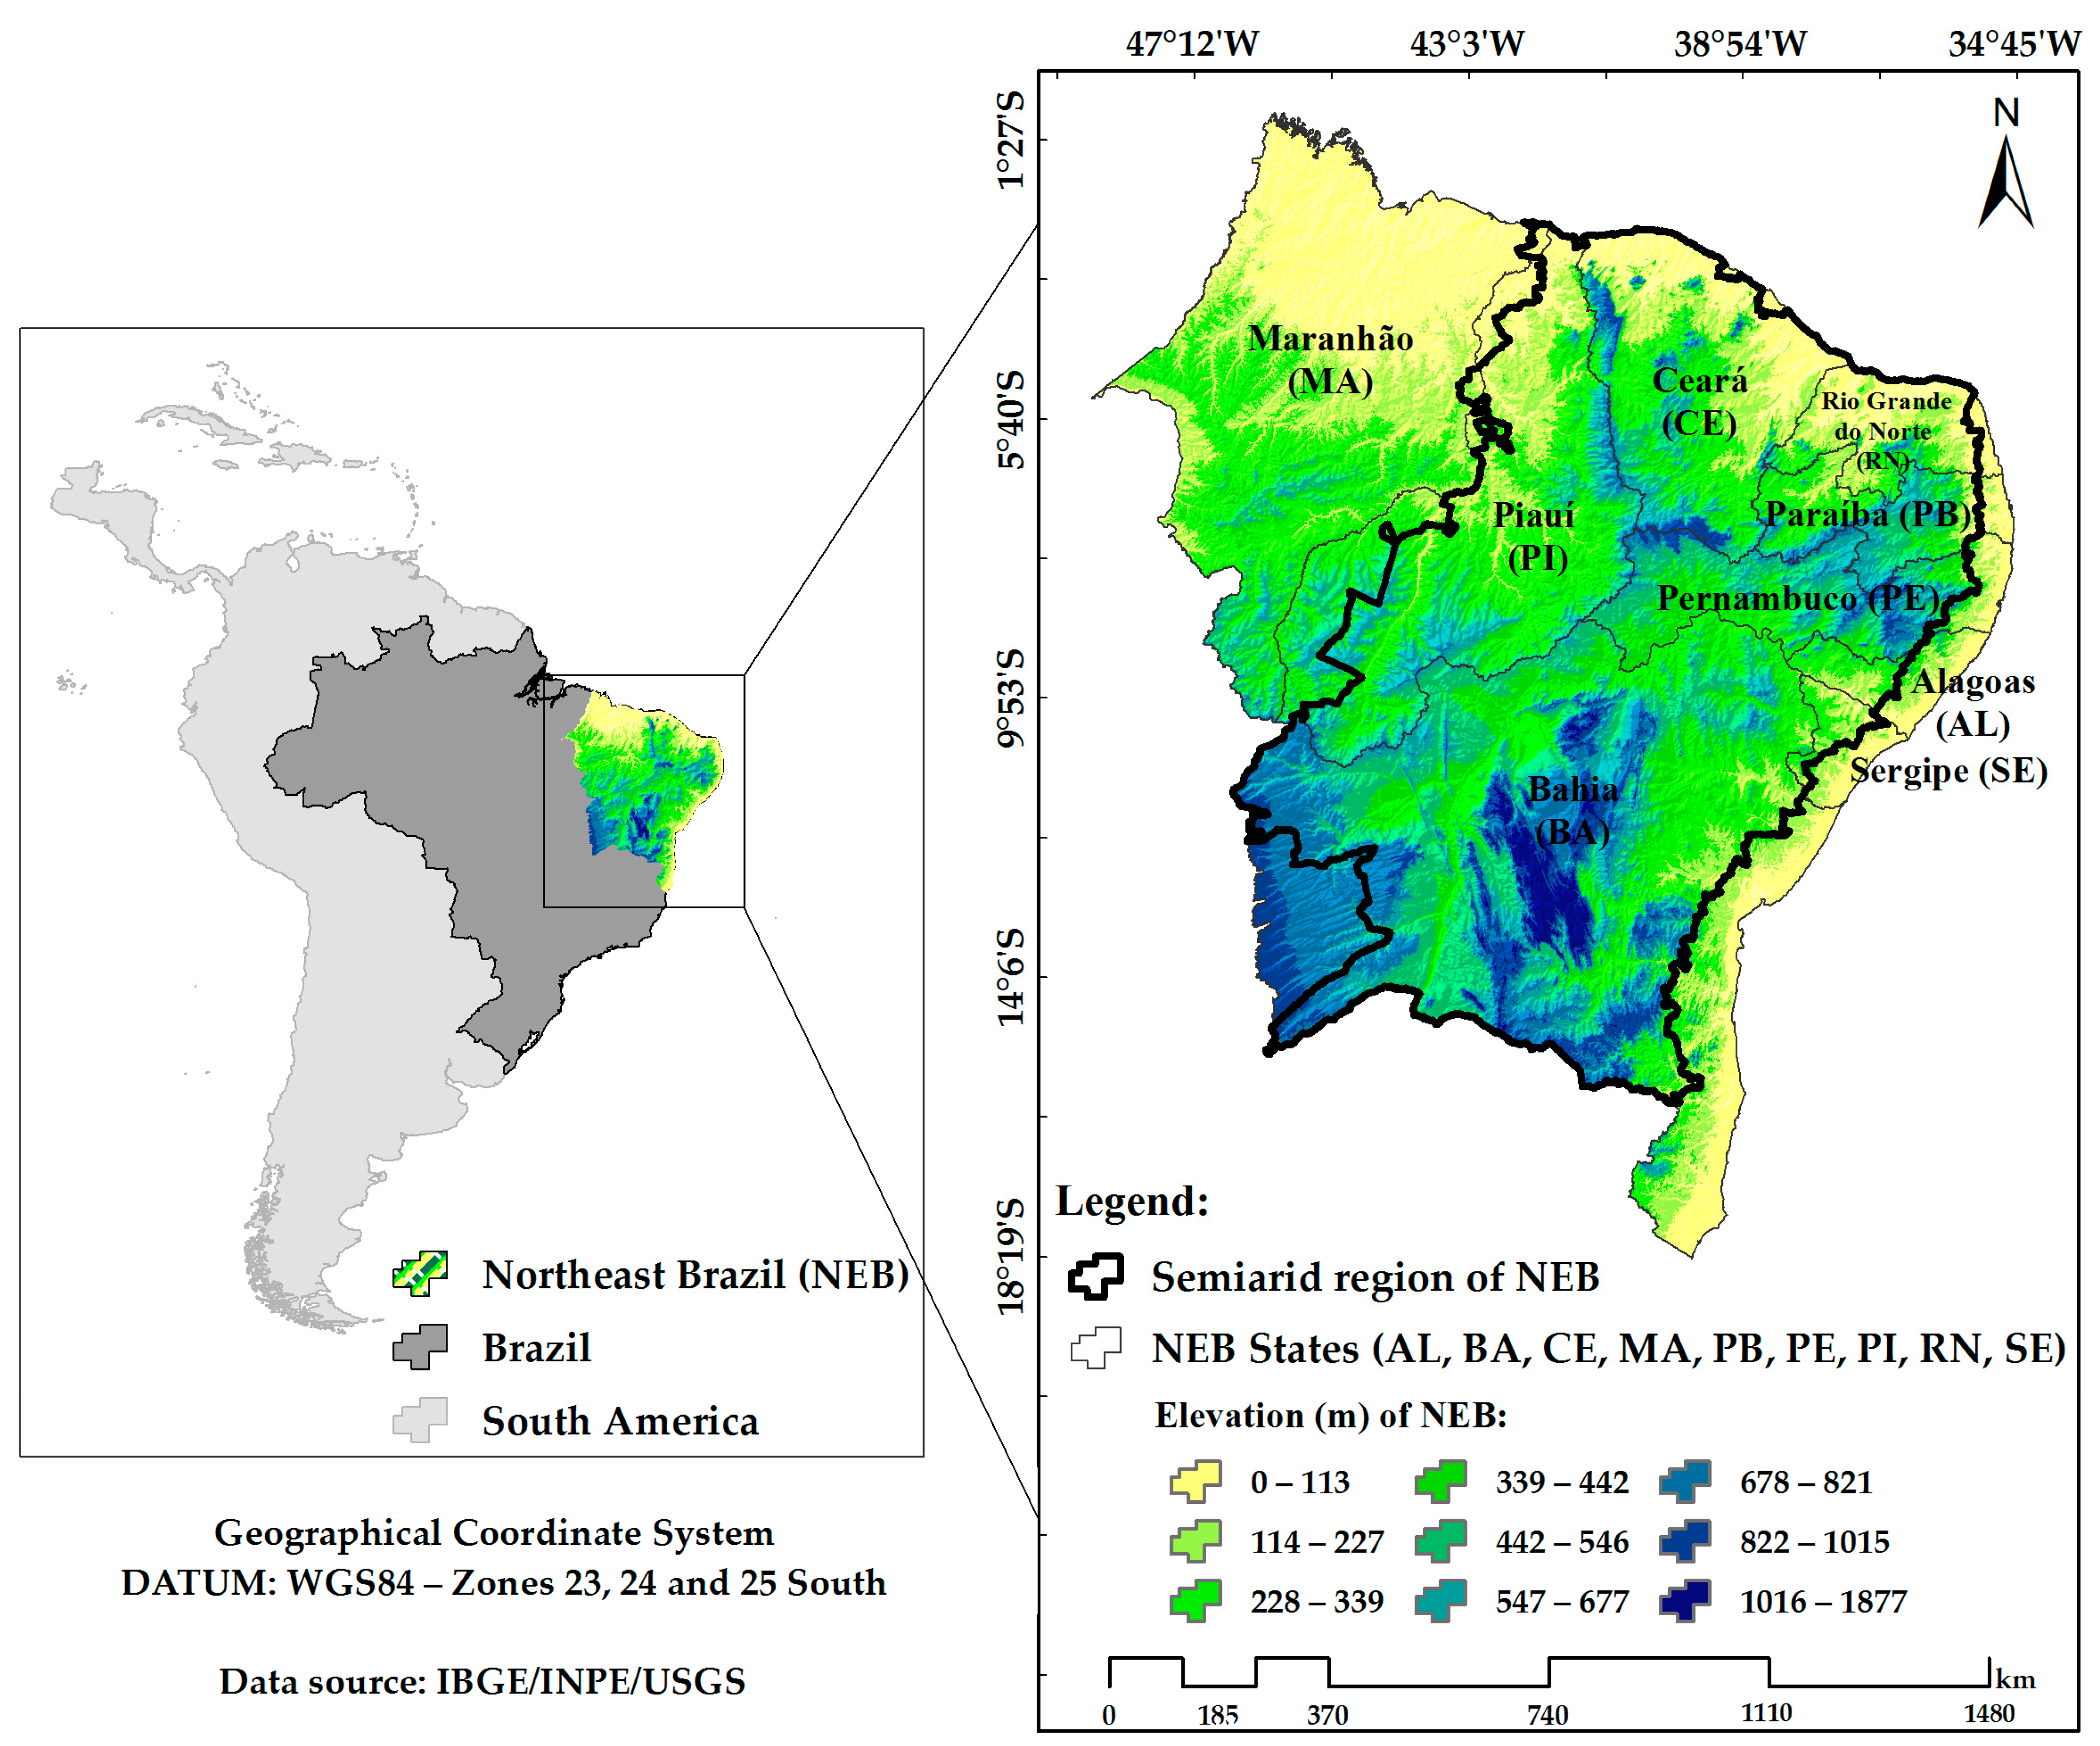
2.1. Study Area Characterization

The study area encompasses the Northeast Region of Brazil (NEB), including the territorial limits of the semiarid region within the Northeast Region. NEB is located in geographic coordinates between parallels 1° S and 18° S latitude and between meridians 34° W and 48° W longitude, covering an approximate area of 1,551,992 km2, which represents 18.24% of the national territory. The estimated population is 57,374,243 inhabitants, according to the demographic census of 2020, making it the second most populous region in Brazil [64]. The more specific region of this study, the semiarid region of NEB, includes a total of 1171 municipalities, with an estimated population of approximately 26,378,043 inhabitants, and encompasses a total territorial extension of 1,006,778 km2, which is distributed across nine states of NEB-Brazil (Figure 1), including Alagoas—AL; Bahia—BA; Ceará—CE; Maranhão—MA; Paraíba—PB; Pernambuco—PE; Piauí—PI; Rio Grande do Norte—RN; and Sergipe—SE [65].
The map also highlights the elevation (in meters) of NEB using the Digital Elevation Model (DEM) derived from the Shuttle Radar Topography Mission (SRTM) project, ranging from 0 to 1877 m, with the yellow and green color tones comprising areas of low and intermediate elevation, and the blue color scale highlighting the highest elevations in the Northeast Region (Figure 1). The SRTM data are provided by the United States Geological Survey (USGS) and the Brazilian National Institute for Space Research (INPE), featuring a spatial resolution of 30 m. These data are georeferenced using the Geographic Coordinate System, DATUM: WGS1984—in zones 23, 24, and 25 South.
NEB features an average annual air temperature ranging from 22 to 26 °C and an annual total rainfall varying from 2500 mm on the east coast to values below 500 mm, specifically in the regions between the states of Bahia and Pernambuco, precisely in the central region of the BSR, as well as in the Cariri region of Paraíba and Seridó of the Rio Grande do Norte [66,67].
It is worth noting that in NEB, ecosystems from different biomes are found, such as the Amazon (7.35%), Atlantic Forest (10.05%), Cerrado (29.11%), and the predominance of the Caatinga biome (53.49%), i.e., this vegetation cover occupies more than half of the total area of NEB [68]. This ecosystem has the Brazilian Seasonally Dry Tropical Forest (Caatinga) as its predominant vegetation type, covering approximately 63.30% of the total area [48,63,68].

2.2. Orbital Data from Terra and Aqua Satellites (MODIS Sensor)

The research was conducted using the multi-temporal series of orbital images from the MODIS sensor aboard the Terra (MOD) and Aqua (MYD) satellites (https://modis.gsfc.nasa.gov/—accessed on 2 January 2021). A minimum of 900 images from the MODIS sensor were employed for each parameter, involving a space-temporal analysis over 20 years from 2000 to 2019. That is, for each year, between 40 and 46 images were digitally processed for each biophysical parameter. The pixel-to-pixel digital processing of the multispectral data products was based on the average pixel statistics. The utilized products had an 8-day temporal resolution.
All images were processed digitally in an automated manner in a cloud computing environment using the GEE platform (https://earthengine.google.com/—accessed on 4 January 2021) [63]. GEE features a library with sets of geospatial, climatic, and environmental datasets, standing out for its multiple functions of mathematical analyses, computational modeling, and machine learning operations through specific algorithms to determine, for example, the biophysical parameters of surface energy balance [14,15,61,62], which was the main objective of this research. With that, a methodological script in Python programming language was developed in the GEE, applicable for determining parameters such as albedo and surface temperature, vegetation indices, and actual evapotranspiration.
However, it is noteworthy that correction/calibration factors and multiplicative factors related to each multispectral band of the main products used are applied for effective use of the images from the MODIS sensor. The surface reflectance product (Terra/MOD09A1 and Aqua/MYD09A1 version 6, available at: https://modis.gsfc.nasa.gov/data/dataprod/mod09.php—accessed on 2 January 2021) provide an estimate of the surface spectral reflectance of multispectral bands 1 to 7, which are corrected for atmospheric conditions through the removal of gases and aerosols (Table 1). It possesses a validated dataset with high accuracy and precision for detecting and quantifying conditions of climate and environmental changes on a planetary scale. The reflectance product is composed of pixel-to-pixel values referring to an 8-day period. Among these 8 days, a reference base value is chosen for each multispectral band, i.e., the value containing the best spectral observation, significantly related to the best conditions of atmospheric correction, without the presence of clouds and their shadows [69]. The multispectral bands of the reflectance product presented in Table 1 were used to calculate the surface albedo and spectral vegetation indices, aiming to obtain a set of biophysical surface indicators for NEB between 2000 and 2019.
Surface albedo was estimated from the multispectral bands of the MODIS sensor product, surface reflectance. To determine the albedo, weight coefficients for each band are necessary. These numerical values are determined based on solar radiation at the surface, specifically for use in operational energy balance applications. It is important to note that the weight coefficient is obtained by the ratio between the specific solar constant of the given multispectral band and the sum of all bands of the reflectance product (Table 1). It is worth noting that the values are calibrated for different types of LULC, which are in turn associated with each of the multispectral bands of reflectance with good agreement, according to Equation (1) [71,72]:
α sup = 0.215   ×   r 1   + 0.215   ×   r 2   + 0.242   ×   r 3   + 0.129   ×   r 4   + 0.101   ×   r 5   + 0.062   ×   r 6     0.036   ×   r 7
where αsup—surface albedo; numerical values—calibrated weight coefficients related to the multispectral bands of the MODIS surface reflectance product [72]; r1, r2, r3, r4, r5, r6, and r7 correspond to the multispectral bands of the reflectance product (Table 1).
Normalized Difference Vegetation Index (NDVI) was estimated by the ratio of the difference in the multispectral bands of near-infrared (rb IV) and red (rb VM) reflectance, and their sum, according to Equation (2) [15,73,74]:
NDVI = r b   IV   r b   VM r b   IV + r b   V M
where rb IV and rb VM correspond to the multispectral bands of the reflectance r2 (0.841–0.876 μm) and r1 (0.620–0.670 μm), respectively (Table 1).
Enhanced Vegetation Index (EVI) was estimated from the multispectral bands of near-infrared reflectance (rb IV), red band (rb VM), and blue band (rb B), according to Equation (3) [74,75]:
EVI = G   ( r b   IV r b   VM ) ( r b   IV + C 1   ×   r b   VM     C 2   ×   r b   B + L )
where rb IV, rb VM, and rb B correspond to the multispectral bands of the reflectance r2 (0.841–0.876 μm), r1 (0.620–0.670 μm), and r3 (0.459–0.479 μm) (Table 1), respectively; G—gain factor, with a value of 2.5 [74]; C1 and C2—coefficients of the aerosol resistance term, which uses the blue band to correct aerosol influences in the red band. According to Huete et al. [74], the value of 6 is assigned to C1, and the value of 7.5 is assigned to C2; L—adjustment factor for soil conditions, which can vary between 0 and 1 [74,75]. Thus, following the recommendation of various studies conducted in NEB and the BSR, the value of L for this application was 0.5, due to the semiarid conditions in NEB [14,49,51,61]. The numerical values aim to stabilize atmospheric variations, minimizing the residual effects and impacts of aerosols in the study area.
Soil Adjusted Vegetation Index (SAVI) was estimated following the same pattern as the determination of NDVI, and especially based on the adjustment factor (L) to the effects and soil conditions of the study area, as mentioned earlier in the main highlights of EVI, according to Equation (4) [11,26,49,51,61,73,76,77]:
SAVI = 1 + L   ×   ( r b   IV   r b   VM ) ( L + r b   IV + r b   VM )
Leaf Area Index (LAI, m2 m−2) was estimated based on the SAVI itself, according to Equation (5) [49,51,71,76]:
IAF = ln   0.69     SAVI 0.59 0.91
where numerical values represent calibration constants of the equation.
For the estimation of the biophysical parameter of surface temperature, correction/calibration factors as well as multiplicative and additional compensation factors are also applied, referring to the MODIS sensor product, land surface temperature (Terra/MOD11A2 and Aqua/MYD11A2 version 6, available at: https://modis.gsfc.nasa.gov/data/dataprod/mod11.php—accessed on 2 January 2021). This product provides an average estimate of surface temperature and emissivity, composed of pixel-to-pixel values averaged over an 8-day period. Surface temperature is estimated using the emissivities of MODIS bands 31 and 32 (Table 2). Emissivities are estimated through mathematical modeling based on LULC type [78].
For the estimation of evapotranspiration, a multiplicative factor was also applied, referring to the MODIS sensor product, actual evapotranspiration (ET–MODIS) (Terra/MOD16A2 and Aqua/MYD16A2, version 6, available at: https://modis.gsfc.nasa.gov/data/dataprod/mod16.php—accessed on 3 January 2021). It is noteworthy that the algorithm used for collecting ET–MODIS data is based on the Penman–Monteith equation [79], incorporating daily meteorological reanalysis data and vegetation property dynamics, such as albedo and land cover, from the MODIS remote sensing data products. The ET–MODIS product provides the accumulated pixel-to-pixel over the 8-day period (Table 3) [52,53,78,80,81].

2.3. Statistical Analysis of Data

The quantitative pixel-to-pixel results of the annual thematic maps of the land surface temperature (Tsup) and actual evapotranspiration, both for the ET–MODIS product and the ET–Predictive estimate, were subjected to analyses of error and correlation indices as well as descriptive statistics, as the following measures of central tendency and dispersion were included: average (Av.), minimum (min.), maximum (max.), standard deviation (SD), and coefficient of variation (CV, %). Additionally, the spatial variability of the thematic surface maps was observed based on the CV, following the classification criteria of Warrick and Nielsen [82]: low variability (CV < 12%), moderate variability (CV 12–60%), and high variability (CV > 60%).
For generating new thematic maps of evapotranspiration through the vegetation indices, predictive variables that influence and show a good correlation with the ET–MODIS product were observed. The aim was to establish a model that characterizes actual evapotranspiration through orbital remote sensing in a practical and efficient manner, specifically based on the spectral patterns of the region’s vegetation cover. For model adjustment, analysis of variance (ANOVA) was used, where a 99% confidence interval (p < 0.01) was adopted for the suitability of the predictive variables and the statistical model, validated by the coefficient of determination (R2).
Statistical analyses were conducted using R software, version 3.6.1 [83]. The main statistical values were extracted through internal digital processing generated by GEE. Quantitative data were also tabulated using Microsoft Excel 2016 64-Bit Edition® spreadsheets, included in the Microsoft Office Professional Plus 2016® package, version 16.0.4266.1001.

3. Results and Discussion

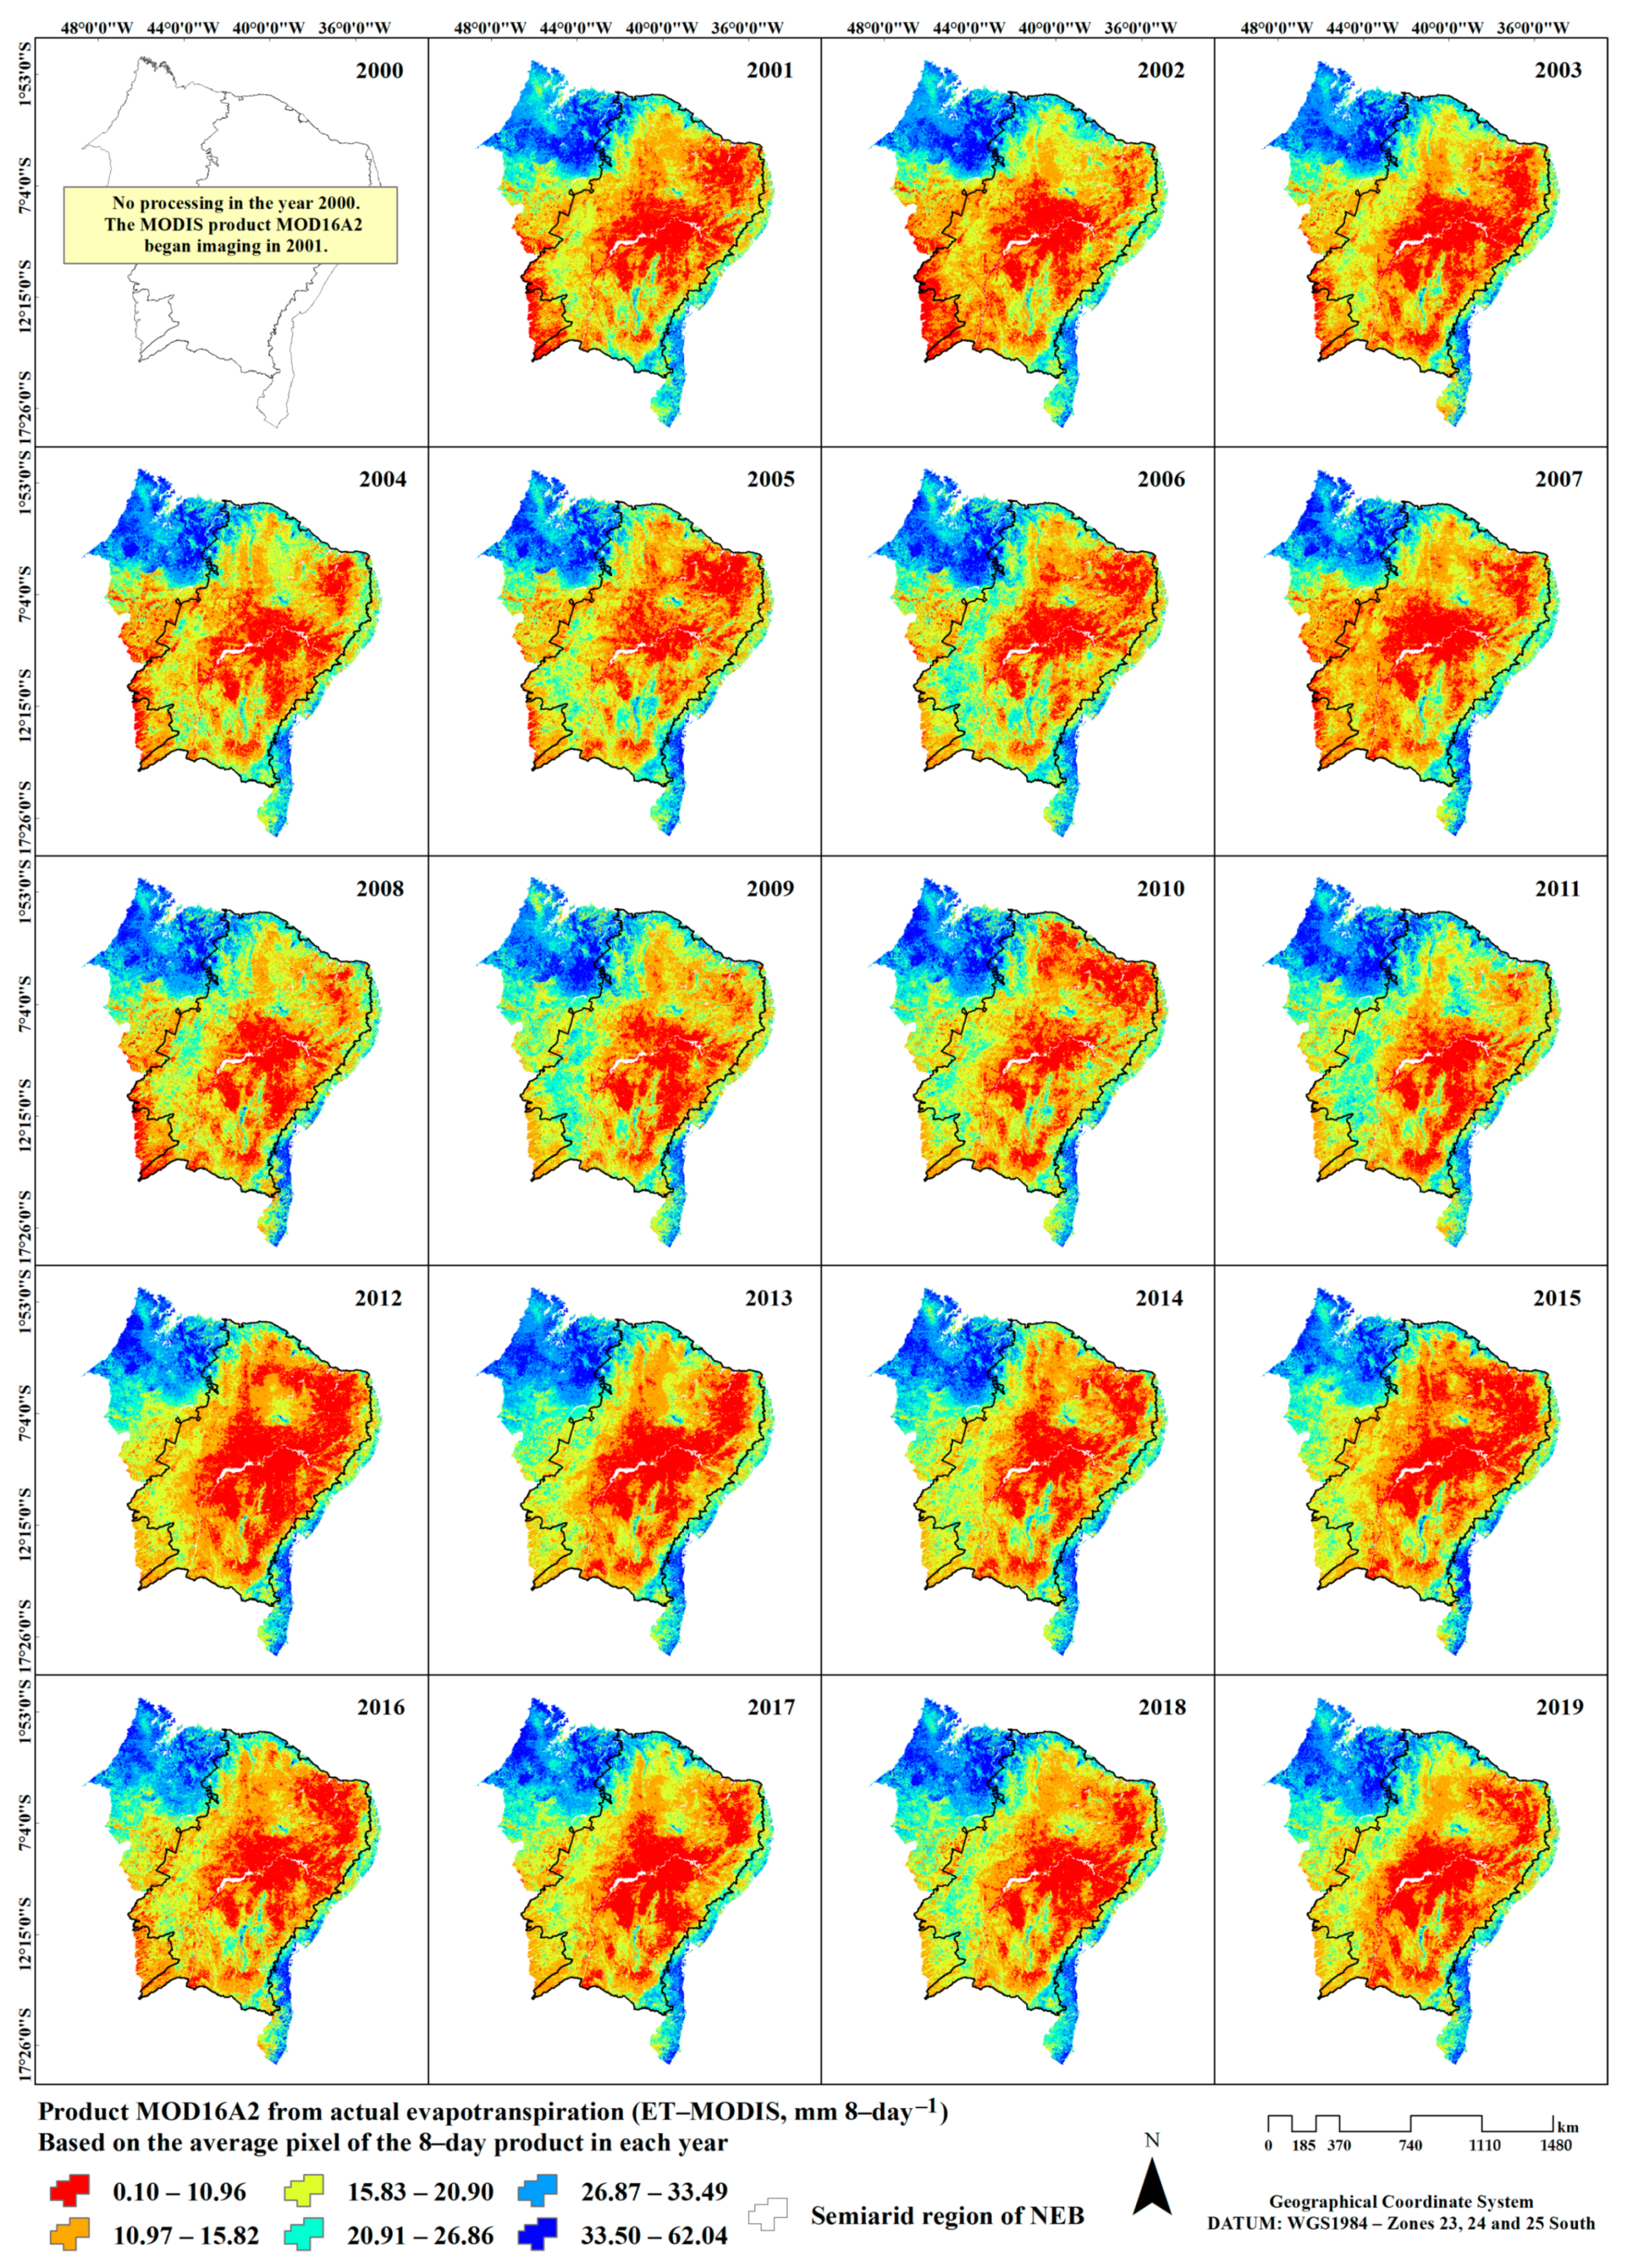
3.1. Thematic Maps to Surface (Tsup and ET–MODIS)

Annual change patterns in NEB and its semiarid region were highlighted by the quantitative and spatiotemporal variability of surface thematic maps, demonstrating, in essence, the severe effects of drought, as well as aspects of vegetation resilience over time, in the period of 20 years. Figure 2 presents the spatiotemporal distribution of the biophysical parameter of surface temperature (Tsup) from 2000 to 2019. The Tsup values, in general, ranged from 20.49 to 46.41 °C. The pixel-to-pixel results highlighted high Tsup values, particularly over the semiarid region of NEB. It is worth noting that the semiarid region of Brazil is affected by high climatic variability and consequently presents low and/or no vegetation cover for most of the year [21]. Vorovencii [84] noted that the reduction of vegetation cover on dry surfaces directly affects the surface temperature and air humidity, potentially influencing the circulation of air masses and local rainfall patterns.
In certain areas of NEB, based on insights from the thematic temperature maps, it was possible to observe the formation of heat islands over time (a microclimate no longer exists), with pixels of hues in the red range. These high temperature ranges, between 35.24 and 46.41 °C, are probably areas where vegetation dynamics were impacted by the effects of prolonged drought, which affected the resilience conditions of vegetation cover over time. These regions present semiarid conditions with areas of degraded soil. More recently, a study detected arid conditions in these regions of NEB. Barbosa [13] studied drought and its characteristics over several days in Northeast South America using satellite data from 2004 to 2022, discovering that drought and rainy cycles had considerable impacts on the vegetation dynamics, with a trend of increasing temperatures mainly in the central region of NEB due to the high level of land degradation, presenting in these regions the occurrence of arid areas, i.e., areas where the vegetation no longer responds to the climatic factors. Feng and Fu [1] analyzed the expansion of global drylands based on climate model simulations from 1948 to 2100 and highlighted that there will be a greater expansion of semiarid and arid lands on the continents, which will consequently increase the population affected by water scarcity and soil degradation.
Bezerra et al. [85] observed that, in addition to rainfall patterns, temperature spatialization occurs analogously to the distribution of local vegetation cover, also correlating with the seasonality of meteorological variables such as air temperature and incident global solar radiation.
Areas covered by water bodies, dense vegetation cover, and higher altitudes exhibited lower Tsup values, as expected, appearing in the maps with pixels in the blue range, between 20.49 and 27.35 °C, specifically in the northwest, south, south-central, and southeast regions of NEB (Figure 2).
Cunha et al. [67] explored the application of the Vegetation Supply Water Index (VSWI), which combines the NDVI and surface temperature data from the MODIS sensor, to develop a methodology for drought monitoring. Their results indicated the severity of a drought event during the years 2012 and 2013, in which approximately 85% of the BSR was affected by water deficit conditions. Similarly, Gutiérrez et al. [86], in their study of drought events in Brazil, highlighted the intense severity of this event in 2012 and 2013. These years were characterized by significant water deficits, impacting the water availability in reservoirs in the semiarid regions of the state of Ceará. This led to almost total losses in rainfed agriculture, particularly in corn and bean crops, resulting in various local and regional socioeconomic conflicts.
The study by Marengo and Bernasconi [30] focused on the current state and future projections of climate change factors such as aridity and drought conditions in NEB and its semiarid region. Utilizing aridity indices from Budyko and the United Nations, the authors projected a temperature increase of 2 °C for NEB between the years of 2010 and 2040. And specifically for the semiarid region, the authors predicted a temperature increase ranging between 2 and 4 °C from 2041 to 2070. Analyzing the entire of NEB, the projections indicated an increase above 4 °C between 2071 and 2100. A reduction in rainfall was also anticipated, influencing the accentuation of the water deficit over time. In conclusion, the authors inferred that short-, medium-, and long-term projections suggest an expansion of areas with semiarid and arid conditions until 2100.
Marengo et al. [33], in updating climate projections for NEB until 2100, highlighted that conditions of high water deficit reach between 49 and 54% of the region, with the likelihood of warming of at least 4 °C. More specifically, the authors also provided projection responses regarding the vegetation of the Caatinga biome, indicating a replacement by vegetation typical of arid conditions. In this context, using data derived from satellites, Santos et al. [87] underscored the quantification of changes and trends in the forest cover of the BSR from 2000 to 2018, observing a total loss of 60,769.39 km2.
In light of these highlighted conditions, based on the patterns of LULC changes in the present study, the spatiotemporal distribution of the actual evapotranspiration (ET–MODIS) for NEB and its semiarid region was also observed between 2001 and 2019. It is worth noting that, unlike the surface temperature product, which started in the year 2000, the ET–MODIS product began its imaging from the year 2001. The pixel-to-pixel values of the thematic maps represent the average pixel statistics for each year, estimated based on the 8-day ET–MODIS product, ranging from 0.10 to 62.04 mm 8-day−1 (Figure 3).
The lowest values of ET–MODIS, ranging from 0.10 to 10.96 mm 8-day−1, were detected in the semiarid regions of NEB (Figure 3), i.e., in areas affected by LULC changes due to rainfall variability and drought conditions, especially in the thematic maps from 2012 to 2019. The study by Oliveira et al. [12] showed that these values can be explained by high rainfall variability and low water availability in the region. Therefore, these areas exhibit low vegetation cover and/or non-vegetated areas, favoring a lower availability of energy to be partitioned in evapotranspiration processes [15,54]. The highest values of ET–MODIS, ranging from 33.50 to 62.04 mm 8-day−1, were over biome transition regions, especially to the northwest and southeast of NEB (Figure 3). These areas have higher vegetation cover densities and are marked by rainfall indices and humidity conditions from the Amazon and the coast, respectively, associated with large atmospheric systems and moisture availability from the Atlantic Ocean [12,15,43].
The geospatial products provided insights into the semiarid and arid conditions in different areas of NEB, with an alert regarding changes in LULC: for example, the replacement of native vegetation, mainly of the Caatinga biome, coupled with the degradation of agricultural areas. These changes alter the partitioning of surface energy balance, significantly reducing the process of evapotranspiration [11,54,88]. In this context, it is important to highlight the extensive agricultural and livestock practices, particularly in semiarid regions, which may contribute to the expansion of degraded areas, thus accelerating desertification processes [14,15,21]. As observed by Mariano et al. [10], land degradation in NEB significantly reduces evapotranspiration, corroborating the findings of the present study. These conditions cause imbalances in the ecosystem, significantly impairing surface energy balance processes. Consequently, there is a heightened concern regarding the escalation of desertification levels in the region and/or increases in areas that have become desertified.
Particularly regarding the Caatinga vegetation, which is predominant in NEB and unique of the BSR, Oliveira et al. [12] emphasized that these areas are not only sensitive and prone to desertification but also the combination of anthropogenic activities and the region’s climatic conditions (severe drought) can lead to irreversible impacts, thus affecting the regional climate and the relationship between energy and water availability.

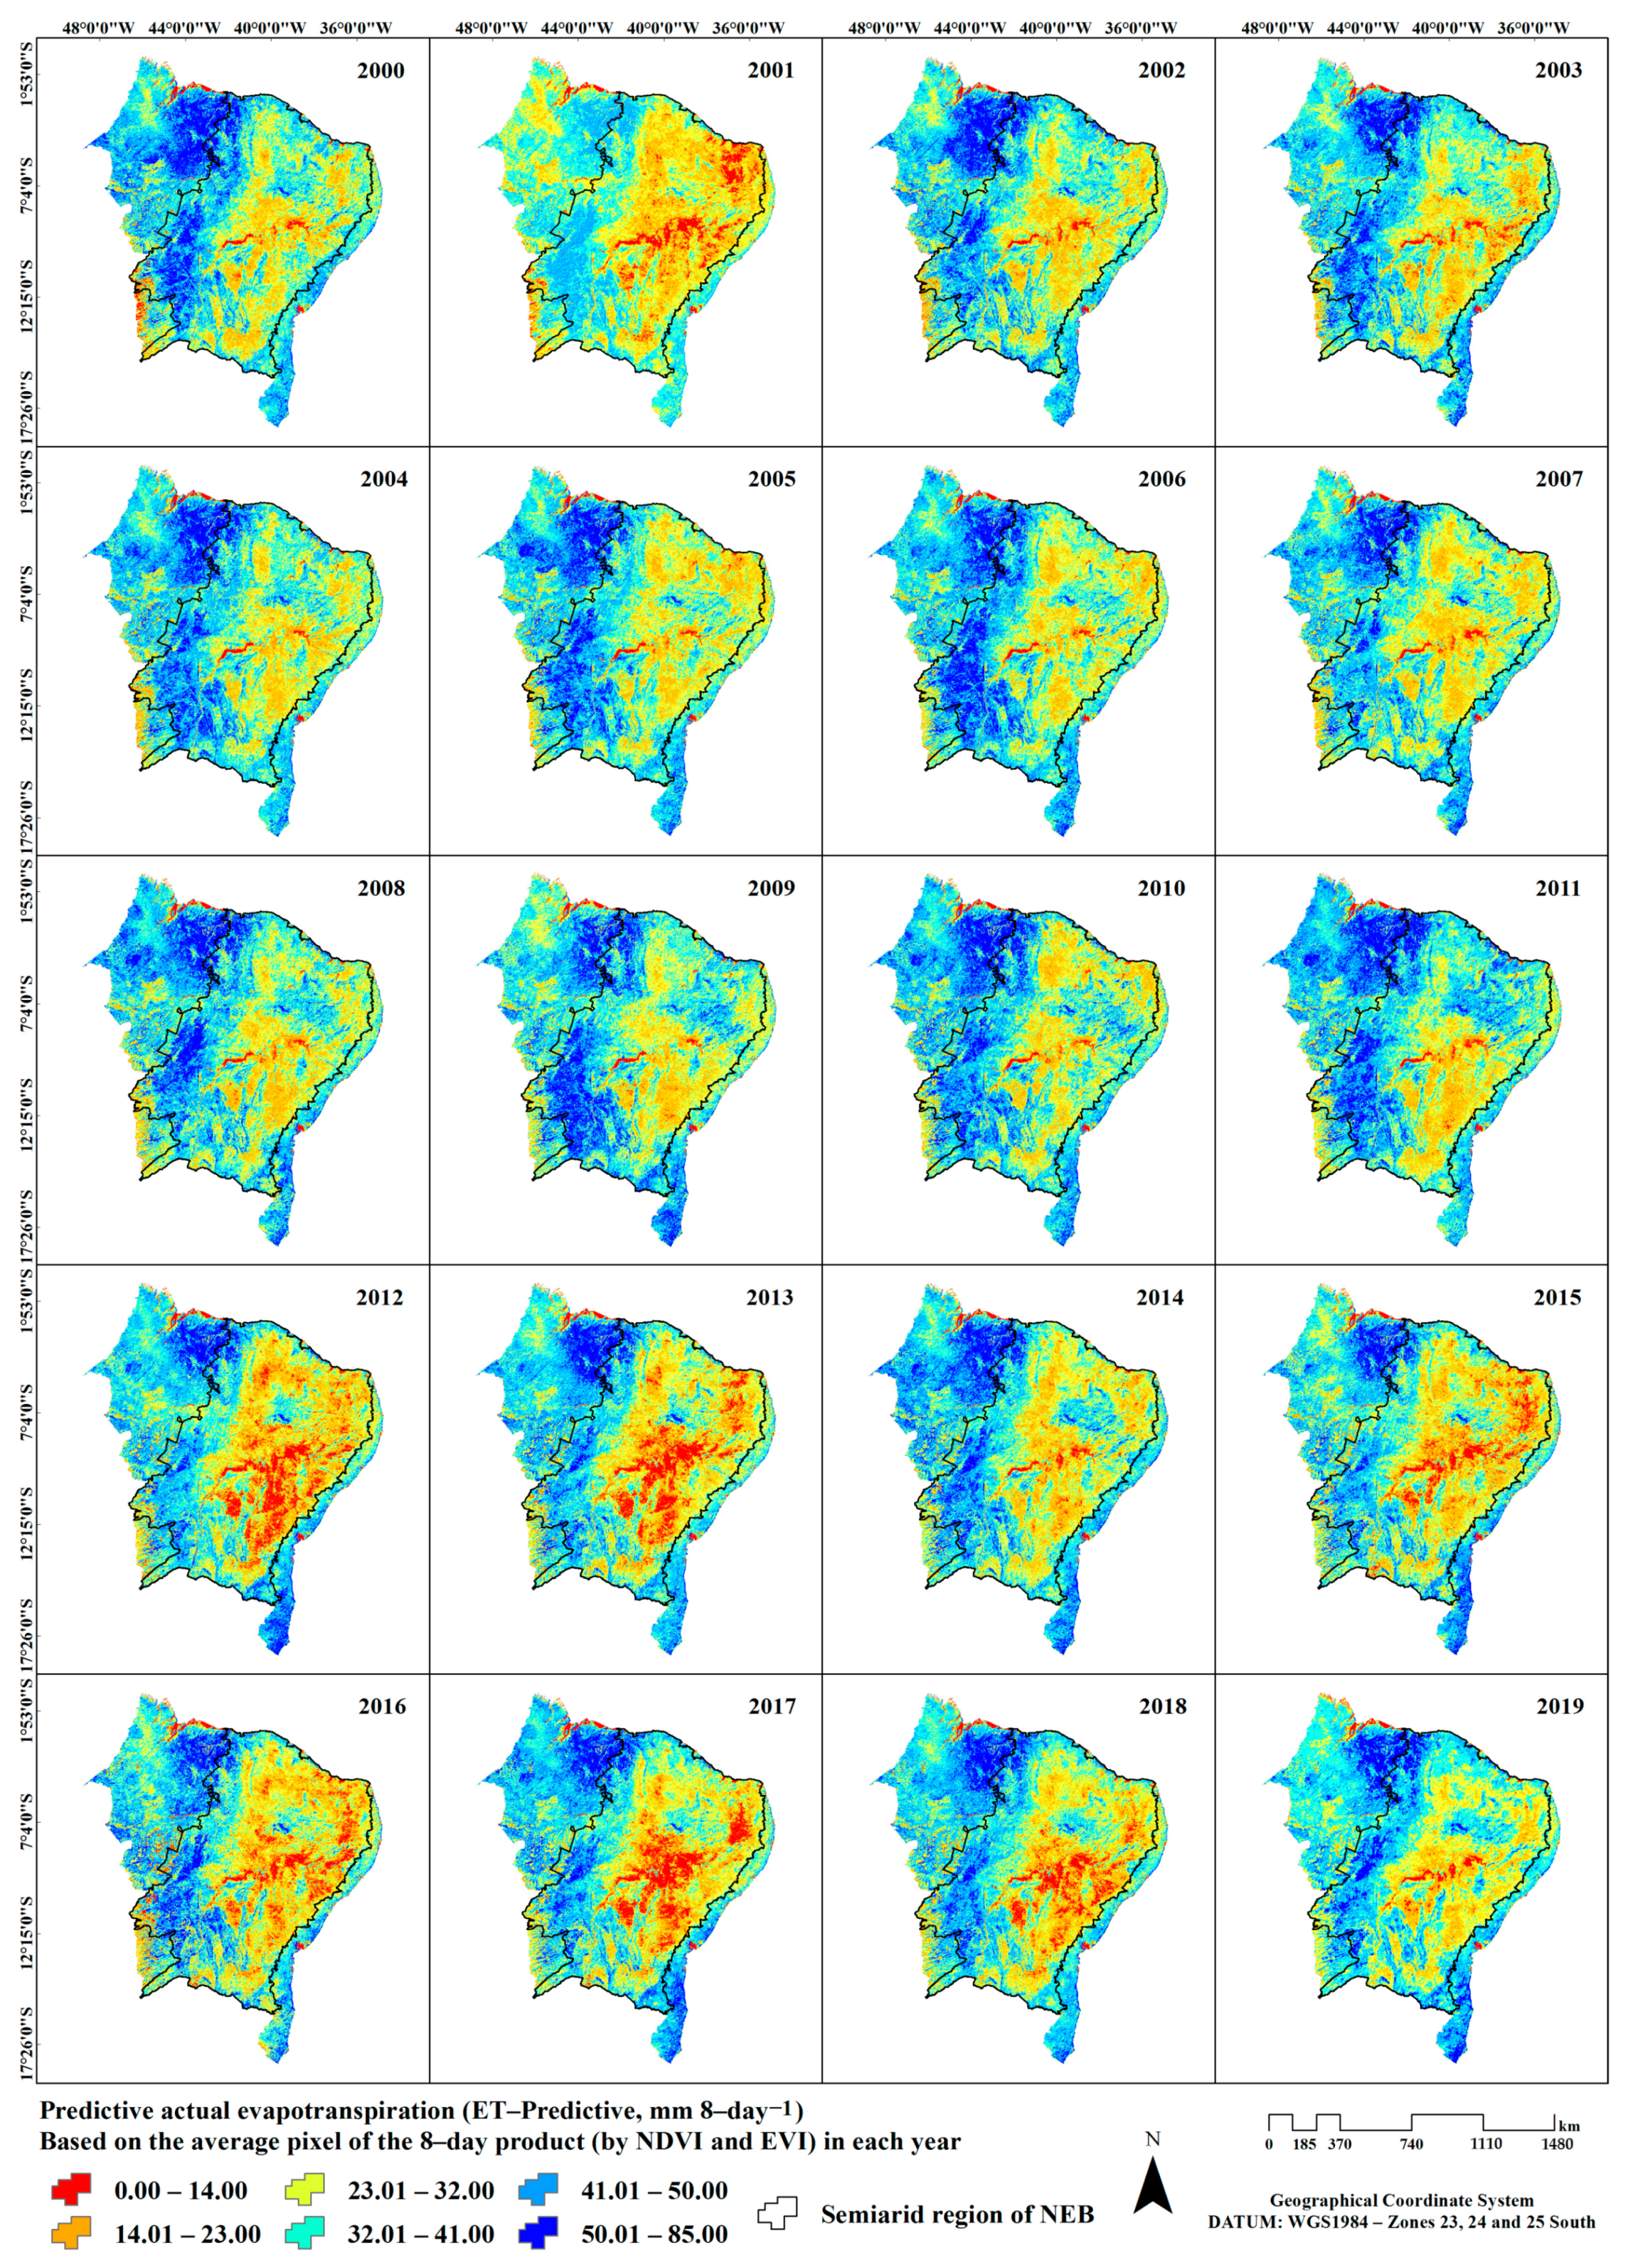
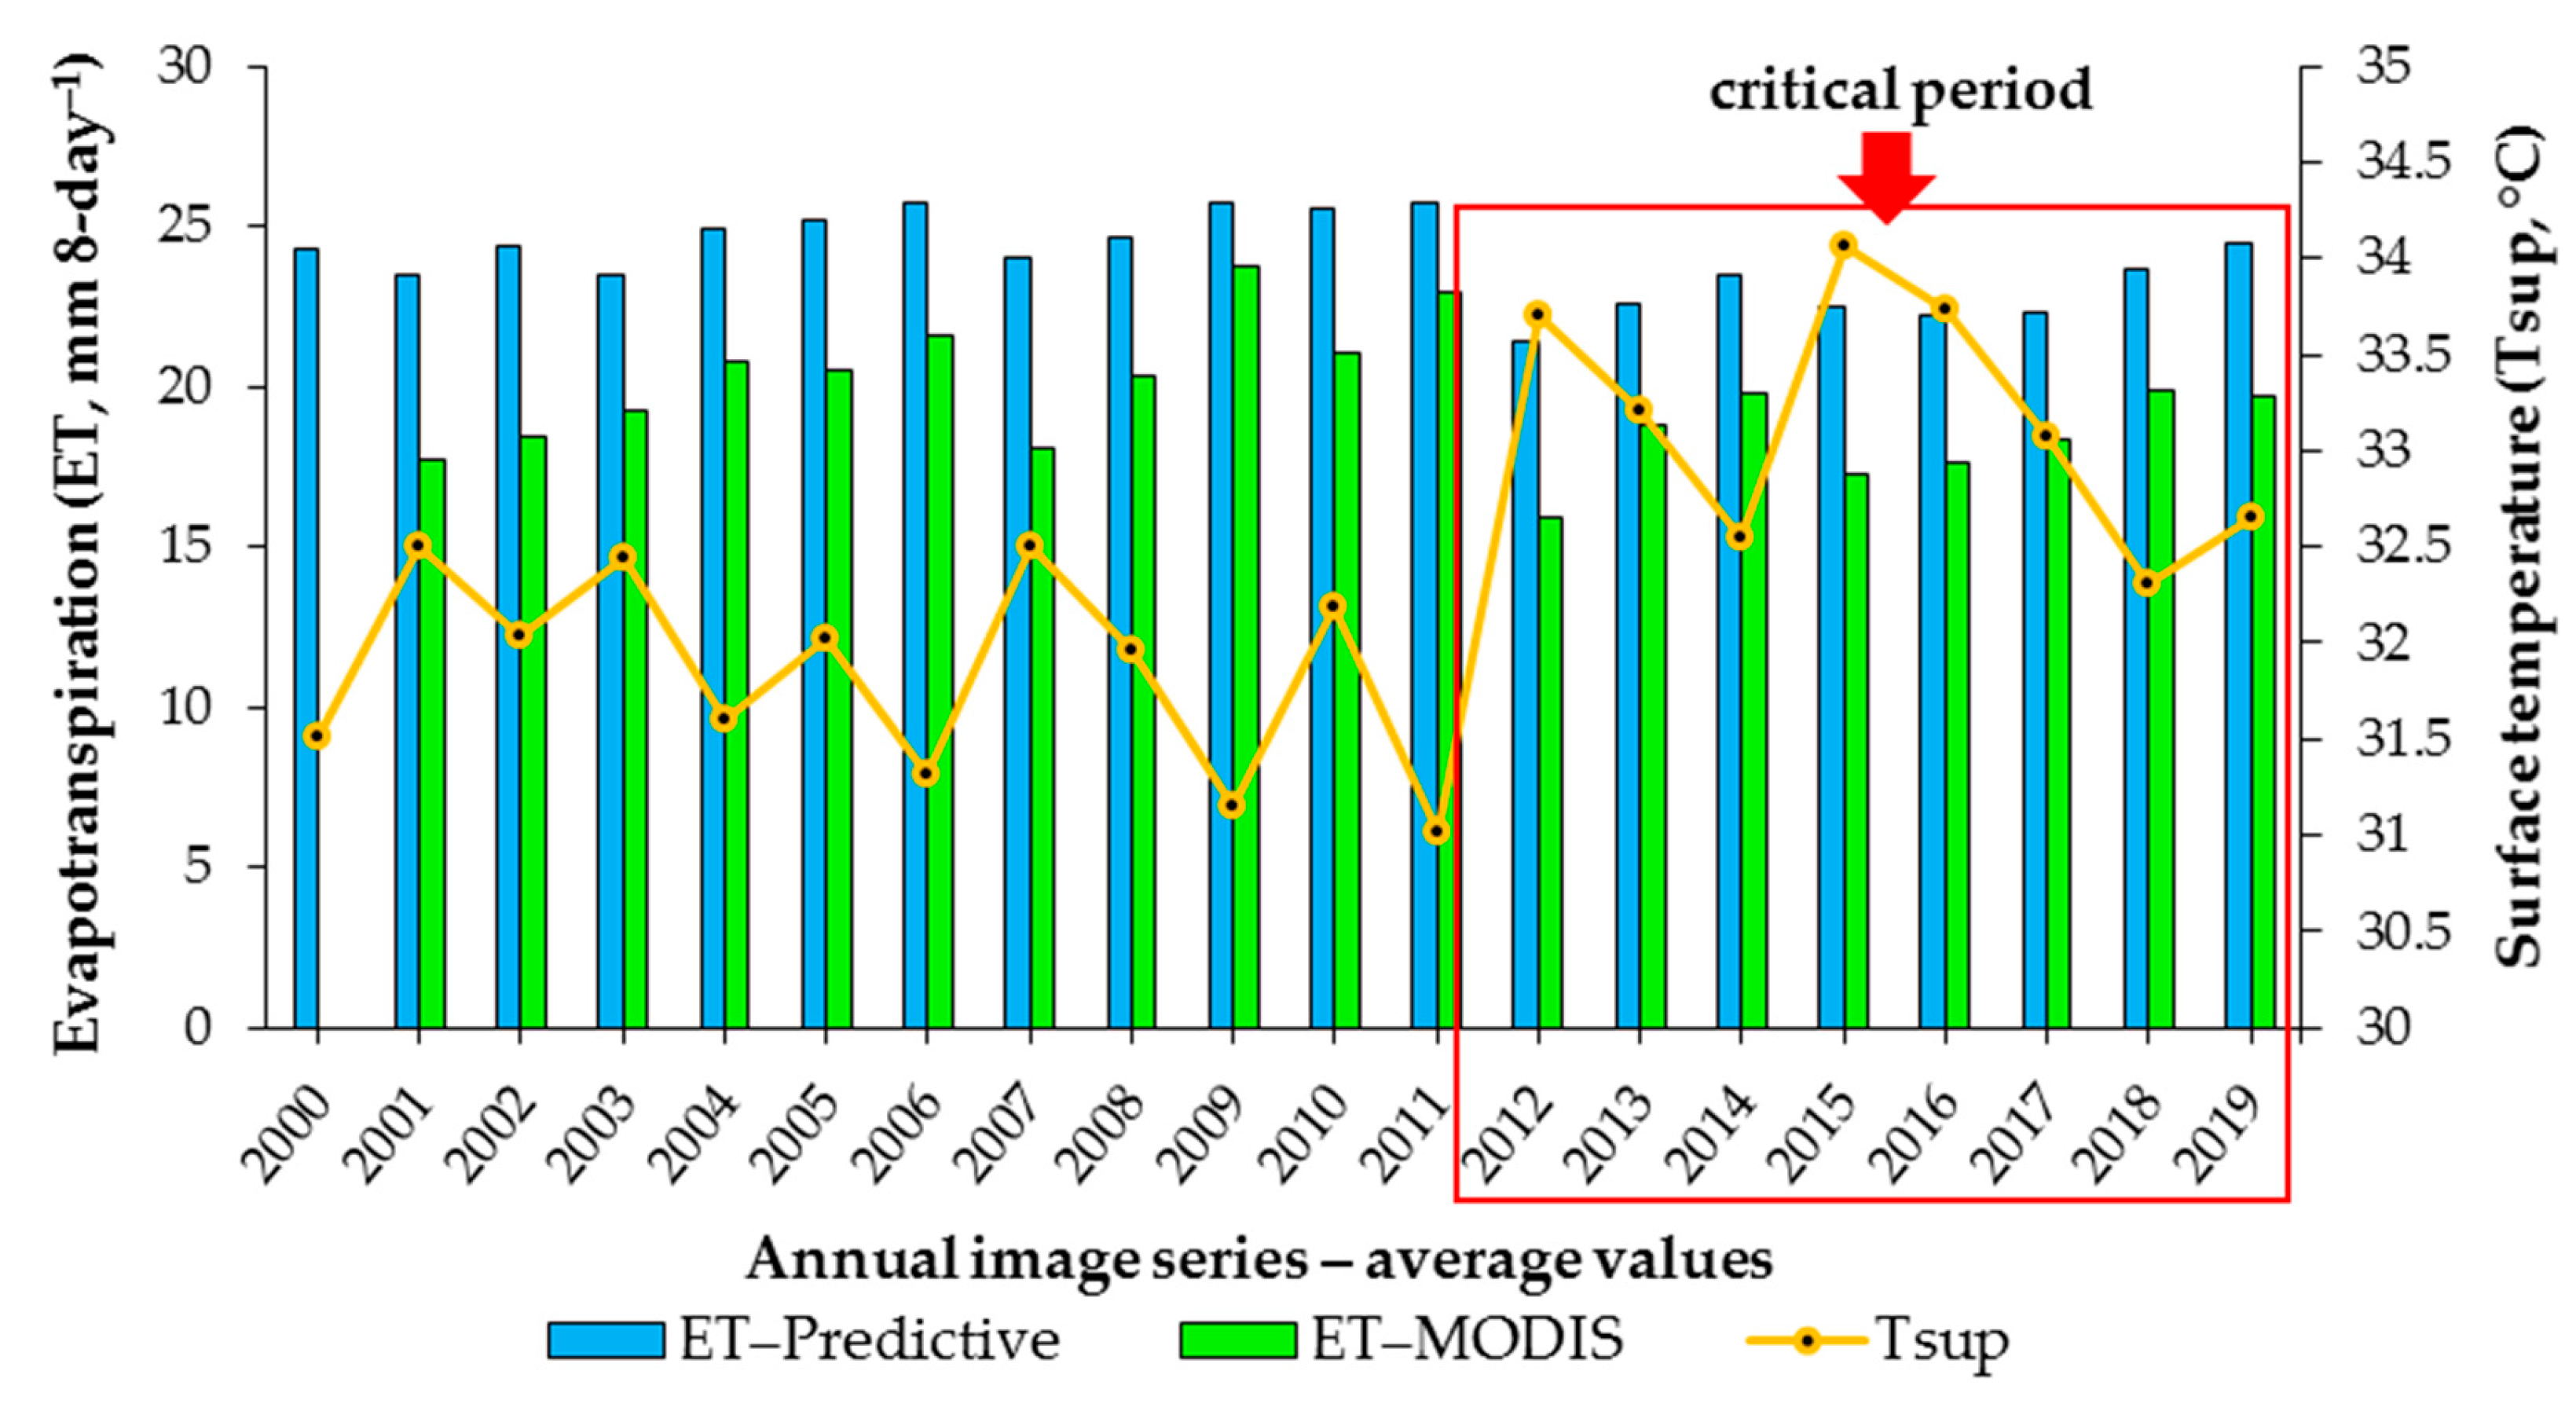
3.2. Regression Model (ET–Predictive)

As it is intimately associated with the conditions and patterns of LULC, a multiple regression model was established, statistically followed by the best relationships between ET–MODIS and the vegetation spectral indices of the MODIS sensor. In other words, the predictive variables used as input data were NDVI and EVI, and the ET–Predictive model was established as the response, thus generating new annual thematic maps of actual evapotranspiration for NEB, according to Equation (6):
ET Predictive = 14.80     ( 25.2   ×   NDVI ) + ( 139.2   ×   EVI )
Table 4 shows the analysis of variance (ANOVA) for the multiple regression model. The regression, in turn, exhibited a 99% significance level, with a p-value less than 0.01.
Therefore, it is highlighted that validation of the model successfully passed the descriptive measure of quality of fit through the coefficient of determination (R2), which showed a value of R2 = 93.91%. Therefore, in the case of failures and absence of data from the ET–MODIS product, the current model has the potential to replace the MODIS sensor for NEB regions, especially for estimates of ET–Predictive in the BSR. Given the applicability of the regression equation (Equation (6)), the spatiotemporal distribution of the new annual thematic maps of ET–Predictive by NDVI and EVI are presented in Figure 4.
The maps of ET–Predictive by NDVI and EVI highlighted a spectral behavioral pattern sensitive to the conditions of green vegetation and denser areas, i.e., meaning that these high values are in NEB transition areas. There was a well-defined transition zone between the backlands and mid-north of NEB, with average pixel values between 50.01 and 84.00 mm 8-day−1 (Figure 4). This sensitivity pattern was a striking condition of the spectral monitoring of NDVI [15].
Contrary to what was shown in the thematic maps of ET–MODIS (Figure 3), areas located to the northwest of NEB highlighted intermediate ET–Predictive values, i.e., this could be a strong indication of deforested areas (Figure 4). Considering that ET–Predictive was highly sensitive to high values, a pattern of overestimation was shown compared to ET–MODIS.
ET–Predictive was particularly sensitive in weighting its values over the semiarid region of NEB, especially during the period from 2012 to 2019 (Figure 4). This spectral behavioral pattern was notably observed in the spectral monitoring of EVI, which also stands out for its sensitivity in denser areas. However, the index was effective in stabilizing atmospheric variations through standardized numerical values for the study area (semiarid region), thus minimizing the effects of soil and residual impacts of aerosols, and consequently being extremely effective in capturing the spectral reality of estimates for semiarid regions [14,74].
It is noteworthy that the model enabled estimating the thematic map for the year 2000, which was absent in the ET–MODIS product. The areas of water bodies were characterized by the model as having a value of zero. Therefore, the pixels were displayed in the maps with a red hue, like areas of exposed soil and other impermeable areas throughout NEB. The model was based on the spectral conditions of vegetation, specifically estimating ET–Predictive values of the leaf canopy.
Figure 5 also highlights the temporal analysis concerning the average statistics of ET–Predictive and ET–MODIS in relation to rainfall between 2000 and 2019. The rainfall data were derived from the precipitation products of the satellites Tropical Rainfall Measuring Mission (TRMM) and Global Precipitation Measurement (GPM), which were made available in the study by Silva et al. [15].
Therefore, in comparison, it is highlighted that the ET–Predictive model showed a condition of overestimation compared to the ET–MODIS product; however, it displayed relatively close percentage values, at 8.28%. The average values of the time series confirmed a similar spectral behavioral pattern over time. Notably, the period from 2012 to 2019 stands out for presenting the most significant drop in these values for both evapotranspiration products, when the parameters were mainly impacted by high variability and low annual rainfall indices in NEB (Figure 5).
Inferences can be made regarding the best fit of the evapotranspiration product values in relation to rainfall. For example, the years 2000, 2002, 2004, 2005, 2006, 2008, 2009, and 2011 showed a better correlation with the ET–Predictive product. Although the majority of the years in the spatiotemporal analysis (2001, 2003, 2007, 2010, 2012, 2013, 2014, 2015, 2016, 2017, 2018, and 2019) showed a better correlation with the ET–MODIS product (Figure 5). In any case, the results indicate that rainfall is the main driver of the spectral behavior of evapotranspiration [10,12].
Silva et al. [15], also studying biophysical indices from the MODIS sensor in the semiarid region of NEB, emphasized that the period from 2012 to 2019 was the most impacted in the spatiotemporal analysis from 2000 to 2019. The authors observed through NDVI and water indices (MNDWI and NDWI) that the resilience of vegetation cover and water bodies was affected by the intensity and duration of severe drought during this period, leading to an increase in environmental degradation processes in the region. Costa et al. [32], studying extreme climate indices between 1961 and 2014 in NEB, highlighted a reduction in total annual rainfall and a decrease in the frequency of rainy days in the region. In addition, emphasizing the most critical period of this study (from 2012 to 2019), Cunha et al. [45] also pointed out that, in a study on extreme drought events in Brazil based on meteorology and remote sensing, the period from 2011 to 2019 was the most severe drought event in the last 60 years, with NEB being one of the most affected regions. Marengo et al. [34] reported areas affected by drought in NEB from 2000 to 2020, where the results showed great intensity between 2012 and 2018, highlighting more specifically that, in 2012, around 60% of the semiarid region of NEB was affected by severe and exceptional drought.

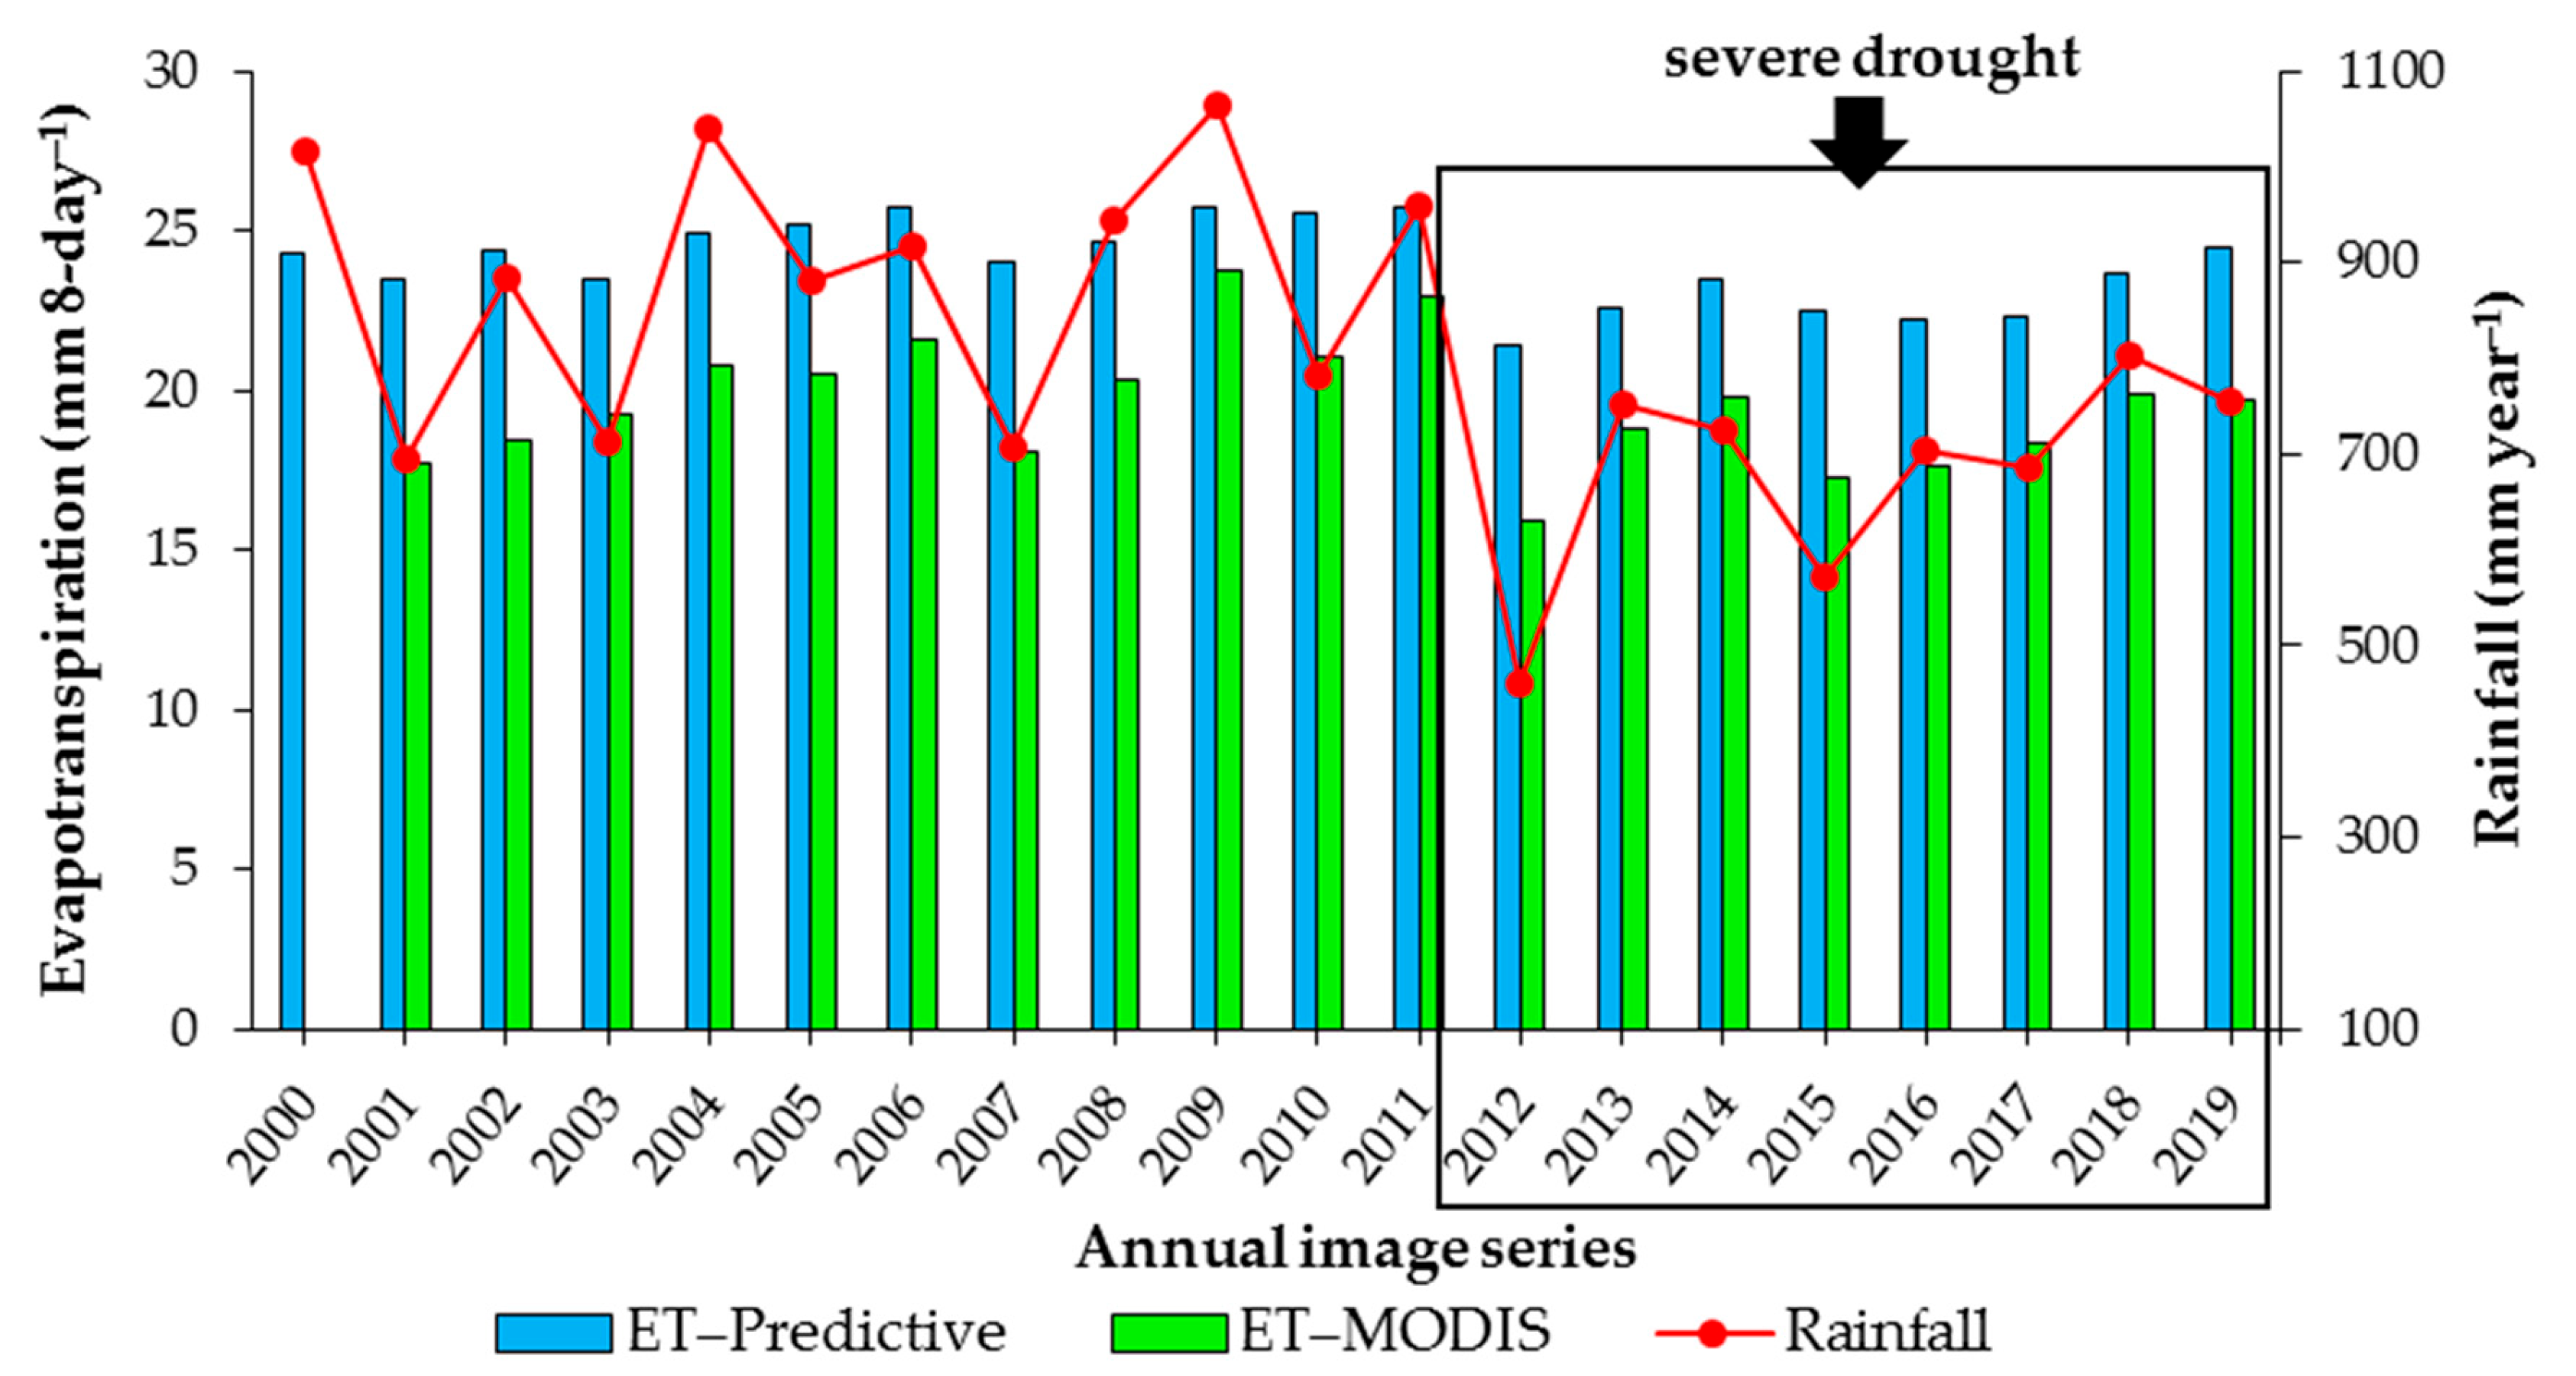
3.3. Quantitative and Spatiotemporal Variability in NEB

Table 5 provides the statistical values for the annual quantitative and spatiotemporal variability of the parameters Tsup, ET–MODIS, and ET–Predictive, in NEB between 2000 and 2019. Tsup highlighted average values between 31.01 and 34.07 °C, ET–MODIS ranged from 15.91 to 23.78 mm 8-day−1, while ET–Predictive was between 21.42 and 25.75 mm 8-day−1.
The pixel-to-pixel results of the thematic maps of ET–MODIS exhibited patterns of spatiotemporal behavior with moderate variability, with CV values ranging from 31.96 to 54.49%. In contrast, Tsup showed patterns of spatiotemporal behavior with low variability, with CV values between 7.54 and 9.54% (Table 5). Previous studies have confirmed spectral characteristics for evapotranspiration with moderate variability using other satellites [54], while Tsup also displayed these characteristics of low variability [21,61]. On the other hand, the pixel-to-pixel results of the thematic maps of ET–Predictive showed patterns of spatiotemporal behavior with high variability, with CV values around 100% (Table 5), following the criteria of Warrick and Nielsen [82]. This behavior was mainly due to interpreting the characteristics of the vegetation indices, which typically exhibit CV values ranging from moderate to high variability [11,14,51,61].
Furthermore, it is noteworthy that, according to the Pearson correlation analysis, the ET–MODIS maps showed an excellent negative linear relationship with Tsup, with a value of −0.9. Therefore, the temporal variability and characterization of quantitative results for Tsup, ET–MODIS, and ET–Predictive in NEB are an essential part of climate and environmental monitoring. This is crucial for planning actions and decision making, especially for assessing the environmental impacts in the region, interpreted through changes in LULC conditions, which can result in degraded and desertified areas.
From the perspective of vegetation cover, the minimum Tsup values were mainly found over preserved and transitional areas, such as in the Amazon, Atlantic Forest, and Cerrado biomes, while the highest values were mainly found over the vegetation cover of the Caatinga biome. In this ecosystem, minimum values near zero were observed for ET–MODIS and ET–Predictive, that is, over the semiarid regions of NEB that have high climatic variability and pronounced water deficit (Table 5).
It is worth noting that pixels with minimum values of zero detected by ET–Predictive were in open water bodies and exposed soil areas. Regarding the maximum values, which were around 80 mm 8-day−1, it is noteworthy that they occurred in isolated pixels in all years. The main maximum ET–Predictive values were between 50 and 75 mm 8-day−1 (Table 5).
Figure 6 also highlights the temporal analysis concerning the average statistics of ET–Predictive and ET–MODIS in relation to surface temperature (Tsup) (8-day MODIS sensor products) between 2000 and 2019. It is worth noting that the graph presents the annual behavioral pattern depending on the average values of both parameters, as shown in the previous table (Table 5). In this sense, as already highlighted in some results of this study, it was confirmed that the period between 2012 and 2019 stands out for presenting a pattern of critical change for the region. The insights into high temperatures and low evapotranspiration rates identified the impact on vegetation dynamics. The geospatial products provided insights into significantly changing conditions in different areas of NEB.

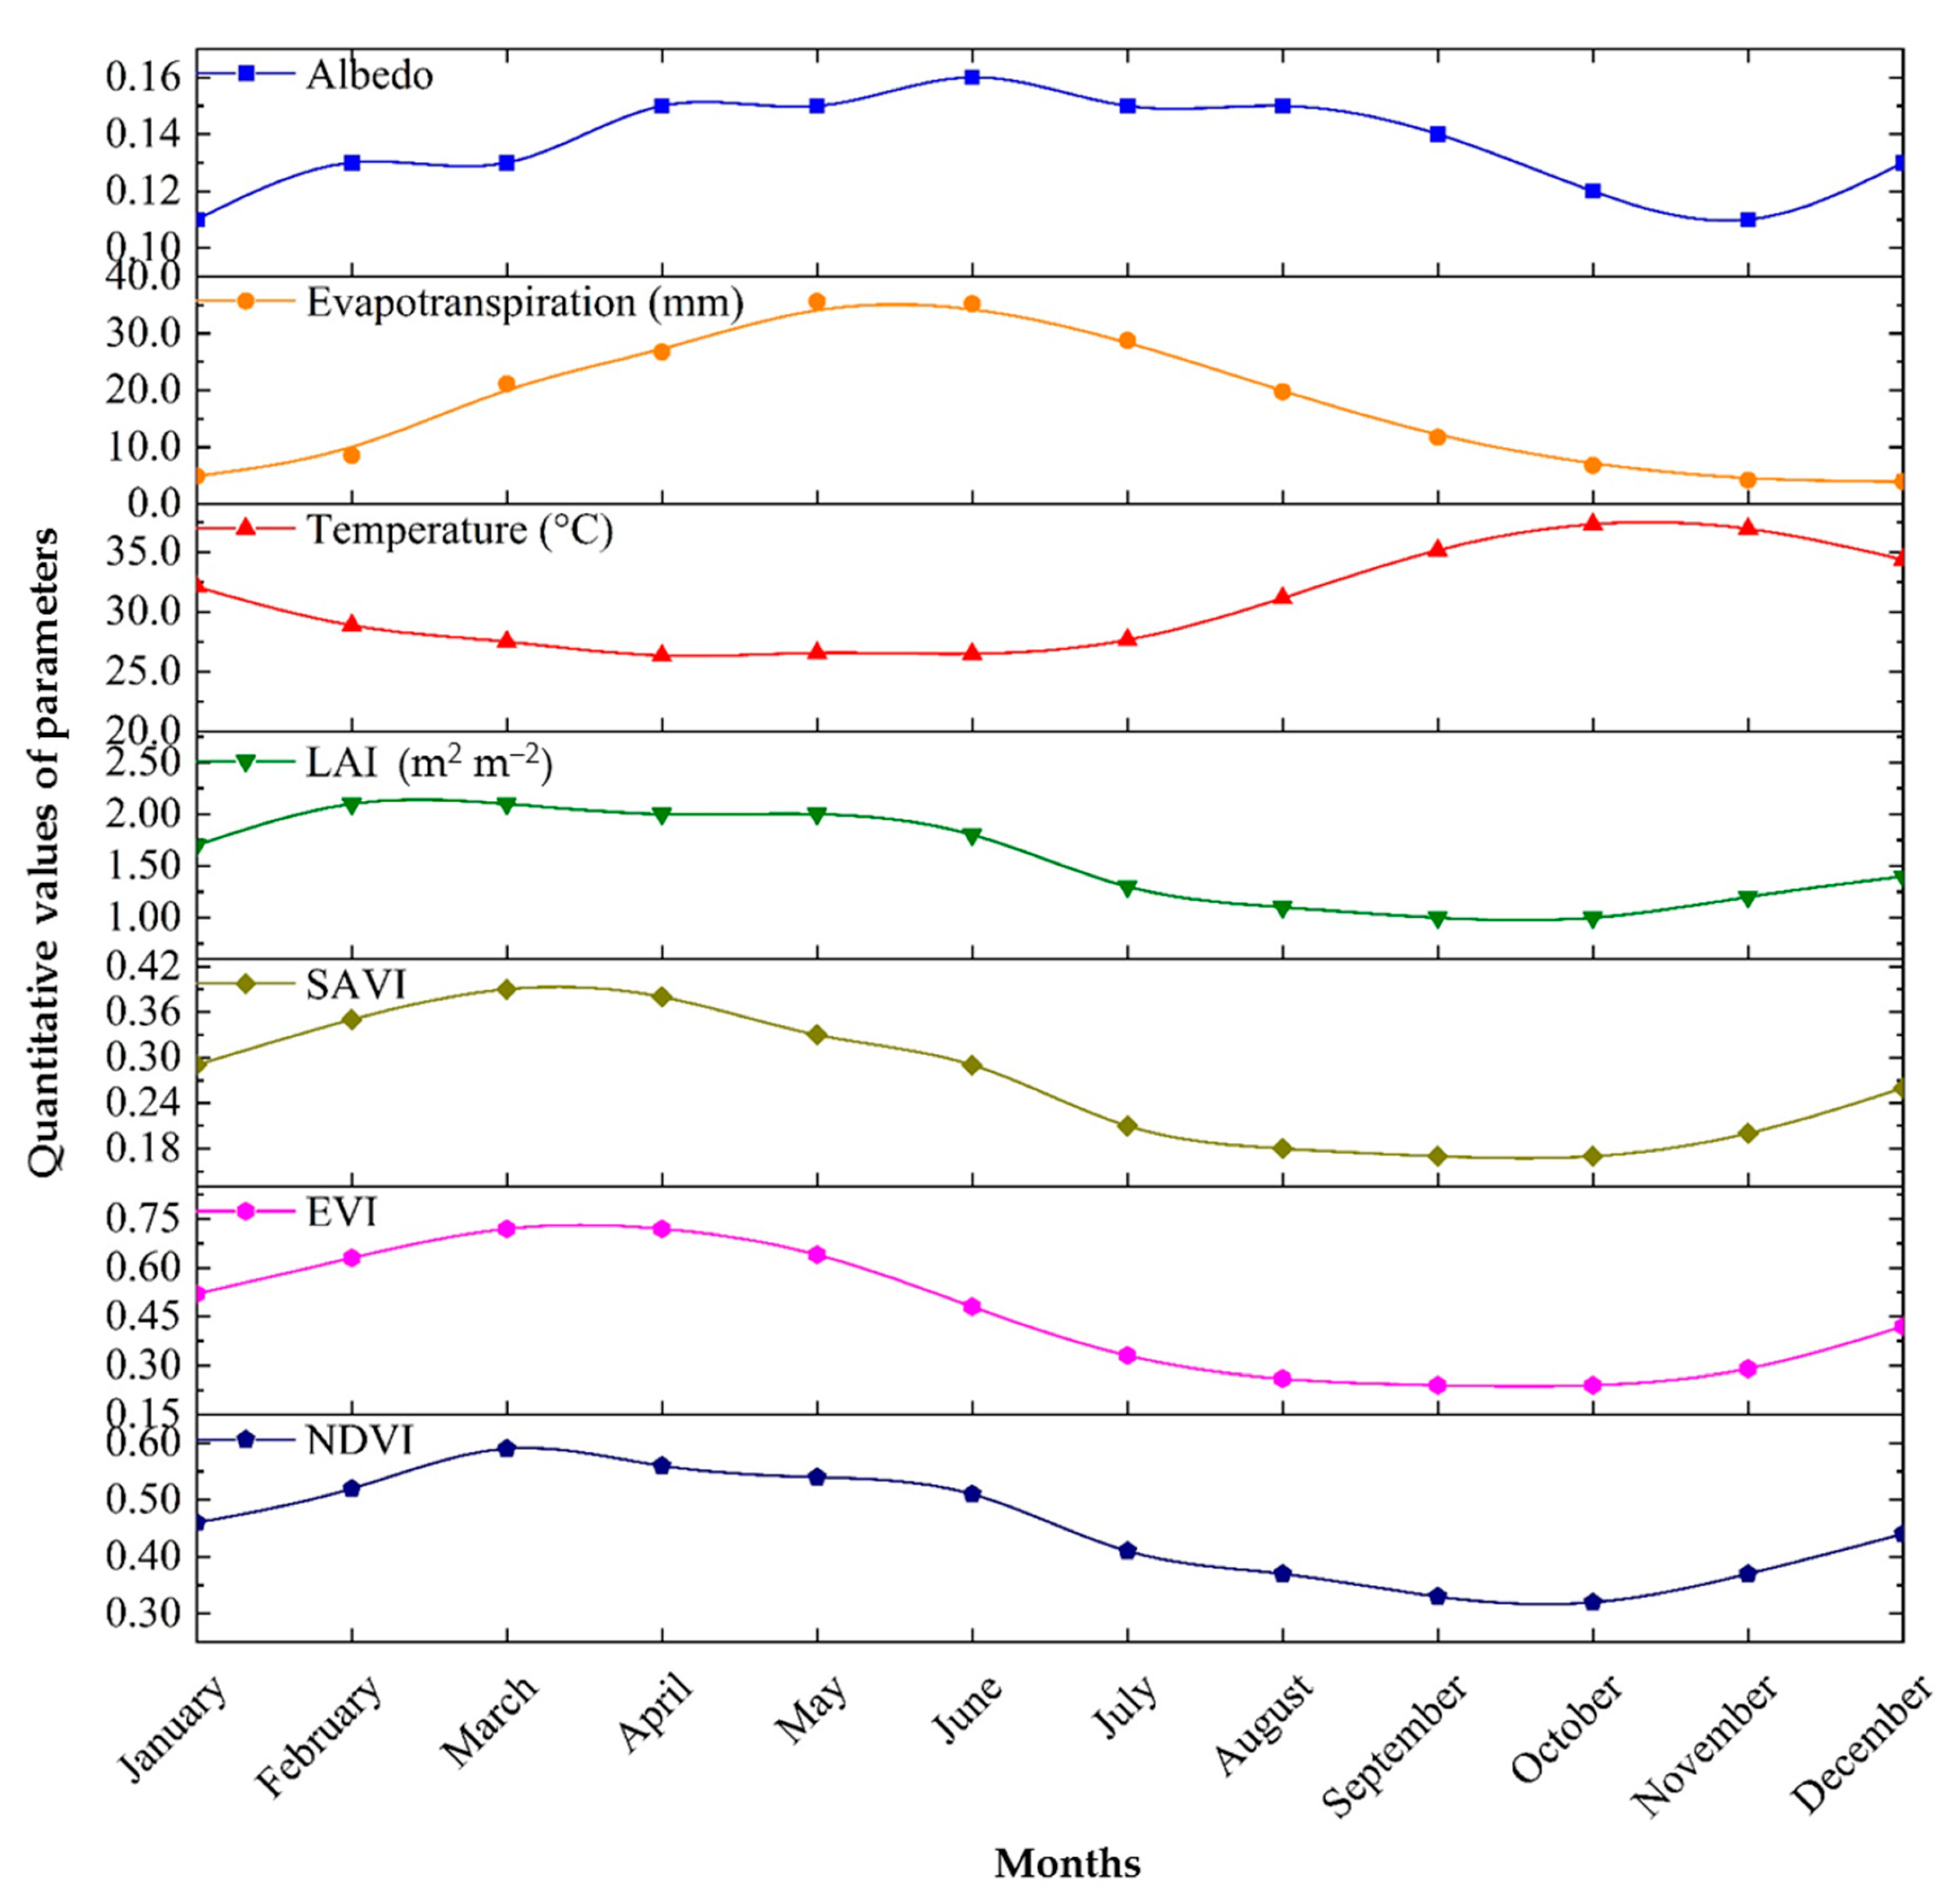
3.4. Seasonality of Biophysical Parameters and ET–MODIS in NEB

The Figure 7 shows the seasonality of surface biophysical parameters, such as albedo and surface temperature, ET–MODIS, and vegetation indices (i.e., NDVI, EVI, SAVI, and LAI) for NEB from 2001 to 2019. The reference values are the monthly average pixels during the spatiotemporal analysis.
In the seasonal analysis, the surface albedo differed from the other parameters, not showing a satisfactory adjustment throughout the months of the spatiotemporal analysis. However, Mariano et al. [10] emphasized that albedo is a significant part of the surface energy balance, being one of the main stimulators of the evapotranspiration process in the partitioning of sensible and latent heat fluxes.
The Caatinga vegetation, predominant in NEB, is known to have a high resilience, meaning that this ecosystem promotes an immediate formation of vegetation biomass and an increase in leaf canopy in direct response to rainfall events [21,44,51]. In this sense, exclusively in the Caatinga biome regions, rainfall leads to a rapid return of the components of energy balance, which may have directly affected the seasonal albedo values.
The results of Tsup and ET–MODIS highlighted spectral behavioral patterns with an inversely proportional relationship, with ET–MODIS conditioned to the spectral behavior of vegetation cover, according to NDVI, EVI, SAVI, and LAI (Figure 7). In this sense, the seasonal analysis also confirmed the interaction of ET–MODIS patterns with the spectral conditions of NDVI, EVI, SAVI, and LAI, highlighting a spectral behavior with a proportional relationship throughout the months in the temporal series. In turn, Tsup also confirmed a spectral behavioral pattern with an inversely proportional relationship as a function of NDVI, EVI, SAVI, and LAI (Figure 7).
The vegetation indices showed similar spectral behavioral patterns throughout the months, jointly exhibiting the dynamics of increased spectral conditions of vegetation biomass between January and June. Meanwhile, between July and December, the spectral conditions of biomass underwent a significant decline, considering the entire NEB (Figure 7). Bezerra et al. [62] analyzed the seasonality of biophysical parameters in the NEB state of Pernambuco in extreme precipitation years, and comparing the analyzed years 2004 and 2012, they observed an average reduction of 14% in NDVI, EVI, and SAVI during the critical period from September to December, as well as an increase in albedo (4%) and surface temperature (3%). However, the authors emphasized the importance of precipitation for vegetation dynamics in the region.
It is worth noting that NEB, and especially the BSR, exhibits notable seasonal variability of rainfall, with wet and dry periods modulated by atmospheric and oceanic patterns. One of the main mechanisms inducing rainfall, for example in the north, east, and south-central sub-regions of NEB, is the seasonal latitudinal displacement of the Intertropical Convergence Zone (ITCZ) over the Tropical Atlantic. Thus, the peak of the rainy season in the northern sub-region, occurring from February to May, is modulated by the anomalously warm North Atlantic, which favors an anomalous northward latitudinal position of the ITCZ, resulting in lower precipitation over the region. Meanwhile, the anomalously cold Tropical Atlantic favors an anomalous southward position of the ITCZ, leading to increased precipitation from March to April. The rainiest period in the eastern sub-region is between April and July, associated with increased sea breeze circulation and the influence of eastward waves from May to August. The south-central sub-region experiences higher precipitation volumes from November to February, associated with frontal and pre-frontal systems. It is also noteworthy that systems such as Upper-Level Cyclonic Vortices (ULCVs) bring rains for NEB from September to April, i.e., during spring, summer, and autumn [9,30,35,38,39,40,43,66].
However, considering that the NEB region is more than half occupied by a semiarid environment, predominated by the Caatinga biome (53.49%), the research by Maia et al. [89] on the influence of climatic seasonality in the BSR is noteworthy. The authors emphasized that the analysis of vegetation cover is complex due to the interannual variability of rainfall, warning that patterns of environmental change at the surface are not solely related to anthropogenic degrading activities considering that the dynamics of land cover conditions can also be the result of climatic factors, such as changes in rainfall, as well as local topographical conditions and physiological characteristics of the vegetation.

4. Conclusions

The analyses in this study aimed to detect and examine the response patterns of vulnerability to degradation and desertification processes based on MODIS sensor products over 20 years (2000 to 2019), gaining insights into the spatiotemporal patterns of surface energy balance components for NEB, especially in its semiarid region. The study mainly carried out pixel-to-pixel characterization of the rates of the 8-day surface temperature and actual evapotranspiration products from the MODIS sensor. These parameters were analyzed both annually and seasonally. Additionally, the seasonality of vegetation indices (NDVI, EVI, SAVI, and LAI) and surface albedo, estimated through the 8-day surface reflectance product of MODIS, was characterized for the period from 2000 to 2019. It is noteworthy that through the vegetation indices NDVI and EVI, a new model for estimating actual evapotranspiration was generated, based in the spectral conditions of the vegetation, i.e., for leaf canopy conditions of NEB and its semiarid regions.
Conditions of LULC changes significantly boosted the surface temperature, with thematic maps highlighting a pattern of high values distributed mainly in the central and northwest parts of NEB and the semiarid region of NEB. This pattern revealed the formation of heat islands. Meanwhile, actual evapotranspiration (ET–MODIS) showed significant reductions in these regions. The vegetation in these specific areas did not exhibit resilience due to the climatic components. These insights present conditions of significant change in different areas of NEB.
The pixel-to-pixel results indicated that areas with little and/or no vegetation cover favored a lower existence of available energy to be mainly distributed in processes of evapotranspiration by vegetation and agricultural crops. This condition was highly well-defined in the semiarid regions of NEB. In other words, due to a combination of factors, such as pressures from anthropogenic activities and local climatic conditions (severe droughts), these areas are extremely vulnerable to degradation and desertification processes.
The ET–Predictive model via NDVI and EVI also detected a pattern of spectral behavior over time, with degrading effects in the semiarid region of NEB. Even ET–Predictive showed high sensitivity to the green conditions of vegetation cover and was influenced by the maximum values of the spatiotemporal analysis, confirming that the semiarid region of NEB has lost significant resilience in the sense of degraded vegetation health and water loss. The model’s insights demonstrate changing conditions in vegetation dynamics.
These components of energy balance are highly interconnected with climatological conditions and are also a function of the hydrological and environmental conditions, with the spectral patterns of vegetation variability being the result of the impact of pronounced water deficit conditions in NEB regions, and mainly greater aridity conditions in the semiarid region of NEB.
Therefore, in the absence of data and minimal conditions for climate and environmental monitoring in NEB regions, it is recommended to use and apply the predictive model of actual evapotranspiration (ET–Predictive) established in this study, both from other satellites/sensors and for study areas at the local and regional scale.
Despite the overestimations observed in the results of the products used in this study, the potential for large-scale and long-term climate and environmental monitoring by the MODIS sensor is noteworthy. The increased levels of mapping and geospatial diagnosis through remote sensing techniques and satellite imagery are widely varied and provide effective support for constant applications in earth sciences research throughout the world, mainly due to a more accessible cost/benefit ratio. This is crucial for adjustments in planning actions and in managing decision making in a rapid, effective, and more sustainable manner regarding water and natural resources.

Author Contributions

Conceptualization, J.L.B.d.S., M.V.d.S., H.F.E.d.O., M.M., P.M.O.L. and G.B.d.A.M.; methodology, J.L.B.d.S., M.V.d.S., A.A.d.C., A.M.d.R.F.J., A.C.B. and P.M.O.L.; software, J.L.B.d.S., M.V.d.S., A.M.d.R.F.J., J.A.O.S.S., A.A.d.C. and A.C.B.; validation, J.L.B.d.S. and M.V.d.S.; formal analysis, J.L.B.d.S., A.A.d.C., A.M.d.R.F.J., E.F.d.S., J.A.O.S.S., I.T.R.C. and M.B.F.; investigation, J.L.B.d.S., A.A.d.C., G.B.d.A.M., A.M.d.R.F.J., A.C.B., J.A.O.S.S., M.V.d.S. and J.F.d.O.-J.; resources, J.L.B.d.S., M.V.d.S., A.A.d.C., H.F.E.d.O., M.M., G.B.d.A.M. and P.M.O.L.; data curation, J.L.B.d.S., A.A.d.C., M.V.d.S., A.M.d.R.F.J., I.T.R.C., A.C.B., J.A.O.S.S., M.B.F. and M.V.d.S.; writing—original draft preparation, J.L.B.d.S., A.A.d.C., M.V.d.S. and A.C.B.; writing—review and editing, J.L.B.d.S., J.F.d.O.-J., A.A.d.C., I.T.R.C., A.M.d.R.F.J., A.C.B., M.B.F., J.A.O.S.S., E.F.d.S., P.M.O.L., H.F.E.d.O., M.M., G.B.d.A.M. and M.V.d.S.; visualization, J.L.B.d.S., A.A.d.C., G.B.d.A.M., A.C.B., J.A.O.S.S., M.B.F., E.F.d.S., M.V.d.S., J.F.d.O.-J., M.M. and I.T.R.C.; supervision, J.L.B.d.S., M.V.d.S., H.F.E.d.O., G.B.d.A.M. and P.M.O.L.; project administration, J.L.B.d.S., G.B.d.A.M., P.M.O.L., H.F.E.d.O. and M.V.d.S.; funding acquisition, J.L.B.d.S., M.V.d.S., A.M.d.R.F.J., P.M.O.L., H.F.E.d.O. and M.M. All authors have read and agreed to the published version of the manuscript.

Funding

This research received no external funding.

Data Availability Statement

Data are available in a publicly accessible repository that does not issue DOIs. Publicly available datasets were analyzed in this study. These data can be found here: National Aeronautics and Space Administration/Moderate Resolution Imaging Spectroradiometer. MODIS Data Products. Available at: <https://modis.gsfc.nasa.gov/data/dataprod/>. Accessed on 2 January 2021.

Acknowledgments

Cerrado Irrigation Graduate Program of the Goiano Federal Institute—Campus Ceres for supporting the research, as well as the partner universities for their contribution to the present study. Furthermore, the authors would like to express their sincere appreciation to National Aeronautics and Space Administration—NASA/Moderate Resolution Imaging Spectroradiometer—MODIS for providing free MODIS Data Products, and also to Google for providing availability of the Google Earth Engine (GEE) platform, where digital cloud processing of satellite data was carried out using its library. A.M.d.R.F.J. acknowledges support by the Research Support Foundation of the State of São Paulo (2023/05323-4). All individuals included in this section have consented to the acknowledgement.

Conflicts of Interest

The authors declare no conflict of interest.

References

  1. Feng, S.; Fu, Q. Expansion of Global Drylands under a Warming Climate. Atmos. Chem. Phys. 2013, 13, 10081–10094. [Google Scholar] [CrossRef]
  2. Morante-Carballo, F.; Montalván-Burbano, N.; Quiñonez-Barzola, X.; Jaya-Montalvo, M.; Carrión-Mero, P. What Do We Know about Water Scarcity in Semi-Arid Zones? A Global Analysis and Research Trends. Water 2022, 14, 2685. [Google Scholar] [CrossRef]
  3. Falkenmark, M.; Lundqvist, J.; Widstrand, C. Macro-scale Water Scarcity Requires Micro-scale Approaches. Nat. Resour. Forum 1989, 13, 258–267. [Google Scholar] [CrossRef] [PubMed]
  4. D’Odorico, P.; Bhattachan, A.; Davis, K.F.; Ravi, S.; Runyan, C.W. Global Desertification: Drivers and Feedbacks. Adv. Water Resour. 2013, 51, 326–344. [Google Scholar] [CrossRef]
  5. Sharma, P.J.; Patel, P.L.; Jothiprakash, V. Impact of Rainfall Variability and Anthropogenic Activities on Streamflow Changes and Water Stress Conditions across Tapi Basin in India. Sci. Total Environ. 2019, 687, 885–897. [Google Scholar] [CrossRef] [PubMed]
  6. Leng, X.; Feng, X.; Fu, B. Driving Forces of Agricultural Expansion and Land Degradation Indicated by Vegetation Continuous Fields (VCF) Data in Drylands from 2000 to 2015. Glob. Ecol. Conserv. 2020, 23, e01087. [Google Scholar] [CrossRef]
  7. Vieira, R.M.S.P.; Tomasella, J.; Alvalá, R.C.S.; Sestini, M.F.; Affonso, A.G.; Rodriguez, D.A.; Barbosa, A.A.; Cunha, A.P.M.A.; Valles, G.F.; Crepani, E.; et al. Identifying Areas Susceptible to Desertification in the Brazilian Northeast. Solid. Earth 2015, 6, 347–360. [Google Scholar] [CrossRef]
  8. Brito, S.S.B.; Cunha, A.P.M.A.; Cunningham, C.C.; Alvalá, R.C.; Marengo, J.A.; Carvalho, M.A. Frequency, Duration and Severity of Drought in the Semiarid Northeast Brazil Region. Int. J. Climatol. 2018, 38, 517–529. [Google Scholar] [CrossRef]
  9. Marengo, J.A.; Alves, L.M.; Alvala, R.C.S.; Cunha, A.P.; Brito, S.; Moraes, O.L.L. Climatic Characteristics of the 2010–2016 Drought in the Semiarid Northeast Brazil Region. Acad. Bras. Cienc. 2018, 90, 1973–1985. [Google Scholar] [CrossRef]
  10. Mariano, D.A.; dos Santos, C.A.C.; Wardlow, B.D.; Anderson, M.C.; Schiltmeyer, A.V.; Tadesse, T.; Svoboda, M.D. Use of Remote Sensing Indicators to Assess Effects of Drought and Human-Induced Land Degradation on Ecosystem Health in Northeastern Brazil. Remote Sens. Environ. 2018, 213, 129–143. [Google Scholar] [CrossRef]
  11. da Silva, J.L.B.; de Albuquerque Moura, G.B.; Lopes, P.M.O.; França e Silva, Ê.F.; Ortiz, P.F.S.; de Oliveira Silva, D.A.; Da Silva, M.V.; de Souza Guedes, R.V. Monitoramento Espaço-Temporal Do Risco de Degradação Ambiental e Desertificação Por Sensoriamento Remoto Em Região Semiárida. Rev. Bras. Geogr. Física 2020, 13, 544–563. [Google Scholar] [CrossRef]
  12. De Oliveira, M.L.; dos Santos, C.A.C.; de Oliveira, G.; Silva, M.T.; da Silva, B.B.; de Brito Leite Cunha, J.E.; Ruhoff, A.; Santos, C.A.G. Remote Sensing-Based Assessment of Land Degradation and Drought Impacts over Terrestrial Ecosystems in Northeastern Brazil. Sci. Total Environ. 2022, 835, 155490. [Google Scholar] [CrossRef] [PubMed]
  13. Barbosa, H.A. Flash Drought and Its Characteristics in Northeastern South America during 2004–2022 Using Satellite-Based Products. Atmosphere 2023, 14, 1629. [Google Scholar] [CrossRef]
  14. Refati, D.C.; da Silva, J.L.B.; Macedo, R.S.; da Cunha Correia Lima, R.; da Silva, M.V.; Pandorfi, H.; Silva, P.C.; de Oliveira-Júnior, J.F. Influence of Drought and Anthropogenic Pressures on Land Use and Land Cover Change in the Brazilian Semiarid Region. J. S. Am. Earth Sci. 2023, 126, 104362. [Google Scholar] [CrossRef]
  15. Da Silva, J.L.B.; de Albuquerque Moura, G.B.; da Silva, M.V.; de Oliveira-Júnior, J.F.; Jardim, A.M.D.R.F.; Refati, D.C.; da Cunha Correia Lima, R.; de Carvalho, A.A.; Ferreira, M.B.; de Brito, J.I.B.; et al. Environmental Degradation of Vegetation Cover and Water Bodies in the Semiarid Region of the Brazilian Northeast via Cloud Geoprocessing Techniques Applied to Orbital Data. J. S. Am. Earth Sci. 2023, 121, 104164. [Google Scholar] [CrossRef]
  16. Vieira, R.M.d.S.P.; Tomasella, J.; Cunha, A.P.M.d.A.; Barbosa, A.A.; Pompeu, J.; Ferreira, Y.; Santos, F.C.; Alves, L.M.; Ometto, J. Socio-Environmental Vulnerability to Drought Conditions and Land Degradation: An Assessment in Two Northeastern Brazilian River Basins. Sustainability 2023, 15, 8029. [Google Scholar] [CrossRef]
  17. Palácio, H.A.Q.; Andrade, E.M.; Santos, J.C.N.; Neto, J.R.A.; Brasil, P.P. Emergy Evaluation of Semi-Arid Watersheds under Different Management Strategies. Trans. ASABE 2013, 56, 1357–1363. [Google Scholar] [CrossRef]
  18. Schulz, C.; Koch, R.; Cierjacks, A.; Kleinschmit, B. Land Change and Loss of Landscape Diversity at the Caatinga Phytogeographical Domain—Analysis of Pattern-Process Relationships with MODIS Land Cover Products (2001–2012). J. Arid. Environ. 2017, 136, 54–74. [Google Scholar] [CrossRef]
  19. De Lucena, M.S. Aspectos Ambientais Das Áreas Susceptíveis à Desertificação e Características Socioambientais Do Núcleo de Desertificação Do Seridó Do Rio Grande Do Norte (RN) E Paraíba (PB). HOLOS 2019, 5, 1–17. [Google Scholar] [CrossRef]
  20. Ledru, M.-P.; Jeske-Pieruschka, V.; Bremond, L.; Develle, A.-L.; Sabatier, P.; Martins, E.S.P.R.; de Freitas Filho, M.R.; Fontenele, D.P.; Arnaud, F.; Favier, C.; et al. When Archives Are Missing, Deciphering the Effects of Public Policies and Climate Variability on the Brazilian Semi-Arid Region Using Sediment Core Studies. Sci. Total Environ. 2020, 723, 137989. [Google Scholar] [CrossRef]
  21. Da Silva, J.L.B.; de Albuquerque Moura, G.B.; da Silva, M.V.; Lopes, P.M.O.; de Souza Guedes, R.V.; e Silva, Ê.F.D.F.; Ortiz, P.F.S.; de Moraes Rodrigues, J.A. Changes in the Water Resources, Soil Use and Spatial Dynamics of Caatinga Vegetation Cover over Semiarid Region of the Brazilian Northeast. Remote Sens. Appl. 2020, 20, 100372. [Google Scholar] [CrossRef]
  22. Sathler, D. Understanding Human Development, Poverty and Water Scarcity Patterns in the Brazilian Semi-Arid through Cluster Analysis. Environ. Sci. Policy 2021, 125, 167–178. [Google Scholar] [CrossRef]
  23. De Barros de Sousa, L.; de Assunção Montenegro, A.A.; da Silva, M.V.; Almeida, T.A.B.; de Carvalho, A.A.; da Silva, T.G.F.; de Lima, J.L.M.P. Spatiotemporal Analysis of Rainfall and Droughts in a Semiarid Basin of Brazil: Land Use and Land Cover Dynamics. Remote Sens. 2023, 15, 2550. [Google Scholar] [CrossRef]
  24. Pinheiro, A.G.; Dos Santos, J.C.N.; Palácio, H.A.D.Q.; De Araújo Neto, J.R.; De Andrade, E.M. Eficiência da cobertura vegetal na redução das perdas de água e solo no município de iguatu. Irriga 2018, 23, 133–142. [Google Scholar] [CrossRef]
  25. Andrade, E.M.; Guerreiro, M.J.S.; Palácio, H.A.Q.; Campos, D.A. Ecohydrology in a Brazilian Tropical Dry Forest: Thinned Vegetation Impact on Hydrological Functions and Ecosystem Services. J. Hydrol. Reg. Stud. 2020, 27, 100649. [Google Scholar] [CrossRef]
  26. Da Silva, M.V.; Pandorfi, H.; de Almeida, G.L.P.; de Lima, R.P.; dos Santos, A.; Jardim, A.M.D.R.F.; Rolim, M.M.; da Silva, J.L.B.; Batista, P.H.D.; da Silva, R.A.B.; et al. Spatio-Temporal Monitoring of Soil and Plant Indicators under Forage Cactus Cultivation by Geoprocessing in Brazilian Semi-Arid Region. J. S. Am. Earth Sci. 2021, 107, 103155. [Google Scholar] [CrossRef]
  27. De Oliveira Borges Neto, I.; Xavier, R.A.; de Souza, B.I.; Santos, L.J.C.; Soares, D.A.; de Souza, J.J.L.L. Preliminary Experimental Data on Surface Runoff and Soil Loss in the Caatinga. Earth Surf. Process Landf. 2023, 48, 1712–1723. [Google Scholar] [CrossRef]
  28. Da Rosa Ferraz Jardim, A.M.; de Morais, J.E.F.; de Souza, L.S.B.; de Carvalho, D.; da Silva, M.V.; Pandorfi, H.; de Oliveira-Júnior, J.F.; da Silva, J.L.B.; Steidle Neto, A.J.; Morellato, L.P.C.; et al. A Systematic Review of Energy and Mass Fluxes, and Biogeochemical Processes in Seasonally Dry Tropical Forests and Cactus Ecosystems. J. S. Am. Earth Sci. 2023, 126, 104330. [Google Scholar] [CrossRef]
  29. Chen, Y.; Liu, X.; Ma, Y.; He, J.; He, Y.; Zheng, C.; Gao, W.; Ma, C. Variability Analysis and the Conservation Capacity of Soil Water Storage under Different Vegetation Types in Arid Regions. Catena 2023, 230, 107269. [Google Scholar] [CrossRef]
  30. Marengo, J.A.; Bernasconi, M. Regional Differences in Aridity/Drought Conditions over Northeast Brazil: Present State and Future Projections. Clim. Change 2015, 129, 103–115. [Google Scholar] [CrossRef]
  31. Cunha, A.P.M.A.; Tomasella, J.; Ribeiro-Neto, G.G.; Brown, M.; Garcia, S.R.; Brito, S.B.; Carvalho, M.A. Changes in the Spatial–Temporal Patterns of Droughts in the Brazilian Northeast. Atmos. Sci. Lett. 2018, 19, e855. [Google Scholar] [CrossRef]
  32. Costa, R.L.; Macedo de Mello Baptista, G.; Gomes, H.B.; Daniel dos Santos Silva, F.; Lins da Rocha Júnior, R.; de Araújo Salvador, M.; Herdies, D.L. Analysis of Climate Extremes Indices over Northeast Brazil from 1961 to 2014. Weather Clim. Extrem. 2020, 28, 100254. [Google Scholar] [CrossRef]
  33. Marengo, J.A.; Cunha, A.P.M.A.; Nobre, C.A.; Ribeiro Neto, G.G.; Magalhaes, A.R.; Torres, R.R.; Sampaio, G.; Alexandre, F.; Alves, L.M.; Cuartas, L.A.; et al. Assessing Drought in the Drylands of Northeast Brazil under Regional Warming Exceeding 4 °C. Nat. Hazards 2020, 103, 2589–2611. [Google Scholar] [CrossRef]
  34. Marengo, J.A.; Galdos, M.V.; Challinor, A.; Cunha, A.P.; Marin, F.R.; dos Santos Vianna, M.; Alvala, R.C.S.; Alves, L.M.; Moraes, O.L.; Bender, F. Drought in Northeast Brazil: A Review of Agricultural and Policy Adaptation Options for Food Security. Clim. Resil. Sustain. 2022, 1, e17. [Google Scholar] [CrossRef]
  35. Hastenrath, S. Exploring the Climate Problems of Brazil’s Nordeste: A Review. Clim. Change 2012, 112, 243–251. [Google Scholar] [CrossRef]
  36. Lyra, G.B.; Oliveira-Júnior, J.F.; Zeri, M. Cluster Analysis Applied to the Spatial and Temporal Variability of Monthly Rainfall in Alagoas State, Northeast of Brazil. Int. J. Climatol. 2014, 34, 3546–3558. [Google Scholar] [CrossRef]
  37. Hounsou-gbo, G.A.; Araujo, M.; Bourlès, B.; Veleda, D.; Servain, J. Tropical Atlantic Contributions to Strong Rainfall Variability Along the Northeast Brazilian Coast. Adv. Meteorol. 2015, 2015, 902084. [Google Scholar] [CrossRef]
  38. Hounsou-Gbo, G.A.; Servain, J.; Araujo, M.; Martins, E.S.; Bourlès, B.; Caniaux, G. Oceanic Indices for Forecasting Seasonal Rainfall over the Northern Part of Brazilian Northeast. Am. J. Clim. Change 2016, 5, 261–274. [Google Scholar] [CrossRef]
  39. Marengo, J.A.; Torres, R.R.; Alves, L.M. Drought in Northeast Brazil—Past, Present, and Future. Theor. Appl. Climatol. 2017, 129, 1189–1200. [Google Scholar] [CrossRef]
  40. Oliveira, P.T.; Santos e Silva, C.M.; Lima, K.C. Climatology and Trend Analysis of Extreme Precipitation in Subregions of Northeast Brazil. Theor. Appl. Clim. 2017, 130, 77–90. [Google Scholar] [CrossRef]
  41. Lucena, R.L.; Cabral Júnior, J.B.; Steinke, E.T. Comportamento Hidroclimatológico Do Estado Do Rio Grande Do Norte e Do Município de Caicó. Rev. Bras. Meteorol. 2018, 33, 485–496. [Google Scholar] [CrossRef]
  42. Timmermann, A.; An, S.-I.; Kug, J.-S.; Jin, F.-F.; Cai, W.; Capotondi, A.; Cobb, K.M.; Lengaigne, M.; McPhaden, M.J.; Stuecker, M.F.; et al. El Niño–Southern Oscillation Complexity. Nature 2018, 559, 535–545. [Google Scholar] [CrossRef] [PubMed]
  43. De Albuquerque Moura, G.B.; de Brito, J.I.B.; de Assis Salviano de Sousa Sousa, F.; Cavalcanti, E.P.; da Silva, J.L.B.; Nascimento, C.R.; Lopes, P.M.O. Identificação de Preditores Para as Chuvas Do Setor Leste Do Nordeste Do Brasil Utilizando Análise de Correlação Canônica. Rev. Bras. Geogr. Física 2020, 13, 1463–1482. [Google Scholar] [CrossRef]
  44. Tomasella, J.; Silva Pinto Vieira, R.M.; Barbosa, A.A.; Rodriguez, D.A.; de Oliveira Santana, M.; Sestini, M.F. Desertification Trends in the Northeast of Brazil over the Period 2000–2016. Int. J. Appl. Earth Obs. Geoinf. 2018, 73, 197–206. [Google Scholar] [CrossRef]
  45. Cunha, A.P.M.A.; Zeri, M.; Deusdará Leal, K.; Costa, L.; Cuartas, L.A.; Marengo, J.A.; Tomasella, J.; Vieira, R.M.; Barbosa, A.A.; Cunningham, C.; et al. Extreme Drought Events over Brazil from 2011 to 2019. Atmosphere 2019, 10, 642. [Google Scholar] [CrossRef]
  46. Brasil Neto, R.M.; Santos, C.A.G.; do Nascimento, T.V.M.; da Silva, R.M.; dos Santos, C.A.C. Evaluation of the TRMM Product for Monitoring Drought over Paraíba State, Northeastern Brazil: A Statistical Analysis. Remote Sens. 2020, 12, 2184. [Google Scholar] [CrossRef]
  47. IBGE Produto Interno Bruto—PIB. Available online: https://www.ibge.gov.br/explica/pib.php (accessed on 20 February 2024).
  48. Da Silva Pinto Vieira, R.M.; do Amaral Cunha, A.P.M.; dos Santos Alvalá, R.C.; Carvalho, V.C.; Ferraz Neto, S.; Sestini, M.F. Land Use and Land Cover Map of a Semiarid Region of Brazil for Meteorological and Climatic Models. Rev. Bras. Meteorol. 2013, 28, 129–138. [Google Scholar] [CrossRef]
  49. Jardim, A.M.d.R.F.; Araújo Júnior, G.d.N.; Silva, M.V.d.; Santos, A.d.; Silva, J.L.B.d.; Pandorfi, H.; Oliveira-Júnior, J.F.d.; Teixeira, A.H.d.C.; Teodoro, P.E.; de Lima, J.L.M.P.; et al. Using Remote Sensing to Quantify the Joint Effects of Climate and Land Use/Land Cover Changes on the Caatinga Biome of Northeast Brazilian. Remote Sens. 2022, 14, 1911. [Google Scholar] [CrossRef]
  50. Ferreira, T.R.; Maguire, M.S.; da Silva, B.B.; Neale, C.M.U.; Serrão, E.A.O.; Ferreira, J.D.; de Moura, M.S.B.; dos Santos, C.A.C.; Silva, M.T.; Rodrigues, L.N.; et al. Assessment of Water Demands for Irrigation Using Energy Balance and Satellite Data Fusion Models in Cloud Computing: A Study in the Brazilian Semiarid Region. Agric. Water Manag. 2023, 281, 108260. [Google Scholar] [CrossRef]
  51. Silva, J.L.B.; Moura, G.B.A.; Silva, Ê.F.F.; Lopes, P.M.O.; Silva, T.T.F.; Lins, F.A.C.; Silva, D.A.O.; Ortiz, P.F.S. Spatial-Temporal Dynamics of the Caatinga Vegetation Cover by Remote Sensing in Municipality of the Brazilian Semi-Arid. Rev. Bras. Ciências Agrárias Braz. J. Agric. Sci. 2019, 14, 1–10. [Google Scholar] [CrossRef]
  52. Mu, Q.; Heinsch, F.A.; Zhao, M.; Running, S.W. Development of a Global Evapotranspiration Algorithm Based on MODIS and Global Meteorology Data. Remote Sens. Environ. 2007, 111, 519–536. [Google Scholar] [CrossRef]
  53. Mu, Q.; Zhao, M.; Running, S.W. Improvements to a MODIS Global Terrestrial Evapotranspiration Algorithm. Remote Sens. Environ. 2011, 115, 1781–1800. [Google Scholar] [CrossRef]
  54. Da Silva, J.L.B.; Bezerra, A.C.; de Albuquerque Moura, G.B.; da Rosa Ferraz Jardim, A.M.; Batista, P.H.D.; de Jesus, F.L.F.; Sanches, A.C.; da Silva, M.V. Spatiotemporal Dynamics of Agricultural Areas with Central Pivot Using Orbital Remote Sensing in the Brazilian Semiarid. Smart Agric. Technol. 2022, 2, 100052. [Google Scholar] [CrossRef]
  55. De Oliveira, L.M.M.; Montenegro, S.M.G.L.; da Silva, B.B.; Antonino, A.C.D.; Moura, A.E.S.S. de Evapotranspiração Real Em Bacia Hidrográfica Do Nordeste Brasileiro Por Meio Do SEBAL e Produtos MODIS. Rev. Bras. Eng. Agrícola E Ambient. 2014, 18, 1039–1046. [Google Scholar] [CrossRef]
  56. Zhang, K.; Kimball, J.S.; Running, S.W. A Review of Remote Sensing Based Actual Evapotranspiration Estimation. WIREs Water 2016, 3, 834–853. [Google Scholar] [CrossRef]
  57. Mutti, P.R.; da Silva, L.L.; de Sousa Medeiros, S.; Dubreuil, V.; Mendes, K.R.; Marques, T.V.; Lúcio, P.S.; Santos e Silva, C.M.; Bezerra, B.G. Basin Scale Rainfall-Evapotranspiration Dynamics in a Tropical Semiarid Environment during Dry and Wet Years. Int. J. Appl. Earth Obs. Geoinf. 2019, 75, 29–43. [Google Scholar] [CrossRef]
  58. Li, Z.; Chen, Y.; Wang, Y.; Fang, G. Dynamic Changes in Terrestrial Net Primary Production and Their Effects on Evapotranspiration. Hydrol. Earth Syst. Sci. 2016, 20, 2169–2178. [Google Scholar] [CrossRef]
  59. Ferreira, T.R.; da Silva, B.B.; de Moura, M.S.B.; Verhoef, A.; Nóbrega, R.L.B. The Use of Remote Sensing for Reliable Estimation of Net Radiation and Its Components: A Case Study for Contrasting Land Covers in an Agricultural Hotspot of the Brazilian Semiarid Region. Agric. Meteorol. 2020, 291, 108052. [Google Scholar] [CrossRef]
  60. Parente, L.; Ferreira, L. Assessing the Spatial and Occupation Dynamics of the Brazilian Pasturelands Based on the Automated Classification of MODIS Images from 2000 to 2016. Remote Sens. 2018, 10, 606. [Google Scholar] [CrossRef]
  61. Bezerra, A.C.; da Silva, J.L.B.; de Albuquerque Moura, G.B.; Lopes, P.M.O.; Nascimento, C.R.; Ribeiro, E.P.; Galvíncio, J.D.; da Silva, M.V. Dynamics of Land Cover and Land Use in Pernambuco (Brazil): Spatio-Temporal Variability and Temporal Trends of Biophysical Parameters. Remote Sens. Appl. 2022, 25, 100677. [Google Scholar] [CrossRef]
  62. Bezerra, A.C.; Silva, J.L.B.d.; Silva, D.A.d.O.; Nascimento, C.R.; Ribeiro, E.P.; Galvincio, J.D.; Silva, M.V.d.; Oliveira, H.F.E.d.; Mesquita, M.; Oliveira-Júnior, J.F.d.; et al. Seasonality of Biophysical Parameters in Extreme Years of Precipitation in Pernambuco: Relations, Regionalities, and Variability. Atmosphere 2023, 14, 1712. [Google Scholar] [CrossRef]
  63. Gorelick, N.; Hancher, M.; Dixon, M.; Ilyushchenko, S.; Thau, D.; Moore, R. Google Earth Engine: Planetary-Scale Geospatial Analysis for Everyone. Remote Sens. Environ. 2017, 202, 18–27. [Google Scholar] [CrossRef]
  64. IBGE Estimativas Da População Residente Para Os Municípios e Para as Unidades Da Federação|IBGE. Available online: https://www.ibge.gov.br/estatisticas/sociais/populacao/9103-estimativas-de-populacao.html?=&t=downloads (accessed on 23 January 2024).
  65. MI/SUDENE Nova Delimitação Da Região Semiárida Do Brasil/Resolução No 115, de 23 de Novembro de 2017. Available online: https://www.gov.br/sudene/pt-br (accessed on 23 January 2024).
  66. Alvares, C.A.; Stape, J.L.; Sentelhas, P.C.; de Moraes Gonçalves, J.L.; Sparovek, G. Köppen’s Climate Classification Map for Brazil. Meteorol. Z. 2013, 22, 711–728. [Google Scholar] [CrossRef] [PubMed]
  67. Cunha, A.P.M.; Alvalá, R.C.; Nobre, C.A.; Carvalho, M.A. Monitoring Vegetative Drought Dynamics in the Brazilian Semiarid Region. Agric. Meteorol. 2015, 214–215, 494–505. [Google Scholar] [CrossRef]
  68. IBGE Biomas e Sistema Costeiro-Marinho Do Brasil: Compatível Com a Escala 1: 250 000. Série Relatórios Metodológicos. v. 45 2019. 164p. Available online: https://biblioteca.ibge.gov.br/index.php/biblioteca-catalogo?view=detalhes&id=2101676 (accessed on 23 January 2024).
  69. Vermote, E.; NASA GSFC; MODAPS SIPS-NASA. MOD09A1 MODIS/Terra Surface Reflectance 8-Day L3 Global 500m SIN Grid. ArchiveSets: 61, PGE21. NASA LP DAAC.; 2015. Available online: https://lpdaac.usgs.gov/products/mod09a1v006/ (accessed on 26 January 2024).
  70. NASA/MODIS MODIS Data Products. Available online: https://modis.gsfc.nasa.gov/data/dataprod/ (accessed on 23 January 2024).
  71. Allen, R.G.; Tasumi, M.; Trezza, R. Satellite-Based Energy Balance for Mapping Evapotranspiration with Internalized Calibration (METRIC)—Model. J. Irrig. Drain. Eng. 2007, 133, 380–394. [Google Scholar] [CrossRef]
  72. Tasumi, M.; Allen, R.G.; Trezza, R. At-Surface Reflectance and Albedo from Satellite for Operational Calculation of Land Surface Energy Balance. J. Hydrol. Eng. 2008, 13, 51–63. [Google Scholar] [CrossRef]
  73. Huete, A.R. A Soil-Adjusted Vegetation Index (SAVI). Remote Sens. Environ. 1988, 25, 295–309. [Google Scholar] [CrossRef]
  74. Huete, A.; Didan, K.; Miura, T.; Rodriguez, E.P.; Gao, X.; Ferreira, L.G. Overview of the Radiometric and Biophysical Performance of the MODIS Vegetation Indices. Remote Sens. Environ. 2002, 83, 195–213. [Google Scholar] [CrossRef]
  75. Huete, A. A Comparison of Vegetation Indices over a Global Set of TM Images for EOS-MODIS. Remote Sens. Environ. 1997, 59, 440–451. [Google Scholar] [CrossRef]
  76. Allen, R.G.; Tasumi, M.; Trezza, R.; Waters, R.; Bastiaanssen, W. SEBAL (Surface Energy Balance Algorithms for Land). Adv. Train. Users Man. Ida. Implement. Version 2002, 1, 97. [Google Scholar]
  77. Batista, P.H.D.; de Almeida, G.L.P.; da Silva, J.L.B.; Pandorfi, H.; da Silva, M.V.; Batista da Silva, R.A.; Neves de Melo, M.V.; Costa Lins, F.A.; Cordeiro Junior, J.J.F. Short-Term Grazing and Its Impacts on Soil and Pasture Degradation. Dyna 2020, 87, 123–128. [Google Scholar] [CrossRef]
  78. Wan, Z.; Zhang, Y.; Zhang, Q.; Li, Z. Validation of the Land-Surface Temperature Products Retrieved from Terra Moderate Resolution Imaging Spectroradiometer Data. Remote Sens. Environ. 2002, 83, 163–180. [Google Scholar] [CrossRef]
  79. Monteith, J.L. Evaporation and Environment In Symposia of the Society for Experimental Biology 1965. Symp. Soc. Exp. Biol. 1965, 19, 205–234. [Google Scholar] [PubMed]
  80. Mu, Q.; Zhao, M.; Running, S.W. MODIS Global Terrestrial Evapotranspiration (ET) Product (NASA MOD16A2/A3). Algorithm Theor. Basis Doc. Collect. 2013, 5, 600. [Google Scholar]
  81. Running, S.W.; Mu, Q.; Zhao, M.; Moreno, A. MODIS Global Terrestrial Evapotranspiration (ET) Product (MOD16A2/A3 and Year-End Gap-Filled MOD16A2GF/A3GF) NASA Earth Observing System MODIS Land Algorithm (for Collection 6); National Aeronautics and Space Administration: Washington, DC, USA, 2019; Volume 6.
  82. Warrick, A.W. Spatial Variability of Soil Physical Properties in the Field. Appl. Soil. Phys. 1980, 13, 319–344. [Google Scholar]
  83. R Core Team. R: A Language and Environment for Statistical Computing; R. Foundation for Statistical Computing: Vienna, Austria, 2020. [Google Scholar]
  84. Vorovencii, I. Assessing and Monitoring the Risk of Desertification in Dobrogea, Romania, Using Landsat Data and Decision Tree Classifier. Environ. Monit. Assess. 2015, 187, 204. [Google Scholar] [CrossRef] [PubMed]
  85. Bezerra, J.M.; de Albuquerque Moura, G.B.; da Silva, B.B.; Lopes, P.M.O.; de França e Silva, Ê.F. Parâmetros Biofísicos Obtidos Por Sensoriamento Remoto Em Região Semiárida Do Estado Do Rio Grande Do Norte, Brasil. Rev. Bras. Eng. Agrícola E Ambient. 2014, 18, 73–84. [Google Scholar] [CrossRef]
  86. Gutiérrez, A.P.A.; Engle, N.L.; De Nys, E.; Molejón, C.; Martins, E.S. Drought Preparedness in Brazil. Weather. Clim. Extrem. 2014, 3, 95–106. [Google Scholar] [CrossRef]
  87. Santos, C.A.G.; do Nascimento, T.V.M.; da Silva, R.M. Analysis of Forest Cover Changes and Trends in the Brazilian Semiarid Region between 2000 and 2018. Environ. Earth Sci. 2020, 79, 418. [Google Scholar] [CrossRef]
  88. Buyantuyev, A.; Wu, J. Urbanization Alters Spatiotemporal Patterns of Ecosystem Primary Production: A Case Study of the Phoenix Metropolitan Region, USA. J. Arid. Environ. 2009, 73, 512–520. [Google Scholar] [CrossRef]
  89. Maia, A.R.S.; Lopes, F.B.; de Andrade, E.M. Influence of Climatic Seasonality on a Survey of Land Use and Cover in the Semi-Arid Region. J. Agric. Sci. 2018, 10, 311. [Google Scholar] [CrossRef]
Figure 1. Spatial location of the study area, highlighting the Northeast Region of Brazil (NEB) through the characteristics of altimetry, with an emphasis on the semiarid region of NEB.
Hydrology 11 00032 g001
Figure 2. Spatiotemporal distribution of surface temperature (Tsup, °C) in Northeast Brazil (NEB) and semiarid region of NEB from 2000 to 2019.
Hydrology 11 00032 g002
Figure 3. Spatiotemporal distribution of actual evapotranspiration (ET–MODIS) in Northeast Brazil (NEB) and semiarid region of NEB from 2001 and 2019.
Hydrology 11 00032 g003
Figure 4. Spatiotemporal distribution of predictive actual evapotranspiration (ET–Predictive) in Northeast Brazil (NEB) and semiarid region of NEB from 2000 to 2019.
Hydrology 11 00032 g004
Figure 5. Time series of the average pixels throughout the year for ET–Predictive, ET–MODIS (8-day MODIS sensor products), and average values of total annual rainfall in Northeast Brazil (NEB) from 2000 to 2019.
Hydrology 11 00032 g005
Figure 6. Time series of the average pixels throughout the year for ET–Predictive, ET–MODIS, and surface temperature (Tsup) in Northeast Brazil (NEB) from 2000 to 2019.
Hydrology 11 00032 g006
Figure 7. Seasonality of biophysical parameters of energy balance and actual evapotranspiration (ET–MODIS) in Northeast Brazil (NEB) from 2001 to 2019.
Hydrology 11 00032 g007
Table 1. Characteristics of the surface reflectance product from the MODIS sensor.
MODIS Sensor Product
Surface Reflectance—Terra (MOD09A1) and Aqua (MYD09A1)—Version 6
Multispectral BandTemporal ResolutionSpatial ResolutionRadiometric ResolutionProcessing LevelMultiplier Factor
r1
(0.620–0.670 μm)
8 days500 m16 bitsL30.0001
r2
(0.841–0.876 μm)
r3
(0.459–0.479 μm)
r4
(0.545–0.565 μm)
r5
(1.230–1.250 μm)
r6
(1.628–1.652 μm)
r7
(2.105–2.155 μm)
Source: adapted from Vermote et al. [69] and NASA/MODIS [70].
Table 2. Characteristics of the surface temperature product from the MODIS sensor.
MODIS Sensor Product
Suface Temperature—Terra (MOD11A2) and Aqua (MYD11A2)—Version 6
LayerTemporal ResolutionSpatial ResolutionRadiometric ResolutionProcessing LevelMultiplier/Additional Factor
LST_Day_1 km8 days1000 m16 bitsL30.02
/0.0
Local time of day8 bits0.1
/0.0
Band 31 emissivity0.002
/0.49
Band 32 emissivity0.002
/0.49
Source: adapted from NASA/MODIS [70].
Table 3. Characteristics of the actual evapotranspiration product from the MODIS sensor.
MODIS Sensor Product
Actual Evapotranspiration (ET–MODIS)—Terra (MOD16A2) and Aqua (MYD16A2)—Version 6
LayerTemporal ResolutionSpatial ResolutionRadiometric ResolutionProcessing LevelMultiplier Factor
ET–MODIS8 days500 m16 bitsL40.1
Source: adapted from NASA/MODIS [70].
Table 4. Analysis of variance (ANOVA) of the regression model established for ET–Predictive.
Fonte1 DF2 SS3 ASF Valuep-Value
Regression2269.438134.719269.840.000
NDVI11.2071.2072.420.129
EVI128.85028.85057.790.000
Error3517.4740.499--
Total37286.912---
1 DF—Degrees of freedom; 2 SS—Sum of squares; 3 AS—Average square.
Table 5. Statistical values of the annual quantitative and spatiotemporal variability of the Tsup, ET–MODIS, and ET–Predictive parameters for NEB between 2000 and 2019.
YearTsup (°C)ET–MODIS (mm 8-day−1)ET–Predictive (mm 8-day−1)
Min.Max.Av.SDCV (%)Min.Max.Av.SDCV (%)Min.Max.Av.SDCV (%)
200020.7243.2831.512.899.17-----0.0081.0024.2524.48100.95
200121.4043.3532.503.109.540.8056.9117.738.0745.520.0082.0423.4923.88101.66
200221.6941.8232.042.878.960.5858.3818.468.3345.270.0081.9724.3524.53100.74
200321.7341.4632.452.808.630.7062.0419.288.7445.330.0082.0023.5223.91101.66
200420.5743.6631.602.718.570.3059.1020.827.7937.410.0082.9924.9325.04100.44
200521.4042.1632.022.818.770.2059.6020.547.5336.660.0084.9925.2225.41100.75
200621.2740.6031.312.728.690.4558.3221.627.7835.980.0084.0325.6925.79100.39
200721.4642.1932.502.969.110.1057.0318.048.2845.900.0083.0024.0124.19100.75
200821.7741.7631.962.547.950.3057.2120.367.6237.430.0079.9524.6124.67100.24
200921.3642.5631.152.357.540.2061.2923.787.6031.960.0082.8225.7525.7099.81
201021.6142.1332.192.758.540.1058.6021.087.9137.520.0082.0225.5825.63100.20
201120.5342.8631.012.508.060.8059.5422.957.8234.070.0083.0025.7325.84100.43
201221.6144.0333.713.189.430.1059.8615.918.6754.490.0081.9921.4222.45104.81
201321.3943.7833.213.119.360.2059.7818.799.0948.380.0082.0122.5923.64104.65
201420.5043.4932.552.999.180.2058.1919.768.3542.260.0080.9823.4723.98102.17
201522.3844.8634.073.079.010.5358.2117.308.3047.980.0081.0022.4723.08102.71
201621.8844.1233.743.018.920.6057.7017.628.0445.630.0081.9322.2322.86102.83
201721.0845.2833.073.079.280.1058.9218.348.8047.980.0081.9622.3323.29104.30
201820.8542.1732.302.838.760.8057.2419.908.5843.110.0083.8423.6724.30102.66
201922.2346.4132.662.758.420.5760.5519.748.6743.920.0081.9524.5124.79101.14
Average (Av.); minimum (min.); maximum (max.); standard deviation (SD); coefficient of variation (CV).
Disclaimer/Publisher’s Note: The statements, opinions and data contained in all publications are solely those of the individual author(s) and contributor(s) and not of MDPI and/or the editor(s). MDPI and/or the editor(s) disclaim responsibility for any injury to people or property resulting from any ideas, methods, instructions or products referred to in the content.

