Article

Rainfall Simulator Experiments to Investigate Macropore Impacts on Hillslope Hydrological Response

by
Yvonne Smit
1,*,
Martine J. Van der Ploeg
2 and
Adriaan J. Teuling
3
1
Department of Physical Geography, Faculty of Geosciences, Utrecht University, PO Box 80.115, 3508 TC, The Netherlands
2
Soil Physics and Land Management Group, Wageningen University & Research, Droevendaalsesteeg 4, 6708 PB Wageningen, The Netherlands
3
Hydrology and Quantitative Water Management Group, Wageningen University & Research, Droevendaalsesteeg 3a, 6708 PB Wageningen, The Netherlands
*
Author to whom correspondence should be addressed.
Hydrology 2016, 3(4), 39; https://doi.org/10.3390/hydrology3040039
Submission received: 10 June 2016 / Revised: 21 October 2016 / Accepted: 28 October 2016 / Published: 15 November 2016

Abstract

:
Understanding hillslope runoff response to intense rainfall is an important topic in hydrology, and is key to correct prediction of extreme stream flow, erosion and landslides. Although it is known that preferential flow processes activated by macropores are an important phenomena in understanding runoff processes inside a hillslope, hydrological models have generally not embraced the concept of an extra parameter that represents ‘macropores’ because of the complexity of the phenomenon. Therefore, it is relevant to investigate the influence of macropores on runoff processes in an experimental small artificial hillslope. Here, we report on a controlled experiment where we could isolate the influence of macropores without the need for assumptions regarding their characteristics. Two identical hillslopes were designed, of which one was filled with artificial macropores. Twelve artificial rainfall events were applied to the two hillslopes and results of drainage and soil moisture were investigated. After the experiments, it could be concluded that the influence of macropores on runoff processes was minimal. The S90 sand used for this research caused runoff to respond fast to rainfall, leading to little or no development of saturation near the macropores. In addition, soil moisture data showed a large amount of pendular water in the hillslopes, which implies that the soil has a low air entry value, and, in combination with the lack of vertical flow, could have caused the pressure difference between the matrix and the macropores to vanish sooner and result in equilibrium being reached in a relatively short time. Nevertheless, a better outline is given to determine a correct sand type for these types of experiments and, by using drainage recession analysis to investigate the influences of macropores on runoff, heterogeneity in rainfall intensity can be overcome. This study is a good point of reference to start future experiments from concerning macropores and hillslope hydrology.

1. Introduction

The complexity of hydrological processes at hillslope and small catchment scales during periods of water input is still not well understood in spite of all the extensive research during the past several decades [1,2,3,4]. Thorough knowledge of how small-scale hydrological processes affect larger scale phenomena, such as flood generation, fate and transport of nutrients, soil erosion, sustained stream flow, and groundwater recharge is lacking [5,6,7]. As such, it is important that hydrologists gain additional insights into the processes of water flow through hillslopes of headwater catchments to be able to predict the response to precipitation and snowmelt under a variety of conditions and to better manage the associated landscape [8,9]. In order to achieve this, hydrological models need to be extended with more physically correct specified parameters [7]. A process currently often lacking in hydrological models is the parameterization of macropore flow. Hendrickx and Flury [10] defined preferential flow as ‘all phenomena where water and solutes move along certain pathways, while bypassing a fraction of the porous matrix’. Although it is known that preferential flow processes activated by macropores are an important phenomena in understanding runoff processes inside a hillslope, hydrological models have been slower to embrace the concept of an extra parameter that represents ’macropores’ [11,12]. Some models did try to incorporate macropores through a modification of the hydraulic conductivity. This approach is substantially different from describing the preferential flow paths that macropores create [13,14,15]. This approach is often chosen because of the complexity of the phenomenon.
Several studies state that preferential flow is important in controlling surface runoff and soil erosion in case of specific, high intensity rainfall events [16,17,18,19,20]. Therefore, preferential flow processes must be included in hydrological models if preferential flow dominates. Hydrological process models with a less detailed process description may fit observed average events reasonably well but can result in erroneous predictions for more extreme events [21]. For more complex models with more detailed process descriptions, more parameters are needed and more degrees of freedom arise. This is mainly a problem when it is not possible to make physically based estimates of the parameter values. When the parameters are calibrated without keeping the parameter values in a physically sound range, a model may give the right results for a wrong reason, and, subsequently, running scenarios with the model may result in erroneous predictions [22,23,24]. Thus, for most practical applications of hydrology, it is important to understand the internal processes and apply models that include these processes, as the internal processes will inevitably affect model outputs under changing scenarios [7]. However, it is impossible to demonstrate the truth of any proposition, except in a closed system [25].
A physically based model to examine the process of water flow in a slope segment populated with disconnected macropores is described by Nieber and Sidle [1] in a study about macropores and hillslope runoff. The specific objectives of the investigation were to: (i) quantify the role of the macropores in the conveyance of water within the slope segment and (ii) illustrate in some detail the concept of self-organization of flow pathways within sloping soils. Based on model simulations, it was concluded by Nieber and Sidle [1] that subsurface flow is directed through the preferential flow network in the saturated portion of the soil but bypasses the macropores in drier regions. An experiment to confirm this theory has not been performed yet.
An experiment where the lateral water diffusion in an artificial macroporous system was investigated is described by Castiglione et al. [26]. In their study, they performed several experiments with soil columns including vertical macropores and without macropores. These experiments allowed them to discriminate between macropore flow and matrix flow, and to measure the interdomain exchange flux. In their study, it was concluded that water flow inside the matrix and inside the macropores did not evolve independently, but were very much affected by each other. This was likely due to vertical flow of water entering the matrix region from the top. In general, the maximum value of the cumulative transfer rate is smaller when vertical flow in the matrix is relatively fast compared with that of the macropore, since the pressure difference between the two domains (i.e., the driving force for water exchange) will vanish sooner [26].
There are field and modelling studies that have attempted to understand and incorporate the spatially dynamic nature of preferential flow system [27,28,29,30,31,32,33]. In spite of this progress in conceptualizing and modelling preferential flow at the larger hillslope or catchment scale, little has been done to examine the details of realistic flow networks at the scale of individual macropores or soil pipes. Since literature on small-scale hillslope experiments is lacking, our first objective of this paper is to investigate if a laboratory (closed system) experiment can be produced to examine the influence of macropores on runoff processes inside a hillslope. The second objective is to investigate whether macropores influence the hydrological response of a small artificial hillslope.
In order to address the first objective, we first look at whether or not our artificial macropores become activated using small-scale testing in a soil column, using the knowledge of Castiglione et al. [26]. In addition, we will conduct experiments to determine a suitable soil type to observe an optimal influence of macropores, to which we devoted the first part of this article. Furthermore, we conducted hillslope experiments inside the Wageningen rainfall simulator [34] for which we based the experimental set-up on the paper by Nieber and Sidle [1]. We focused on the influence of macropores on drainage and storage inside a small artificial hillslope to meet our second objective. The hillslope experiment inside the rainfall simulator is described in the second part of this article.

2. Initial Soil Column Testing

Twelve sets of experiments with building sand, sieved loamy sand (to 2 mm) and S90 were conducted in the soil physics laboratory of the Wageningen University to study the effect of different soil types and macropores on a small scale. These experiments were partially based on the article by Castiglione et al. [26] and their specifications can be found in Table 1 and Figure 1.
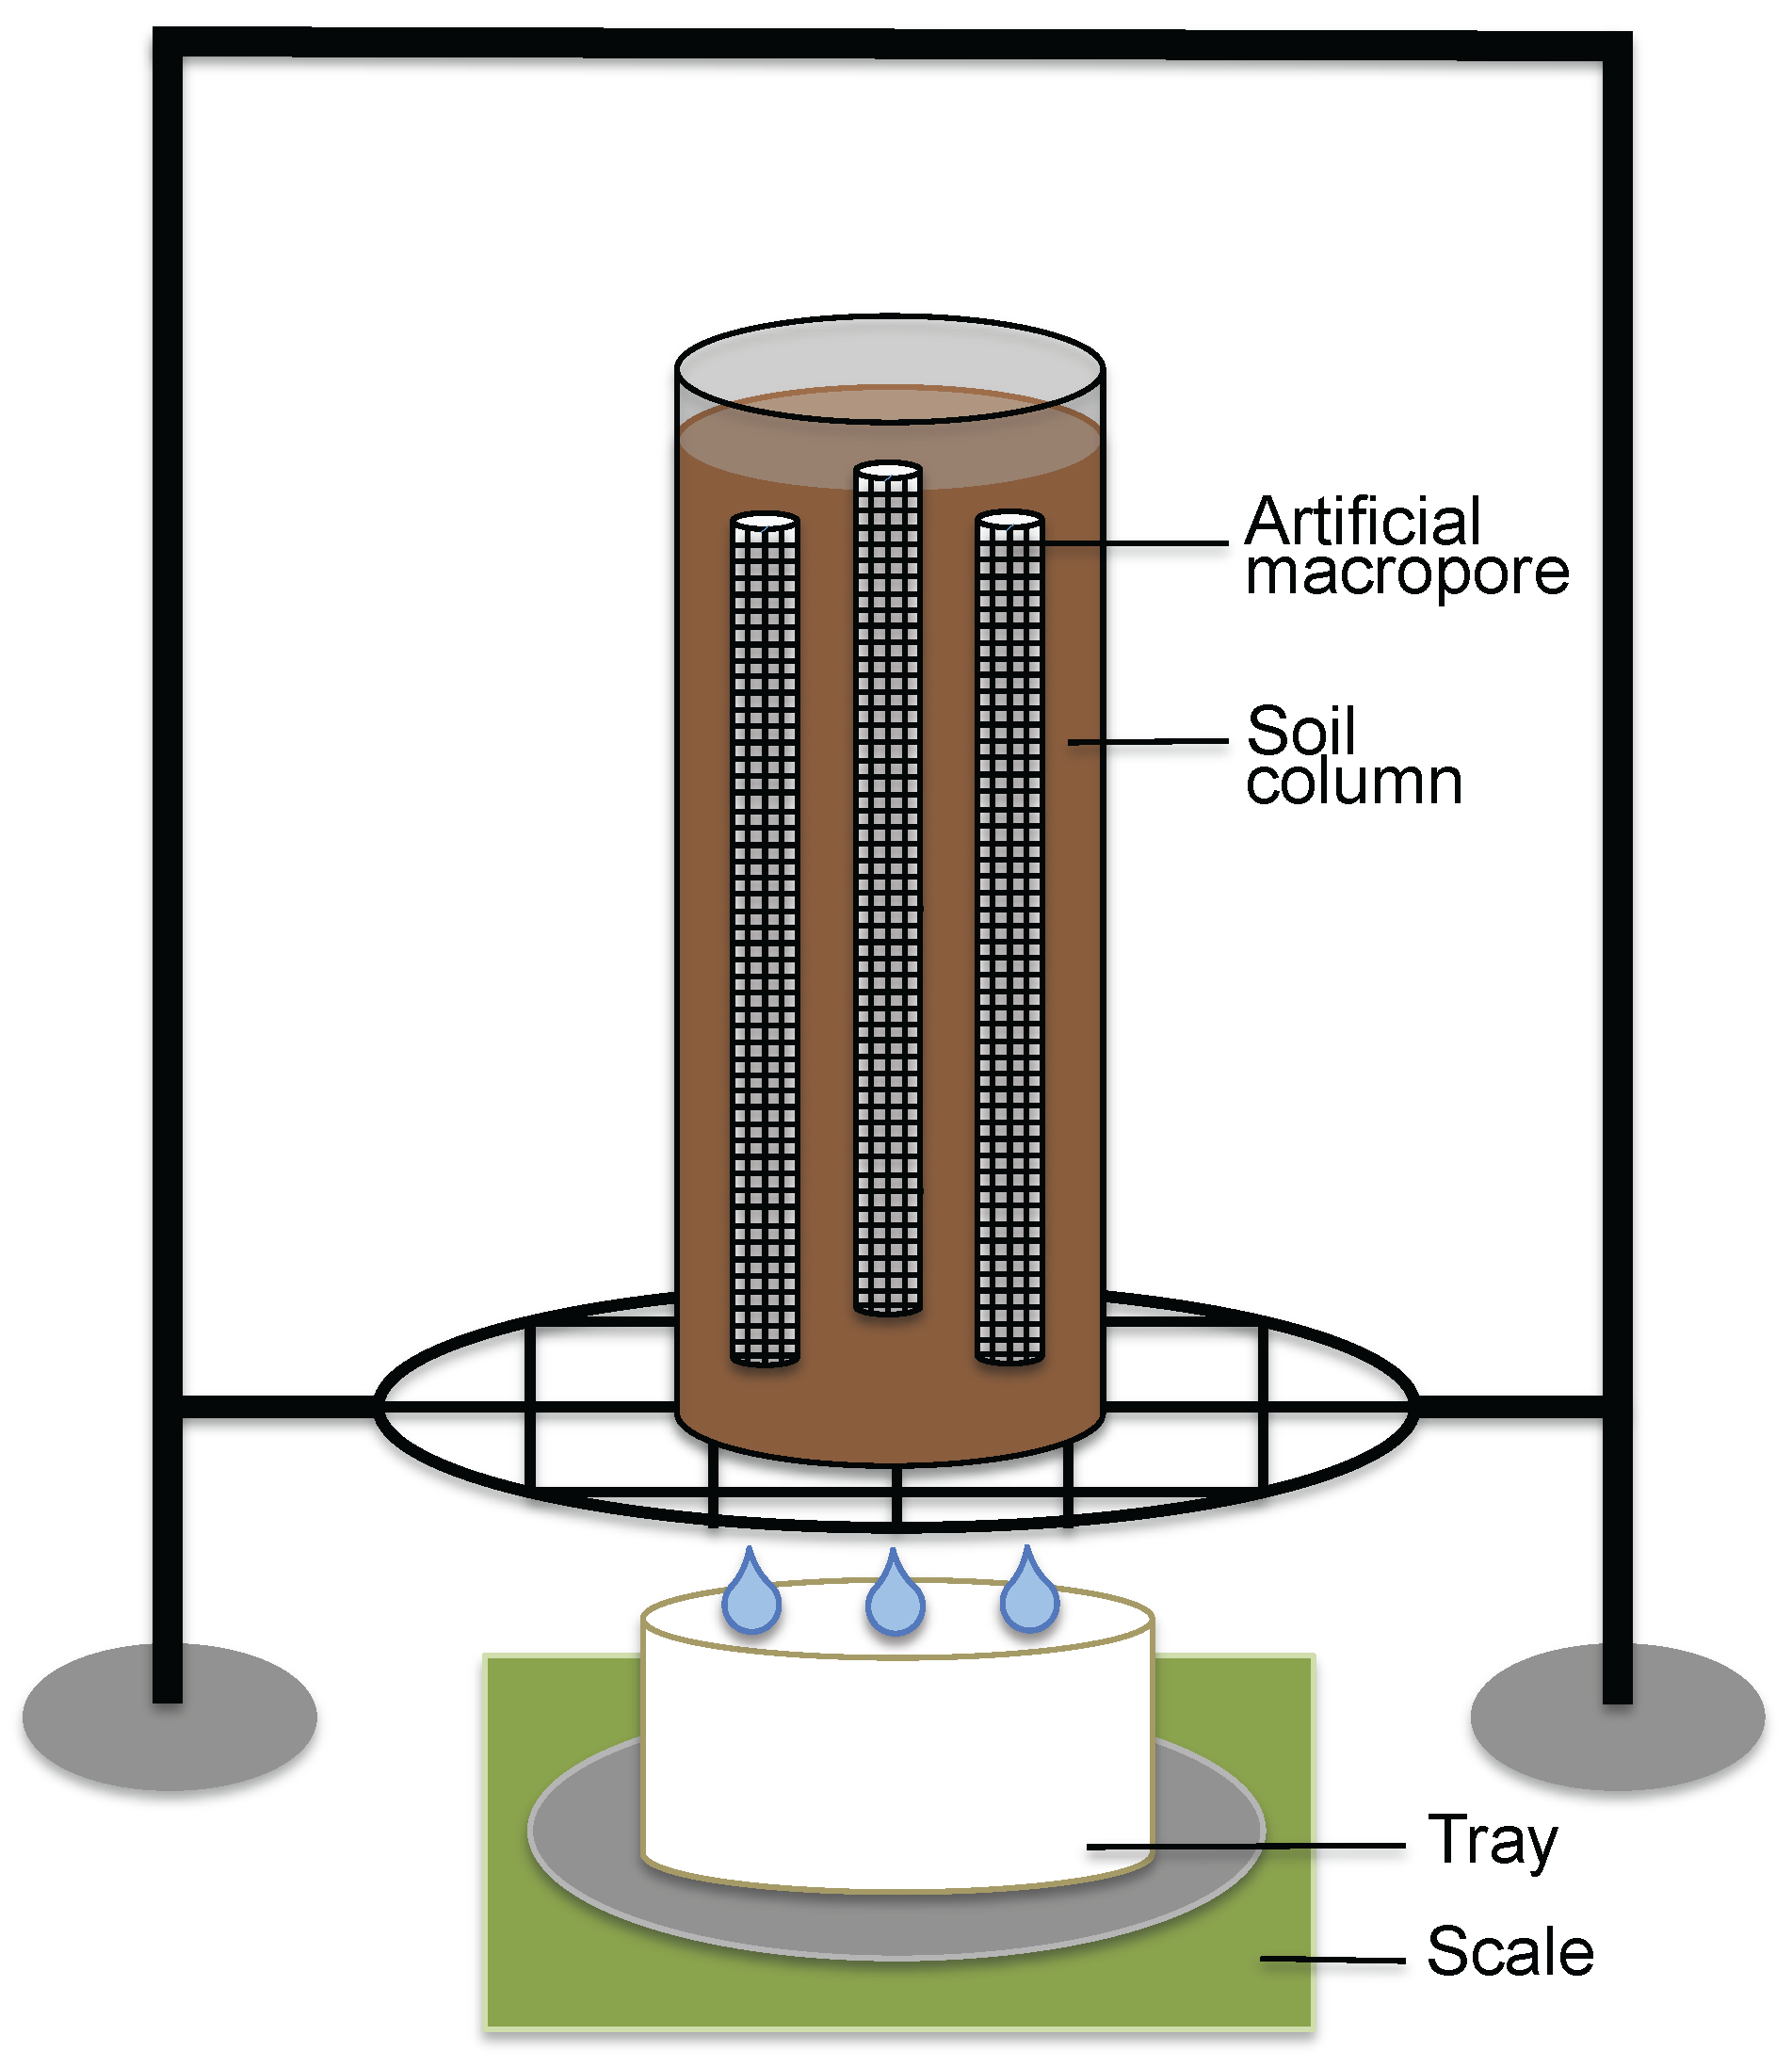
All soil column experiments had a similar setup. Soil was added to a column in layers of approximately 5 cm and carefully packed. With a 60 mL syringe, water was continuously applied to the soil columns, until ponding occurred, and then the time interval was extended. Addition of water was done carefully to prevent the development of preferential flow paths. Drainage was measured every 15 s with a scale. When macropores were included in the experiment, a set of three vertical (oriented in the flow direction) macropores of stainless steel mesh with a length of 22 cm and a diameter of 1 cm were present. All three macropores were not connected to open air and situated inside the soil column at least 5 cm from the column wall. The mutual distance between the macropores and the column wall was at least 3 cm to prevent interaction and border effects. The material of the macropores was based on a previous experiment described by Zhou et al. [17] where they investigated preferential water and solute transport through a sandy soil containing artificial macropores. This mesh had around 40 holes per cm 2 
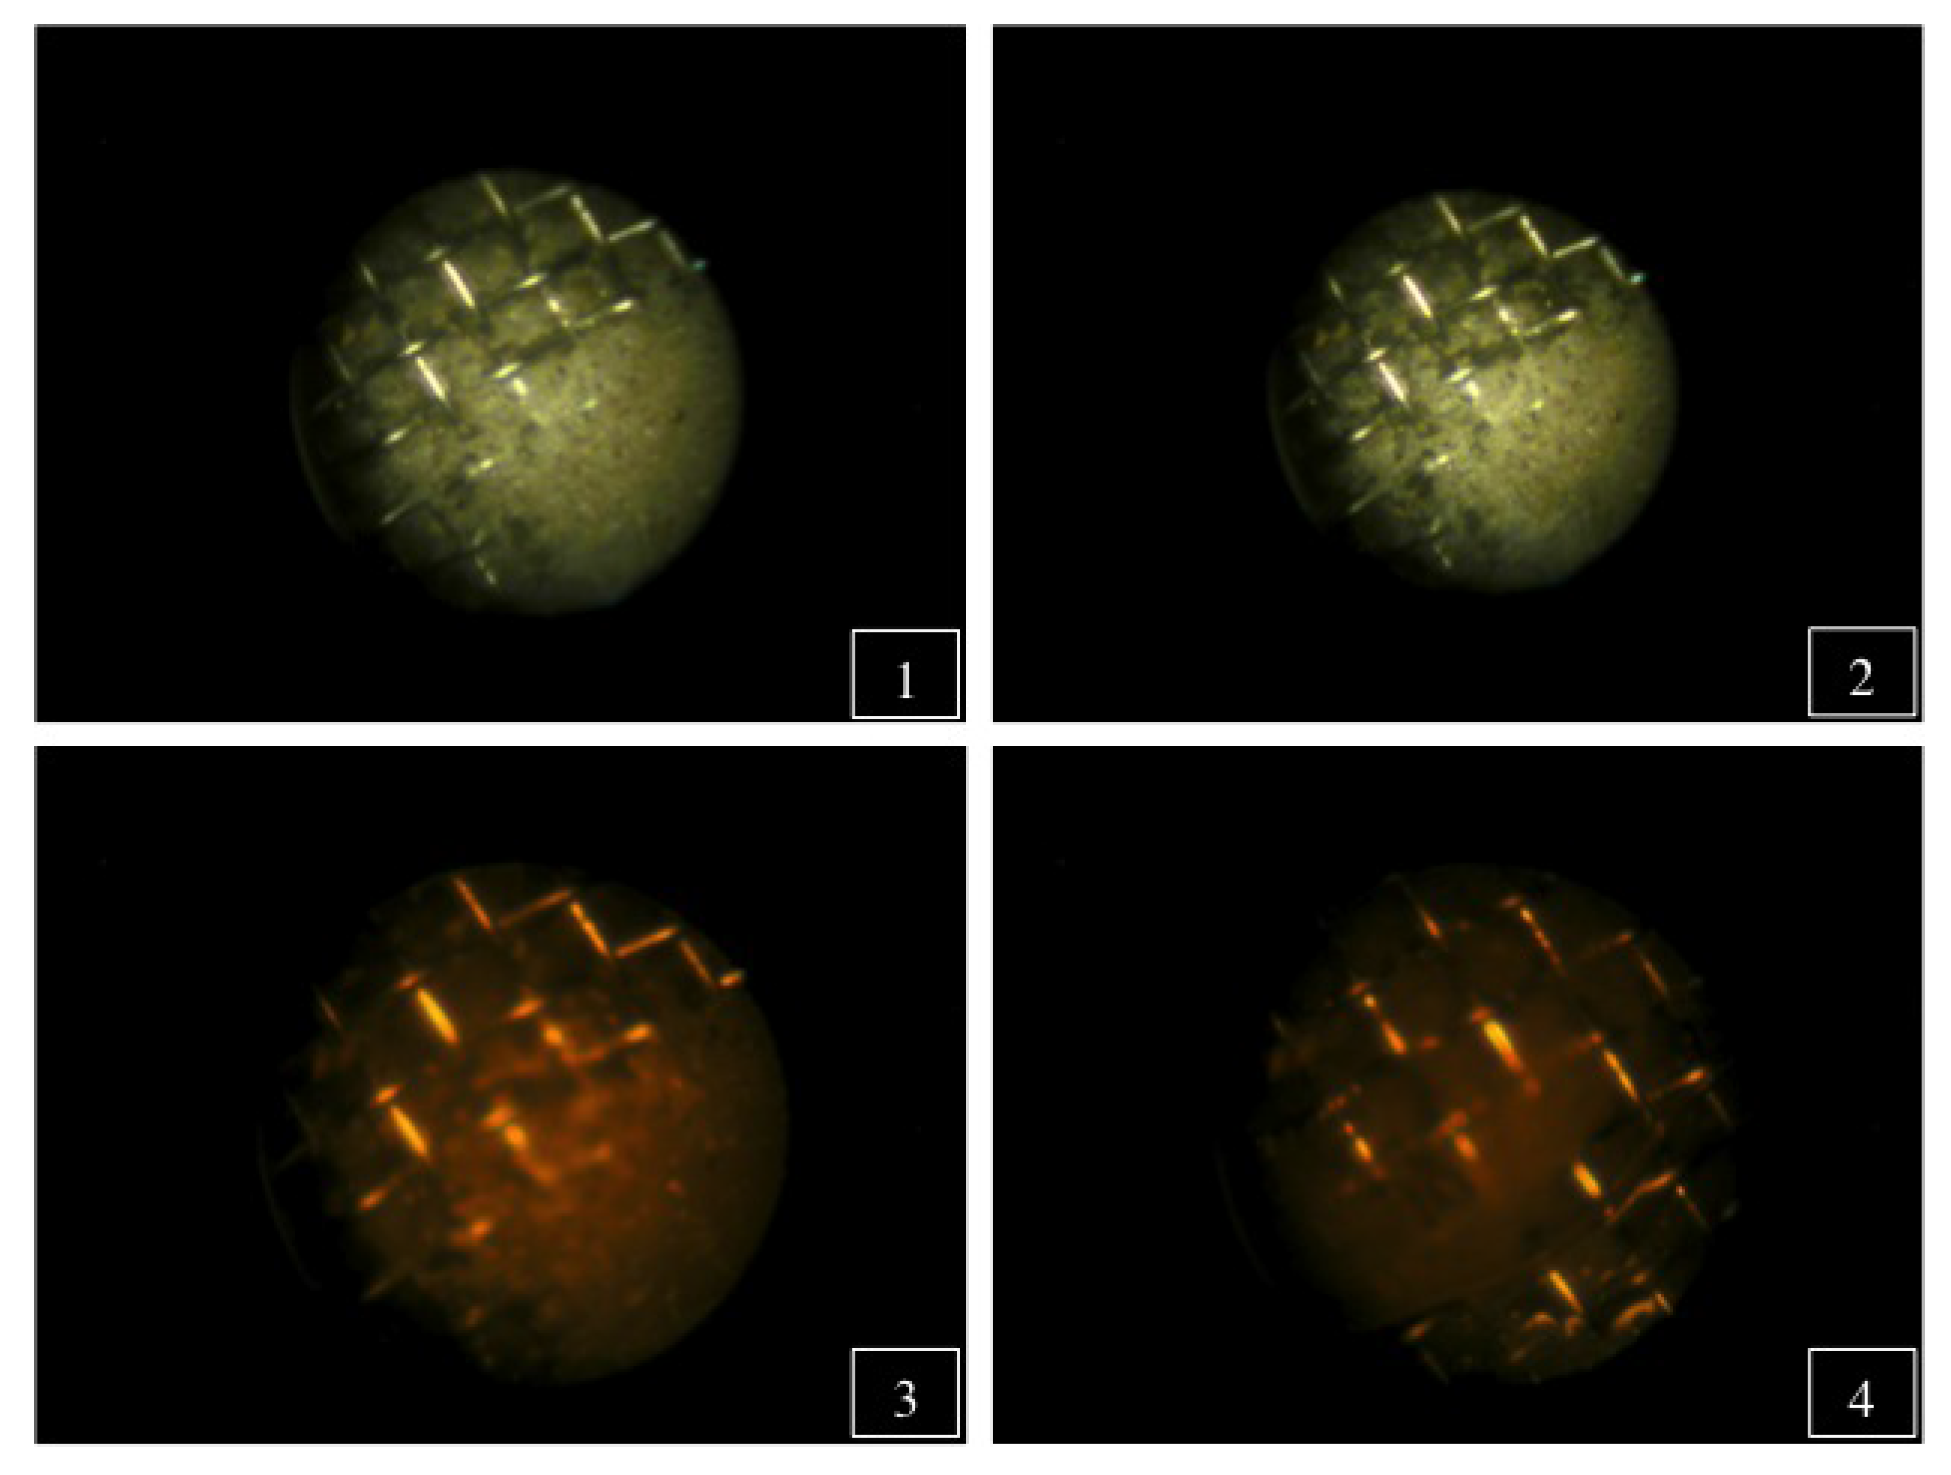
with a diameter of approximately 1.5 mm. The thickness of the mesh was approximately 0.5 mm and the macropores itself had a diameter of 1 cm and a length of ∼22 cm. Pictures made by cold-light boroscope with a diameter of 6.35 mm (Heine Optotechnik GmbH, Herrsching, Germany) placed inside the macropores and attached to a digital camera (Coolpix 4500, Nikon, Tokyo, Japan) showed that water is allowed to flow through the macropores after applying water to the soil column (Figure 2). In addition, the macropores did not collapse under a high weight.
Based on soil column testing, we determined S90 sand with a homogenous grain size distribution of 150 micrometres to be most suitable for the rainfall simulator experiments. S90 sand fulfilled all of the requirements that we presumed to be important: a high infiltration capacity to prevent overland flow, a uniform particle size distribution to isolate the influence of macropores and fast drainage to maximize the amount of breakthrough curves.
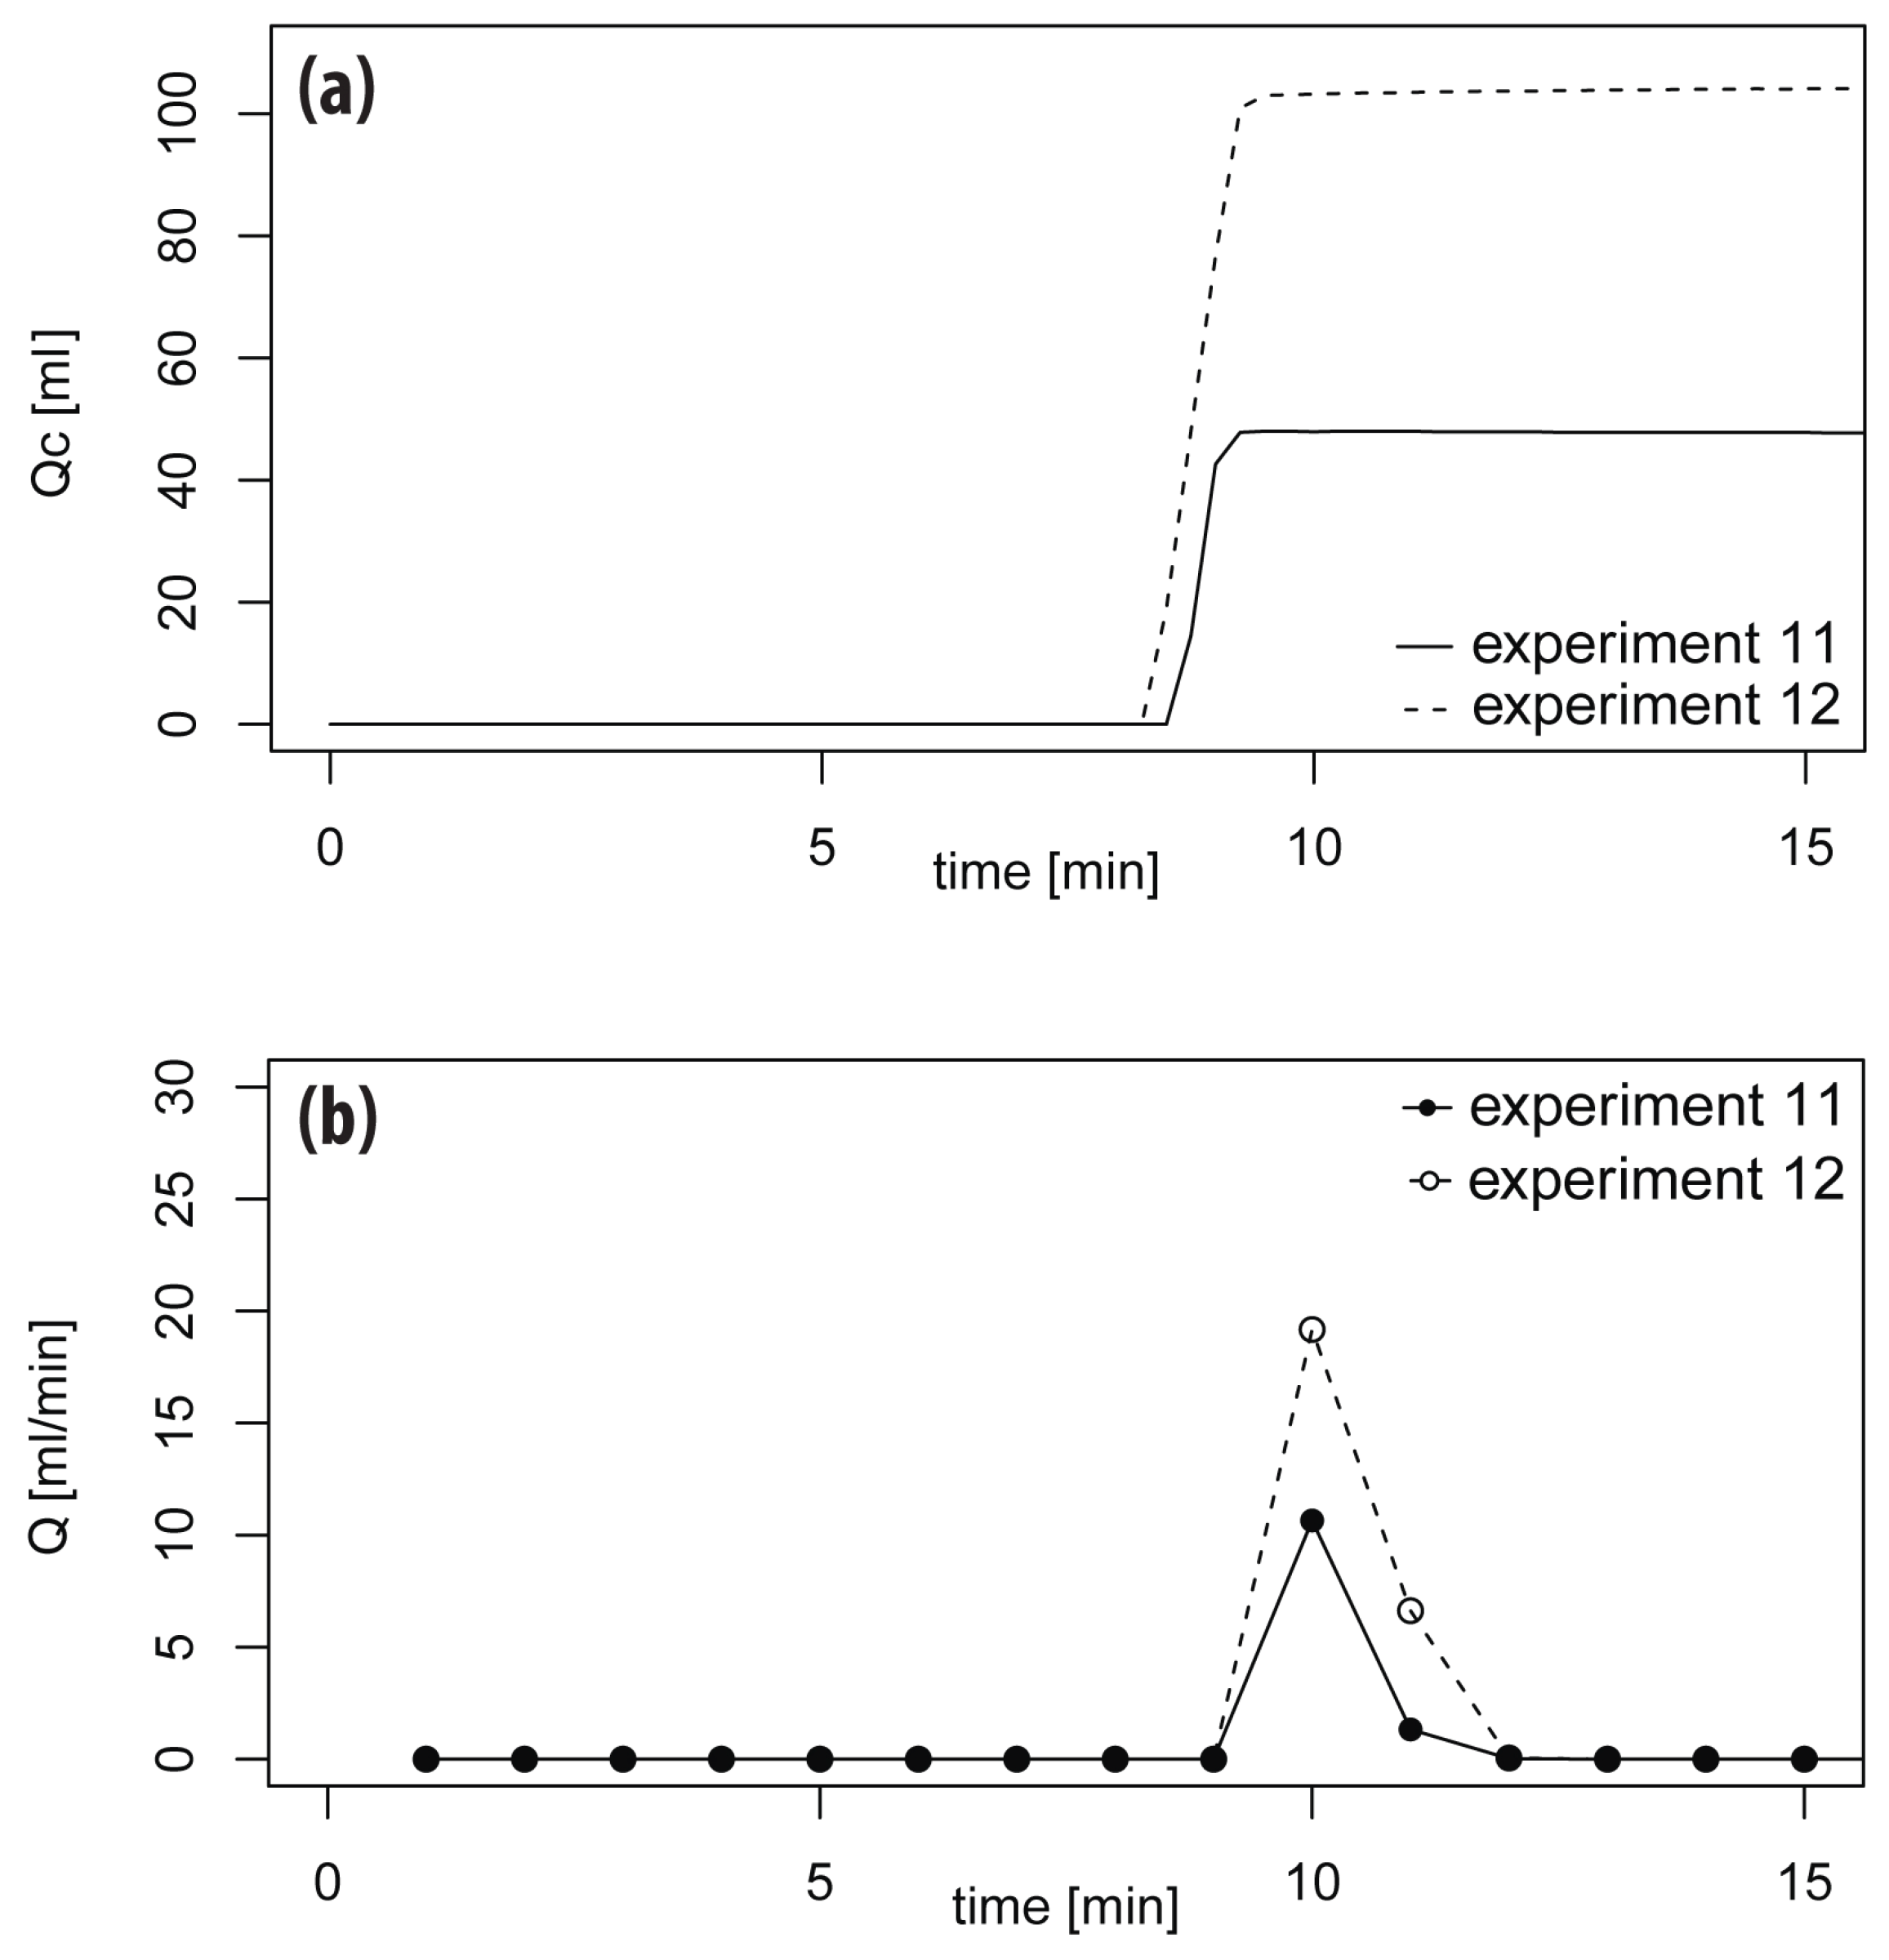
 Figure 3 shows the cumulative drainage data and drainage data for an experiment with and without macropores. After approximately 8 min and application of 1500 mL of water, a breakthrough curve was observed. The highest drainage rate for the soil column including macropores is 19.2 mL·min 1 , and, for the soil column without macropores, this value is 10.7 mL·min 1 . Furthermore, there is a large amount of residual water present in the soil column and the system with S90 sand acted as an on–off system, which can be attributed to the uniform particle size distribution S90 sand. This feature also caused fast infiltration of water, which allowed for continuous addition of water to the column without any ponding.
The disadvantage of using loamy sand was slow infiltration of water into the soil column. This caused a lack of drainage for a time period of at least three days after applying 600 mL of water to a soil column of 39.5 cm. This means that the hydraulic conductivity is smaller than ∼0.009 cm·min 1 , and, therefore, it could cause ponding and Hortonian overland flow in a rainfall simulator experiment [35]. There were no visible effects of silting of the topsoil layer, and, even in presence of macropores, loamy sand showed no breakthrough curve and was therefore excluded.
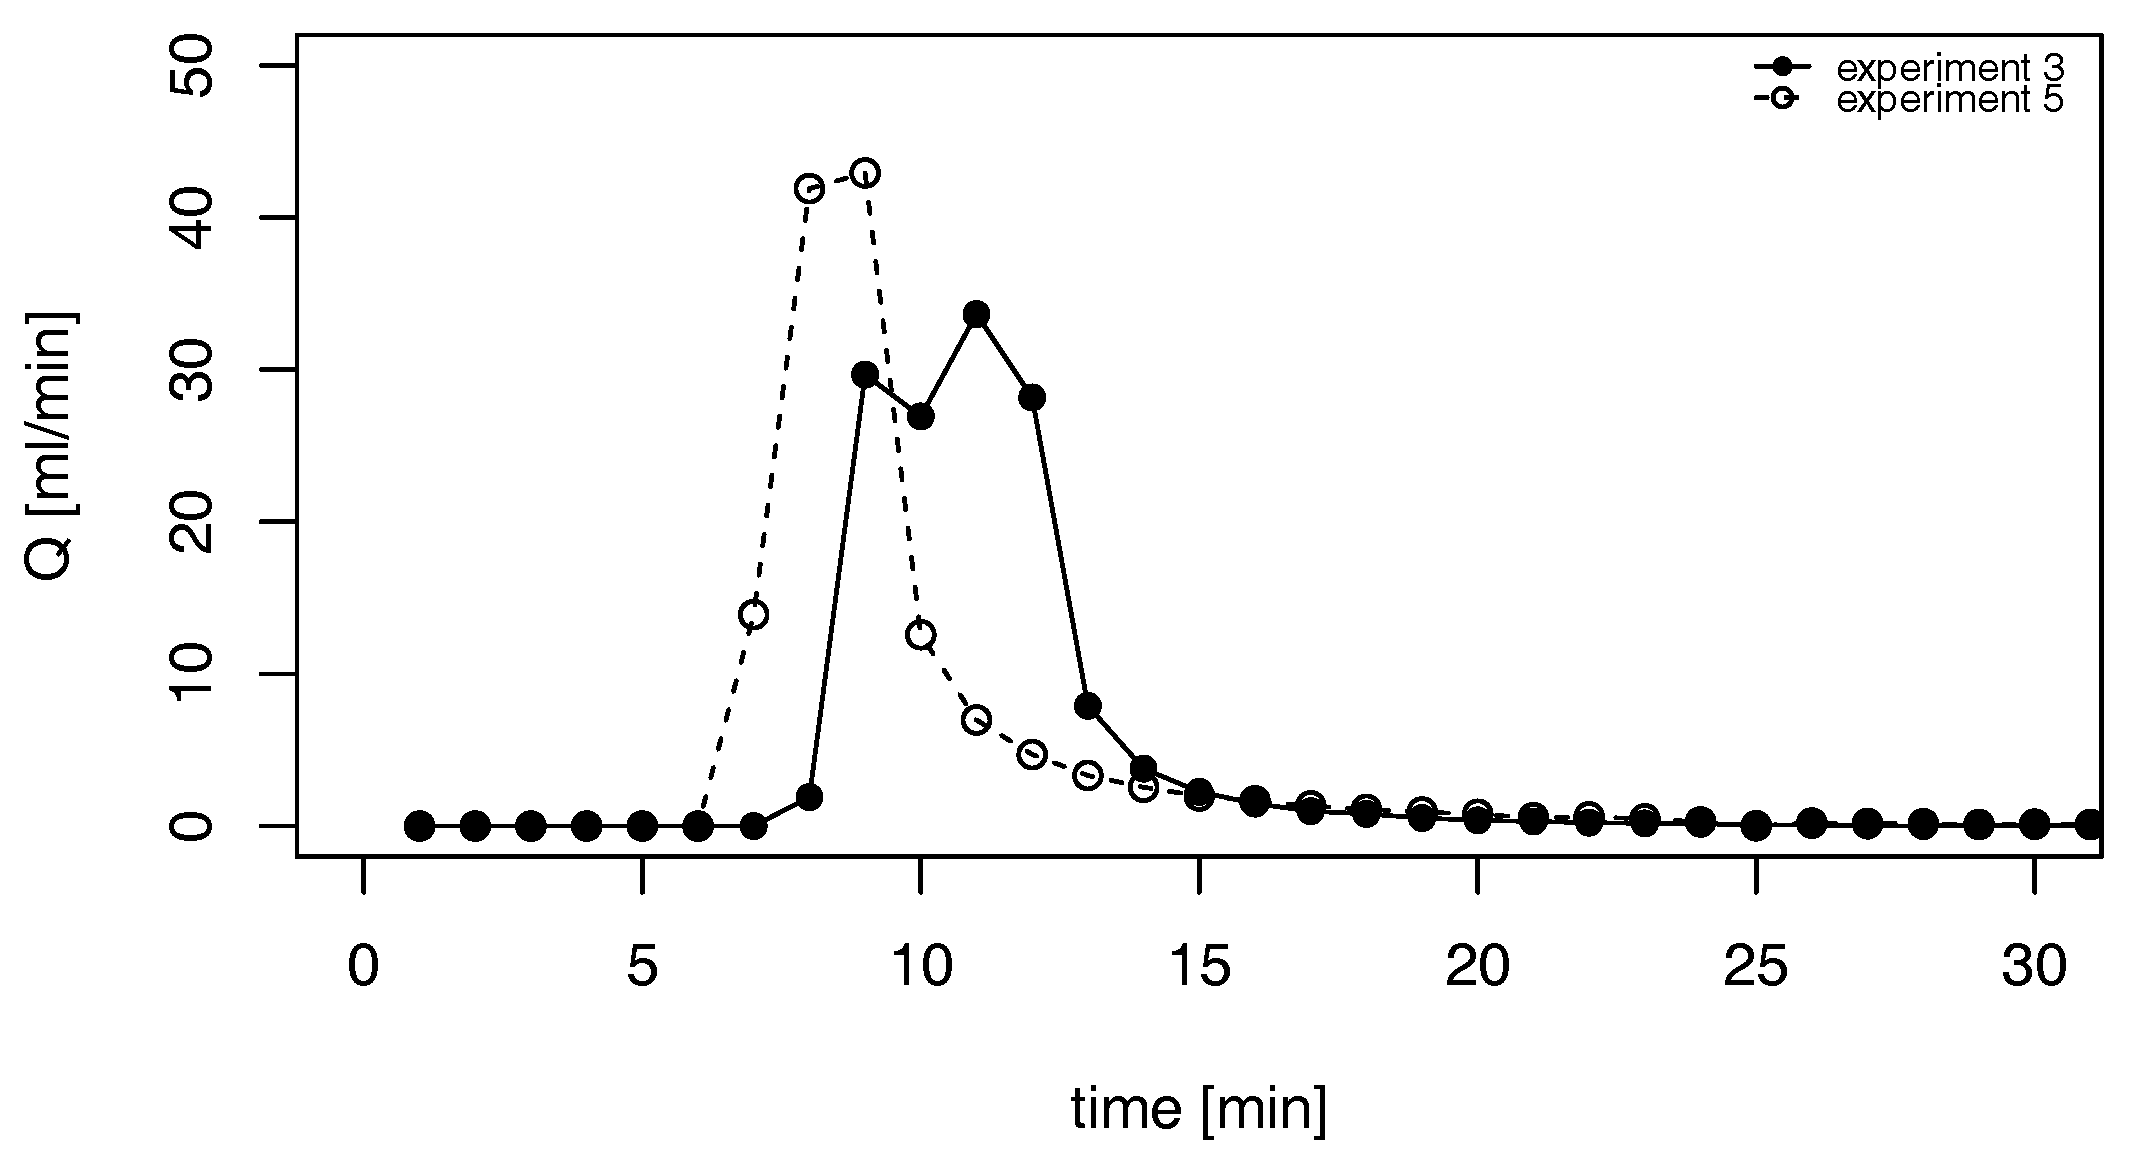
Building sand, however, did show a breakthrough curve (Figure 4) and responded very fast. Therefore, a clear difference was visible between the experimental set-up including macropores and without macropores. The highest drainage rate for the soil column including macropores is 42.92 mL·min 1 , and, for the soil column without macropores, this value is 33.65 mL·min 1 . However, after applying 1200 mL of water, the infiltration capacity decreased and ponding occurred. Furthermore, a large amount of residual water was observed in the soil column. From the 1500 mL of water that was added to the column, only 500 mL drained out of the column. Since overland flow was undesired during the rainfall simulator experiments, it was decided not to use building sand.
Both sieve curves of loamy sand and building sand shown in Table 2 confirm the behaviour of the slow and quick responding drainage, respectively. The sieve curve of loamy sand shows that 60% of the grain sizes are smaller than 100 micrometres, and the sieve curve of building sand shows that 50% of the grain sizes are larger than 200 micrometres, but also contains a small percentage of fine sand particles between 100 and 200 micrometres. Hence, this could explain the large amount of residual water in the soil column after the experiment.

3. Set-Up of Hillslope Experiment

For the hillslope-scale experiment, we used the Wageningen Rainfall Simulator in the Kraijenhoff van de Leur Laboratory for Water and Sediment Dynamics of Wageningen University. This facility has been used in past studies on hillslope-scale runoff processes [34,36] but is mostly used for educational activities.

3.1. Rainfall Simulator

The Wageningen Rainfall Simulator accurately described by Lassu et al. [34] is a Lechler nozzle (Lechler Ltd, Newhall, Sheffield, England) based rainfall simulator which contains two types of nozzles: two high intensity nozzles (nr. 461·008) of 702 mm and two low intensity nozzles (nr. 460·788) of 608 mm. Two arms with a set of each nozzle type are situated 3.85m above the plot. The nozzles are connected to a Zehnder HMP 450 pump (Zehnder Pumpen GmbH, Grünhain-Beierfeld, Germany) with a pressure chamber, which pumps water from underneath the rainfall simulator towards the nozzles with a constant pressure and water supply. It is possible to control the flow rate for each nozzle type independently [34].
The rainfall intensity used for the main experiment was approximately 100 mm·h 1 , based on two rainfall experiments. It was observed that with a pressure of 2 bars and the high intensity nozzles (nr. 461·008), the rainfall intensity was most stable. However, ponding occurred during the experiments, and, therefore, low intensity nozzles (nr. 460·788) of 608 mm were used for the main experiment.
A total of 12 artificial rainfall events on six different days were applied to the two hillslopes. 
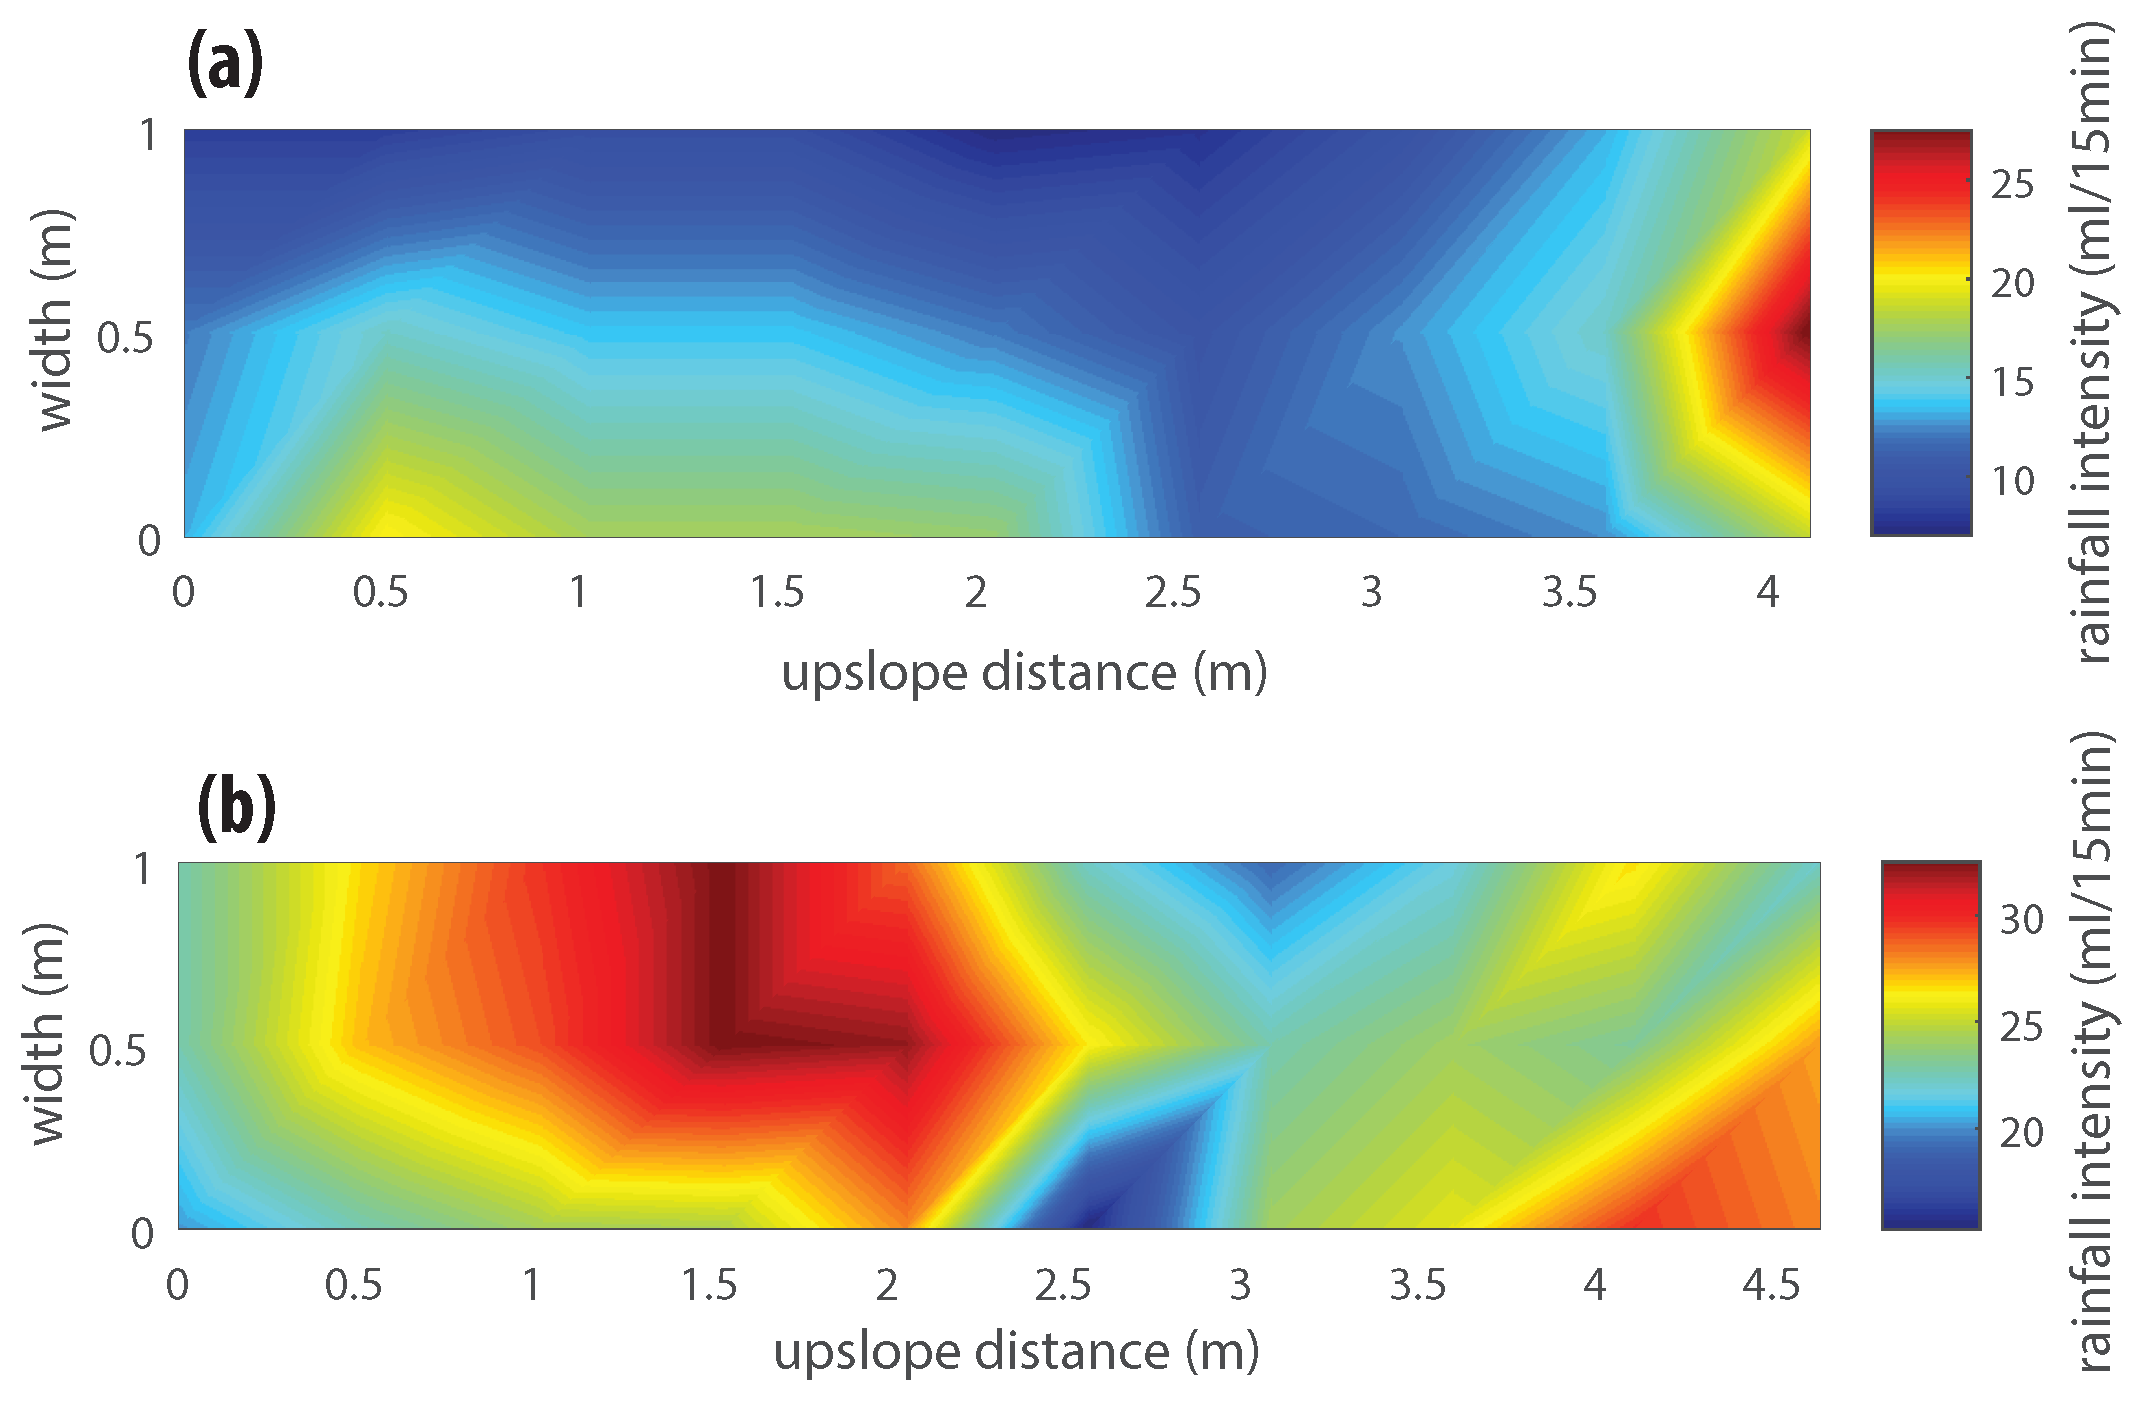
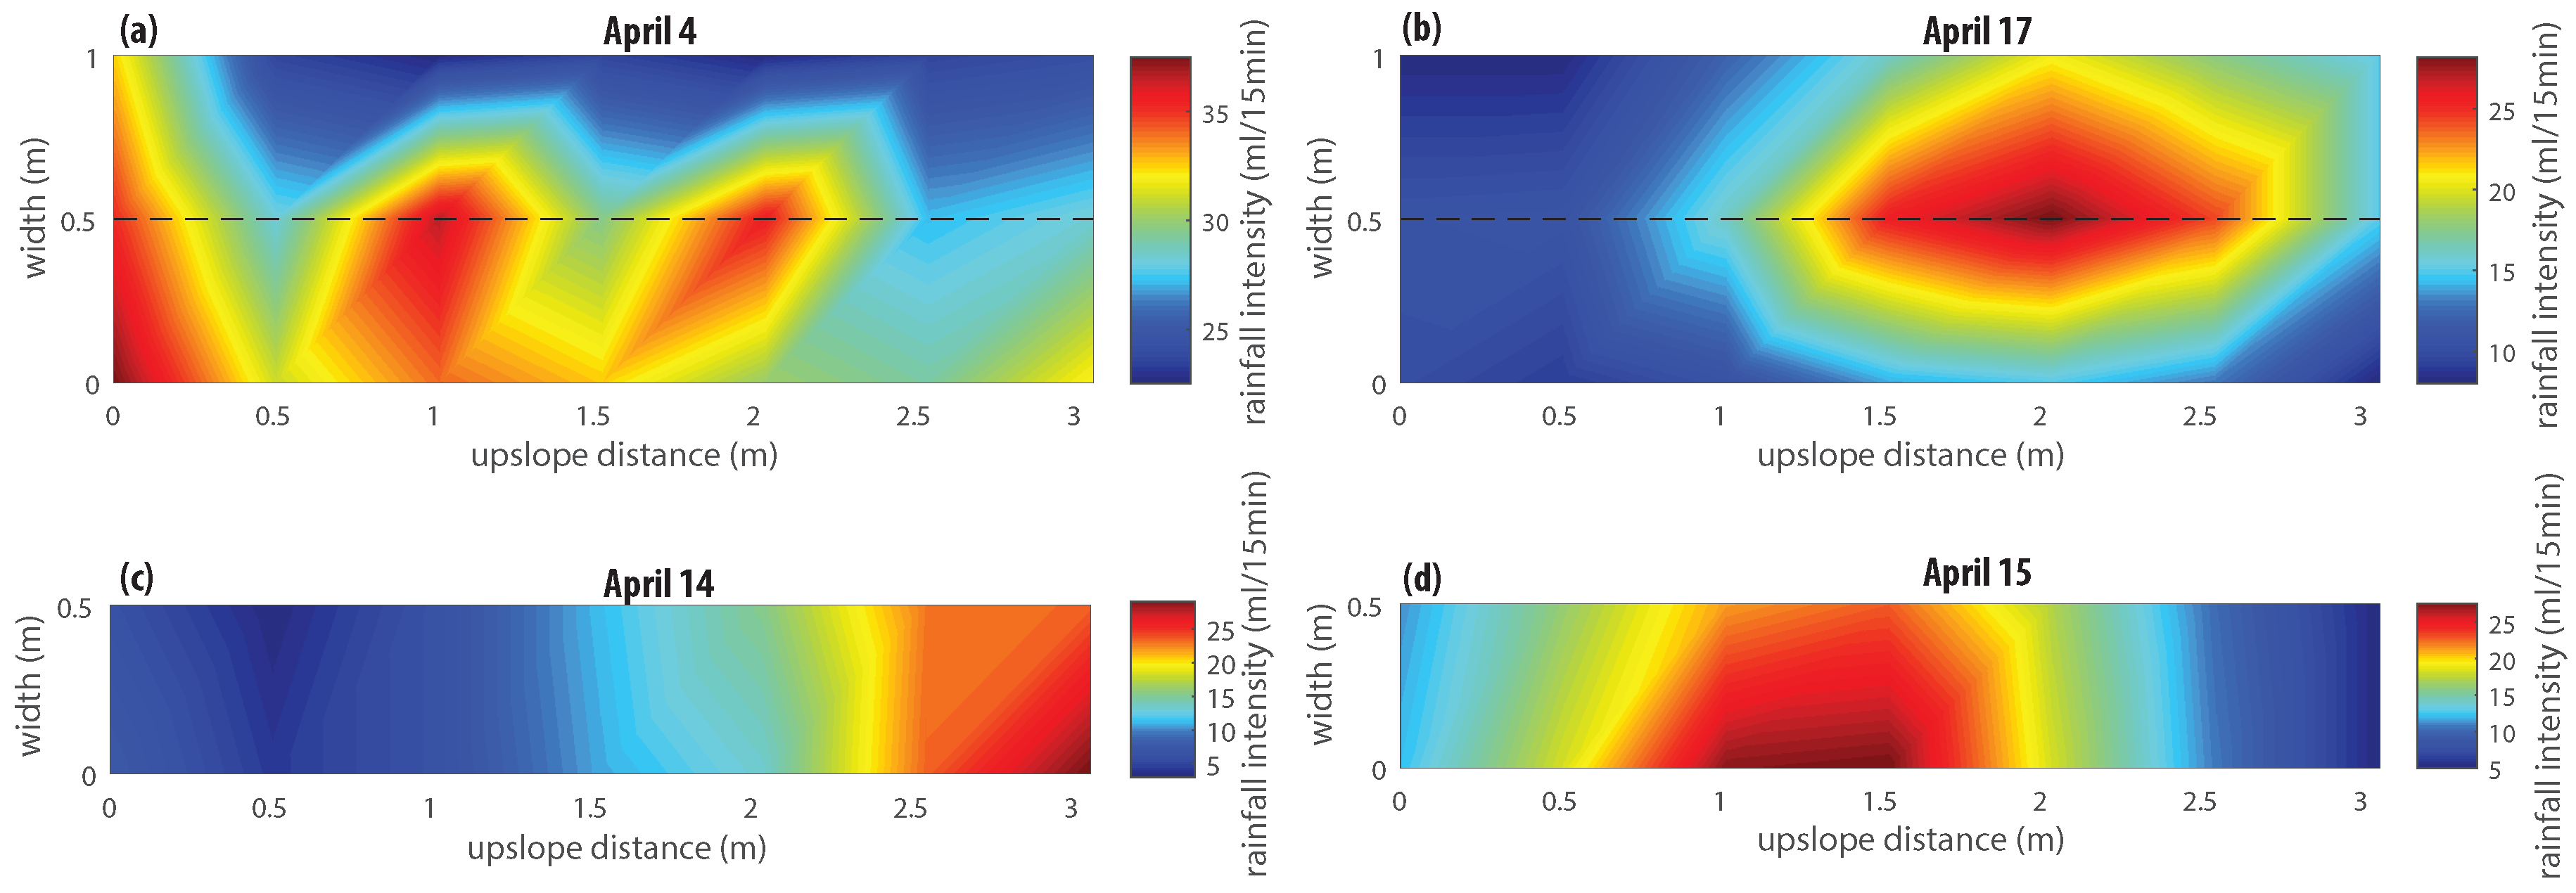
Table 3 shows the specifications of these rainfall events. On most days, both hillslopes were sprinkled at the same time, but, on 14 April, only hillslope 2 was sprinkled (while hillslope 1 was covered with a plastic sheet), and, on 15 April, only hillslope 1 was sprinkled (while hillslope 2 was covered with a plastic sheet). Furthermore, due to ponding with the high intensity nozzles and the insecurity of rainfall intensity over time, several experiments were performed where the rainfall intensity was also measured (experiments 1, 2, 9, 11 and 12). This was measured by rain gauges at the sides of the hillslopes as shown in Figure 5. Hence, the total amount of rainfall that both hillslopes received was known. However, the rainfall intensity did not appear to be constant over time as was also found by Lassu et al. [34].

3.2. Design of the Two Hillslopes

Two hillslopes with a slope gradient of three degrees and the dimensions 0.5 m × 4 m × 0.5 m (width × length × height) were made [1]. The material used was concrete plywood. Concrete plywood does not rot and is water repellent. Therefore, it conducts water better than other material and causes measurement errors in drainage to be minimal. Based on the soil column experiments (Section 2), the two hillslopes were filled with S90 silica sand (Sibelco Benelux, Dessel, Belgium), this was done in layers but did not need compaction since the sand was dry.
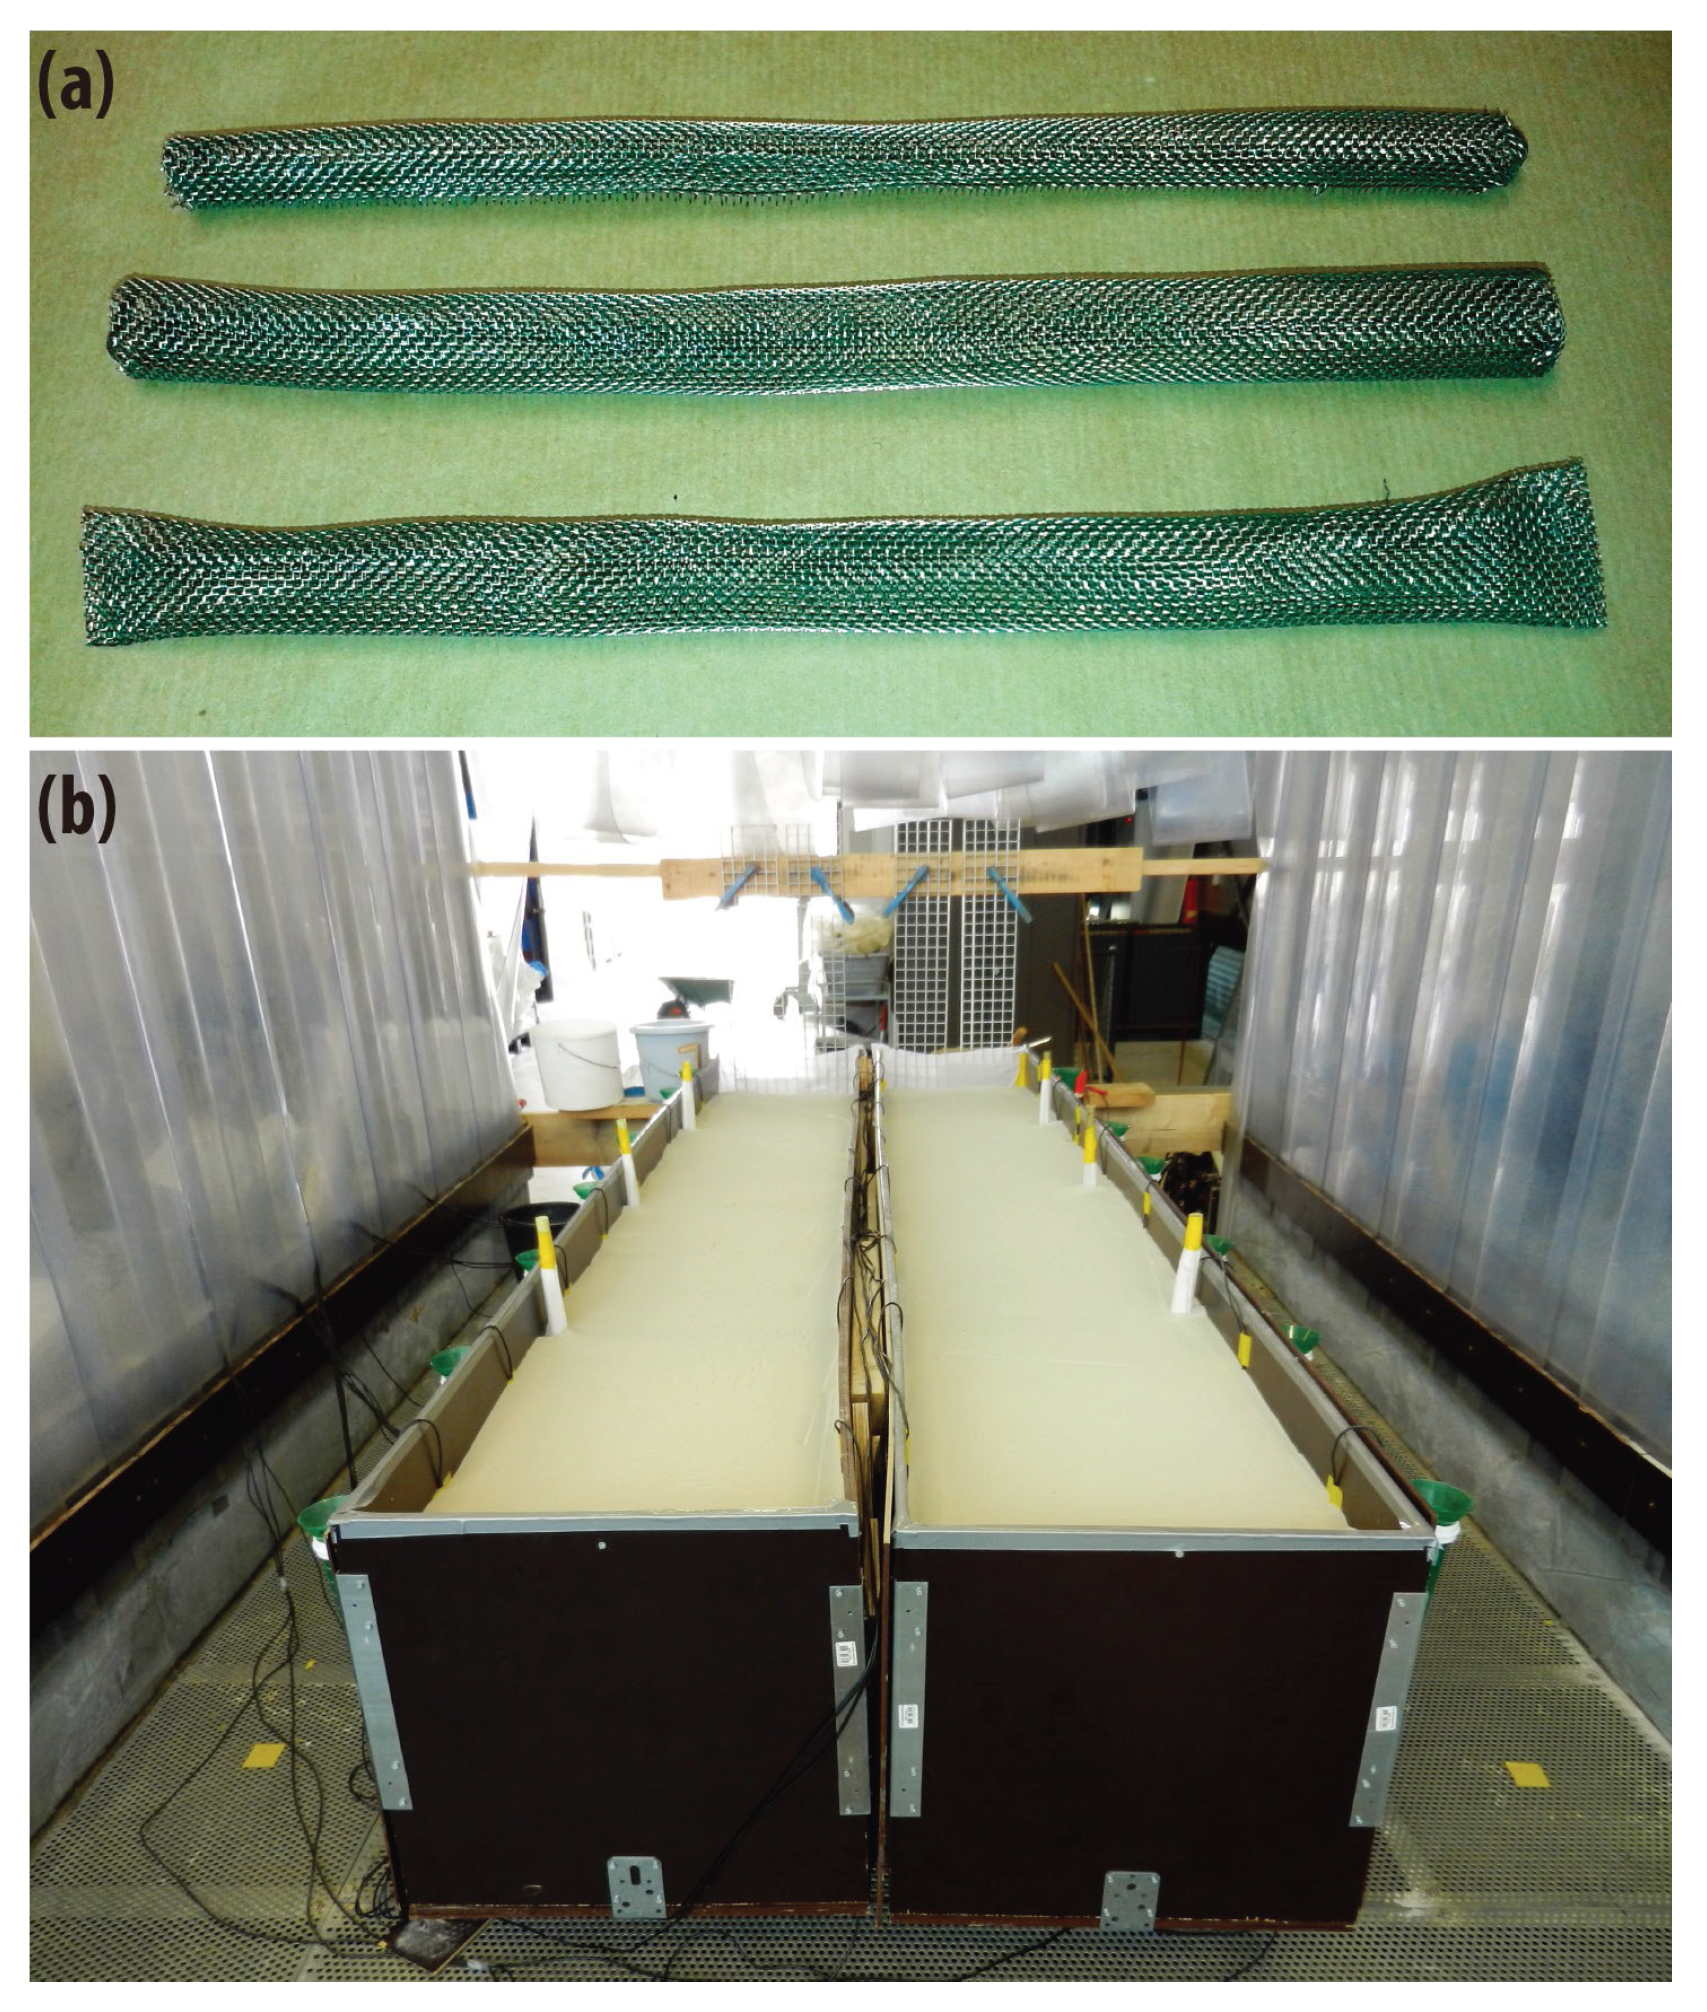
The experimental set-up contained one control–hillslope without any artificial macropores and a second hillslope which contained 26 artificial disconnected horizontal (oriented in the flow direction) macropores made of stainless steel mesh (Figure 6). The macropores had a diameter of ∼1 cm and a length of 40 cm. These specifications were in line with the experiment described in Zhou et al. [17]. Both hillslopes were centered at the outlet of the rainfall simulator, since, in the middle of the rainfall simulator, the rainfall intensities had the smallest variety. At the downslope part of the hillslopes, a stainless steel fine mesh and a filter cloth were placed in front of the soil to prevent the soil from sliding down the hillslope. Water was allowed to flow through the mesh and the filter cloth without any clogging. Tests in the soil physics laboratory confirmed this. A wooden and metal construction was also placed in front of the outlet but did not prevent water from flowing out freely. This construction was placed to prevent movement of the hillslope containers under the three-degree slope.
The boundary conditions for the flow domain (the hillslope) contained three characteristics that are based on the study by Nieber and Sidle [1], which focused on how disconnected macropores in sloping soils facilitate preferential flow. The first characteristic is that the lateral sides, bottom, and upslope boundaries are an impermeable boundary. Second, rainfall could infiltrate via the top surface (where rain is the intensity of rainfall at the soil surface), and third, there is free drainage at the downslope boundary.
To measure drainage, both hillslopes drained into two funnels, which were connected to a hose and ended up in two open barrels in the basement of the hydraulics laboratory. In these barrels, two pressure sensors were placed to measure drainage over time. The measurement interval of these pressure sensors was the same as the soil moisture sensors: one measurement per minute. To handle a rainfall intensity of 100 mm·h 1 , the volume of the barrels needed to be at least 100 mm·h 1 × 1.5 m 2 = 150 L for 1 h rainfall events. Therefore, we used two barrels with a volume of 216 L.
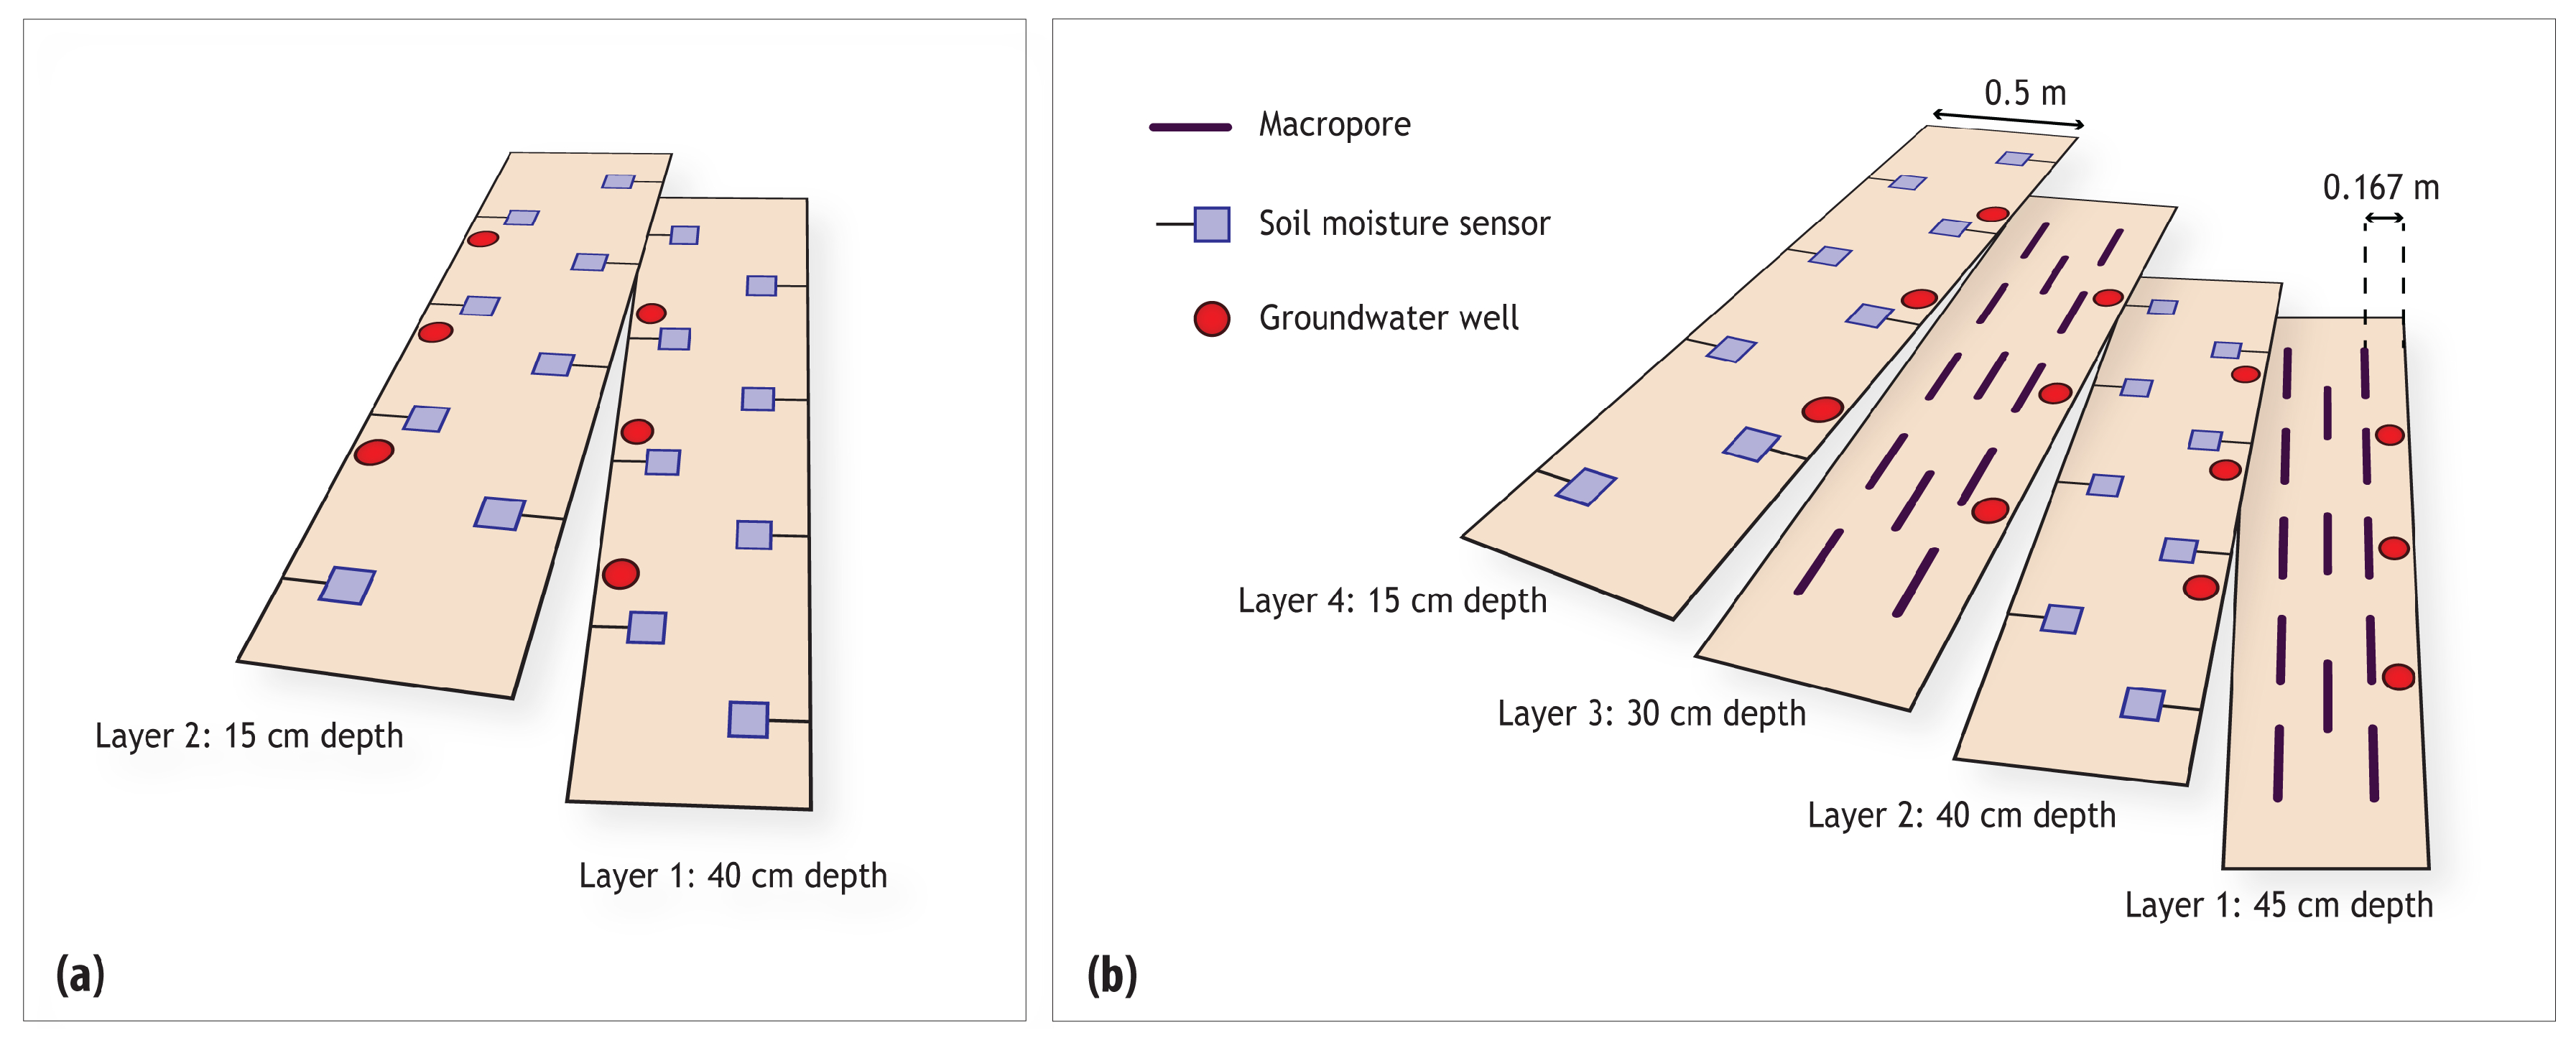
To measure soil moisture, each hillslope contained a similar set of sensors (ECH2O-10, Decagon Devices, Pullman, WA, USA). To make sure the sensors did not interfere with the macropores, the sensors were placed in different layers than the macropores (Figure 7). In each hillslope, two layers of eight soil moisture sensors were placed at 40 cm depth and 15 cm depth. These sensors measured soil moisture with an interval of 1 min and have a measurement range of 0%−40% volumetric water content and an accuracy of ± 4 % [37]. The sensors were not custom calibrated to measure the exact quantity of soil moisture, but factory calibration was used to measure the relative change in soil moisture.

4. Results from Hillslope Experiment

This section shows the results of the rainfall simulator hillslope experiment. A comparison between the data of the hillslope that does not contain macropores (hillslope 1) and the data of the hillslope that does contain macropores (hillslope 2) was made. The comparison is based on the obtained data of the rainfall–runoff relationship and soil moisture content.

4.1. Rainfall & Drainage

Figure 8 shows the spatial variation of the four rainfall events. Clearly, the spatial and temporal distribution is not homogenous and the two hillslopes likely receive a different amount of water. Naturally, any differences in precipitation on the hillslopes will also affect the outflow rates.
It was expected that hillslope 2 (including macropores) would drain water faster and more than hillslope 1 (without macropores). Unfortunately, due to heterogeneous rainfall intensity, this could not be confirmed. Instead, hillslope 1 drained more water than hillslope 2. Figure 9 shows the difference in cumulative drainage for the same period as the rainfall events of Figure 8. Cumulative drainage increases until the rainfall event stops. From there, cumulative drainage stays rather stable but shows some fluctuation, possibly due to evaporation during the day and some release of pendular water during the night. Table 4 shows the average differences between the two hillslopes in rainfall intensity and drainage for the same dates. It can be seen that the differences in drainage are approximately the differences in rainfall intensity. Rainfall intensity on 17 April, although not homogenous, was approximately the same for both hillslopes. The small difference in drainage between the two hillslopes confirms that the difference in rainfall intensity was minimal in comparison to the other rainfall events.

4.2. Recession of Drainage

The difference in rainfall intensity for both hillslopes made it difficult to investigate the influence of macropores on runoff processes. To omit the influence of the heterogeneous rainfall intensity, it was decided to investigate the recession part of the drainage. Following Brutsaert and Nieber [38] the rate of flow recession was estimated as the difference in discharge between two successive time steps, d Q / d t = ( Q t Δ t Q t ) / Δ t , and plotted as a function of the average discharge over the two hours, ( Q t Δ t + Q t ) / 2 . Estimating the terms in this way avoids any artifactual correlation between Q and d Q / d t [38,39,40].
Under low discharge conditions, there is often no change in drainage, and occasionally drainage was even observed to increase. By definition, these points do not correspond to flow recession, and, therefore, a sensible consequence would be to remove such points from the analysis. However, at low discharge, these points may represent random fluctuations around an average recession trend. Therefore, excluding such points from the analysis would be preferentially removing random deviations in one direction, which would lead to a biased estimate of the average recession rate [40]. Hence, in order to estimate the functional relationship between dQ/dt and Q, the fluctuations at low discharge must be considered. In Figure 10, this is attempted by binning the individual data points per 5 min into ranges of Q, and then calculating the mean and standard error for d Q / d t and Q within each bin. The mean values are the red dots in Figure 10 [38,39].
What is striking in Figure 10 is that even after binning the data, the negative values remain. This could be due to the fact that the recession part of the drainage is very steep, thus there are not enough data points in the recession part before drainage reaches zero and continues to vary around zero. These variations of positive drainage in the recession part could cause the negative values in the Q,dQ/dt plots. When enlarging the range of Q, the points that remain would be zero. The flat slopes (varying from 0 . 13 x to 0 . 21 x ) of the Q,dQ/dt relationship confirm the number of zero values.
To investigate if the Q,dQ/dt relationship of the recession part of the two different hillslopes differ significantly from each other, the confidence intervals of the same rainless periods (on 4 April, 7 April, 14 & 15 April and 17 April) for each hillslope are plotted in the same graph (Figure 11a–d). Since the recession plots of each rainfall event per hillslope should be the same, plots of confidence intervals for different dates of the same hillslope were made (Figure 11e,f).
Figure 11e,f show that both hillslopes react differently after different rainfall events. Thus, even within one hillslope, the recession parts and their confidence intervals are not similar to each other. It can be presumed that the variation between different events within the same hillslope is already too high to draw robust conclusions on any differences between the hillslopes and thus the effect of macropores on recession.

4.3. Soil Moisture

Figure 12 shows the soil moisture contents in the top layers and bottom layers of both hillslopes. In Figure 12a,b, the rainfall events are clearly visible in the response of the soil moisture sensors, where a maximum of ± 25 % soil moisture content is reached. In contradiction, the data of the soil moisture sensors in the deepest layer (Figure 12c,d) show barely any dynamics. It appears that, after the first rainfall event, the soil moisture sensors remain saturated at a value of ± 25 % . However, a maximum of ± 25 % saturation seems too low for this type of soil and can be assigned to the fact that the sensors were not custom calibrated, but factory calibration was used. This theory can be confirmed by looking at Figure 12 to the soil moisture sensors in the top layer of the hillslopes. After the first rainfall peak, the sensors drop to 0% soil moisture content, which in fact was not the situation. After the first rainfall peak, which reaches a maximum of ± 25 % soil moisture content, all of the other peaks show the same characteristics. This could mean that the bottom layer is permanently wet due to pendular water. Laboratory data confirms a high amount of pendular water in S90 sand when comparing this to the estimated pore volume. Table 5 shows that the volume of pendular water that stays behind in the soil column is a little bit lower than the estimated pore volume of 40%. The amount of pendular water almost corresponds with the amount of pore volume. This means a significant amount of pendular water stays behind in S90 sand and could explain the few dynamics in the deepest layer of soil moisture sensors.

5. Discussion

This study aimed to investigate if a laboratory (closed system) experiment can be produced to examine the influence of macropores on runoff processes inside a hillslope, and whether macropores influence the hydrological response of a small artificial hillslope. Results from initial soil column experiments showed that our artificial macropores and chosen sand type were suitable to investigate the influence of macropores on drainage. The hillslope experiment set-up inside the rainfall simulator was highly sufficient and overland flow did not occur during the experiment when using the low intensity nozzles. However, the influence of macropores on the hydrological response of the small artificial hillslope was minimal. Hence, some improvements can be made for future experiments, and it should be taken into consideration if other mechanisms like overland flow, infiltration capacity and varying rainfall intensity are equally as important to investigate. This section will provide some recommendations and discussion points on this study.

5.1. Macropores

The stainless steel mesh that was used in this experiment and in the experiment by Zhou et al. [17] to fabricate the artificial macropores had almost the same characteristics as large real macropores. After the hillslope experiment, it could be observed that the macropores were intact and did not collide under the heavy weight of the sand. The filter cloth surrounding the macropores prevented sand from filling the macropores. Thus, in future experiments, similar material can be used.
Although soil column experiments showed a clear difference between soil columns including macropores and soil columns without macropores, a visible difference between the hillslope including macropores and hillslope without macropores was not that evident. In the soil column experiments, the macropores were placed vertically as was described in the article by Castiglione et al. [26] and with a boroscope it was visible that water was flowing through the macropores. Inside the hillslope experiment, the macropores were placed horizontally, since it was assumed that the macropores would have a larger influence when placed parallel to the flow direction. It is not certain that the water inside the hillslope flowed through the macropores and whether the macropores had an influence on runoff processes when placed in a horizontal direction. Perhaps, in future experiments, an ensemble of vertical macropores should be placed inside the soil to investigate if this has a larger influence on runoff processes.
It might be possible that the vertical macropores in the soil column experiments had a larger impact on the difference in drainage, since the macropores are aligned with the functioning of gravity and parallel to the flow direction. Perhaps, increasing the slope of the hillslope would also contribute to a larger difference between the two hillslopes, since Nieber and Sidle [1] used a slope of 15 , and, in this case, a slope of 3 was applied. However, when increasing the slope, saturation will be reduced. Laboratory experiments showed that water was draining out of the soil column after the soil column was approximately saturated. The influence of macropores became visible after saturation. Thus, when increasing the slope of the hillslope and reducing saturation, the influence of macropores could be reduced. Experiments with different slopes should be performed in future experiments.
The amount of macropores was based on the model Nieber and Sidle [1] used in their experiment, namely 21 macropores. In order to increase the effect of macropore flow, five more macropores were added in our experiment, namely 26 macropores. For future experiments, besides adding vertical macropores to the horizontal ones, more macropores can also be added to the soil.

5.2. Sand Type

Based on the laboratory experiments, S90 sand was considered to be the most suitable sand type to use during the hillslope experiment, since it served all the requirements and a clear influence of macropores was visible. However, after investigating the drainage data of the hillslope experiment, drainage occurred at high rates, which made it difficult to investigate the influence of macropores. Therefore, the use of a soil type containing more clay particles or organic material for the next experiment, as was described in Zhou et al. [17], could lead to more realistic drainage characteristics and a better investigation of the influence of macropores on runoff processes. However, during the laboratory experiments, different sand types were investigated including sand types with more clay particles and a mixture based on the article by Zhou et al. [17]. All of these sand types showed a low infiltration capacity and did not reach saturation. Consequently, the influence of macropores was not visible. This could mean that overland flow would be a more important mechanism to investigate.

5.3. Rainfall

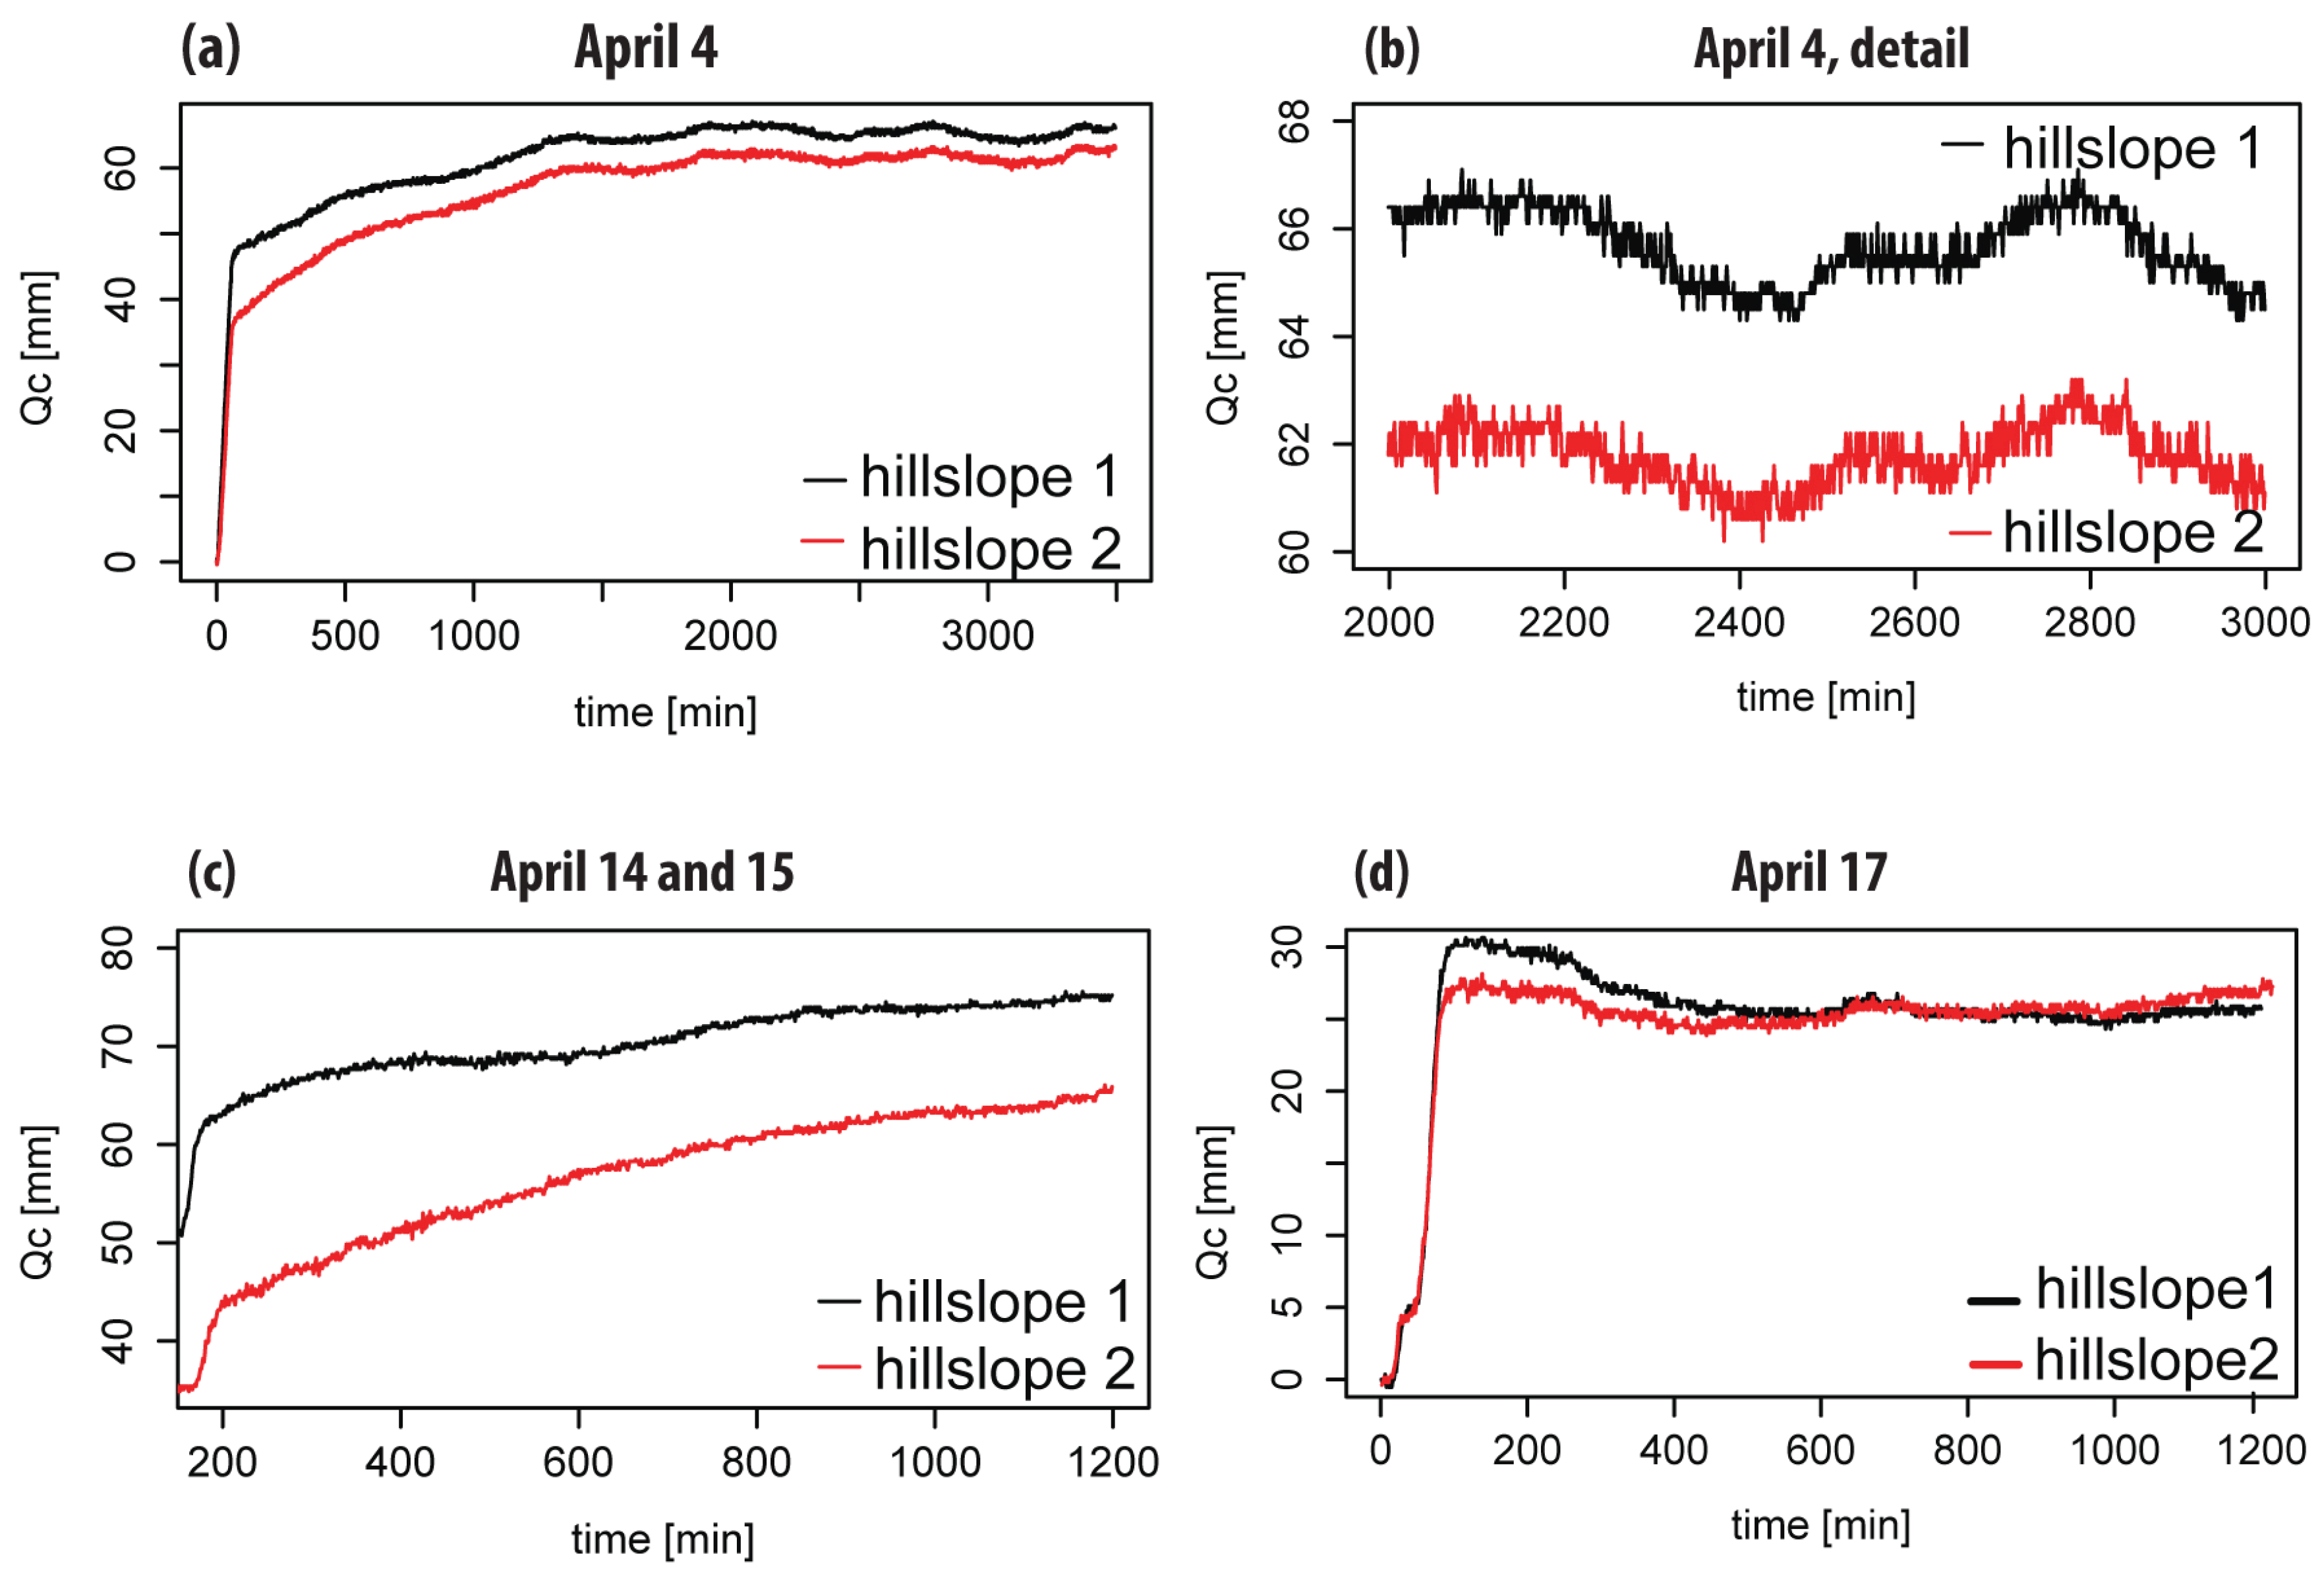
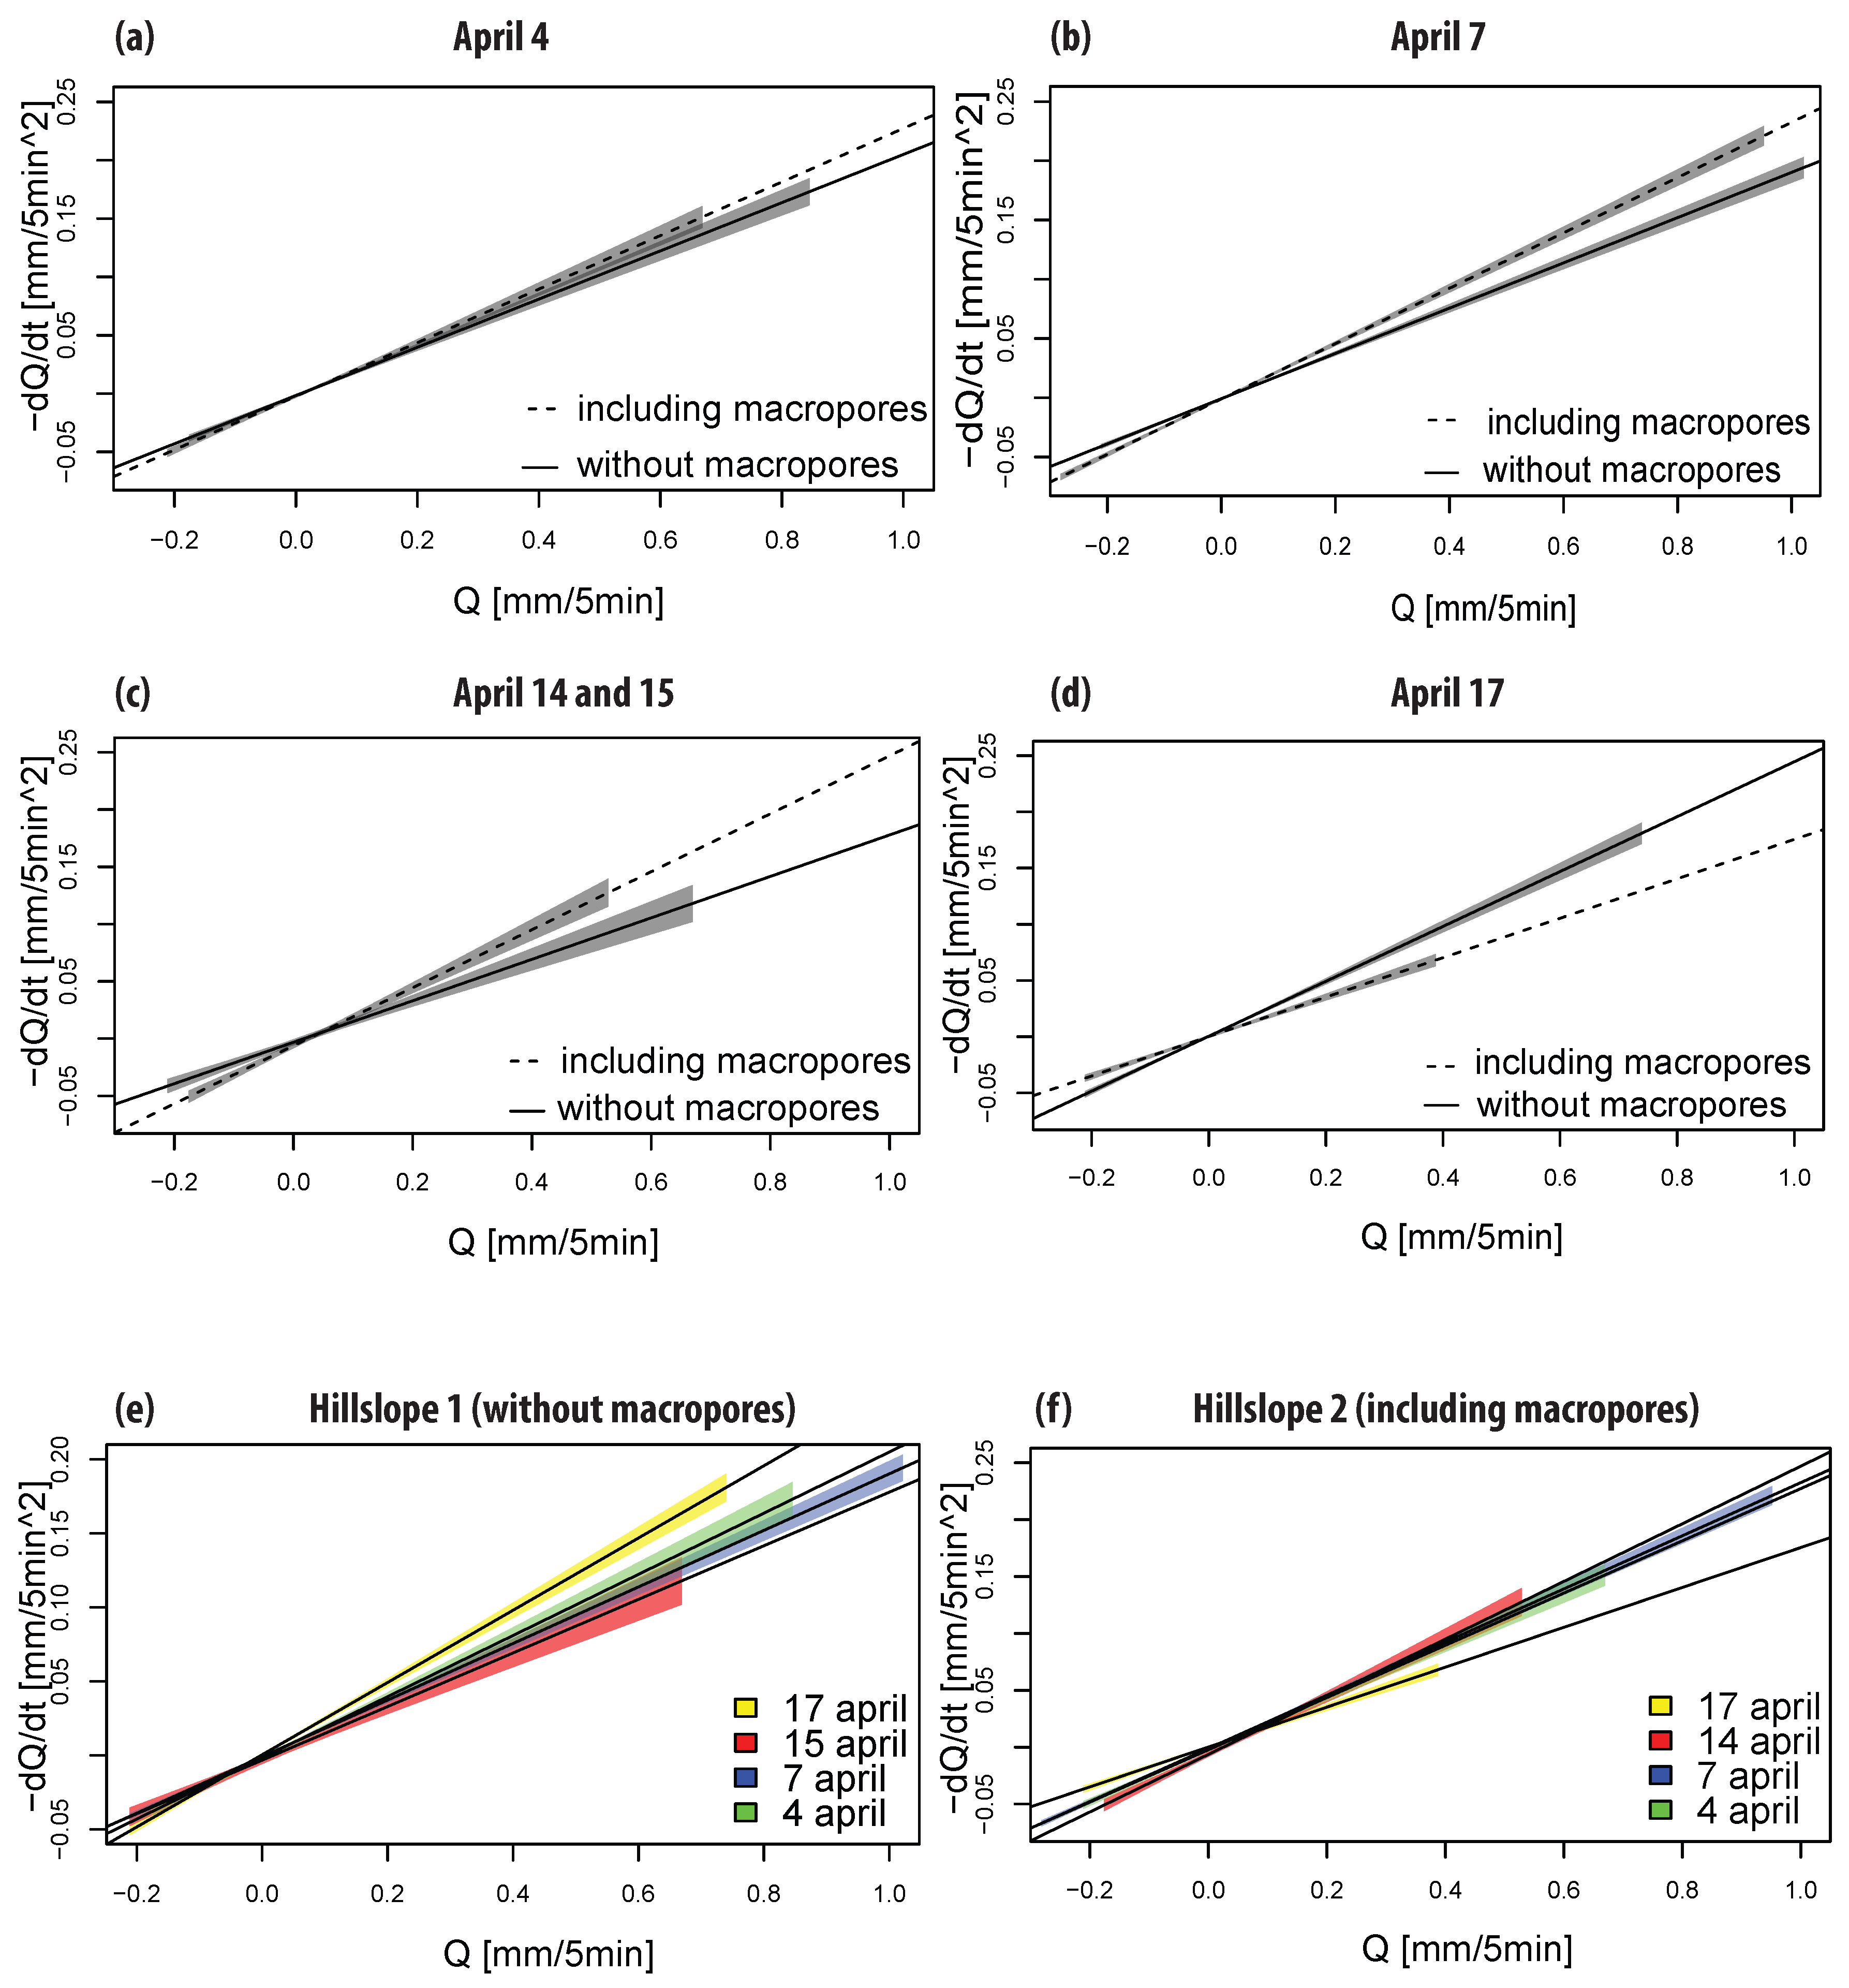
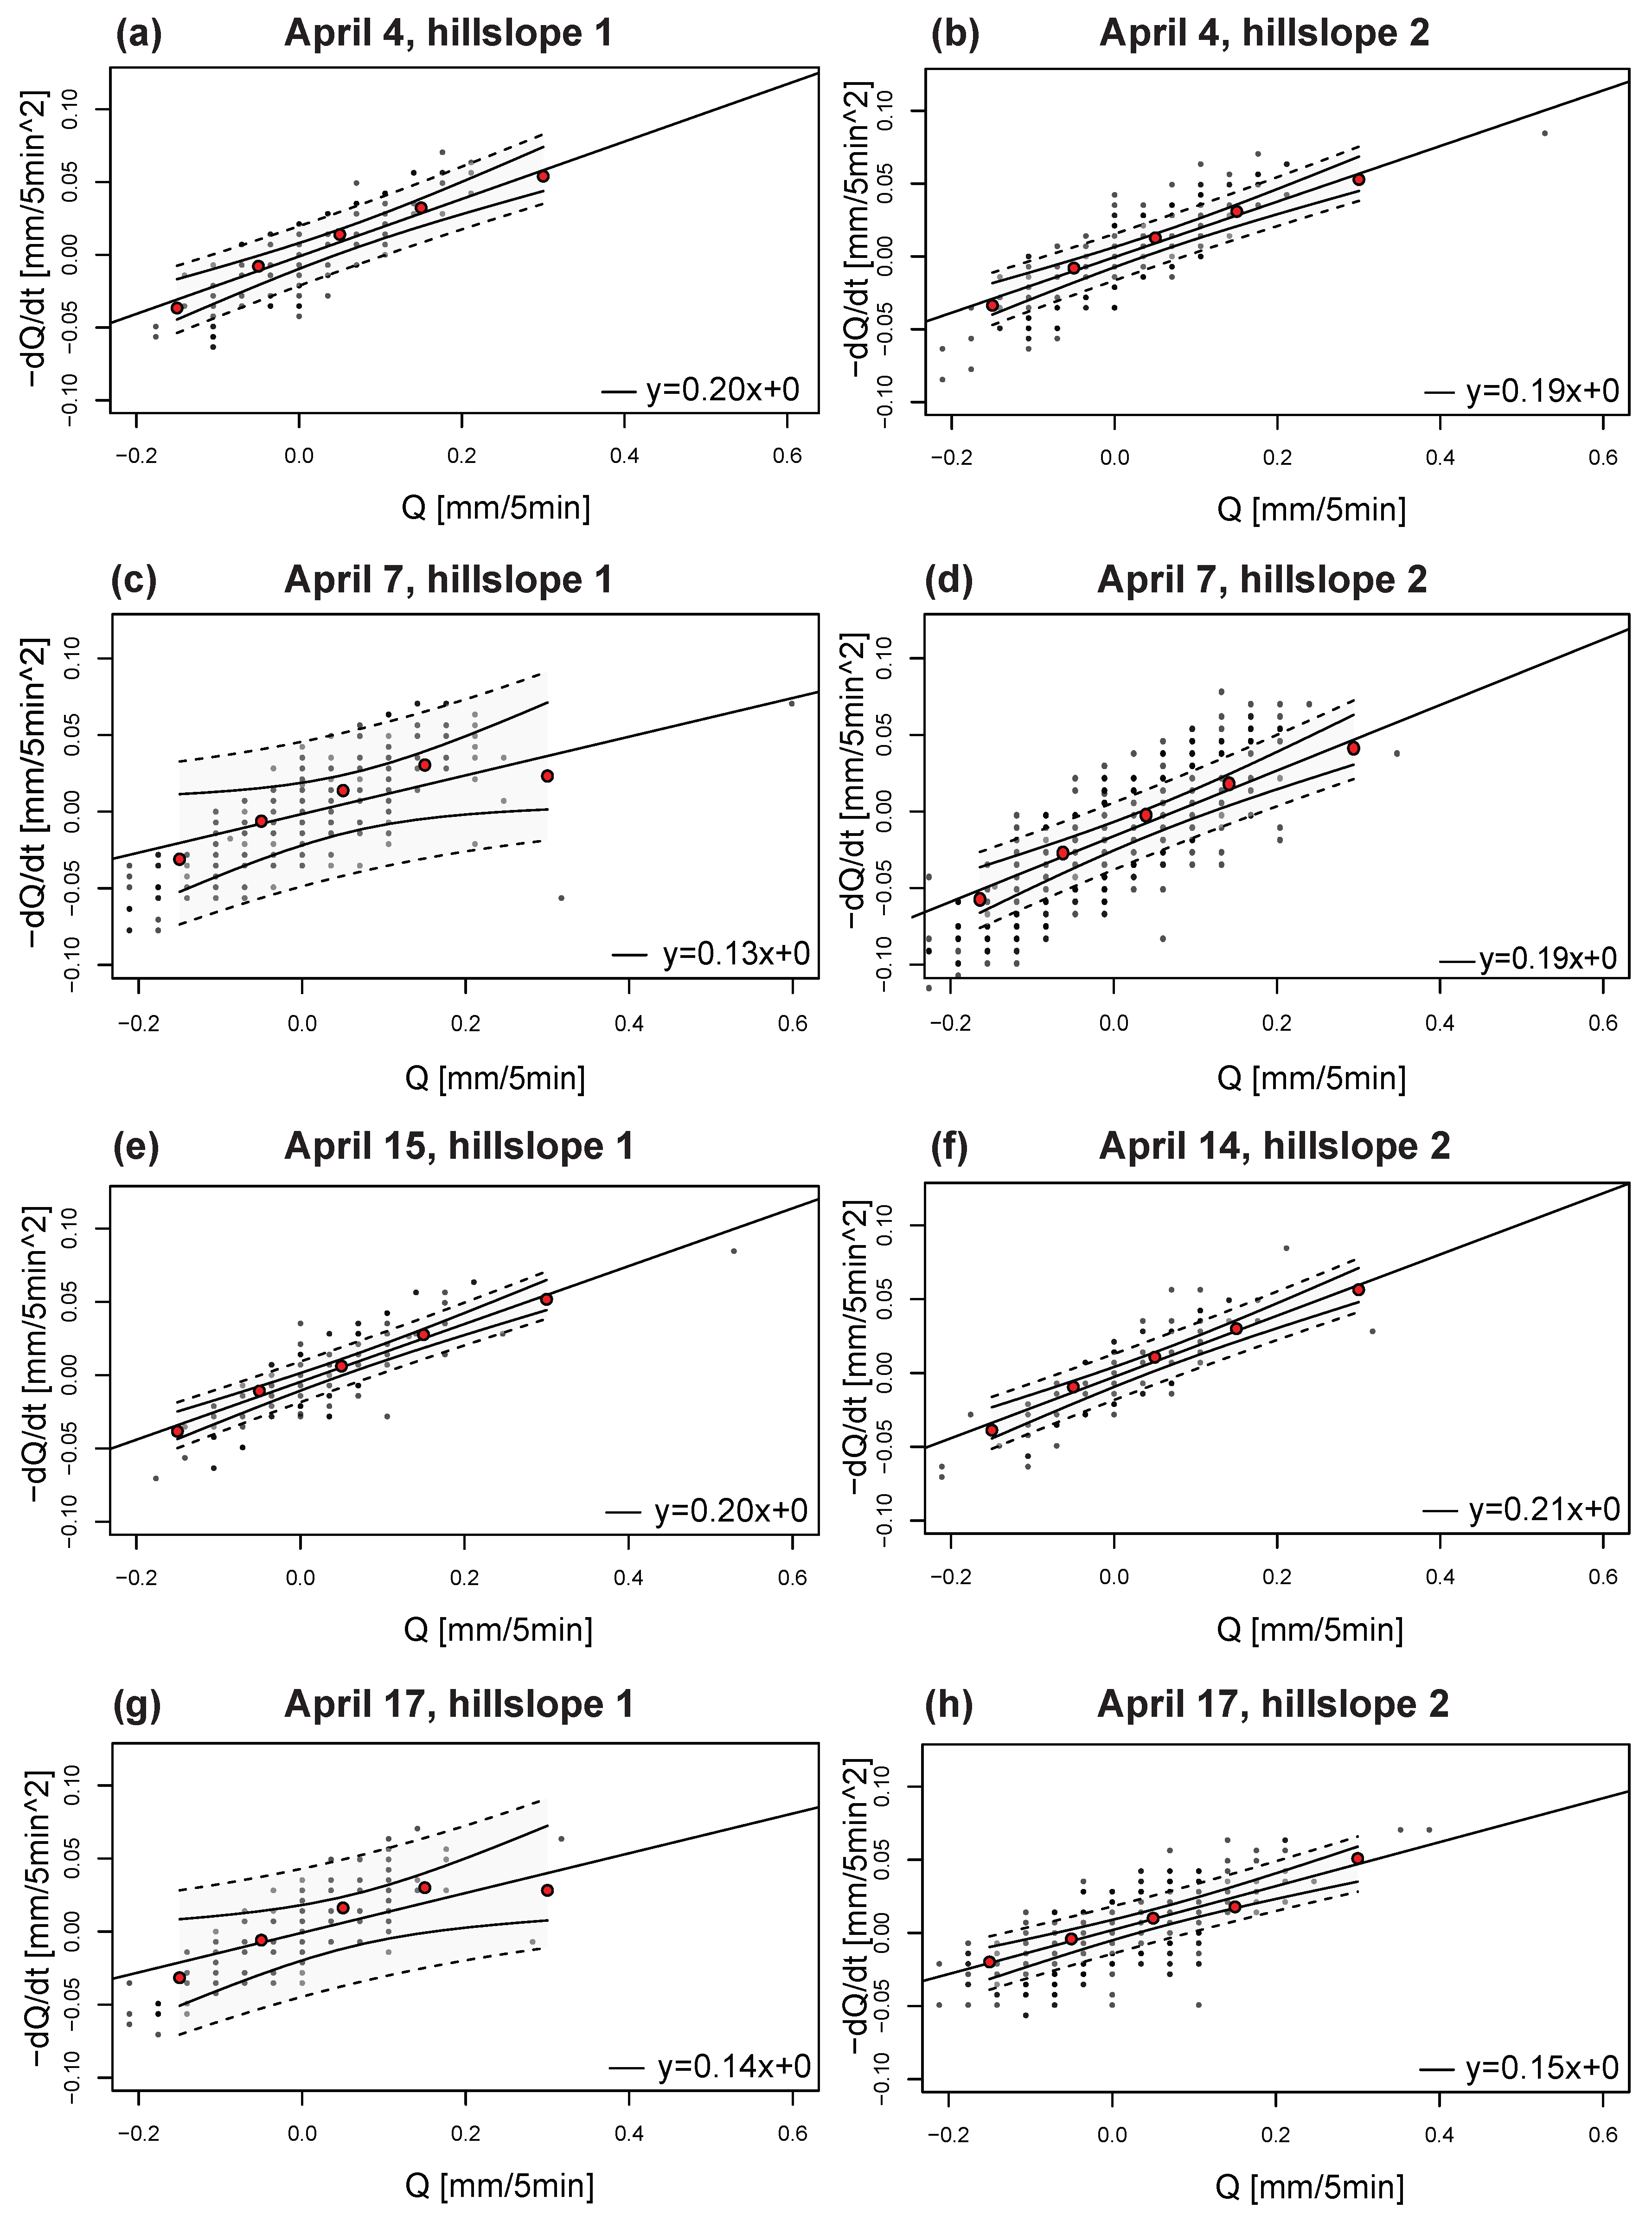
It turned out that the distribution of rainfall in the simulator was not homogeneous. In this experiment, the task was made more complicated by irrigating two hillslopes at the same time. However, on April 14 and April 15, both hillslopes were irrigated separately, and, by changing the position of the nozzles, both hillslopes could receive approximately the same amount of rainfall. The observed difference in drainage between both hillslopes was caused by the difference in rainfall intensity and mostly obscured the influence of macropores. However, a recession analysis of drainage can remove the drainage response dependency on rainfall intensity. As long as the amount of rainfall is known, a recession analysis can describe the influence of macropores on drainage. For future experiments, it is recommended to irrigate the hillslopes separately; thus, the difference in the amount of rainfall can be overcome and is known more precisely.

5.4. Drainage

Both hillslopes drained into two barrels with a diameter of approximately 60 cm. A pressure transducer inside the barrel measured the water pressure, and this could be converted to a drainage rate. Although the measurement interval of the ressure transducers was one minute, there were not enough data points in the drainage recession part to draw robust conclusions. Perhaps, it would be better to use barrels with a smaller diameter to observe more differences in water pressure between the measurement intervals or increase the measurement interval, as was done during the laboratory experiments. Tipping buckets would be another measuring method that can be considered for future experiments, since they measure very accurately when calibrated correctly.

5.5. Soil Moisture

Soil moisture data showed a significant amount of pendular water inside the hillslope. This could imply that the air entry value of this system is low. The study by Castiglione et al. [26] describes an experiment where the lateral water diffusion in an artificial macroporous system is investigated. Several experiments with soil columns including macropores and without macropores were performed. It allowed them to discriminate between macropore flow and matrix flow, and to measure the interdomain exchange flux. It showed that the influence of macropores can be minimal due to a low air entry value and lack of vertical flow, which causes the pressure difference between the matrix and macropores to vanish sooner. Therefore, equilibrium can be reached in a relatively short time Castiglione et al. [26]. Hence, pendular water is not desired to investigate the influence of macropores inside a hillslope.

6. Conclusions

This study provides a useful description of a suitable laboratory (closed system) experiment to examine the influence of macropores on runoff processes inside a hillslope. Functional artificial macropores are found and a better outline is presented to determine the correct sand type for these type of experiments. Progress has been made to investigate whether macropores influence the hydrological response of a small artificial hillslope. By using the presented recession method to analyse the influence of macropores on runoff, heterogeneity in rainfall intensity can be overcome, as long as the amount of rainfall is known and the recession part of the drainage data is long enough to use Q,dQ/dt plots.
This study showed that the influence of macropores on drainage for the hillslope experimental conditions was minimal. Therefore, based on our results, improvements can be made for future experiments. For example, S90 had typical characteristics that lead to a large amount of pendular water inside the hillslope and could mean that it has a low air entry value, which reduces the influence of macropores on runoff as well. However, it should also be taken into consideration whether other mechanisms like overland flow, infiltration capacity and varying rainfall intensity are equally as important to investigate. In conclusion, this study is a good point of reference to start future experiments from concerning macropores and hillslope hydrology.

Acknowledgments

We would like to thank Tobias Nootenboom, Dirk Nootenboom and Cees Smit for helping us with the design and construction of the two hillslopes that were used for our rainfall simulator experiment. Y.S: I would especially like to thank my father Cees Smit for being my biggest help and support during my PhD research, for all the times that he guided me through my insecurities and giving me the courage to continue. Dad, you are dearly missed but never forgotten. I love you.

Author Contributions

Y.S., A.J.T. and M.v.d.P. conceived and designed the experiments, analysed and interpreted the data, and wrote the paper. Y.S. performed the experiments.

Conflicts of Interest

The authors declare no conflict of interest.

References

  1. Nieber, J.L.; Sidle, R.C. How do disconnected macropores in sloping soils facilitate preferential flow? Hydrol. Process. 2010, 24, 1582–1594. [Google Scholar] [CrossRef]
  2. Hewlett, J.D.; Hibbert, A.R. Factors affecting the response of small watersheds to precipitation in humid areas. In Proceedings of the International Symposium on Forest Hydrology; Pergamon Press: London, UK, 1967. [Google Scholar]
  3. Ragan, R.M. An experimental investigation of partial area contributions. Proceedings of the Berne Symposium. Int. Assoc. Sci. Hydrol. 1967, 70, 241–249. [Google Scholar]
  4. Hursh, C.R.; Brater, E.F. Separating storm-hydrographs from small drainage areas into surface- and subsurface-flow. Trans. Am. Geophys. Union 1941, 22, 863–871. [Google Scholar] [CrossRef]
  5. Gessesse, B.; Bewket, W.; Bräuning, A. Model-Based Characterization and Monitoring of Runoff and Soil Erosion in Response to Land Use/land Cover Changes in the Modjo Watershed, Ethiopia. Land Degrad. Dev. 2015, 26, 711–724. [Google Scholar] [CrossRef]
  6. Van der Ploeg, M.J.; Appels, W.M.; Cirkel, D.G.; Oosterwoud, M.R.; Wi, J.P.M.; van der Zee, S.E.A.T.M. Microtopography as a Driving Mechanism for Ecohydrological Processes in Shallow Groundwater Systems. Vadose Zone J. 2011. [Google Scholar] [CrossRef]
  7. Sidle, R.C. Field observations and process understanding in hydrology: Essential components in scaling. Hydrol. Process. 2006, 20, 1439–1445. [Google Scholar] [CrossRef]
  8. Niu, G.Y.; Pasetto, D.; Scudeler, C.; Paniconi, C.; Putti, M.; Troch, P.A.; DeLong, S.B.; Dontsova, K.; Pangle, L.; Breshears, D.D.; et al. Incipient subsurface heterogeneity and its effect on overland flow generation–insight from a modeling study of the first experiment at the Biosphere 2 Landscape Evolution Observatory. Hydrol. Earth Syst. Sci. 2014, 18, 1873–1883. [Google Scholar] [CrossRef] [Green Version]
  9. Teuling, A.J.; Lehner, I.; Kirchner, J.W.; Seneviratne, S.I. Catchments as simple dynamical systems: Experience from a Swiss prealpine catchment. Water Resour. Res. 2010, 46, W10502. [Google Scholar] [CrossRef]
  10. Hendrickx, J.M.H.; Flury, M. Uniform and Preferential Flow, Mechanisms in the Vadose Zone, Conceptual Models of Flow and Transport in the Fractured Vadose Zone; The National Academies Press: Washington, DC, USA, 2001; Chapter 5; p. 150. [Google Scholar]
  11. Tromp-van Meerveld, H.J.; McDonnell, J.J. Threshold relations in subsurface stormflow: 1. A 147-storm analysis of the Panola hillslope. Water Resour. Res. 2006, 42, W02410. [Google Scholar] [CrossRef]
  12. Noguchi, S.; Tsuboyama, Y.; Sidle, R.C.; Hosada, I. Morphological characteristics of macropores and the distribution of preferential flow pathways in a forested slope segment. Soil Sci. Soc. Am. J. 1999, 63, 1413–1423. [Google Scholar] [CrossRef]
  13. Mulungu, D.M.M.; Ichikawa, Y.; Shiiba, M. A physically based distributed subsurface-surface flow dynamics model for forested mountainous catchments. Hydrol. Process. 2005, 19, 3999–4022. [Google Scholar] [CrossRef]
  14. Zhang, G.P.; Savenije, H.G.G.; Fenicia, F.; Pfister, L. Modelling subsurface storm flow with Representative Elementary Watershed (REW) approach: Aapplication to the Alzette River Basin. Hydrol. Earth Syst. Sci. 2006, 10, 937–955. [Google Scholar] [CrossRef]
  15. Tani, M. Analysis of runoff-storage relationships to evaluate the runoff-buffering potential of a sloping permeable domain. J. Hydrol. 2008, 360, 132–146. [Google Scholar] [CrossRef]
  16. Costa, J.; Aparicio, V.; Cerdá, A. Soil physical quality changes under different management systems after 10 years in the Argentine humid Pampa. Solid Earth 2015, 6, 361–371. [Google Scholar] [CrossRef]
  17. Zhou, B.B.; Li, Y.; Wang, Q.J.; Jiang, Y.L.; Li, S. Preferential water and solute transport through sandy soil containing artificial macropores. Environ. Earth Sci. 2013, 70, 2371–2379. [Google Scholar] [CrossRef]
  18. Edwards, W.M.; Shipitalo, M.J.; Owens, L.B.; Dick, W.A. Factors affecting preferential flow of water and atraxine through earthworm burrows under continuous no-till corn. J. Environ. Qual. 1993, 22, 453–457. [Google Scholar] [CrossRef]
  19. Shirmohammadi, A.; Skaggs, R.W. Predicting infiltration for shallow water table soils with different surface covers. Trans. ASAE 1985, 28, 1829–1837. [Google Scholar] [CrossRef]
  20. Ehlers, W. Observations on earthworm channels and infiltration on tilled and untilled loess soil. Soil Sci. 1975, 199, 242–249. [Google Scholar] [CrossRef]
  21. Schaik, N.L.M.B.V.; Bronstert, A.; de Jong, S.M.; Jetten, V.G.; Dam, J.C.V.; Ritsema, C.J.; Schnabel, S. Process-based modelling of a headwater catchment in a semi-arid area: The influence of macropore flow. Hydrol. Process. 2013. [Google Scholar] [CrossRef]
  22. Kluitenberg, G.J.; Horton, R. Effect of solute application method on preferential transport of solutes in soil. Geoderma 1990, 46, 283–297. [Google Scholar] [CrossRef]
  23. Beven, K.; Freer, J. Equifinality, data assimilation, and uncertainty estimation in mechanistic modelling of complex environmental systems using the GLUE methodology. J. Hydrol. 2001, 249, 11–29. [Google Scholar] [CrossRef]
  24. Kirchner, J.W. Getting the right answers for the right reasons: linking measurements, analyses, and models to advance the science of hydrology. Water Resour. Res. 2006, 42. [Google Scholar] [CrossRef]
  25. Oreskes, N.; Frechette, K.S.; Belitz, K. Verification, Validation, and Confirmation of Numerical Models in the Earth Sciences. Science 1994, 263, 641–646. [Google Scholar] [CrossRef] [PubMed]
  26. Castiglione, P.; Mohanty, B.P.; Shouse, P.J.; Simunek, J.; van Genuchten, M.T.; Santini, A. Lateral Water Diffusion in an Artificial Macroporous System: Modeling and Experimental Evidence. Vadose Zone J. 2003, 2, 212–221. [Google Scholar] [CrossRef]
  27. Masselink, R.; Keesstra, S.; Temme, A.; Seeger, M.; Giménez, R.; Casalí, J. Modelling Discharge and Sediment Yield at Catchment Scale Using Connectivity Components. Land Degrad. Dev. 2016, 27, 933–945. [Google Scholar] [CrossRef]
  28. Germer, K.; Braun, J. Macropore-Matrix Water Flow Interaction around a Vertical Macropore Embedded in Fine Sand - Laboratory Investigations. Vadose Zone J. 2015, 14, 2–15. [Google Scholar] [CrossRef]
  29. Naveed, M.; Moldrup, P.; Schaap, M.; Tuller, M.; Kulkarni, R.; Vögel, H.; Wollesen de Jonge, L. Macropore flow at the field scale: predictive performance of empirical models and X-ray CT analyzed macropore characteristics. Hydrol. Earth Syst. Sci. 2015, 12, 12089–12120. [Google Scholar] [CrossRef]
  30. Klaus, J.; Zehe, E.; Elsner, M.; Külls, C.; McDonnell, J.J. Macropore flow of old water revisited: experimental insights from a tile-drained hillslope. Hydrol. Earth Syst. Sci. 2013, 17, 103–118. [Google Scholar] [CrossRef] [Green Version]
  31. Iversen, B.V.; Lamande, M.; Torp, S.B.; Greve, M.H.; Heckrath, G.; de Jonge, L.W.; Moldrup, P.; Jacobsen, O.H. Macropores and Macropore Transport: Relating Basic Soil Properties to Macropore Density and Soil Hydraulic Properties. Soil Sci. 2012, 177, 535–542. [Google Scholar] [CrossRef]
  32. Nimmo, J.R. Preferential flow occurs in unsaturated conditions. Hydrol. Process. 2012, 26, 786–789. [Google Scholar] [CrossRef]
  33. Weilera, M.; Naef, F. Simulating surface and subsurface initiation of macropore flow. J. Hydrol. 2003, 273, 139–154. [Google Scholar] [CrossRef]
  34. Lassu, T.; Seeger, M.; Peters, P.; Keesstra, S.D. The Wageningen Rainfall Simulator: Set-up and Calibration of an Indoor Nozzle-Type Rainfall Simulator for Soil Erosion Studies. Land Degrad. Dev. 2015, 26, 604–612. [Google Scholar] [CrossRef]
  35. Woolhiser, D.A.; Smith, R.E.; Giraldez, J.V. Effects of spatial variability of saturated hydraulic conductivity on Itortonian overland flow. Water Resour. Res. 1996, 32, 671–678. [Google Scholar] [CrossRef]
  36. Hilberts, A.G.J.; van Loon, E.E.; Troch, P.A.; Paniconi, C. The hillslope-storage Boussinesq model for non-constant bedrock slope. J. Hydrol. 2004, 291, 160–173. [Google Scholar] [CrossRef]
  37. Decagon Devices. EC-20, EC-10, EC-5 Soil Moisture Sensors Users Manual, 10th ed.; Decagon Devices, Inc.: NE Hopkins Court Pullman, WA, USA, 2001–2010. [Google Scholar]
  38. Brutsaert, W.; Nieber, J.L. Regionalized drought flow hydrographs from a mature glaciated plateau. Water Resour. Res. 1977, 13, 637–643. [Google Scholar] [CrossRef]
  39. Rupp, D.E.; Selker, J.S. Information, artifacts, and noise in dQ/dt-Q recession analysis. Adv. Water Resour. 2006, 29, 154–160. [Google Scholar] [CrossRef]
  40. Kirchner, J.W. Catchments as simple dynamical systems: Catchment characterization, rainfall-runoff modeling, and doing hydrology backward. Water Resour. Res. 2009, 45. [Google Scholar] [CrossRef]
Figure 1. Set-up of soil column experiments.
Hydrology 03 00039 g001
Figure 2. Images made by a boroscope from inside a macropore (experiment 10). Pictures 1 and 2 show a dry macropore. Pictures 3 and 4 show a macropore filled with water (after the application of the twenty-fifth syringe and water started to drain out of the soil column). Note the colour difference between pictures 1 and 2 and 3 and 4.
Hydrology 03 00039 g002
Figure 3. The influence of macropores on (cumulative) drainage for a soil column experiment with S90 sand. (a) compares cumulative drainage (Qc) for experiment 11 (no macropores) and experiment 12 (including macropores); and (b) compares drainage (Q) over time between experiment 11 (no macropores) and 12 (macropores). Note that the breakthrough curves start at approximately the same time and only the peak for a soil column including macropores is higher.
Hydrology 03 00039 g003
Figure 4. The influence of macropores on drainage for a soil column experiment with building sand, where experiment 3 excludes macropores and experiment 5 includes macropores. Note that the soil column including macropores shows a higher peak and a more narrow breakthrough curve.
Hydrology 03 00039 g004
Figure 5. Comparison of the spatial distribution of rainfall intensities for two different nozzle types. (a) low intensity nozzles; and (b) high intensity nozzles.
Hydrology 03 00039 g005
Figure 6. (a) example of a set of macropores made of stainless steel mesh with a size of approximately 40 cm; and (b) the two hillslopes in a steel frame inside the rainfall simulator used for the experiment, viewed from upslope. Green rain gauges are positioned at the borders of the hillslopes and the yellow tubes were used for groundwater measurements.
Hydrology 03 00039 g006
Figure 7. Schematic drawing of the layers of soil moisture sensors and macropores inside hillslope 1 (a) and hillslope 2 (b). Note the resemblance between the layers with soil moisture sensors for both hillslopes, and the only differences are the two extra layers of horizontal macropores that are added to hillslope 2.
Hydrology 03 00039 g007
Figure 8. Spatial distributions of the rainfall intensity during four rainfall events. (a) 4 April where both hillslopes were sprinkled at the same time; (b) 17 April where again both hillslopes were sprinkled at the same time; (c) 14 April where only hillslope 2 (including macropores) was sprinkled and (d) 15 April where only hillslope 1 (without macropores) was sprinkled. Note that, on 4 April, the amount of rainfall for both hillslopes extremely vary, while, on 17 April, both hillslopes receive approximately the same amount of rainfall, but the intensity varies.
Hydrology 03 00039 g008
Figure 9. Difference in cumulative drainage (Qc) between hillslope 1 (without macropores) and hillslope 2 (including macropores). (a) Qc on 4 April when rainfall intensity was very heterogeneous and the amount of rainfall that both hillslopes received varied as well; (b) details of the difference in Qc on 4 April—note the daily variations; (c) Qc on 14 April (hillslope 2, including macropores and 15 April (hillslope 1, without macropores). Note that the amount of Qc for hillslope 1 is higher; and (d) Qc on 17 April when rainfall intensity was heterogeneous, but there was a small difference between the received amount of rainfall between the two hillslopes.
Hydrology 03 00039 g009
Figure 10. Flow recession rates (dQ/dt) as a function of flow (Q) for rainless periods on different days (black dots, measured points) and for averages of dQ/dt, binned as described in the text (red dots). The binned means (red dots) deviate from the fitted lines by less than their standard errors, suggesting that the fitted lines are a quantitatively adequate description of the mean recession behaviour of hillslope 1 on: (a) April 4, (c) April 7, (e) April 15, and (g) April 17 and of hillslope 2 on: (b) April 4, (d) April 7, (f) April 14, and (h) April 17.
Hydrology 03 00039 g010
Figure 11. Comparison of drainage characteristics of the two hillslopes. (ad) show the comparison of the confidence intervals for four different dates of rainless periods between hillslope 1 (without macropores) and hillslope 2 (including macropores); (e,f) show the comparison between the confidence intervals for four different dates per hillslope. Note that the difference between the confidence intervals of the two hillslopes is as large as the difference between the confidence intervals of each hillslope itself.
Hydrology 03 00039 g011
Figure 12. Soil moisture content measured over time in different layers. (a,b) show soil moisture measurements over time (seconds) at a depth of 15 cm for hillslope 1 (without macropores) and hillslope 2 (including macropores), respectively. Note the clear effect of different rainfall events; (c,d) show soil moisture measurements over time (seconds) at a depth of 40 cm. Note the lack in fluctuations and the constant value of approximately 20% in soil moisture content after application of the first rainfall event.
Hydrology 03 00039 g012
Table 1. Overview of the soil column experiments in the soil physics laboratory.
Experiment NumberSoil TypeMacroporesLength Column (cm)Diameter Column (cm)BoroscopeGravimetric Water Content (g)Amount of Added Water When Ponding Occurred (mL)
1Loamy sandno39.518.4no0.147360
2Building sandno3318.4no0.01200
3Building sandno3318.4no1.0600
4Loamy sandyes3318.4no0.256420
5Building sandyes3318.4no0.01200
6S90 sandno42.518.4no0.0no occurrence
7S90 sandno3318.4no0.0no occurrence
8S90 sandyes3318.4no0.0no occurrence
9Building sandno3318.4no0.01200
10Building sandyes3318.4yes0.01200
11S90 sandyes3318.4yes0.0no occurrence
12S90 sandyes3318.4yes0.0no occurrence
Table 2. Sieve curves of loamy sand and building sand.
Grain SizeLoamy Sand %Building Sand %
>10002.111.1
500–10007.625.9
420–5002.511.8
300–4207.524.2
250–3003.79.5
175–2505.814.0
100–17510.03.5
0–10060.80.1
Table 3. Overview of all rainfall events.
Rainfall EventDateNozzle TypeDuration (min)Remarks
13 April 2014high intensity15both hillslopes, control rainfall measurements
24 April 2014high intensity15both hillslopes, control rainfall measurements
34 April 2014high intensity43both hillslopes, occurrence of ponding
44 April 2014low intensity50both hillslopes
54 April 2014low intensity57both hillslopes
67 April 2014low intensity60both hillslopes
77 April 2014low intensity15both hillslopes
814 April 2014low intensity60only hillslope 2
914 April 2014low intensity15only hillslope 2, control rainfall measurements
1015 April 2014low intensity60only hillslope 1
1115 April 2014low intensity15only hillslope 1, control rainfall measurements
1217 April 2014low intensity15both hillslopes, control rainfall measurements
Table 4. Differences in rainfall intensity and drainage between hillslope 1 and hillslope 2 on different dates.
DateDifference in Rainfall IntensityDifference in Drainage
4 April4.55 mm·h 1 4.88 mm·h 1
14 April and 15 April14.64 mm·h 1 13.85 mm·h 1
17 April1.46 mm·15 min 1 0.44 mm·15 min 1
Table 5. Amounts of pendular water in S90 sand.
Experiment NumberAmount of Added Water (mL)Amount of Drained Water (mL)Amount of Pendular Water (mL)Estimated Pore Volume * (mL) 6
61200012001300
7150012913711493
8150018813121493
11150047.91452.11493
121500103.91396.11493
* pore volume is based on an estimated porosity of 40%.

