1. Introduction
Under rainfall conditions, the seedbed structure changes due to aggregate breakdown, leading to the development of a crust, and facilitating overland flow and erosion. Two important factors in erosion studies are rainfall erosivity and soil erodibility. Rainfall erosivity depends mainly on rain intensity, raindrop size distribution, raindrop impact velocity and kinetic energy [
1,
2,
3,
4]. However, the main rain characteristics responsible for soil disaggregation are kinetic energy and rainfall intensity. These characteristics were combined together to produce erosivity indexes, such as EI30 [
5]. Soil erodibility and, hence, aggregate breakdown depend on the characteristics of the soil such as texture, mineralogy, organic matter, initial moisture and initial aggregate size distribution, aggregate size and stability, vegetation cover and soil management [
6,
7,
8,
9,
10,
11,
12].
Aggregation is a major feature of soil structure. It has a direct effect on the process of detachment and influences various aspects of the physical behavior of the soil. Various aggregate stability measurements have been proposed for predicting soil surface behavior and erosion [
13,
14,
15,
16,
17]. The greater stability of soil aggregates promotes higher resistance to disaggregation under the action of rain [
15]. Aggregate stability is considered an indicator of soil interrill erodibility, with poor aggregate stability corresponding to high potential for soil erodibility (and vice versa) [
18,
19].
Four main aggregate breakdown mechanisms under rain conditions are described by Le Bissonnais [
16]: (1) slaking, due to internal compression of the air when the aggregates are submitted to rapid wetting; (2) micro-cracking, for which the breakdown of aggregates results from differential expansion in the clays during wetting; (3) mechanical breakdown, where the raindrops, through their kinetic energy, apply a direct external pressure on the aggregates, causing disaggregation; and (4) physicochemical dispersion, through the action of cations such as Na
+ in the wetting water that results in a reduction in the forces of attraction between colloidal particles and, hence, causing disaggregation. These mechanisms depend on many factors, especially on the internal nature of the aggregates, the energy involved in disaggregation [
14,
20] and the soil properties that affect these mechanisms [
8].
Slaking is a very efficient breakdown mechanism, as shown by the low mean weighted diameter (MWD) recorded in stability tests [
16]. It occurs with rapid wetting of dry aggregates (such as immersion) and brings about a rupture due to pressure build-up by air trapped inside the individual aggregates exceeding its cohesion capacity [
16,
21]. In addition to the initial water content, swelling and intra-aggregate pressure are two factors frequently cited in the control of the slaking process [
21,
22,
23]. Disaggregation occurs within the first 8 s of immersion of dry aggregates, and the rupture occurs at their periphery [
22]. It was shown that micro-cracking and mechanical breakdown can actually occur under rainfall conditions [
24]. However, Legout et al. [
24] did not observe slaking. This could be related to the low rainfall intensity (30 mm·h
−1) used, which did not allow for the wetting to be fast enough.
While slaking has been demonstrated by direct immersion [
21,
22], its occurrence under rainfall remains yet to be shown. Yang et al. [
25] claimed to have demonstrated the occurrence of slaking because they observed a strong disaggregation at the initiation of rainfall (first 1.5 mm). While slaking can occur only at rainfall initiation (because the aggregates have to be dry), we believe this criterion is not sufficient because micro-cracking or mechanical breakdown could occur at this stage as well. Since slaking requires a fast wetting of the whole aggregate, disaggregation should be stronger for higher rainfall intensities and for smaller aggregates. Additionally, the observed disaggregation should not depend on the kinetic energy of the rainfall (which triggers mechanical breakdown).
The aim of this study was to evaluate the occurrence of slaking in the same soils (silt loam and clay loam) used by Legout et al. [
24], under both high intensity (90 mm·h
−1) and low intensity (28 mm·h
−1) rainfalls and different kinetic energy impacts (large and small raindrops), using a rain simulator.
2. Materials and Methods
The experiment was conducted at the Institut National de la Recherche Agronomique, INRA, France (French National Institute for Agricultural Research) in the Soil Science laboratory (UR Science du Sol) in Orléans, France.
Two soils with different textures were used: a silt loam (SL) from the Lauragais region (France), and a clay loam (CL) from the Normandy region (France). Soil samples were collected in the surface horizon (0–15 cm depth) from agricultural areas. Clay content was 112 g·kg−1 for SL and 360 g·kg−1 for CL. Organic carbon content was 20 g·kg−1 for SL and 18 g·kg−1 for CL. For the purpose of this experiment, the soil aggregates were separated into two classes by dry sieving: (1) 1–3 mm and (2) 3–5 mm.
2.1. Stability Tests
The aggregates were subjected to aggregate stability measurements, following the methodology proposed by Le Bissonnais [
16] that has become an ISO standard #10930 [
26]. Three separate treatments were applied to the aggregates to simulate the different breakdown mechanisms. The three treatments were: fast-wetting (FW) which promotes slaking; slow-wetting (SW) which promotes micro-cracking; and mechanical breakdown (MB). Each treatment was replicated three times for each aggregate size class.
2.2. Laboratory Rainfall Simulations
Simulated rainfall with deionized water was applied using a setup adapted from Legout et al. [
24] in order to address the occurrence of slaking. An oscillating-type rainfall simulator was used [
27]. It was equipped with spray nozzles of the VeeJet Spray Nozzle type (H/U 65/150, Spraying Systems Co., Wheaton, IL, USA) and the applied pressure was of 1 bar.
Four types of rainfall were applied: (1) High rainfall intensity (90 mm·h−1) and large raindrops (mean weighted diameter (MWD) = 2.3 mm), with a kinetic energy (KE) of 25.5 J·m−2·min−1; (2) High rainfall intensity (90 mm·h−1) and small raindrops (MWD = 1.5 mm), with a KE of 9.4 J·m−2·min−1; (3) Low rainfall intensity (28 mm·h−1) and large raindrops (MWD = 2.2 mm), with a KE of 7.2 J·m−2·min−1; (4) Low rainfall intensity (28 mm·h−1) and small raindrops (MWD = 1.4 mm), with a KE of 3.8 J·m−2·min−1. The rainfall simulator frequency was set to 20 sweeps/min−1 for the 28 mm·h−1 rainfall intensity and 60 sweeps/min for the 90 mm·h−1 rainfall intensity. This ensures an almost continuous rain for the high intensity rainfall.
The rationale for using different rainfall intensities and raindrop sizes was to alter the wetting process of the soil and the rain kinetic energy. To get the rainfall with smaller raindrops, a metallic mesh was inserted one meter above the soil samples. Rainfall kinetic energies and drop sizes were measured using a spectro-pluviometer (Thies Clima, #5.4110).
Based on the experiments performed for these soils by Legout et al. [
24], and in order to focus on the rapid wetting required for slaking, sampling was done for the following rainfall amounts: 0.3; 0.7; 2 and 10 mm for SL and 0.5, 1, 3 and 15 mm for CL, leading to rainfall durations between 7 and 32 min depending on the soil and the rainfall intensity. These different durations account for the contrast in breakdown sensitivity between the silt loam and the clay loam.
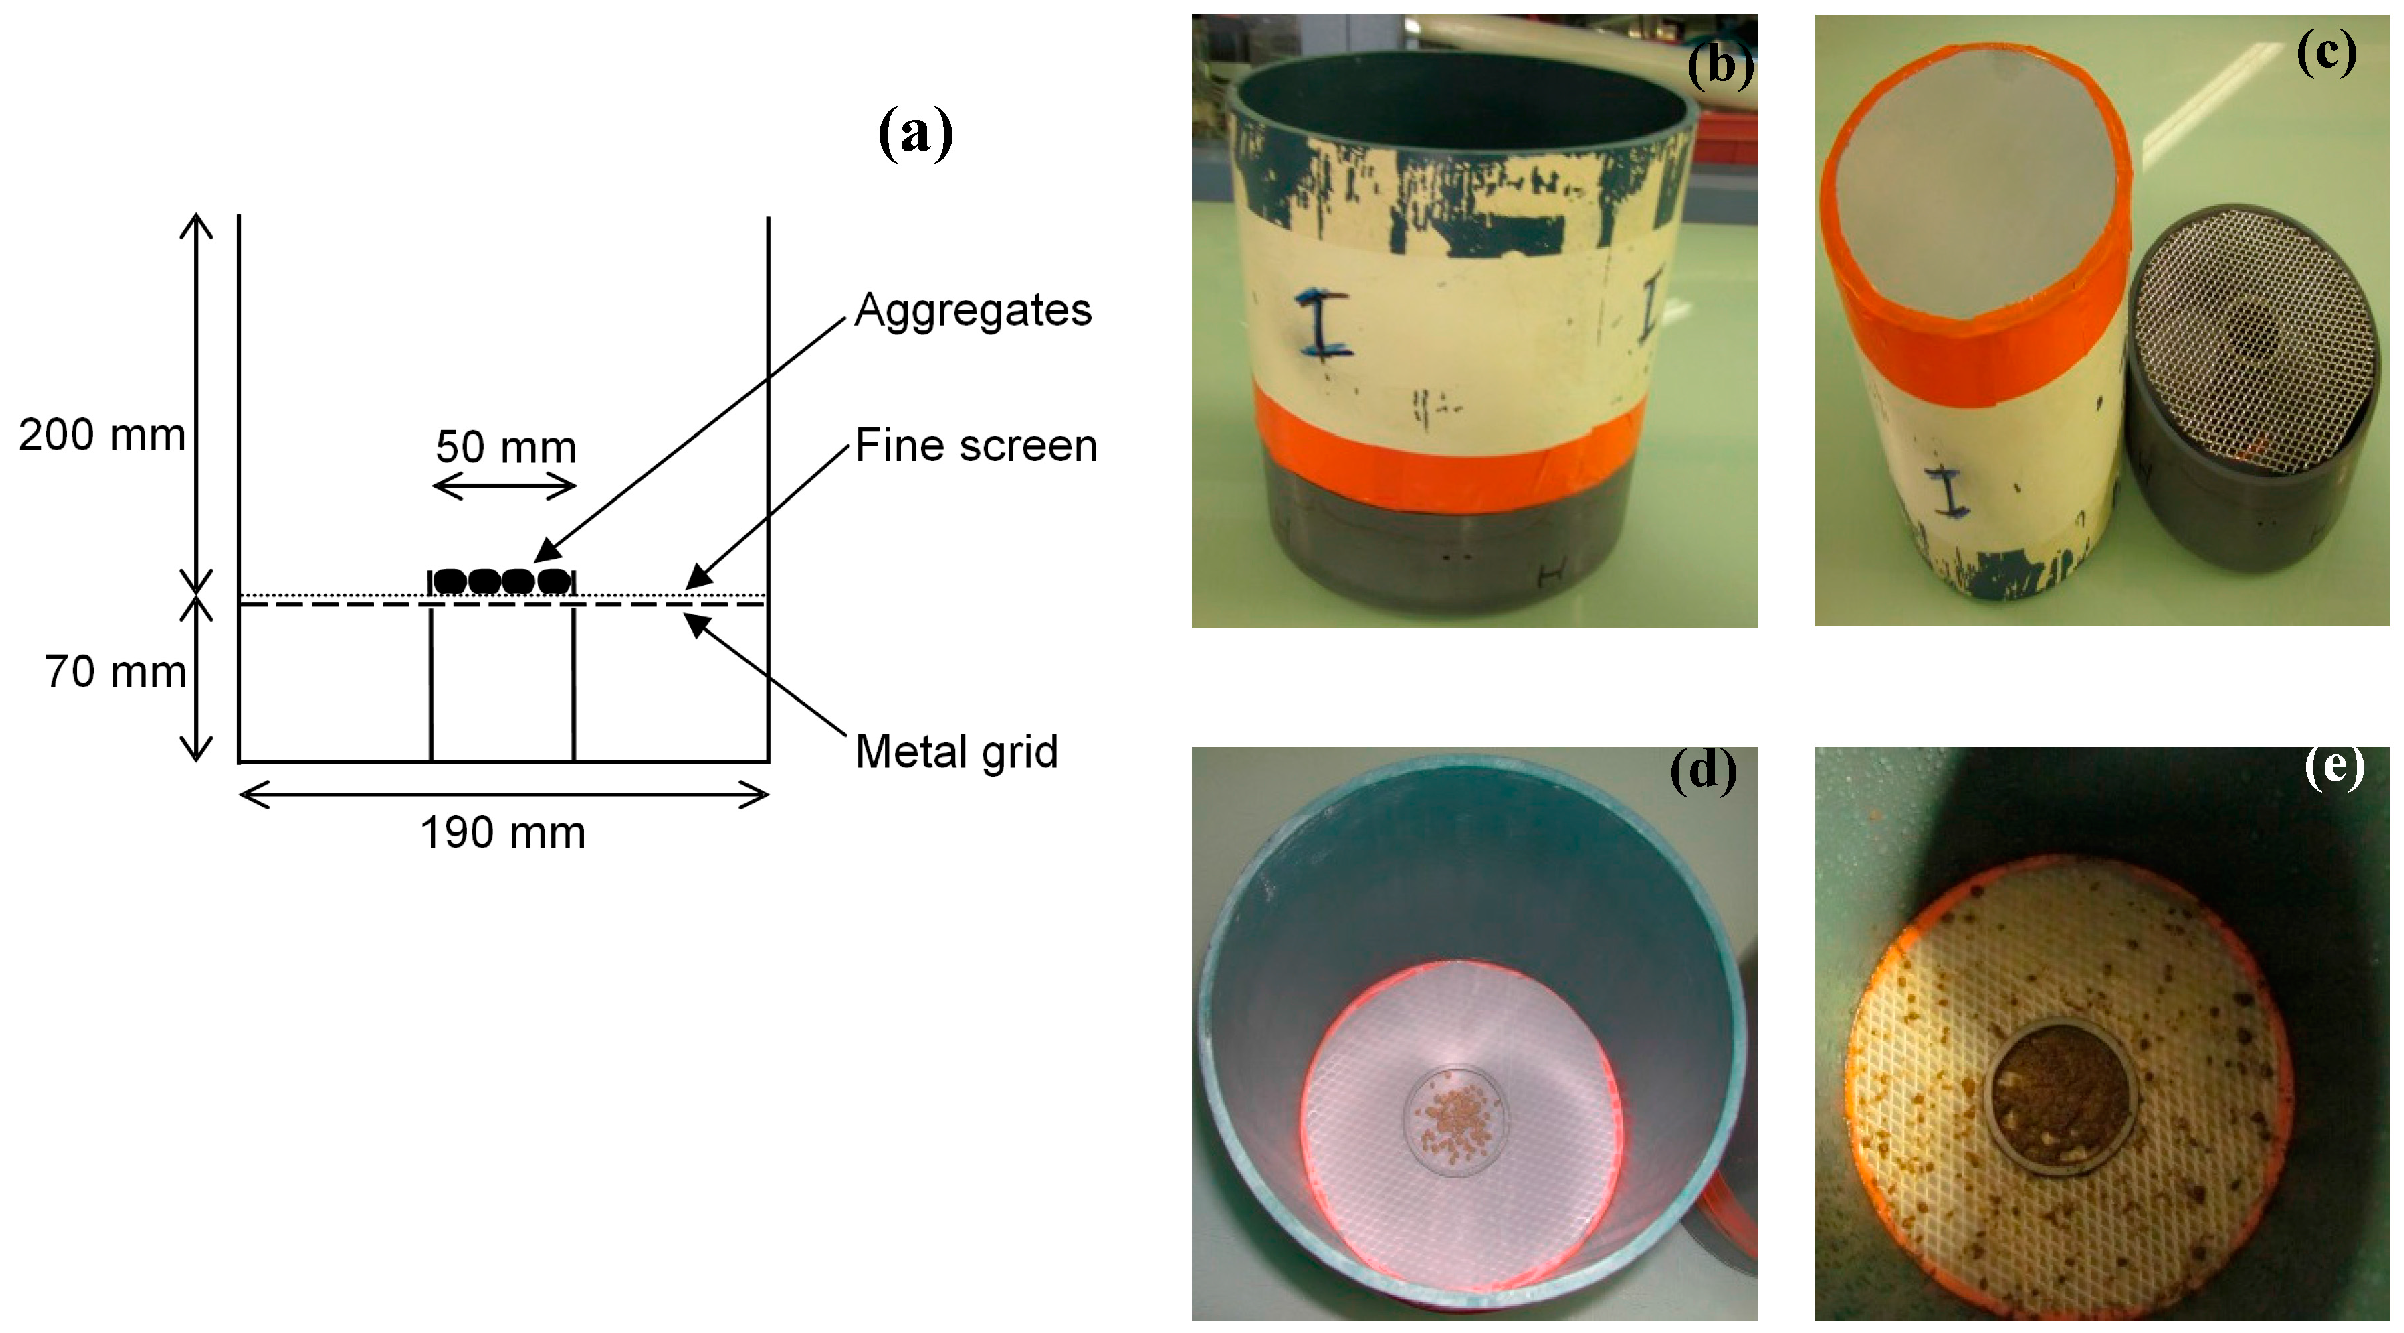
Experimental devices following the methodology described in Legout et al. [
24] were used (
Figure 1). They consisted of three rings:
- -
a small inner plastic ring (50 mm diameter, 5 mm high) to hold a single layer of aggregates.
- -
a large outer plastic ring (190 mm diameter, 200 mm high) to avoid the fragments to be splashed out of the device; a thin screen (11 µm pore size) was taped at the base of this ring to ensure that (1) no ponding occurred even at 90 mm/h rainfall intensity and (2) all soil material was kept in for subsequent analysis.
- -
a large lower plastic ring (190 mm diameter), with a closed bottom, to collect the rain water and to allow for its subsequent weighing, permitting the determination of the precise amount of rainfall added to each sample.
A metal grid (supported by a piece of plastic) was inserted at the top of the lower ring to avoid the collapse of the thin screen. The two large rings were taped together before the rainfall to make them watertight.
2.3. Aggregate Size Measurements
The aggregate size distributions were determined after the stability tests and the rainfall simulations had been performed. The measurements of the aggregate size distributions combined sieving and laser diffraction. They were used to calculate the mean-weighed diameter (MWD) of each sample.
After completion of the stability test or simulated rainfall, each aggregate sample was filtered through a 1 mm sieve, using ethanol to conserve the structure of the aggregates. The aggregates that passed through this sieve were recovered in a beaker and analyzed in a laser particle size analyzer (MasterSizer2000, Malvern Instruments, Malvern, Worcestershire, UK). The aggregates remaining in the 1 mm sieve were dried in an oven (40 °C) and then passed through a set of sieves (3.15, 2, 1.4 and 1 mm), after which, the mass of each fraction was obtained.
Subsequently, the distribution of aggregates obtained by sieving was recombined with the distribution obtained by the laser particle size analyzer to yield a single distribution curve (0.02 to 4075 µm). From these values we calculated the mean-weighted diameter (MWD) of aggregates for each sample. The MWD of the aggregates was calculated using the classical equation: MWD (mm) = Σ ([portion of each class relative to the total] × [average class diameter (mm)]).
In addition to the MWD, two MWD decrease indicators were defined, based on Legout et al. [
24]. To allow for the comparison of samples having undergone different kinetic energies during a rainfall, we used MWD decrease [mm/(J·m
−2)] = ([initial MWD] − [MWD at
X J·m
−2 of cumulative rainfall kinetic energy])/[
X J·m
−2 of cumulative rainfall kinetic energy]). For clarity, the unit is abbreviated to mm·KE
−1. A relative decrease indicator was also defined to allow for the comparison of samples having different initial aggregate sizes: MWD decrease (%) = 100 ([MWD of initial aggregates] − [MWD at stage Y])/[MWD of initial aggregates]. For the aggregate stability measurements, “stage Y” is the MWD after the stability test. For the disaggregation under rainfall, “stage Y” is the MWD at
Y J·m
−2 of cumulative rainfall kinetic energy.
2.4. Statistical Analysis
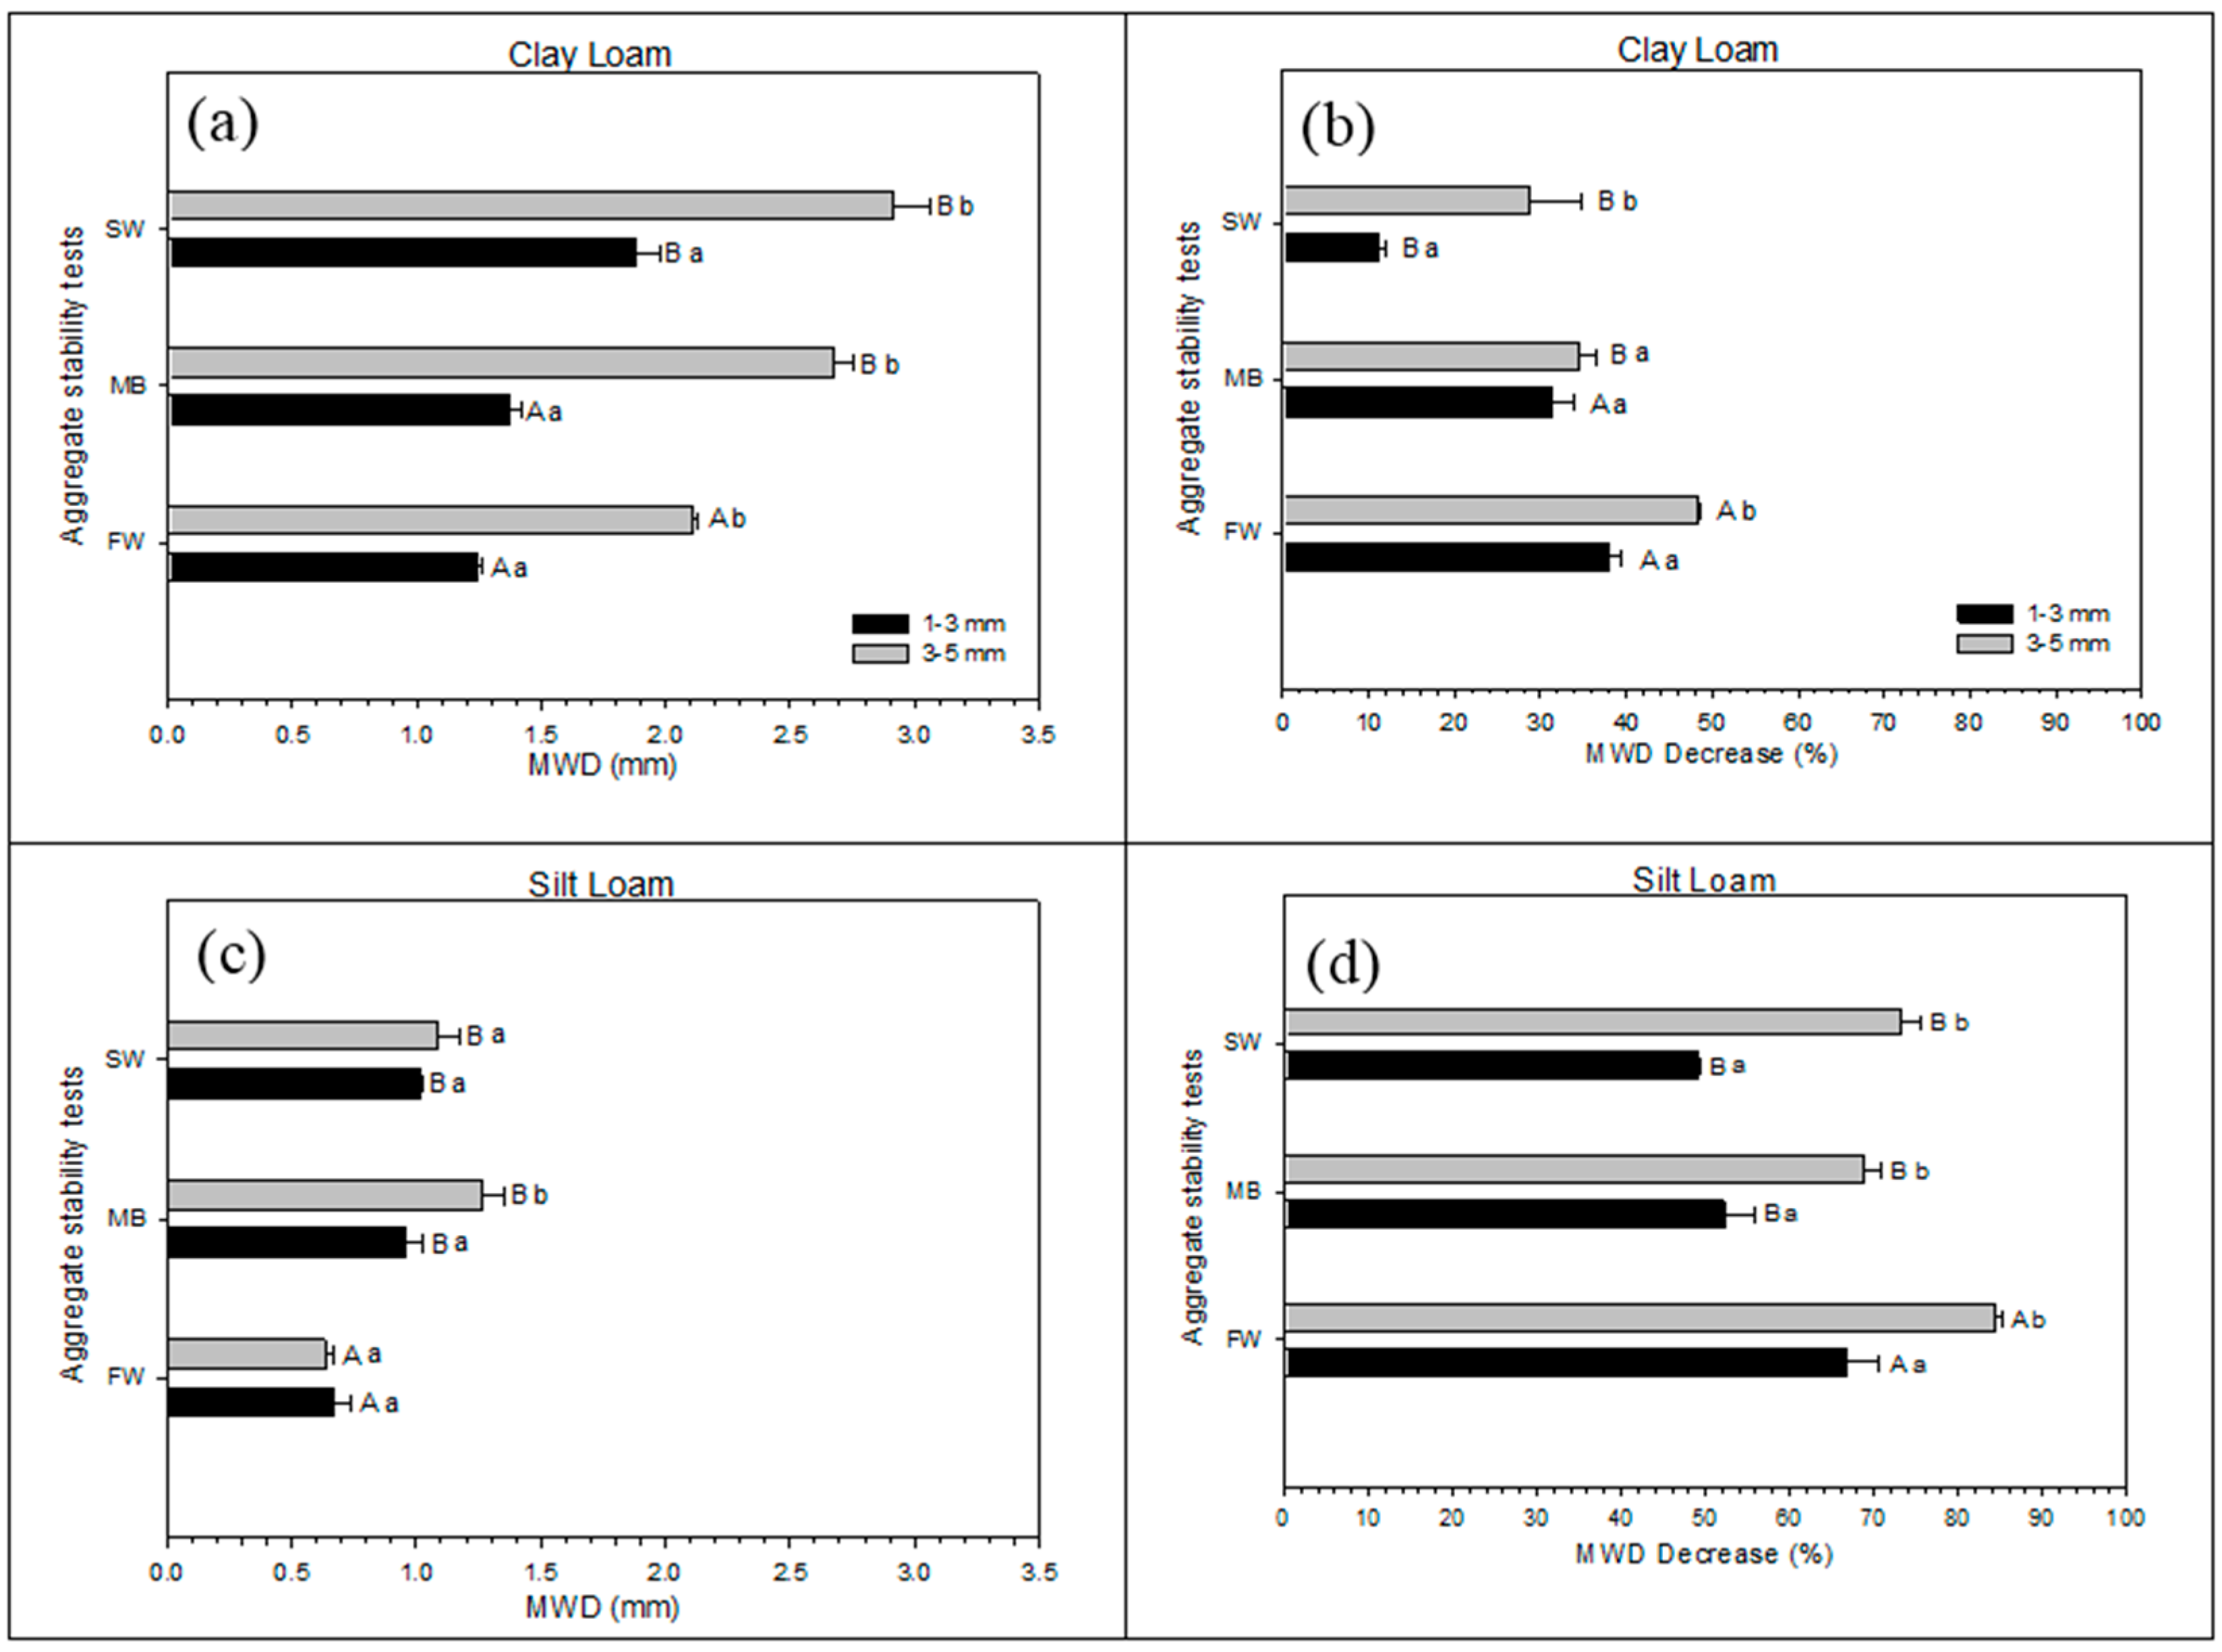
Mean comparisons using the Tukey test (p ≤ 0.05) were done for the MWD results obtained in the stability tests. The standard error of the mean was also calculated.
4. Discussion
4.1. Occurrence of Slaking and Other Breakdown Mechanisms under Simulated Rainfalls
Stability tests showed that both soils were quite sensitive to slaking, confirming the results of Legout et al. [
24]. This means that the slaking process could potentially have caused the disaggregation observed during the rainfalls.
The slaking process occurs only if aggregates are rapidly wetted, so as to allow for the pressure build-up of internally entrapped air [
16,
21,
22]. Hence, slaking is more likely to occur for higher rainfall intensities and smaller aggregate sizes. Moreover, slaking can occur only at the initial stage of a rainfall event because it takes place only for dry aggregates.
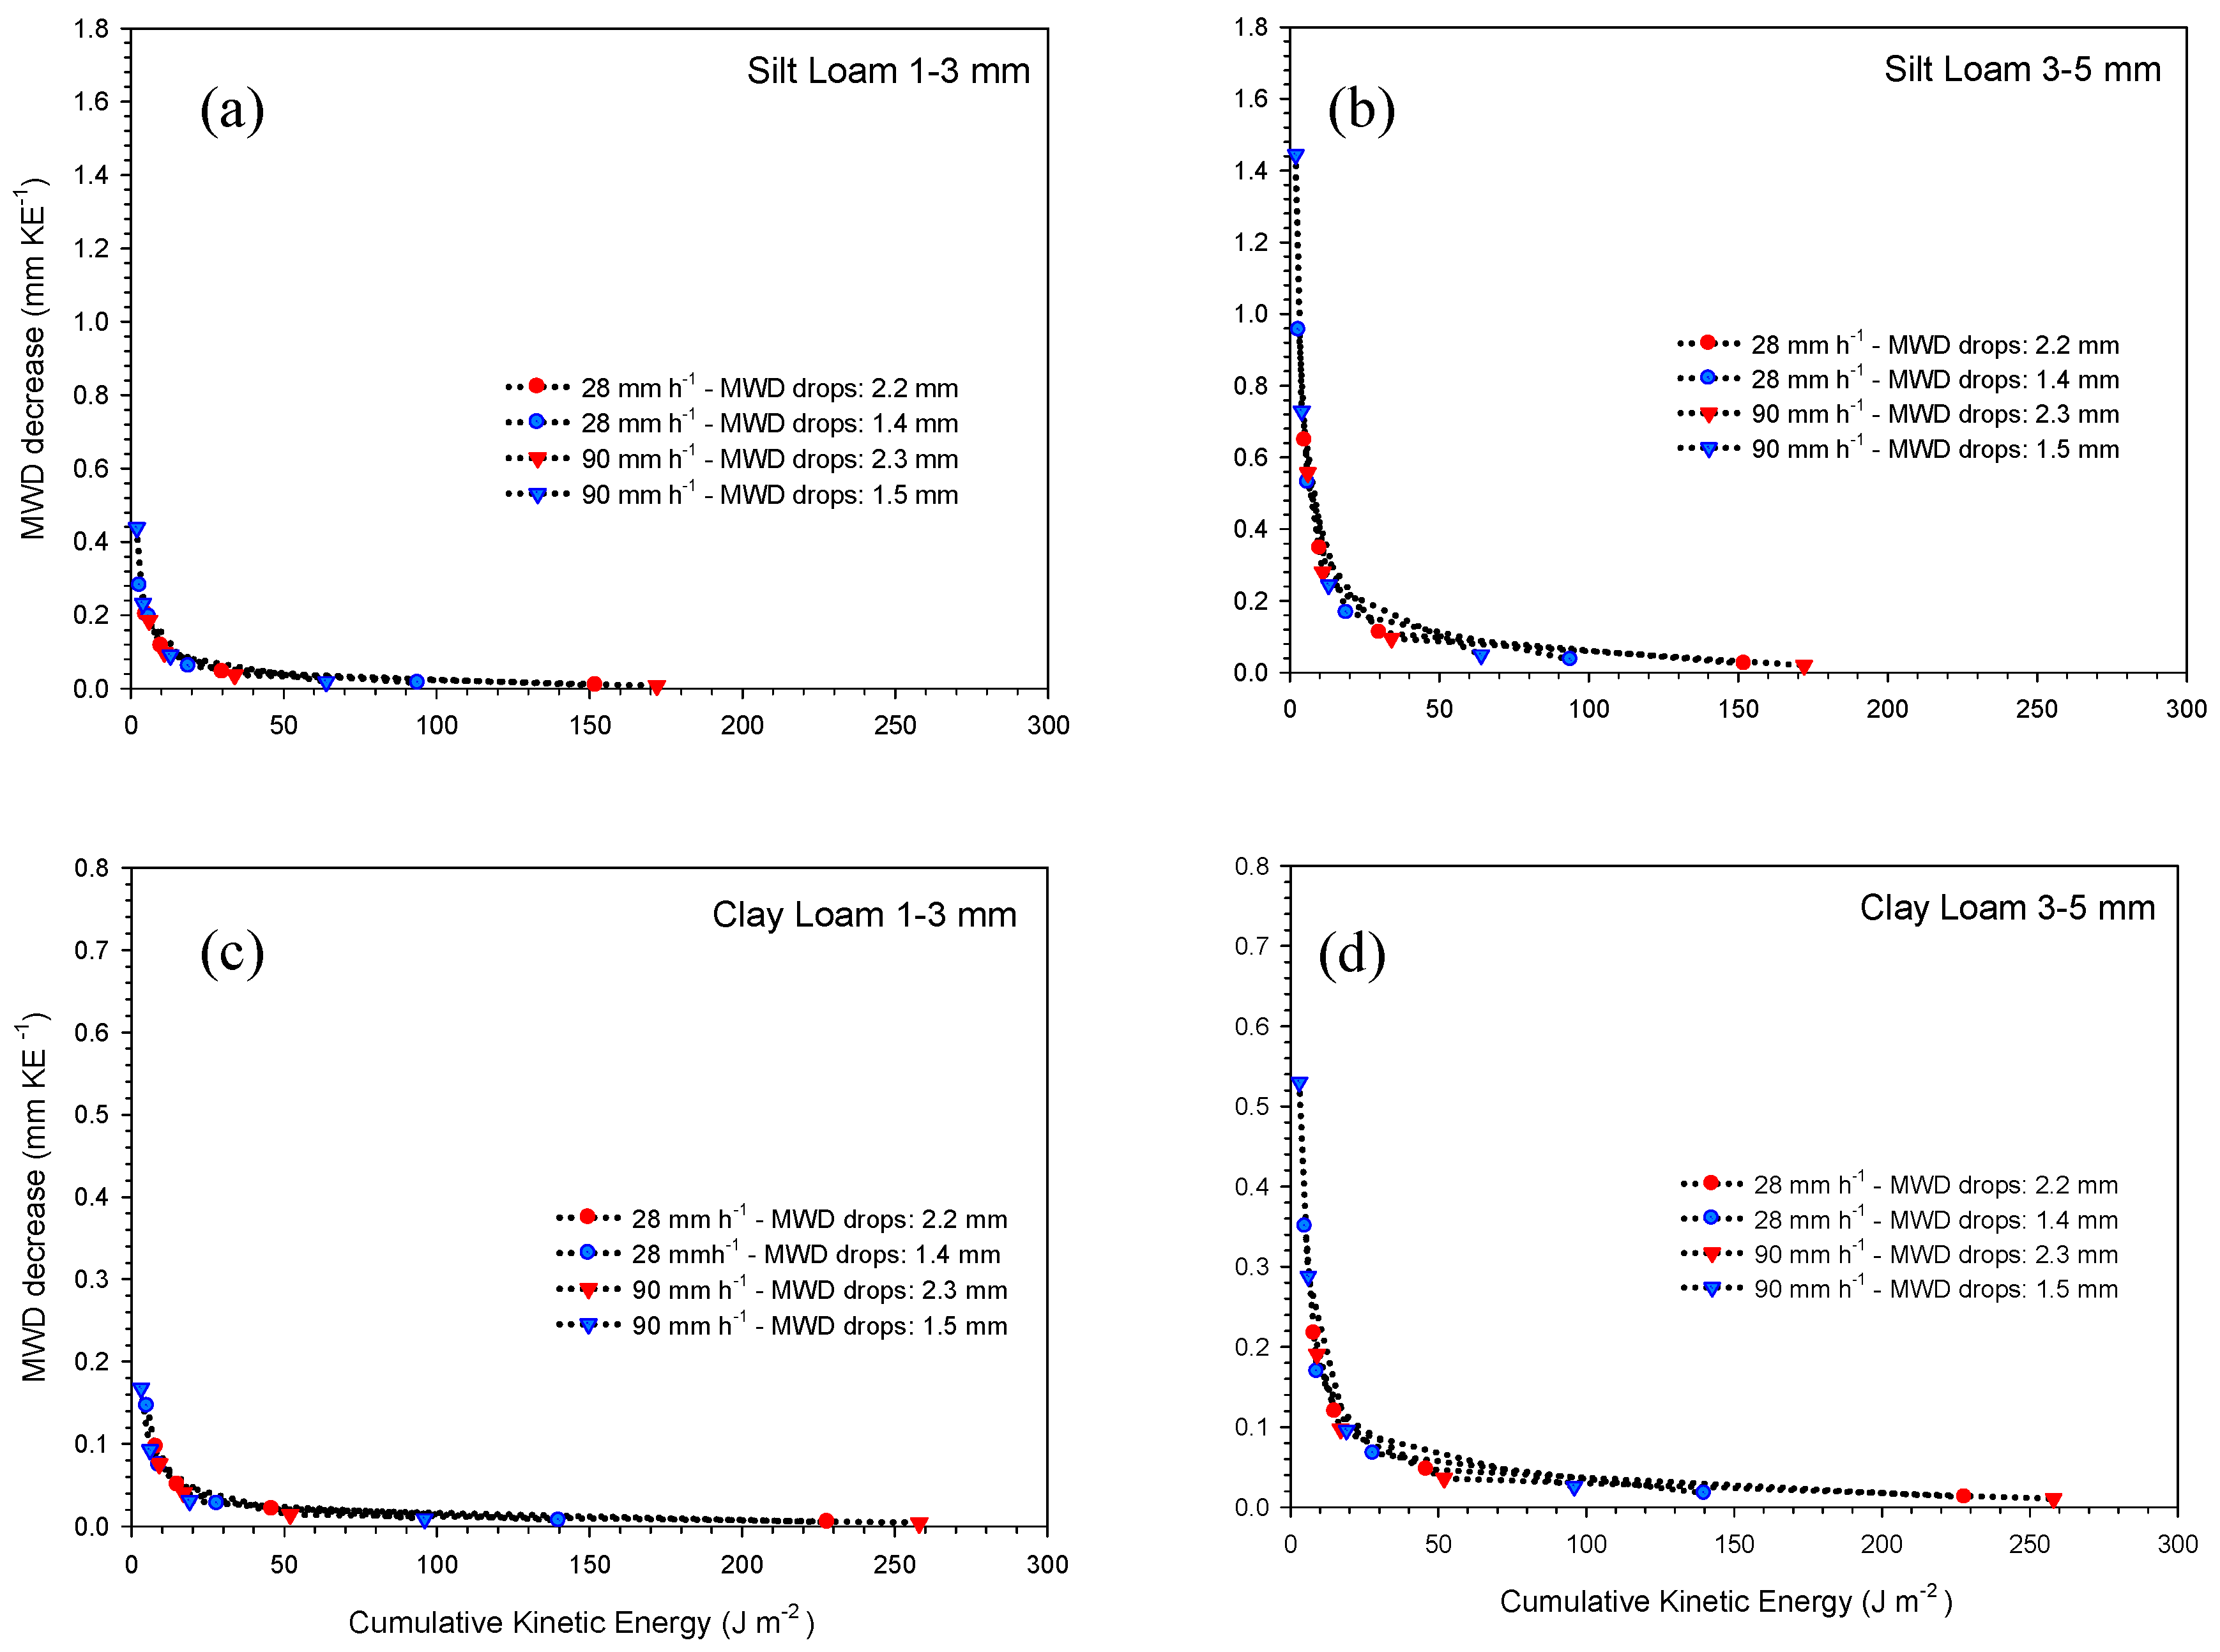
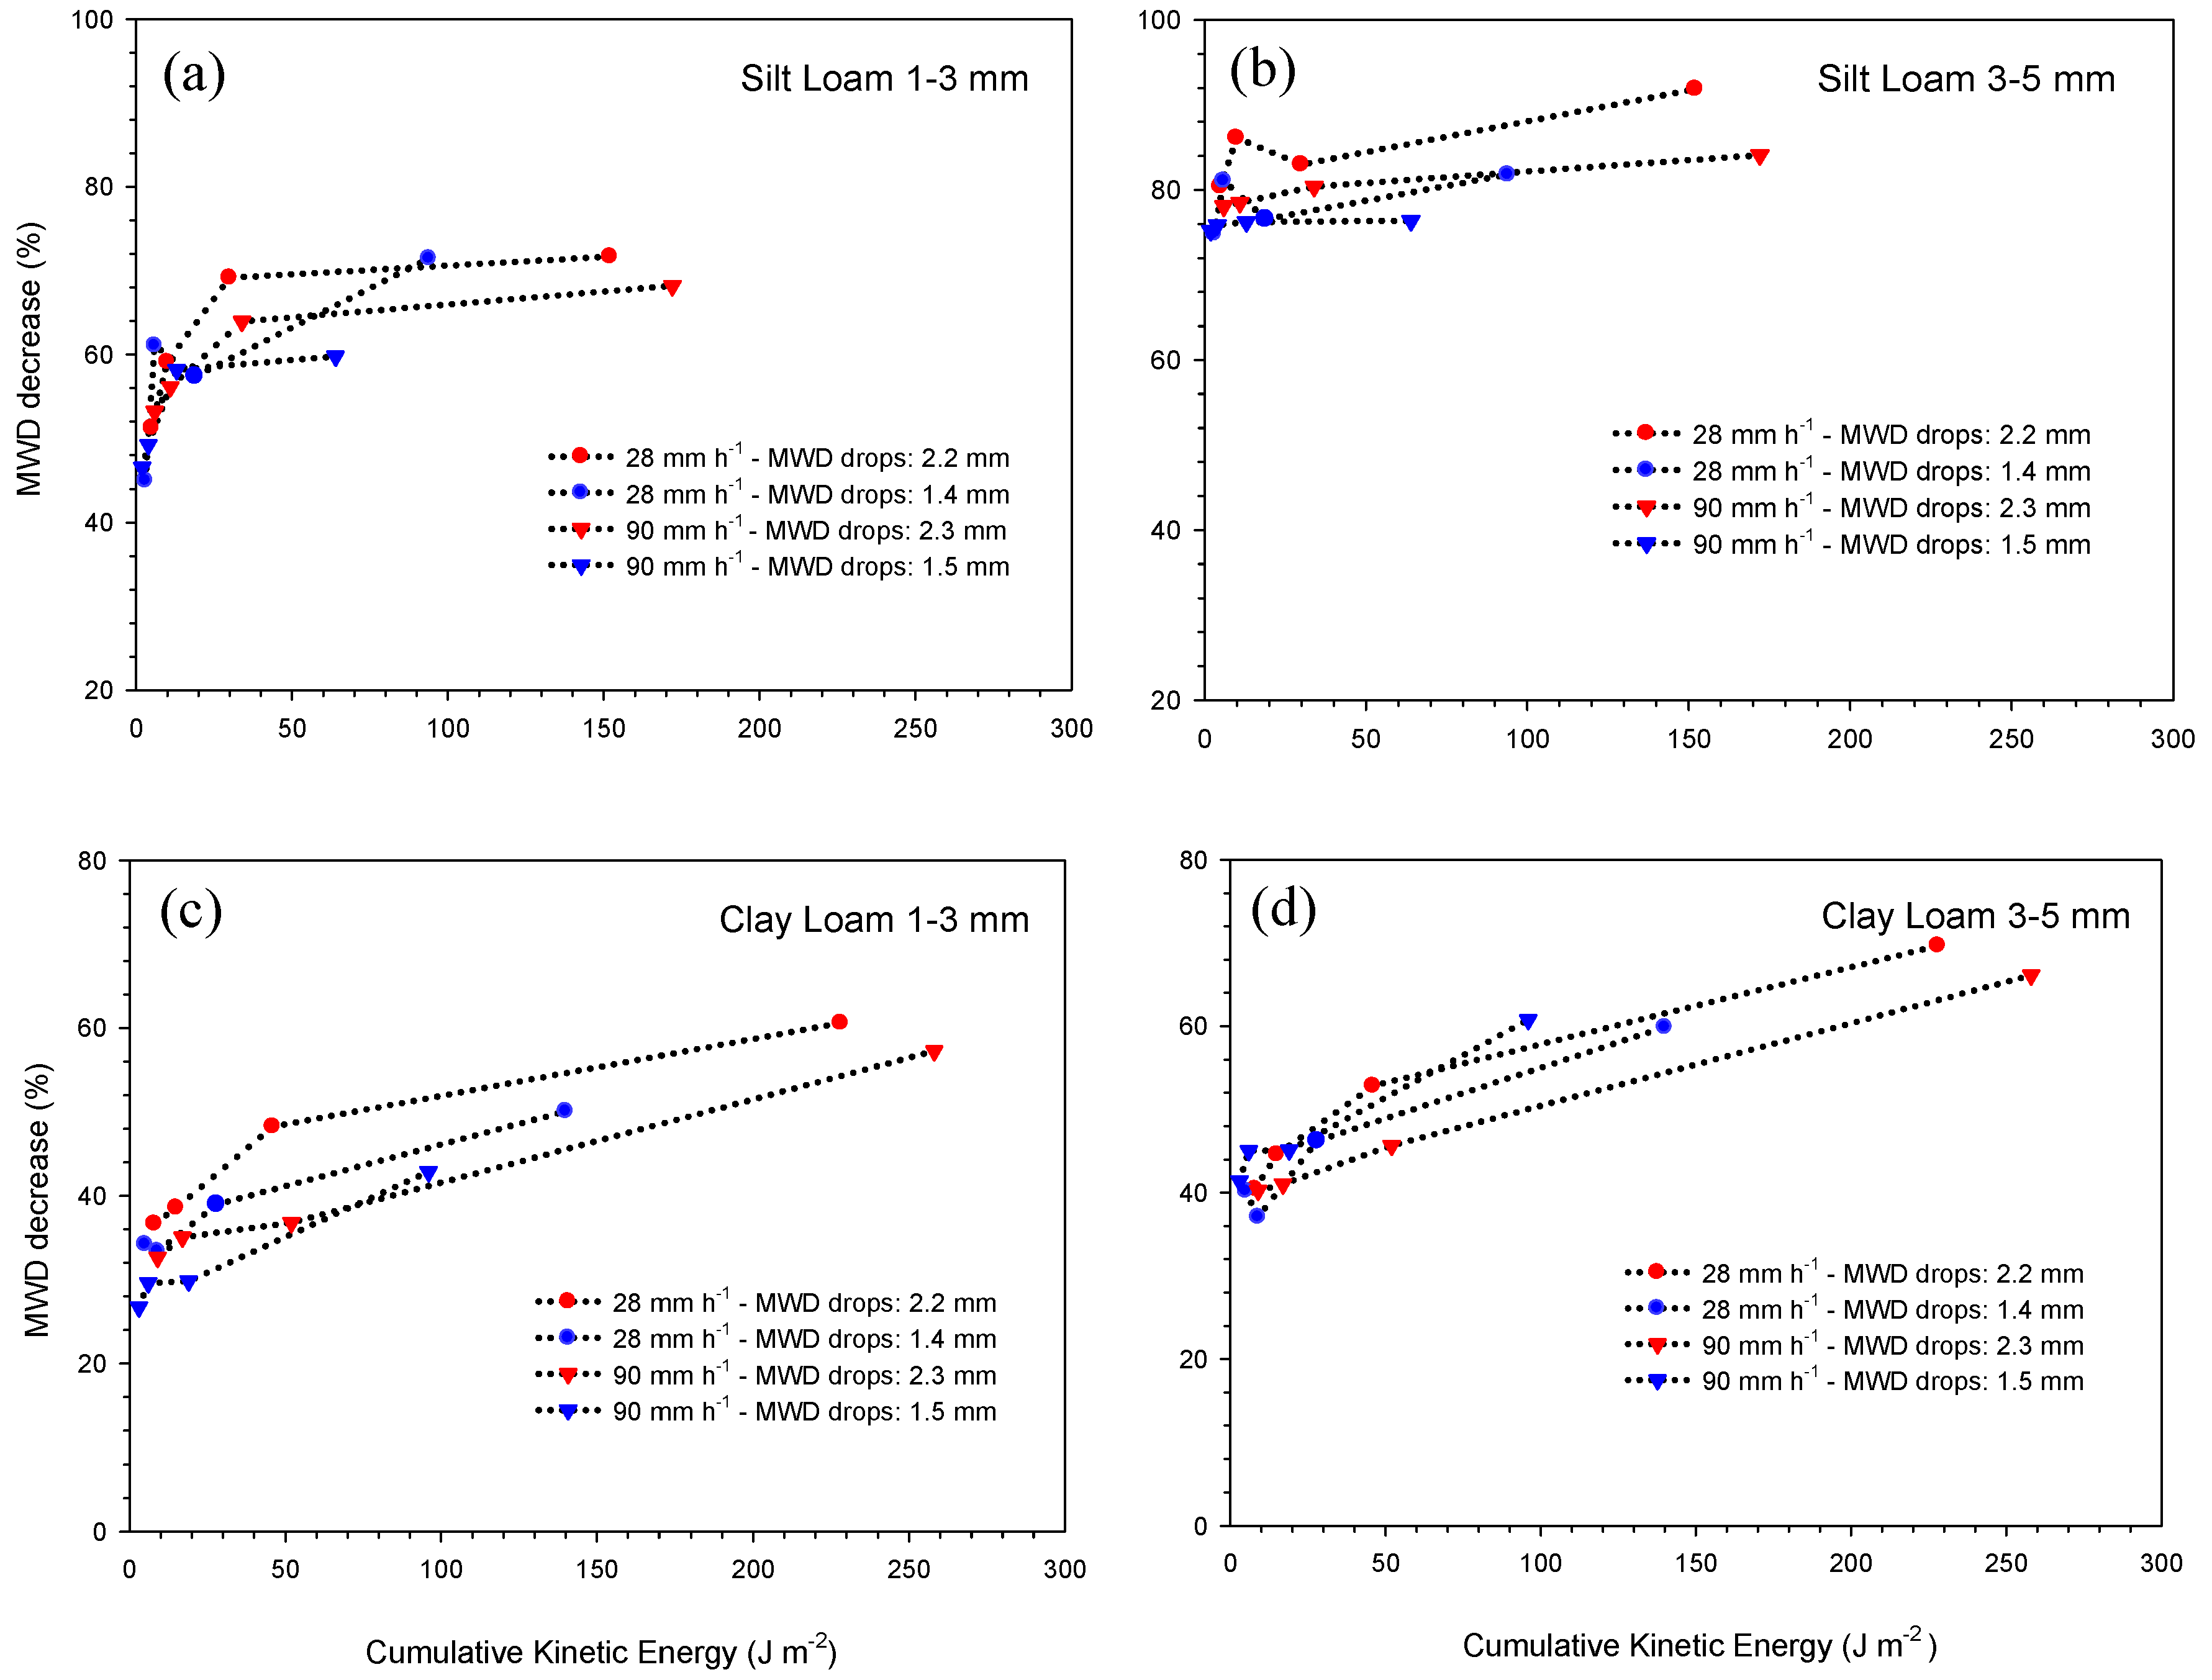
Under rainfall, for a given soil and initial aggregate sizes, the MWD (mm·KE−1) followed the same decrease for all four types of rain. This advocates that the same process was involved in the change in aggregate size regardless of the type of rain. The dynamics of this process were the same in reference to the cumulative kinetic energy undergone by the aggregates. Moreover, this process did not depend directly on the intensity or on the drop size, otherwise discrepancies among the types of rain would have been observed. This leads us to conclude that the process responsible for the disaggregation does not depend on how the soil is wetted (small or big drops; low or high intensity), but on the amount of energy added. Finally, both the MWD decrease in mm·KE−1 and the MWD decrease in percent show a higher initial change for SL 3–5 mm aggregates than for SL 1–3 mm aggregates. This means large aggregates are broken down more intensively than small ones. This is not consistent with the slaking process.
While the disaggregation took place mainly at the very beginning of the rainfalls, a closer examination shows the non-occurrence of slaking. The first disaggregation measurements were carried out for rainfall amounts (0.3 mm for SL and 0.5 mm for CL) much smaller that the aggregate size, regardless of the intensity, the kinetic energy, and initial aggregate sizes used. Hence, the observed disaggregation took place while the amount of added water did not allow for the submergence of the 1–3 (or 3–5) mm aggregates.
These results show that slaking did not take place during these experimental rainfalls. The observed disaggregation could have been caused by micro-cracking and mechanical breakdown. Because the disaggregation is related to the cumulative kinetic energy, mechanical breakdown by the raindrop impacts was likely to occur. The concomitance of micro-cracking cannot be excluded.
4.2. Occurrence of Slaking in the Field
The present work brings insights about the occurrence of slaking and other breakdown mechanisms in the field. A fast immersion of the aggregates in water is required for slaking occurrence, so that air can be entrapped in the aggregates [
21,
22]. As discussed above, a rainfall with intensity as high as 90 mm·h
−1 is not sufficient to trigger slaking. Such rain is already a rare occurrence in nature. Only rainfalls with higher intensities (thus even rarer events) might allow for slaking to occur (although this has not been demonstrated yet). Moreover, a second condition is required for slaking to occur: the soil aggregates should be dry when water is added to them. This means the rainfall should start with a very high intensity from its very beginning. The requirement that these two conditions be fulfilled is likely to limit the occurrence of slaking under field conditions. This shows that slaking is not a common disaggregation mechanism under natural rainfall events. Considering the very specific conditions required by slaking, only a few practices could lead to slaking occurrence in the field, such as furrow irrigation.
In the case of a crusted soil, we believe that our conclusion is also valid. Under rainfall, while the crust is wetted from its upper surface, the air is likely to escape from its lower limit, here again alleviating the occurrence of slaking.
5. Conclusions
Different wetting conditions were used: two intensities (low and high) and two different KE (large and small raindrops). We did not show the occurrence of slaking while, based on aggregate stability tests, it was an efficient breakdown mechanism for both soils. The relationship between MWD decrease and cumulative kinetic energy shows that mechanical breakdown was, in fact, responsible for the strong disaggregation occurring at the beginning of the rainfall. Hence, while slaking was demonstrated by the direct immersion of aggregates, it does not seem to occur under rainfall for intensities as high as 90 mm·h−1.
Because slaking requires a very high wetting rate on initially dry aggregates, it seems unlikely to occur under field conditions, except perhaps for furrow irrigation.


