1. Introduction
Rainfall variability and change affects many aspects of daily life and the economy such as agriculture and water resources [
1,
2]. Thus, understanding the changes in the spatial and temporal rainfall pattern is required for socio-economic management and adaptation strategies defining and planning. Indeed, the lack of water, for example, is caused by unfavorable weather conditions, often linked to prolonged droughts. These droughts due to the exacerbation of climate extremes added to the rapid population growth hamper the satisfaction of the people’s water needs. Therefore, the detection of trends and oscillations in precipitation time series yields important information for the understanding of climate and its various impacts.
Many studies have focused on climate variability and change over the world at the scale of large river basins [
3,
4,
5] such as the Bandama and Comoé in Ivory Coast [
6,
7] as well as at small river watershed scales. Several studies analyzing daily series show a positive trend for some areas in the daily precipitation amount or intensity and a tendency toward higher frequencies of heavy and extreme rainfall in the last few decades. In the United States of America, based on the entropy theory, Djebou [
8] addressed the precipitation variability in time and space in the southwestern regions. He reported that the disorder in precipitation total and the number of events tended to be higher in arid regions. Moreover, the spatial pattern showed that the variability in the precipitation amount and the number of events gradually increased from east to west in the Southwestern United States. In West Africa, the Sahel region is well known to have experienced severe drought from the 1970s to the 1990s [
9,
10,
11]. More recently, Djebou [
12] analyzed the monthly rain of the Niger river basin over the period 1961–2012. Analyzing change point, he reported two sub-periods, mainly 1961–1982 and 1983–2012. His analysis also shows critical alterations of precipitation trend in time and space over the basin.
Concerning the coastal region of West Africa, several analyses show different patterns of precipitation variability [
2,
7,
13,
14]. Paturel [
15] showed that the drought affecting the Sahel regions of West Africa over the 1970s and through to the 1990s seems to have hit countries around the Gulf of Guinea. The debate on the drought’s end is still ongoing through many papers. In this context, it seems important to continue analyzing trends and changes in rainfall series even at both the small river basin scale and the regional scale.
Most of the previous works in the Agneby basin focus on land use, and few have concentrated on climate variability [
16,
17]. However, rainfall seasonal cycle analysis has not yet been addressed in this basin.
This study therefore aims to fill this gap through an analysis of rainfall variability in the Agneby watershed at the Agboville outlet, both at the basin scale and the local (punctual) scale.
2. Data and Method
2.1. Study Area and Data
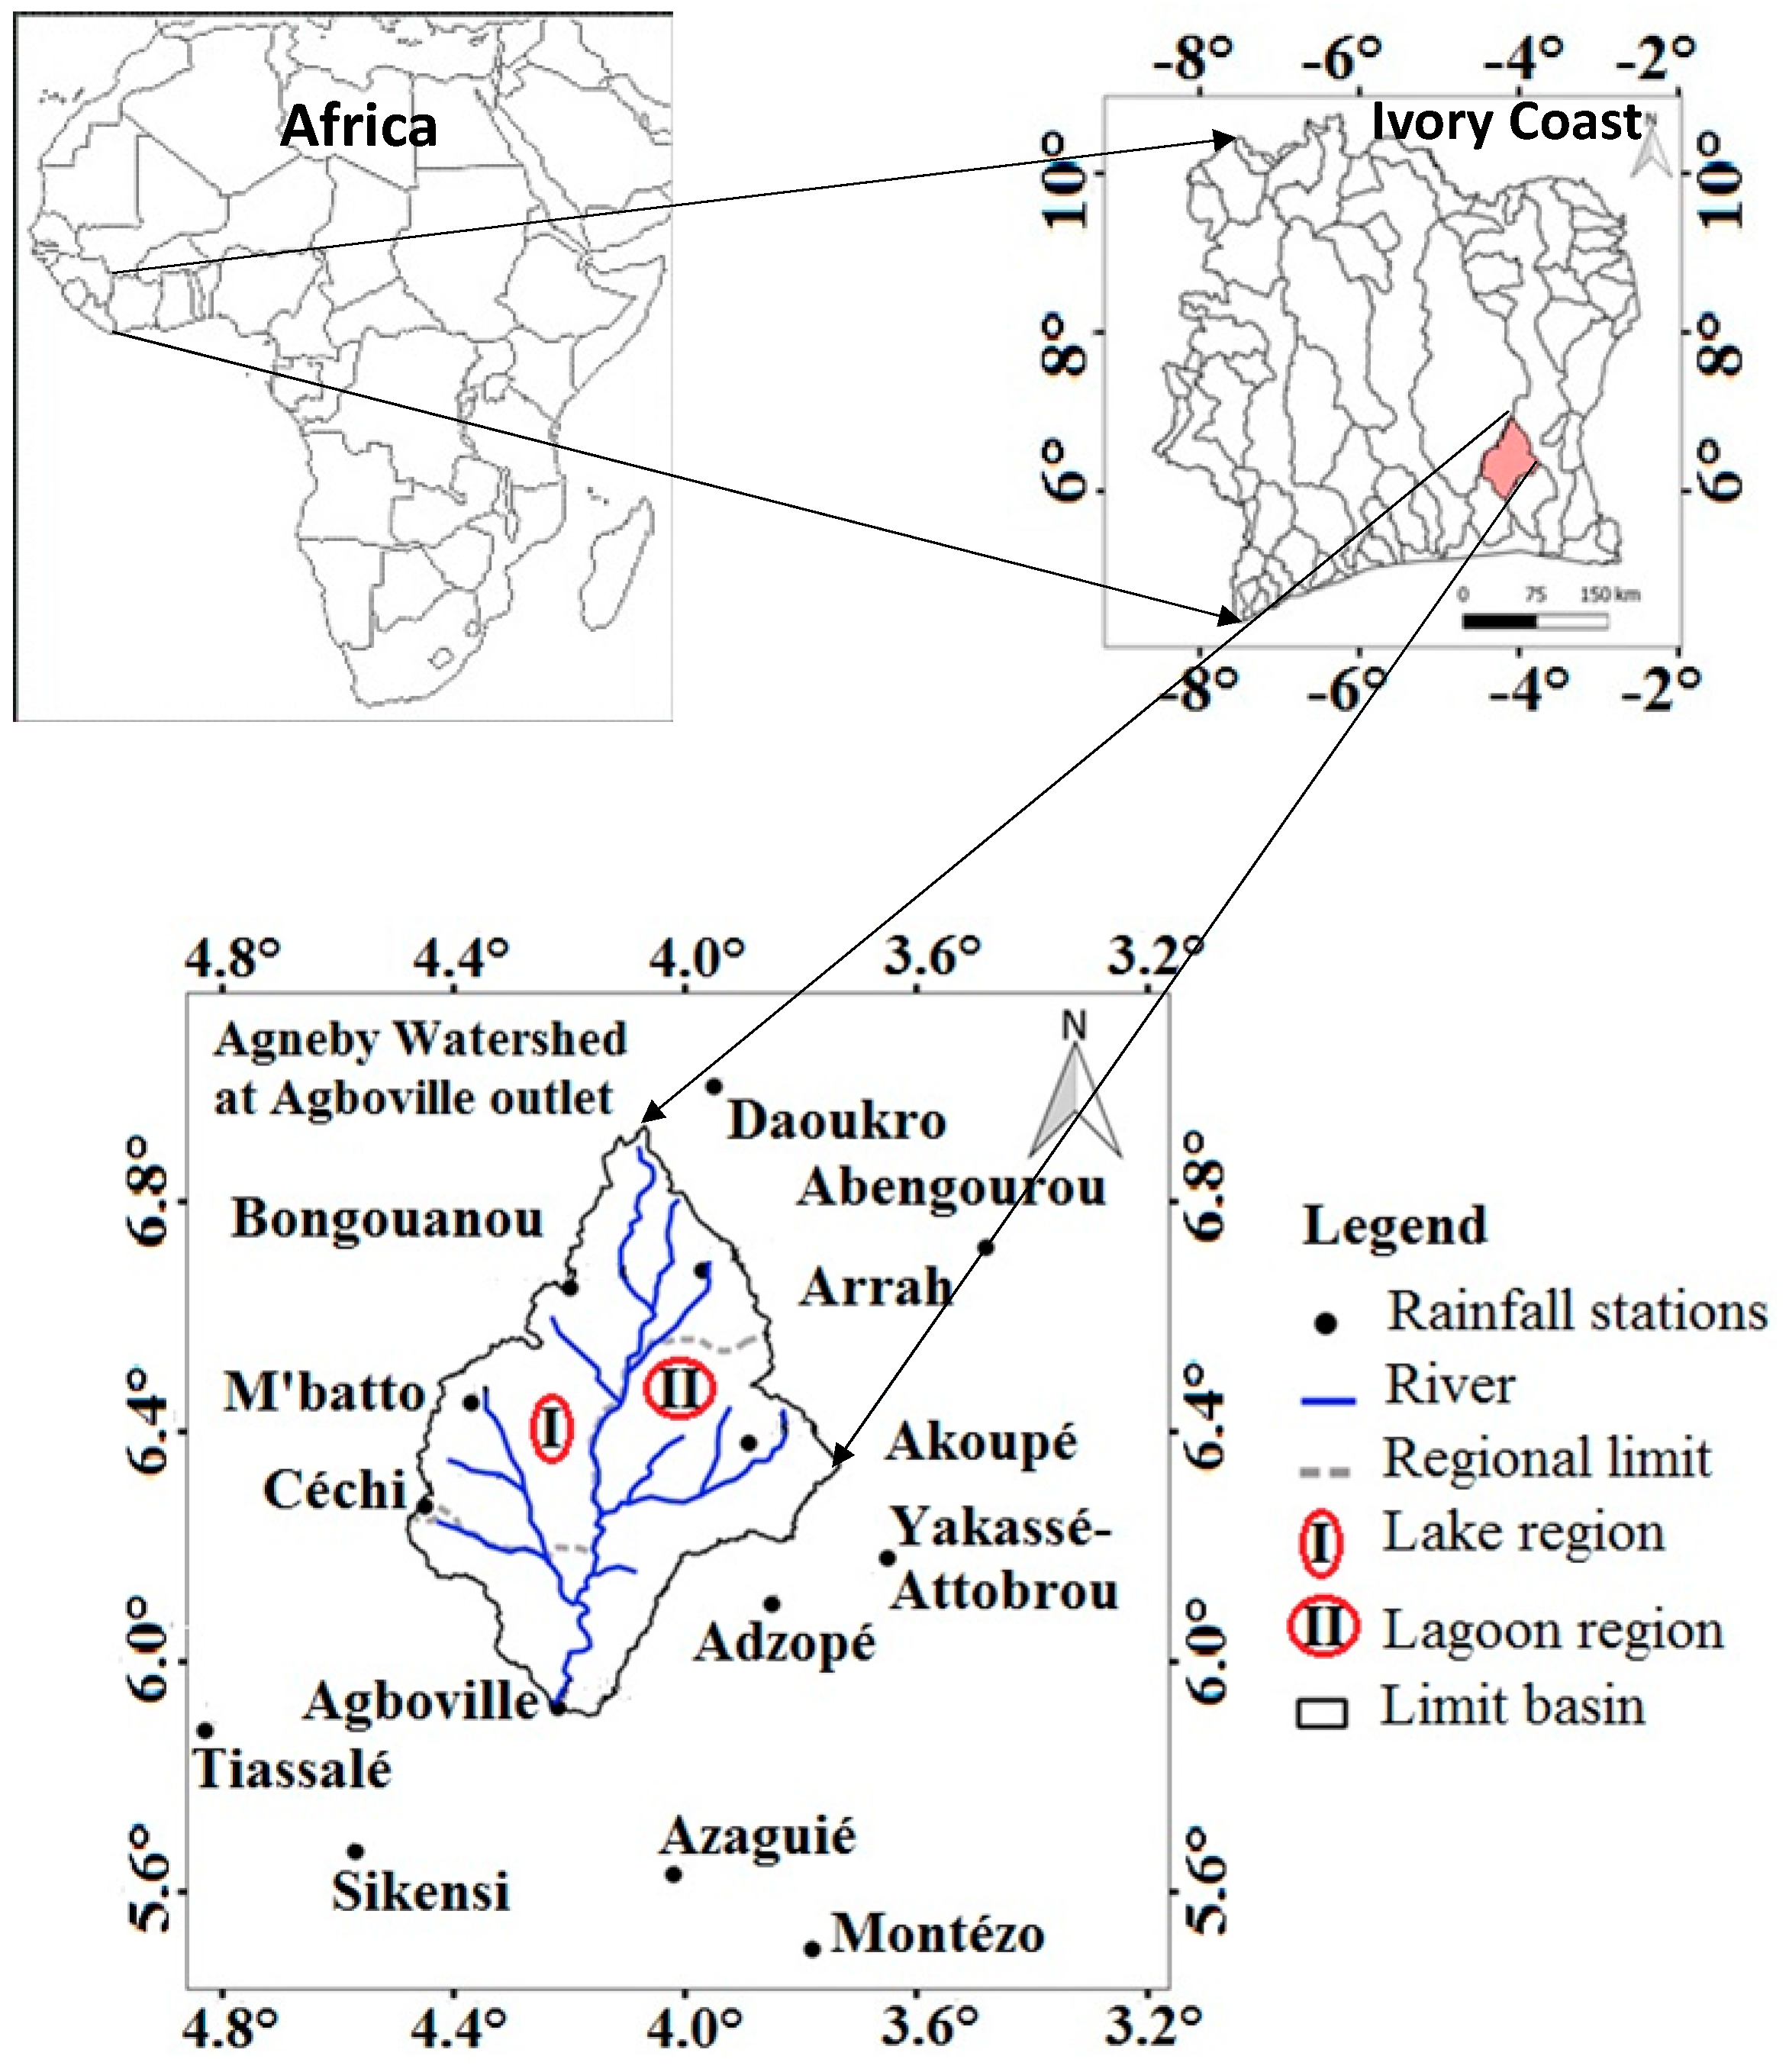
Agneby also named Agbo is a coastal river that springs from Agoua in the region of Bongouanou at the altitude about 250 m. The Agneby watershed at the Agboville outlet is located in the southeast forest region of Côte d’Ivoire (
Figure 1). The regional climate is driven by the well known West African monsoon (WAM) [
18,
19]. It is modulated by the seasonal south–north oscillation of two air masses: the wet oceanic air mass called monsoon and the dry continental air mass commonly called harmattan. The dynamics of the onset and demise of the WAM has been detailed by Sultan [
20]. The Agneby watershed climate is influenced by an equatorial climate transition with an average inter-annual rainfall of 1227 mm between 1950 and 2013. This climate is characterized by four seasons: a long dry season from December to March, a long wet season from April to July, a short dry season from August to September, and a short wet season from October to November [
16,
17]. The dense forest is composed of two entities: humid dense evergreen forest and semi-deciduous rainforest. Semi-deciduous rainforest consists of the same strata as those in moist evergreen forest. Degraded forests are made up of dense forests, degraded riparian forests, and perennial crops.
For the regional scale analysis, data considered in this study are daily rainfall of 14 rainfall stations spatially distributed as shown in
Figure 1. These data were provided by the Meteorology section of the Company named “Development and Exploitation Airports, Aviation and Meteorology (SODEXAM)” of Ivory Coast. Rain gauge characteristics represented in
Figure 1 are given in
Table 1.
For the local scale analysis, only data from the Agboville and Bongouanou rain gauges were used due to the series length (1950–2013).
2.2. Rainfall Inter-Annual Variability Assessment
To analyze the inter-annual and decadal variability of precipitation, we used the Lamb Index, which determines the nature excess, normal or deficit of a given year according to the study period. This index
Ip is defined as follows by Equation (1):
where
stands for the value of the annual rainfall of the year
i;
, the average over the study period, and σ, the standard deviation of the data.
Table 2 shows the rainfall patterns from the rainfall indices.
2.3. Computing Rainfall Spatial Mean
From punctual daily rainfall series, spatial average daily rainfall was calculated using the Kriging method [
21,
22,
23]. The first step in the spatial average computing is to build the spatial structure of precipitation by the semivariogram, simply called variogram. At the daily scale, the exponential model
shown by Equation (2), where
is the distance between two rain gauges, was adopted to adjust the sample semivariogram. Model parameters are the nugget effect
, the sill
, and the range
.
The interpolation was done by using the modeled semivariogram. A regular grid point was adopted, and an ordinary Kriging which assumes unknown mean as well as second-order stationary process, was implemented. At the end, the spatial rainfall mean for the study region was calculated as the statistical mean of the grid point values estimated by the ordinary Kriging for each day.
2.4. Break Point Detection in the Series
The evaluation of break points in the rainfall data series has been performed using two statistical tests. The first one is the Pettitt non-parametric test [
24] widely used to detect a single change-point (or break point) in hydrological series or climate series. It tests the null hypothesis
that there is no changing point in the time series against the alternative: a break point exists. The test statistic is defined as
where
In Equation (4), sgn(X) is the sign function, with values equal to −1, 0, or 1 depending on whether the argument is negative, null, or positive, respectively. The break point is detected at
provided that the statistic is significant. The significance probability of the statistic
is calculated as
For a given first species risk
the hypothesis
is rejected if this probability is less than
. In this study, we used
. If a break point is detected, then we have confirmed that this break point is unique with the Hubert segmentation test [
25,
26], which is commonly used to detect many change-points in hydrometeorological series.
2.5. Rainfall Seasonal Cycle Variability Analysis
The moving average method has been used for rainfall seasonal cycle analysis both at the watershed scale and at the local scale. The sliding averages were determined by considering a window of 11 days. Thus, as proposed by Balme [
27] and applied by Lawin [
2], the value assigned to a given day D is the average of the daily values from D − 5 to D + 5. The window length of 11 days is adapted for the seasonal cycle of rainfall analysis since it eliminates the small internal fluctuation but conserves the signal dynamic.
For more detailed analysis of changes in the seasonality of precipitation over the period 1950–2013 at various scales (punctual and regional), we have implemented the detailed methodology used by Lawin [
2] by re-sampling our series into two composites: excess or wet composite (PE) consists of excess years, and deficit or dry composite (PD) consists of deficit years. Similarly, each composite is divided into two components as follows: P1E is the composite that consists of wet years before stationary break, and P2E is the composite that consists of wet years after a stationary break. Similarly, the P1D is the composite that consists of deficit years before break, and P2D is the wet composite after the stationary break. A comparative approach allows us to appreciate the significant differences between the different composites.
3. Results
3.1. Rainfall Inter-Annual Variability
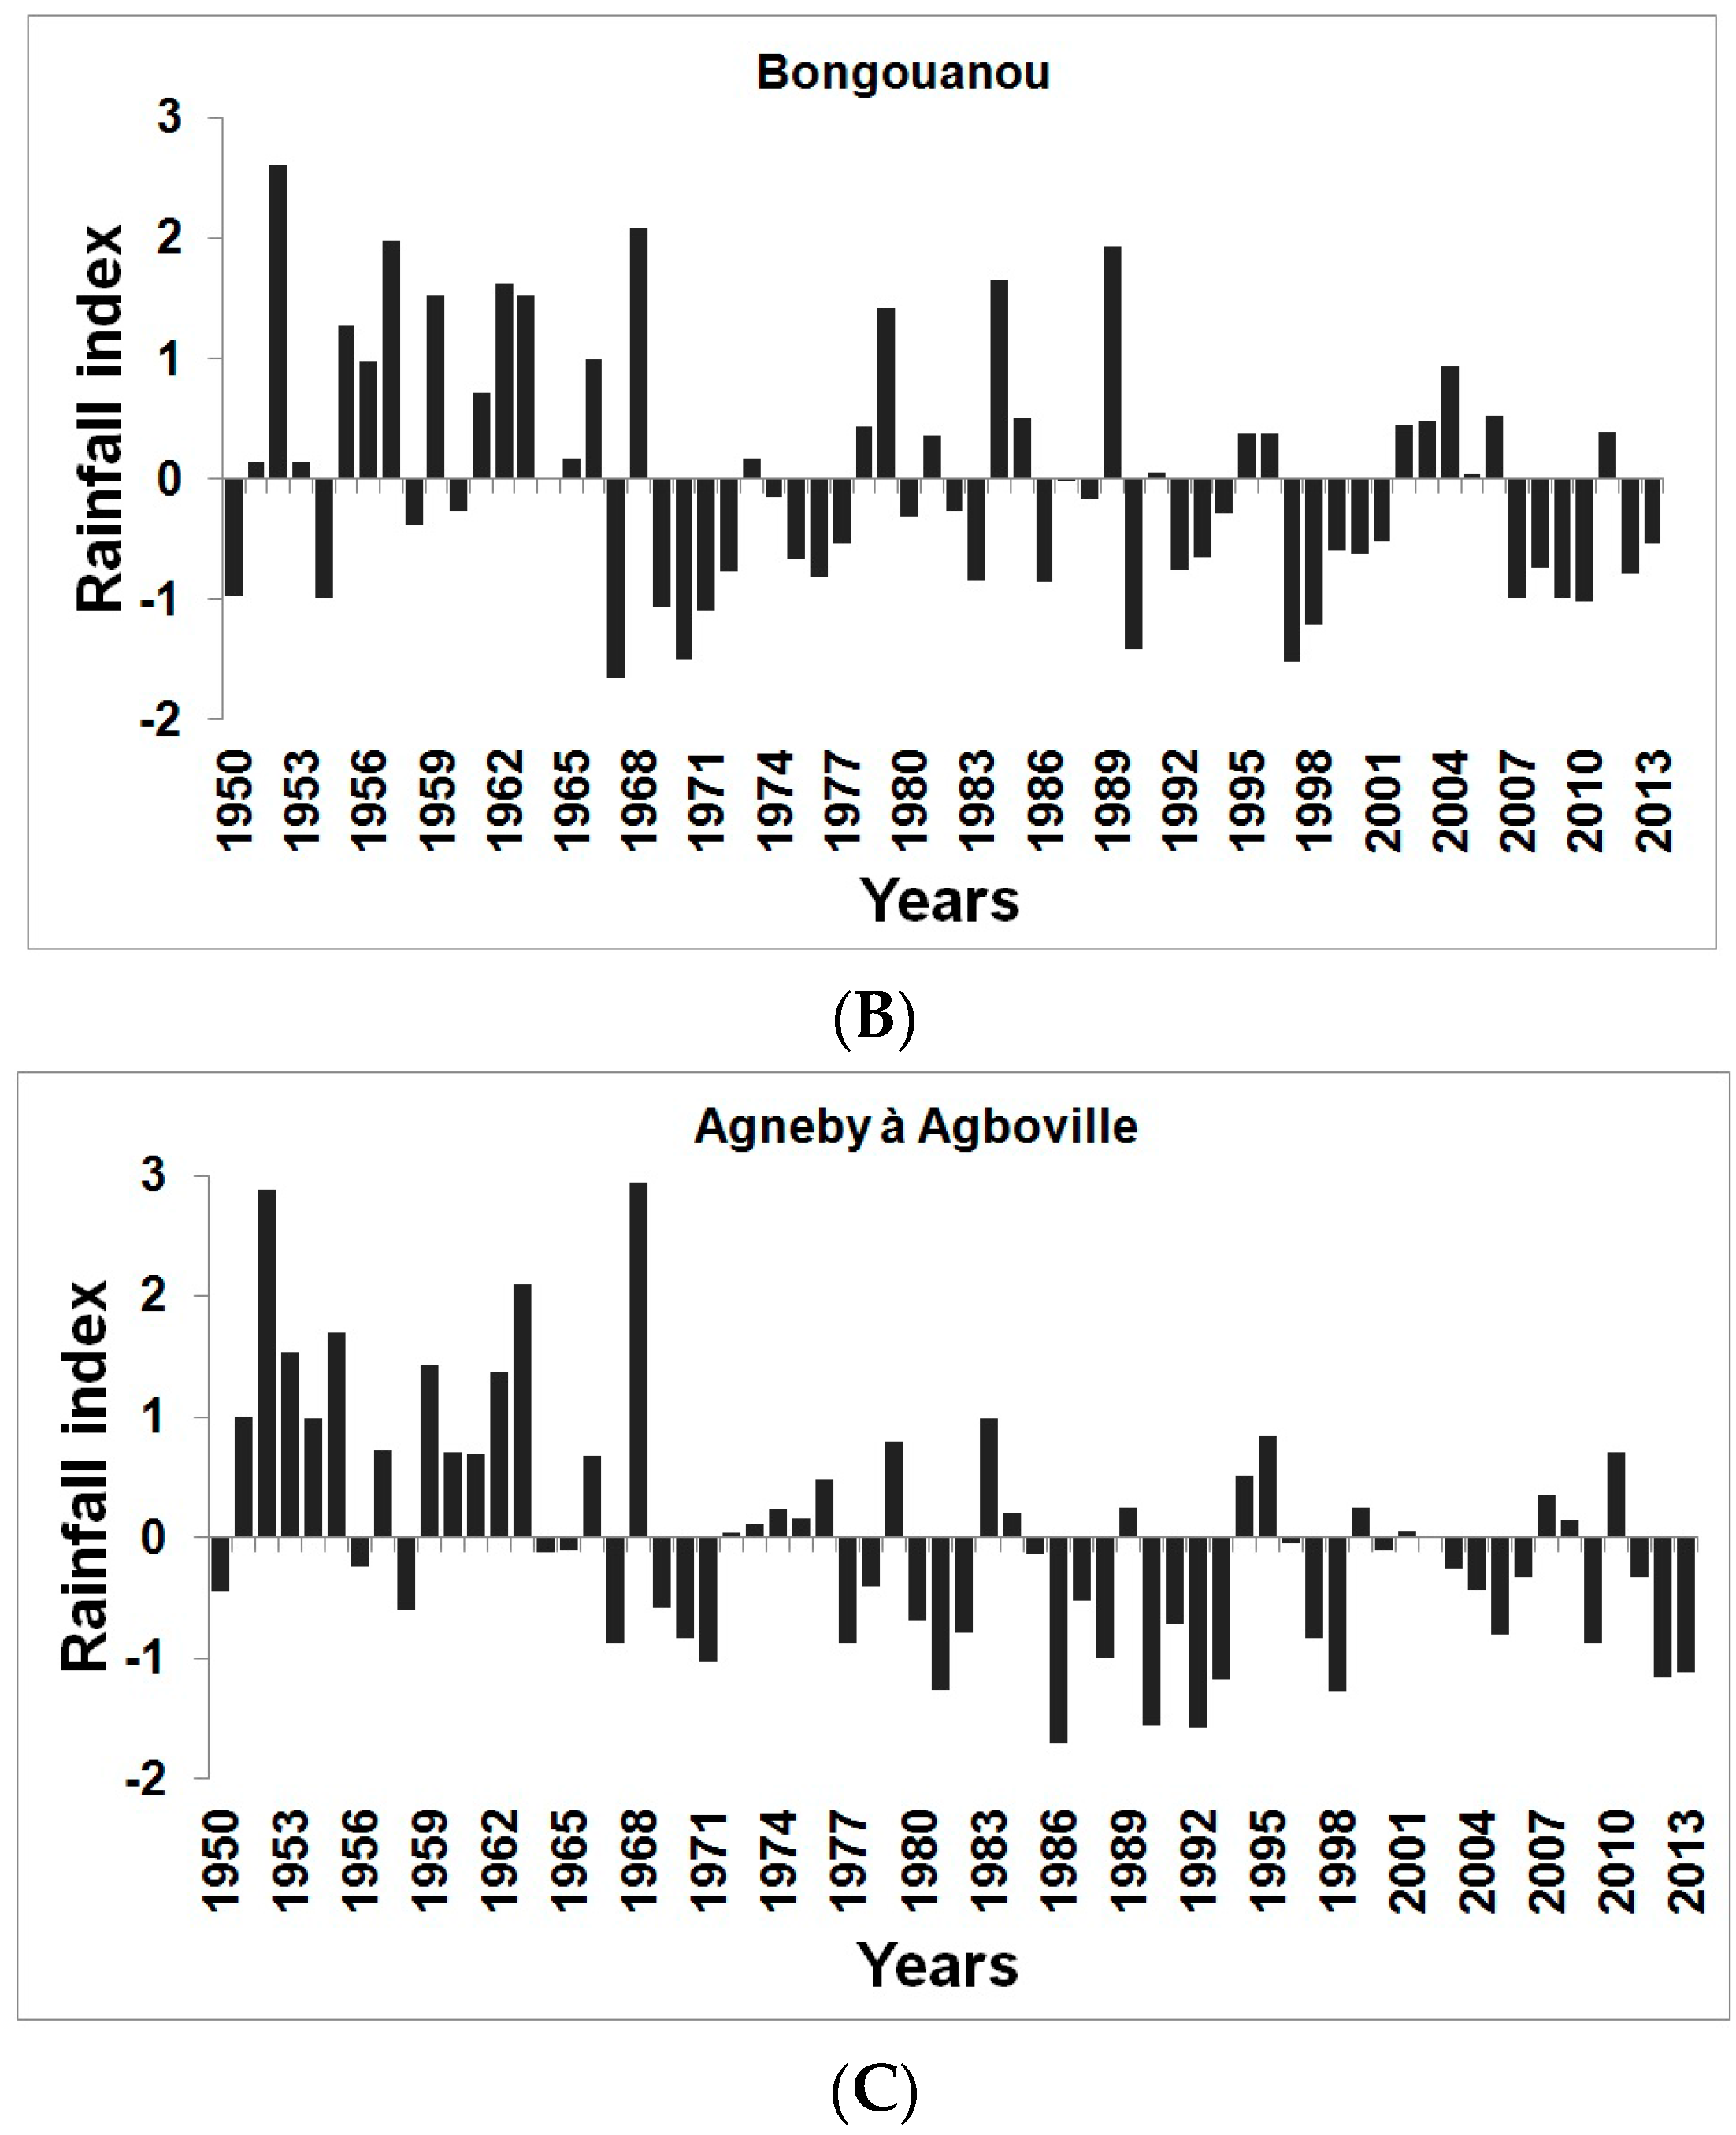
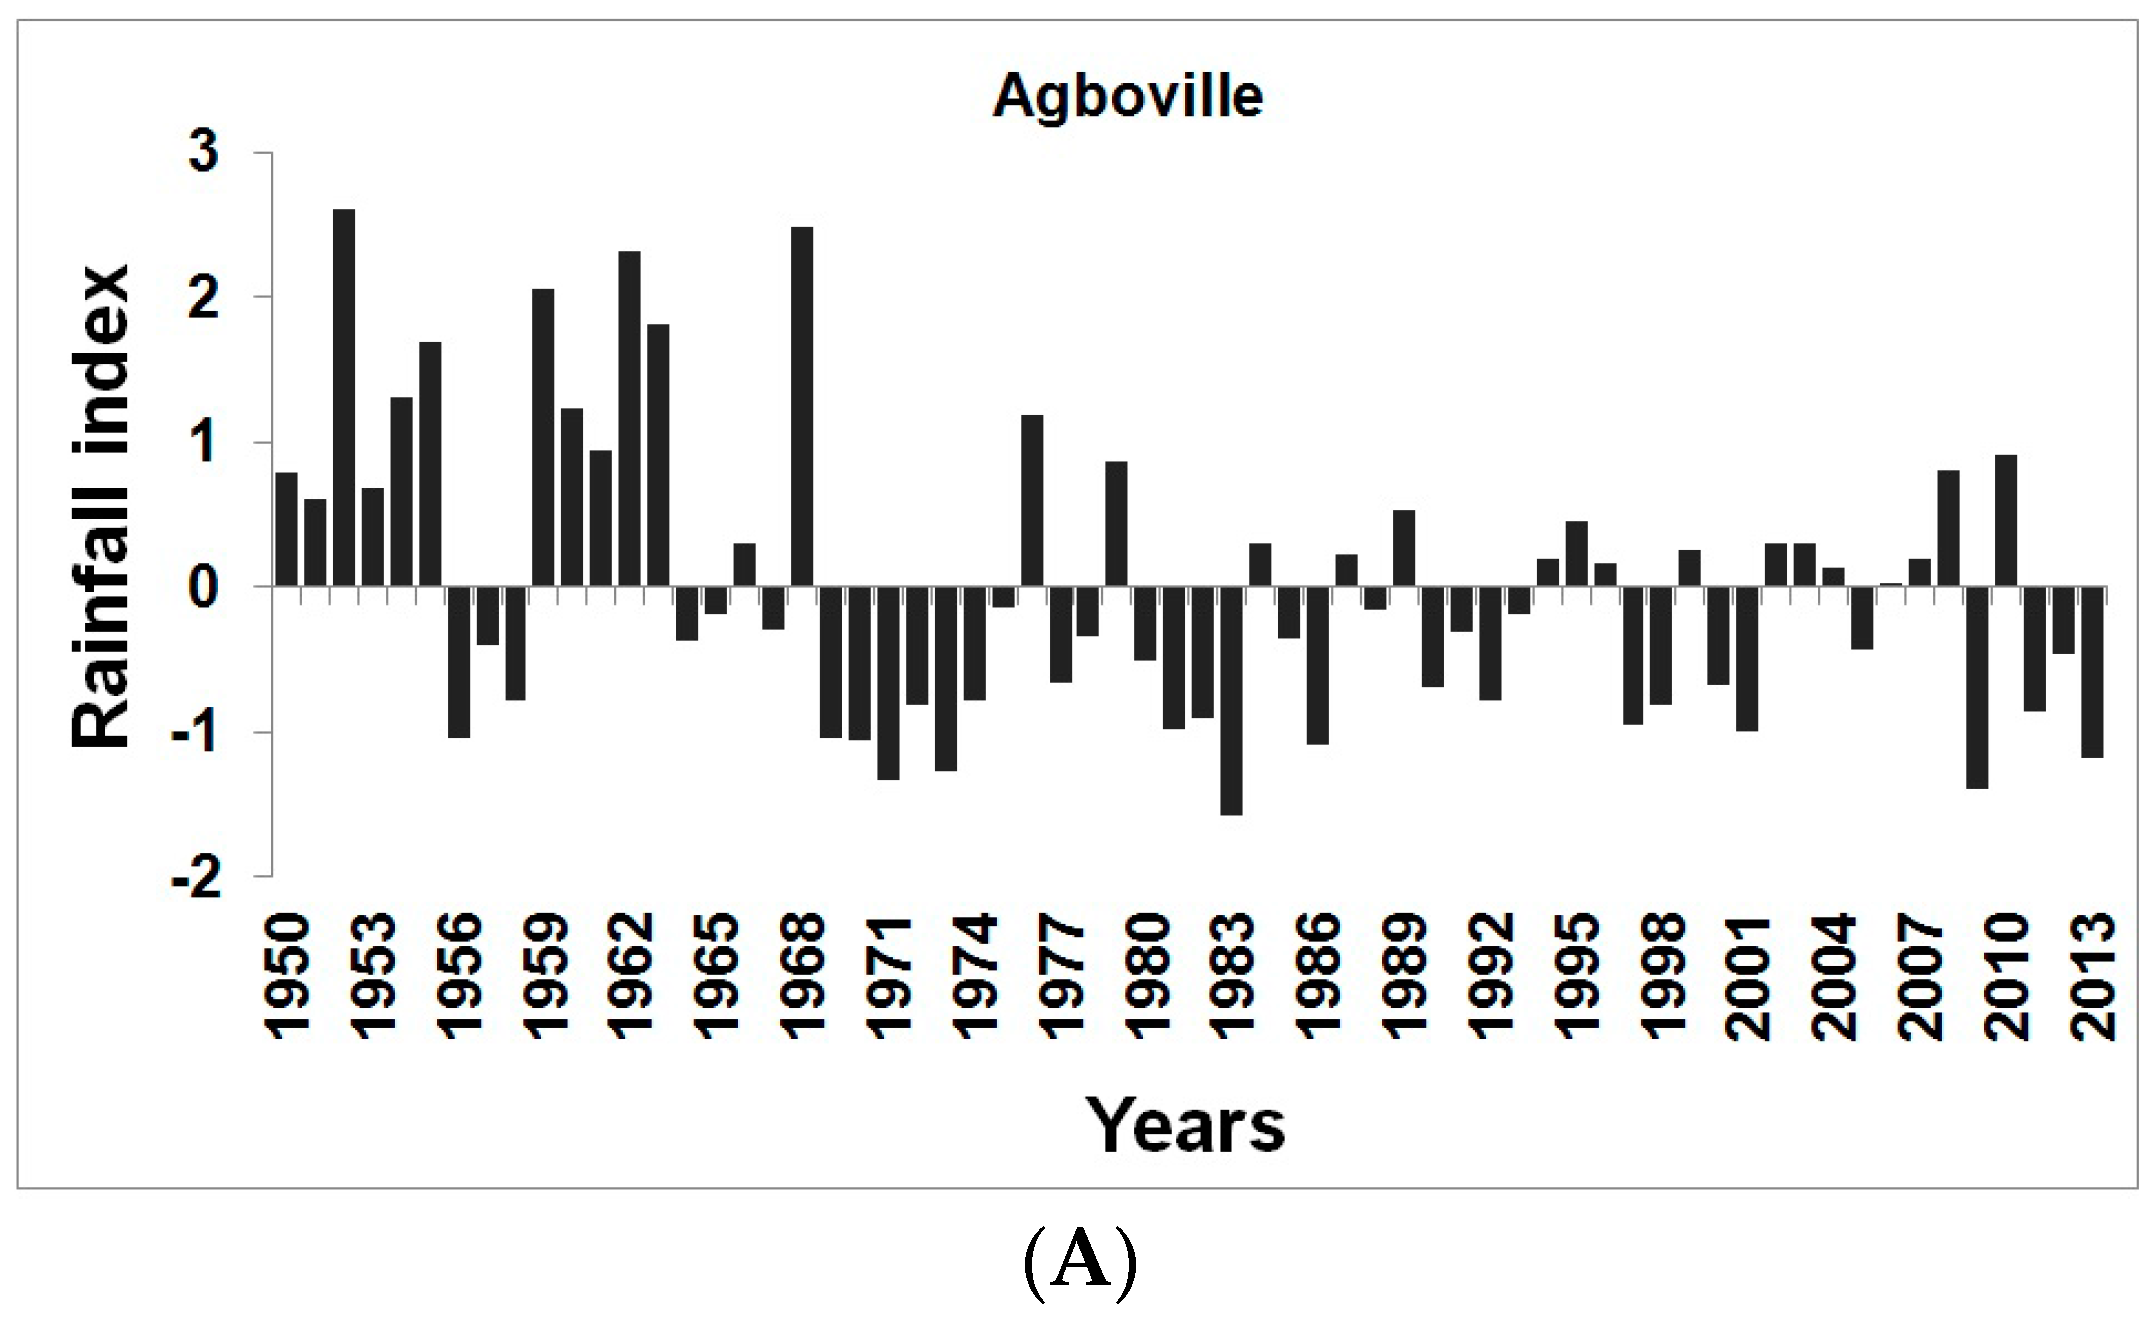
Analysis of rainfall indices (
Figure 2C) shows that the Agneby watershed at the Agboville outlet is characterized by high inter-annual variability of rainfall over the period 1950–2013, both at the basin and local scales. In the whole basin, two major periods were found: an excess period from 1950 to 1968, where rainfall indices are generally positive, and a deficit period from 1969 to 2013. The latter period was marked by a remarkable decrease in amplitude of a few surplus years. It is also marked by high deficit years (1986, 1993, and 2012) and some normal years (1965, 1972, 1996, and 2011).
At the local scale (
Figure 2A,B), variability in rainfall signal appears to be similar to that at the basin scale. However, disparities appear in some years. Indeed, rainfall in a given year may be in a surplus throughout the basin and in a deficit at the local scale and vice versa. For example, 1950 was dry for the basin scale but wet at the Agboville station (
Figure 2A). Therefore, the definition of a surplus or deficit year remains linked to the spatial scale chosen, as indicated also by Lawin et al. [
13].
Furthermore, the Hubert segmentation process [
25] and Pettitt non-parametric test [
24] show that a break point occurred at 1968 for the Agboville station and 1966 for the Bongouanou rainfall station. As mentioned in
Table 3, the rainfall spatial mean over the Agneby watershed in Agboville show a break point in 1968 with about 275 mm of deficit after the break.
3.2. Seasonal Cycle Variability
Daily average rainfall obtained by Kriging [
28] throughout the watershed is used to analyze the intra-seasonal rainfall distribution over the period 1950–2013. The seasonal cycle at the basin scale (
Figure 3) and at the local scale (Agboville and Bongouanou,
Figure 4 and
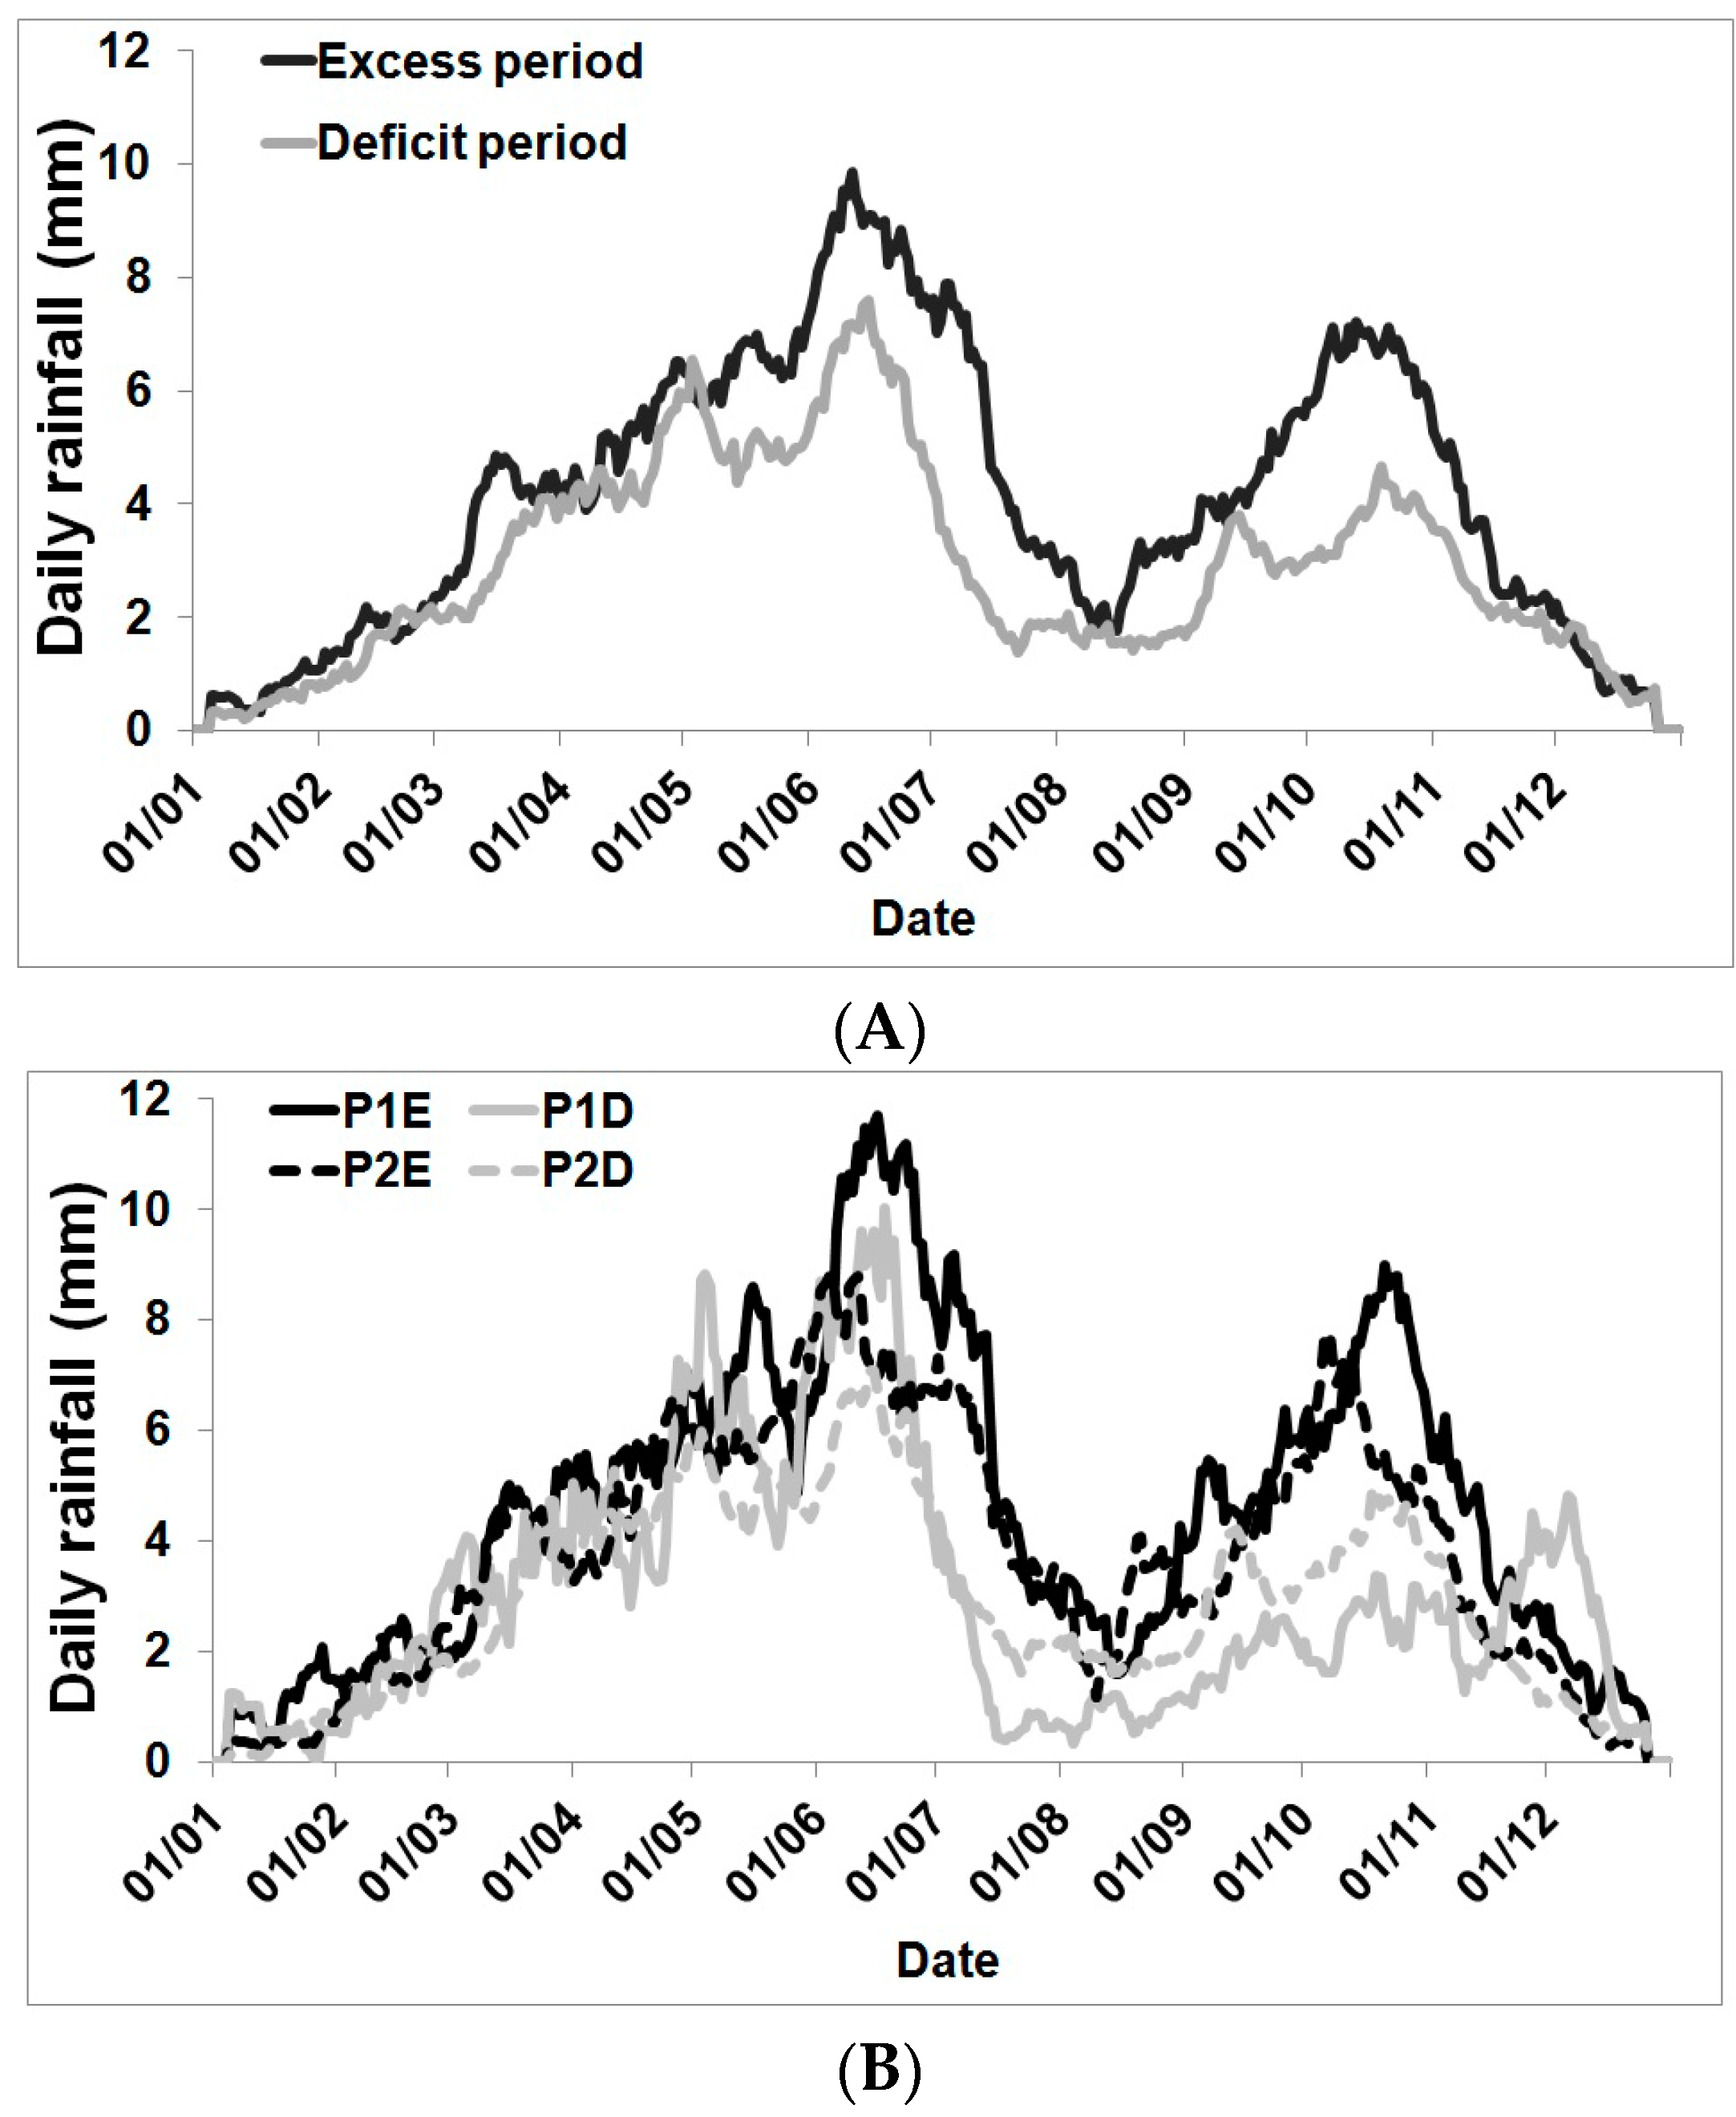
Figure 5) is bimodal. This is consistent with the location of the Agneby basin in Agboville in the sub-equatorial climate zone. The rainy season usually starts in late March, takes a break in August, and ends around November. The first peak of precipitation occurs in June and the second in October.
At the basin scale, the analysis of the seasonal cycle of wet years and dry years during the period 1950–2013 shows that the seasonal dynamics is identical (
Figure 3A). Seasons with surplus precipitation peaks persist longer than those of deficit precipitation, even though these peaks are achieved on the same dates. The deficit of precipitation peak is more pronounced during the short rainy season for deficit seasons compared to surplus seasons. Indeed, the deficit peak in June is about 10%, while that of October is about 36%. However, the withdrawal of precipitation is earlier during the long rainy season for the deficit years, unlike the short rainy season where the rainfall withdrawal seems identical, regardless of the nature of the deficit or surplus of the year.
The analysis of the four composites (
Figure 3B) defined above shows a lag of 12 days of the first peak of precipitation (peak of the long rainy season) between surplus composites (P1E and P2E) before and after 1968, and a decrease of 25% of this peak. The peak of the composite P2E is earlier achieved. This shift in precipitation peak for the long rainy season may affect normal crop development. Indeed, some crops may face a glut when they do not need so much water or a water deficit when they need enough water.
The gap between the peaks of dry composites (P1D and P2D) is more pronounced during the long rainy season than the short rainy season which peaks are virtually the same. This deficit is about 30%, which is slightly higher than the one for the surplus seasons.
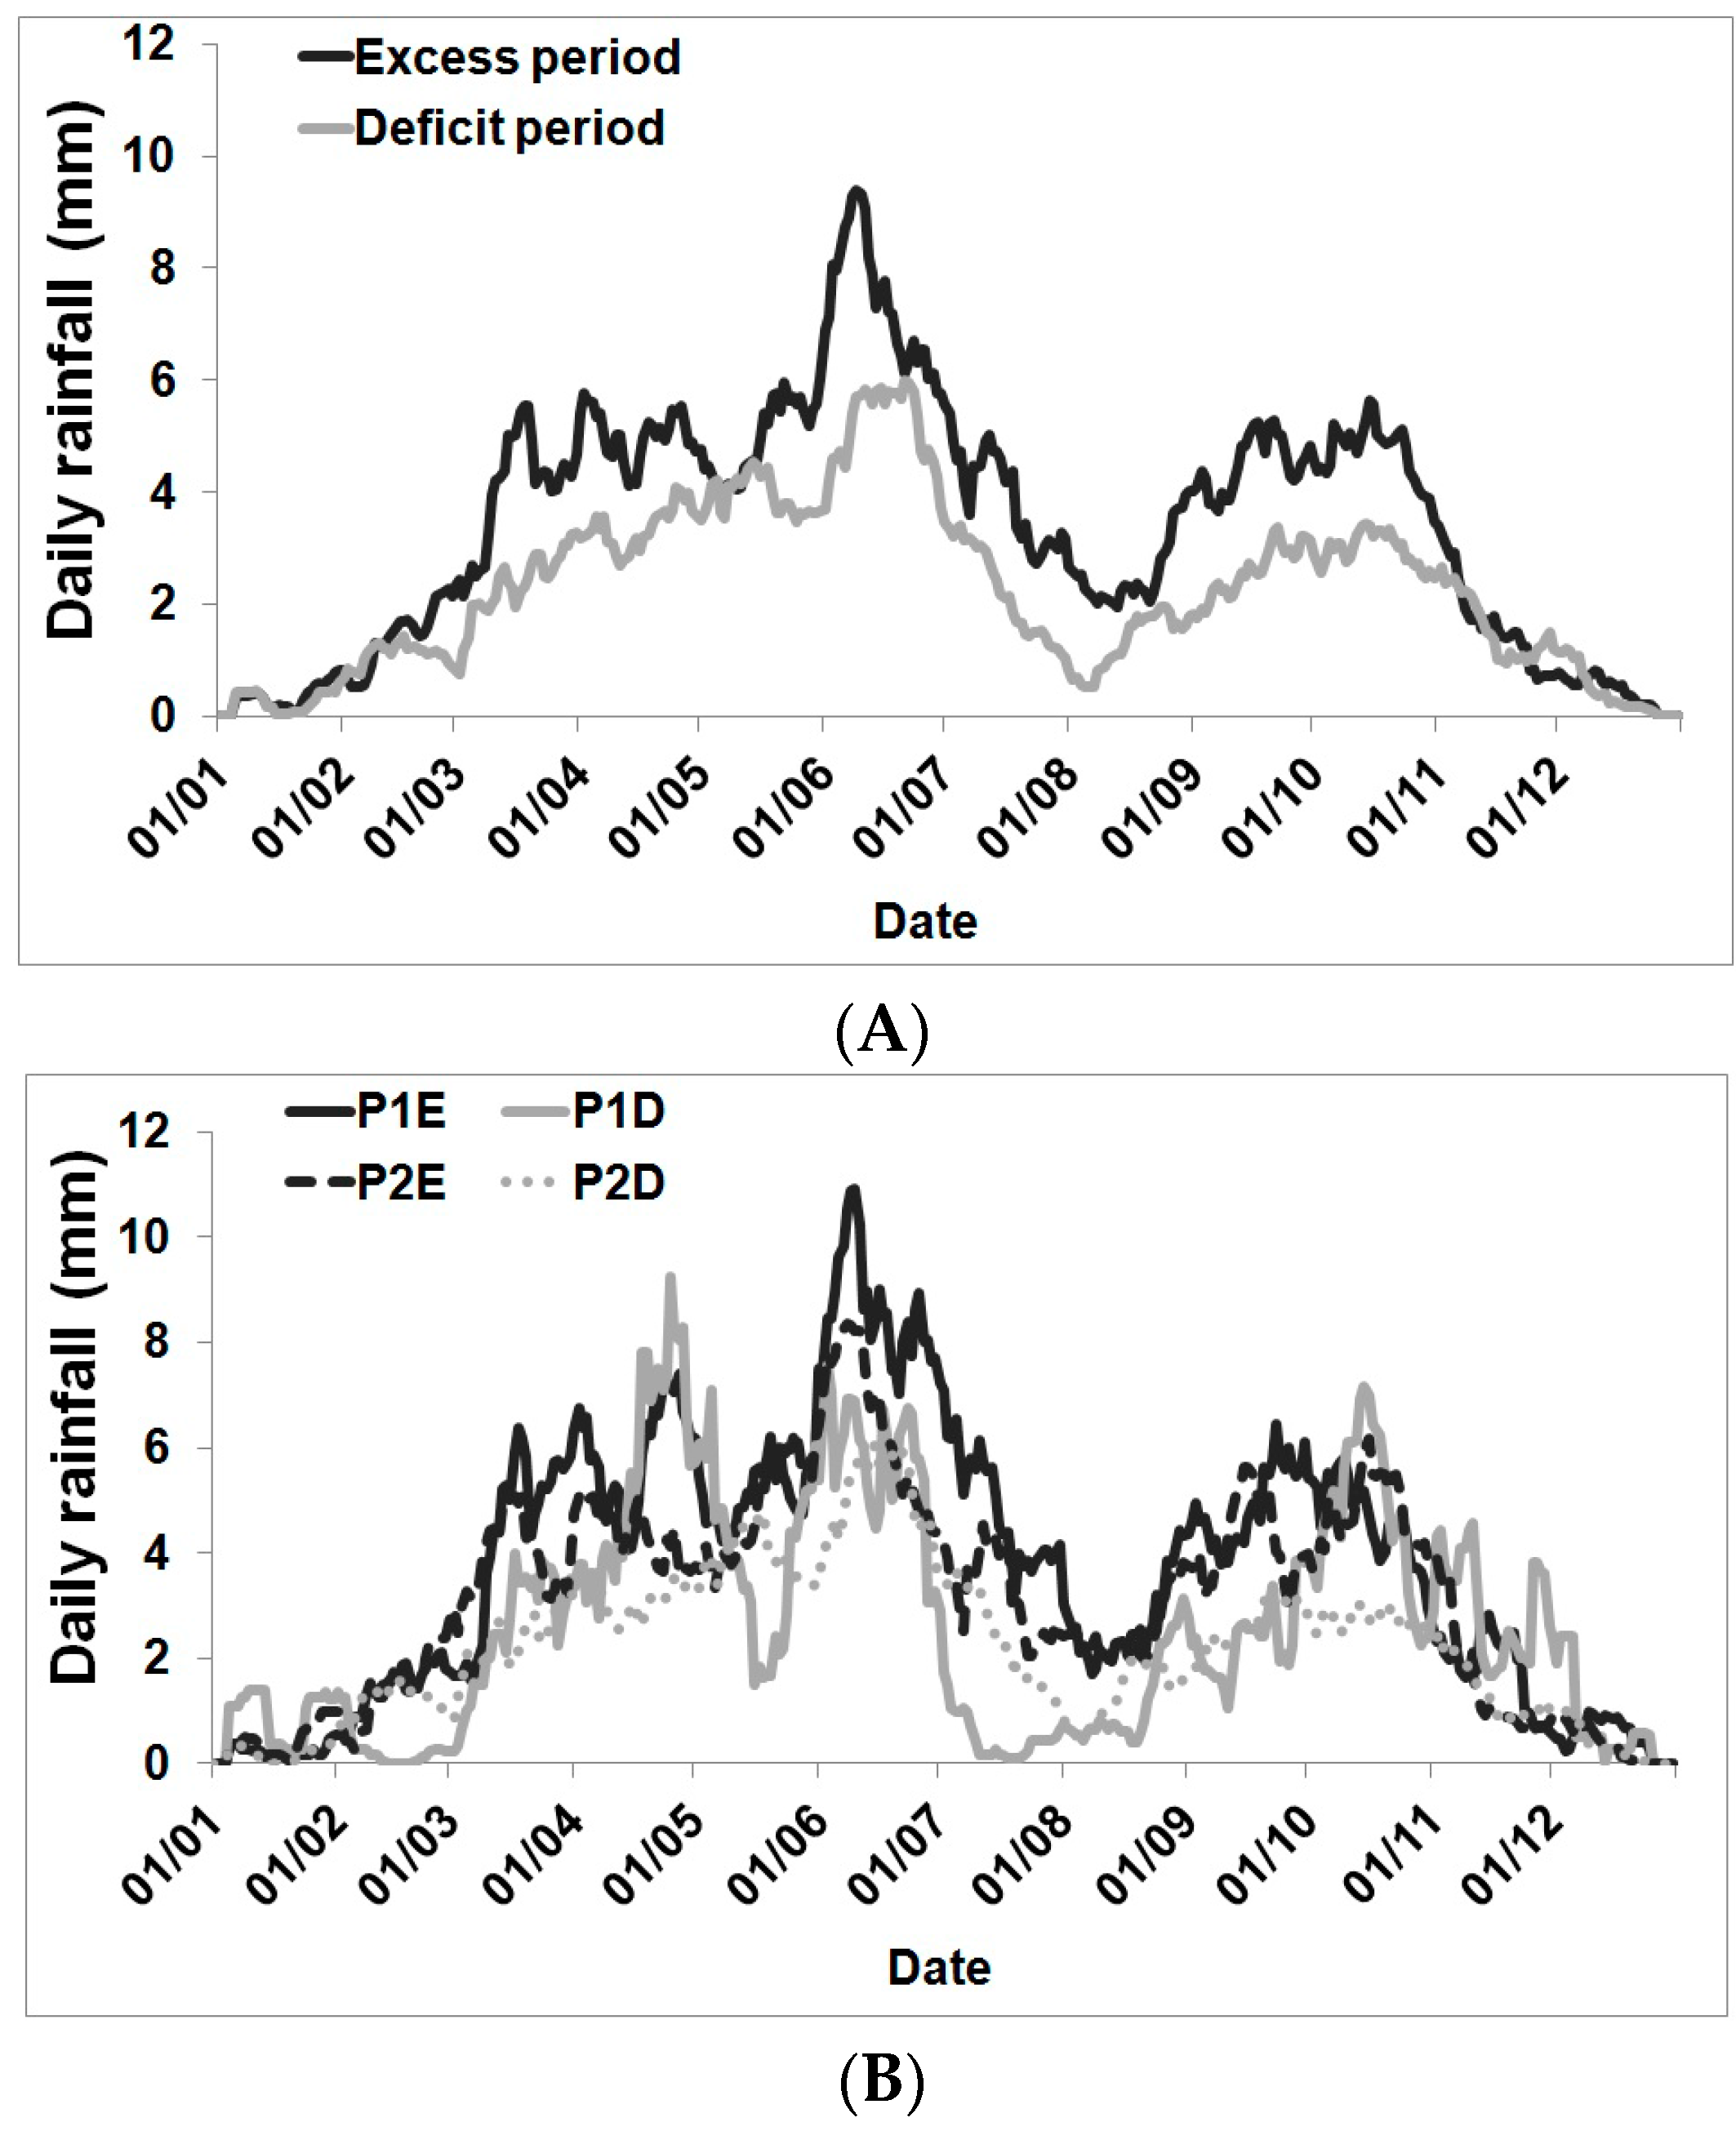
At the punctual scale, results are identical to those obtained at the basin scale for the installation and withdrawal of rainfall, as indicated in
Figure 4A and
Figure 5A. However, the deficits of the two peaks of rainfall between excess and deficit seasons vary according to the target station. For example, for the long rainy season, the deficit is 40% at the Bongouanou station, northwest of the basin, while it is about 20% at Agboville rain gauge in the Southern part of the watershed. Therefore, the deficit seems to double its value from the south to the north. However, for the short rainy season, it is rather the deficit of the south peak which is higher than that of the north.
Regarding excess composites (P1E and P2E) and deficit composites (P1D and P2D), deficits between peaks of the composites (
Figure 4B and
Figure 5B) vary differently. Moreover, a shift of the second precipitation peak is reached early in Agboville.
4. Discussion
Rainfall variability in the Agneby basin at the Agboville outlet, as shown in this study, is consistent with the results previously found in West Africa by several authors [
1,
10,
16,
26,
27,
29,
30,
31]. Indeed, similar rainfall seasonal dynamics of surplus and deficit years have been highlighted by Balme [
27] for a purely Sahelian climate on the EPSAT-Niger site and by Lawin et al. [
13] in the Sudanese climate on the upper valley of the Ouémé river in Benin. A similar dynamic of deficit years and surplus years seems to be characteristic of the African monsoon based on the identical results found. The break in the studied time series occurred in 1966 for the Bongouanou station and in 1968 for the Agboville station, as well in the whole basin. These breaks show that the study region has the same rainfall patterns observed in the late 1960s and early 1970s in West Africa and Central Sahel [
11,
14,
26,
32]. The decrease in the amplitude of rainfall signal can be explained by a disturbance of the seasonal migration of the Intertropical Front (FIT) in the north. The results highlighted here show that even at a small spatial scale as the Agneby watershed in Agboville or punctual scale, the West African monsoon dynamic is perceptible and its variability pattern is also high.
5. Conclusions
In this study, we analyzed the variability and seasonality of precipitation at the station scale and the entire watershed of the Agneby at Agboville outlet scale.
The seasonal cycle is bimodal. The rainy season starts from the beginning of April, which is the beginning of the long rainy season, and retires in November, which corresponds to the end of the short rainy season that follows the break in rainfall in August. The dynamics of excess seasons is identical to that of deficit years except that deficit years are characterized by a marked deficit after the jump of the monsoon and an early withdrawal of rainfall during the long rainy season.
Locally, the fine analysis of the seasonal cycle helped to highlight that the decline and shift in precipitation peaks are reached early after breaks. This shift in precipitation peak can have adverse effects on crop yields and threaten food security.
Acknowledgments
This research was funded by the French Republic across Lot No. 4 AMRUGE-CI project as part of the Contract and Debt Reduction Development (C2D). The authors wish to extend their sincere thanks to the AMRUGE-CI project. We also thank SODEXAM for providing the rainfall data used in this study.
Author Contributions
Figures and tables were done by Akissi Bienve Pélagie Kouakou. The Manuscript writing was made by Emmanuel Agnidé Lawin and Bamory Kamagaté, the first author’s Ph.D. co-supervisors, while Amidou Dao and Issiaka Savané provided tools for break point detection and rainfall variability analysis. They also reviewed the first draft before submitting. Data used to draft this paper are precompiled and provided by Bernard Srohourou.
Conflicts of Interest
The authors declare no conflict of interest. The founding sponsors had no role in the design of the study; in the collection, analyses, or interpretation of data; in the writing of the manuscript; or in the decision to publish the results.
References
- Kamagaté, B. Fonctionnement Hydrologique et Origines des écoulements sur un Bassin Versant de Milieu Tropical de Socle au Benin: Bassin Versant de la Donga (Haute Vallée de l’Ouémé). Ph.D. Thesis, Université de Montpellier II, Montpellier, France, 2006. [Google Scholar]
- Lawin, E.A. Analyse Climatologique et Statistique du Régime Pluviométrique de la Haute Vallée de l’Ouémé à Partir des Données de Pluie AMMA-CATCH Benin. Ph.D. Thesis, INP Grenoble, Grenoble, France, 2007. [Google Scholar]
- Djebou, D.C.; Singh, V.P. Impact of climate change on precipitation patterns: A comparative approach. Int. J. Climatol. 2016, 36, 3588–3606. [Google Scholar] [CrossRef]
- Majid, J. Trend and Homogenuity Analysis of Precipitation in Iran. Climate 2016, 4, 1–44. [Google Scholar]
- Kabo-Bah, A.T.; Diji, C.J.; Nokoe, K.; Mulugetta, Y.; Obeng-Ofori, D.; Akpoti, K. Multiyear Rainfall and Temperature Trends in the Volta River Basin and their Potential Impact on Hydropower Generation in Ghana. Climate 2016, 4, 1–17. [Google Scholar] [CrossRef]
- Aka, A.O. Variabilité des Ecoulements et Activités Anthropiques. Cas du Bassin du Bandama en Côte d'Ivoire. Ph.D. Thesis, Université de Montpellier II, Montpellier, France, 1999. [Google Scholar]
- Kouakou, K.E. Impacts de la Variabilité Climatique et du Changement Climatique sur les Ressources en eau en Afrique de l’Ouest: Cas du Bassin Versant de la Comoé. Ph.D. Thesis, Université Abobo-Adjamé, Abidjan, Ivory Coast, 2011. [Google Scholar]
- Djebou, D.C.S.; Singh, V.P.; Frauenfeld, O.W. Analysis of watershed topography effects on summer precipitation variability in the southwestern United States. J. Hydrol. 2014, 511, 838–849. [Google Scholar] [CrossRef]
- Nicholson, S.E.; Kim, J.; Hoopingarner, J. Atlas of African Rainfall and Its Interannual Variability; Department of Meteorology, Florida State University: Tallahassee, FL, USA, 1988. [Google Scholar]
- Servat, E. Identification, caractérisation et conséquences d’une variabilité hydrologique en Afrique de l’ouest et centrale. In Water Resources Variability in Africa during the XXth Century; IAHS Publication: Wallingford, UK, 1998; pp. 323–337. [Google Scholar]
- Servat, E.; Paturel, J.E.; Lubès-Niel, H.; Kouamé, B.; Masson, J.M.; Travaglio, M.; Marieu, B. De différents aspects de la variabilité de la pluviométrie en Afrique de l’ouest et centrale non sahélienne. J. Water Sci. 1999, 12, 363–387. [Google Scholar] [CrossRef]
- Djebou, D.C.S. Integrated approach to assessing streamflow and precipitation alterations under environmental change: Application in the Niger River Basin. J. Hydrol. Reg. Stud. 2015, 4, 571–582. [Google Scholar] [CrossRef]
- Lawin, E.A.; Afouda, A.; Oguntunde, P.G.; Gosset, M.; Lebel, T. Rainfall variability at regional and local scales in the Ouémé upper valley in Benin. Int.J. Sci. Adv. Technol. 2012, 2, 46–55. [Google Scholar]
- Goula, B.T.A.; Savane, I.; Konan, B.; Fadika, V.; Kouadio, G.B. Impact de la variabilité climatique sur les ressources hydriques des bassins de N’Zo et N’Zi en Ivory Coast (Afrique tropicale humide). Vertigo 2006, 1, 1–12. [Google Scholar]
- Paturel, J.E.; Servat, E.; Kouame, B.; Boyer, J.F.; Lubes, H.; Masson, J.M. Manifestation de la sécheresse en Afrique de l'Ouest non sahélienne. Cas de la Côte d'Ivoire, du Togo et du Béni. Sécheresse 1995, 6, 95–102. [Google Scholar]
- Assoma, T.V. Variabilité Hydroclimatique et Evaluation des Ressources en eau du Bassin Côtier de l’Agneby au Sud-est de la Ivory Coast: Apport des Outils Statistiques, de la Modélisation et de la Télédétection Optique et Radar. Ph.D. Thesis, Université Félix Houphouët-Boigny d’Abidjan—Cocody, Abidjan, Ivory Coast, 2013. [Google Scholar]
- Kouadio, Z.A. Dynamique de L’occupation du sol et Comportement Hydrologique. Cas des Bassins Versants Côtiers de l’Agneby et du Boubo. Ph.D. Thesis, Université d’Abobo-Adjamé, Abidjan, Ivory Coast, 2011. [Google Scholar]
- Le Barbé, L.; Tapsoba, D. Rainfall variability in west africa during the years 1950–1990. J. Clim. 2002, 15, 187–202. [Google Scholar] [CrossRef]
- Le Barbé, L.; Lebel, T. Rainfall climatology of the hapex-sahel region during the years 1950–1990. J. Hydrol. 1997, 188, 43–73. [Google Scholar] [CrossRef]
- Sultan, B.; Janicot, S. The west african monsoon dynamics. Part ii: The “Preonset” and “Oneset” of the Summer Monsoon. J. Clim. 2003, 16, 3407–3427. [Google Scholar]
- Arnaud, M.; Emery, X. Estimation and Spatiale Interpolation: Déterministic Méthods and Geostatistics Méthods; Hermès: Paris, France, 2000; p. 221. [Google Scholar]
- Cressie, N. Statistics for Spatial Data; Wiley: New York, NY, USA, 1992; pp. 613–617. [Google Scholar]
- Matheron, G. Regionalized Variables Theory and Its Applications. Note Book of Mathematical Morphology Centre; Fasc. 5 EMP: Paris, France, 1971; p. 212. [Google Scholar]
- Pettitt, A.N. A non-parametric approach to the change-point problem. Appl. Stat. 1979, 28, 126–135. [Google Scholar] [CrossRef]
- Hubert, P.; Carbonnel, J.P.; Chaouche, A. Segmentation des séries hydrologiques. application à des séries de précipitations et de débits de l’Afrique de l’Ouest. J. Hydrol. 1989, 110, 349–367. [Google Scholar]
- Paturel, J.E.; Servat, E.; Delattre, M.O. Analyse de séries pluviométriques de longue durée en Afrique de l’Ouest et centrale non sahélienne dans un contexte de variabilité climatique. J. Des Sci. Hydrol. 1998, 43, 937–945. [Google Scholar] [CrossRef]
- Balme, M. Analyse du Régime Pluviométrique Sahélien Dans une Perspective Hydrologique et Agronomique. Etude de L’impact de sa Variabilité sur la Culture du Mil. Ph.D. Thesis, Institut National Polytechnique de Grenoble, Grenoble, France, 2004. [Google Scholar]
- Delhomme, J. Application de la Théorie des Variables Généralisées dans les Sciences de L’eau. Ph.D. Thesis, Université Pierre et Marie Curie, Paris, France, 1976. [Google Scholar]
- Amidou, D.; Bamory, K.; Adama, M.; Albert, G.B.T.; Luc, S.; Bokar, M.H.; Issiaka, S. Variabilité Climatique et Réponse Hydrologique du Bassin Versant Transfrontalier de Kolondièba au Sud du Mali. Eur. J. Sci. Res. 2010, 43, 435–444. [Google Scholar]
- Fossou, R.M.N. Variabilité climatique et son impact sur les ressources en eaux souterraines: Cas des stations de Bocanda et de Dimbokro au centre est de la Cote d’Ivoire (Afrique de l’ouest). Larhyss J. 2015, 21, 97–120. [Google Scholar]
- Lawin, A.E.; Afouda, A.; Lebel, T. Analyse de la variabilité du régime pluviométrique dans la région agricole d’Ina au Benin. Eur. J. Sci. Res. 2011, 50, 425–439. [Google Scholar]
- Yao, A.B. Evaluation des Potentialités en eau du Bassin Versant de la Lobo en vue D’une Gestion Rationnelle (Centre-Ouest de la Ivory Coast). Ph.D. Thesis, Université Nangui Abrogoua, Abidjan, Ivory Coast, 2015. [Google Scholar]
© 2016 by the authors; licensee MDPI, Basel, Switzerland. This article is an open access article distributed under the terms and conditions of the Creative Commons Attribution (CC-BY) license (http://creativecommons.org/licenses/by/4.0/).


 ,
, 


