Article

Studying Water Quality Using Socio-Environmental Synthesis Approach: A Case Study in Baltimore’s Watershed

Department of Natural Sciences, Coppin State University, Baltimore, MD 21216, USA
*
Author to whom correspondence should be addressed.
Hydrology 2017, 4(2), 32; https://doi.org/10.3390/hydrology4020032
Submission received: 30 December 2016 / Revised: 1 June 2017 / Accepted: 2 June 2017 / Published: 7 June 2017

Abstract

:
While almost 87% of the world’s population now has access to an improved drinking water source, the risk of water pollution remains, often due to environmental factors such as increasing urbanization and industrialization. Last year, as the country watched the tragic Flint, Michigan tap water quality deterioration unfold, the issue was brought closer to home: How good is Baltimore’s water system? Baltimore’s water source is primarily surface water, which feeds into the Liberty, Loch Raven and Prettyboy reservoirs. The Socio-Environmental Synthesis (SES) approach was used to investigate the factors that contribute to water quality impairment. SES is a research method that integrates existing knowledge and data from natural and social sciences to advance understanding of socio-environmental systems. The study found out that while the quality of the drinking water is generally good, there is a growing concern with the quality of water in the watersheds. The high levels of nitrate-nitrogen and increased concentrations of carbon dioxide are especially alarming. The high levels of Biological Oxygen Demand are also good indicators of the intensity of agriculture and urbanization in the watersheds. This study believes that maximizing the current watershed conservation and restoration efforts would reduce the treatment costs and safeguard the urban water supplies.

1. Introduction

At a global scale, water resources have proven themselves to be resilient to natural and man-made threats. Growing population’s need for water is increasingly competing with nature’s own demands for water to sustain already imperiled ecosystems and the services upon which all living organisms depend. Clean water has become scarce and will become even scarcer with the onset of climate change.
Water quality is commonly defined by its physical, chemical, biological and aesthetic characteristics. A healthy environment is one in which the water quality supports a rich and varied community of organisms and public health. “An emerging water quality concern in many watersheds is the impact of personal care products and pharmaceuticals, such as birth control pills, painkillers, antidepressants and antibiotics, on aquatic ecosystems” [
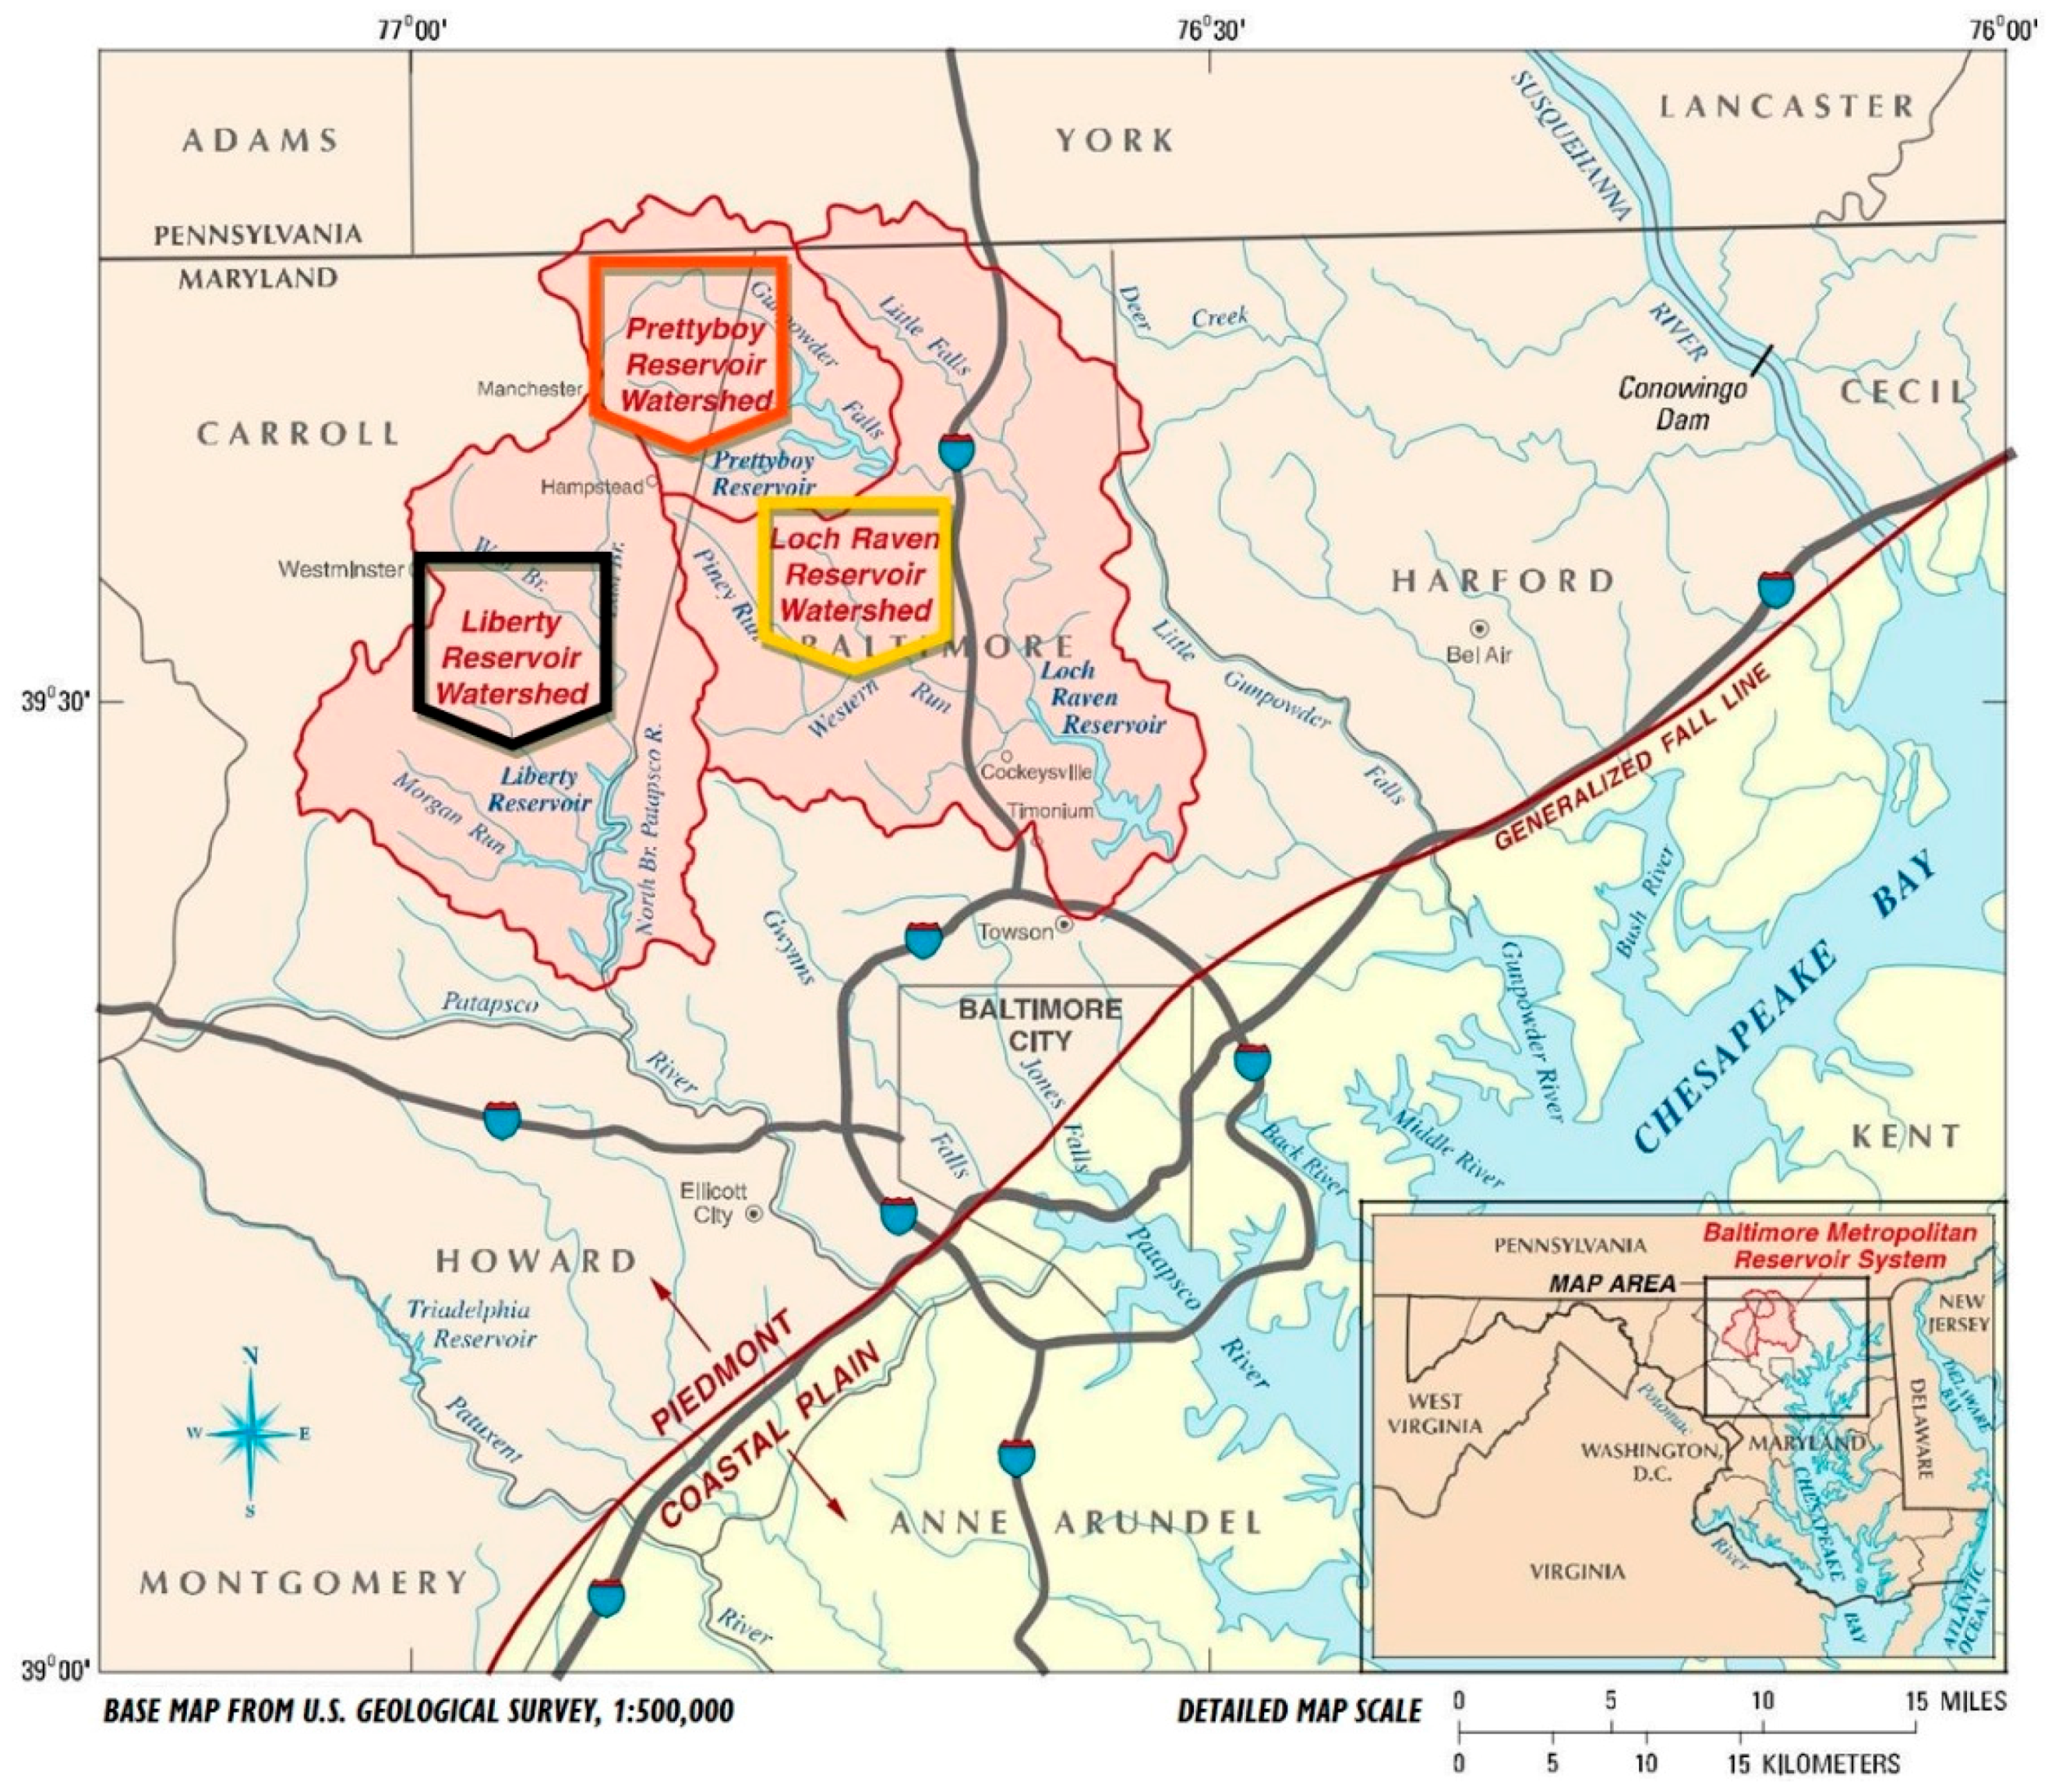
1]. In this context, the current study posed a question, “How is Baltimore’s water quality?” Baltimore City supplies drinking water to 1.8 million homes including parts of Anne Arundel, Baltimore, Carroll, Harford and Howard counties. A long-term water-quality study by United States Geological Survey (USGS) [2] raised concerns that include eutrophication and sedimentation in the reservoirs. It found elevated concentrations of (a) nutrients (nitrogen and phosphorus) being transported from the major tributaries to the reservoirs; (b) iron and manganese released from reservoir bed sediments during periods of deep-water anoxia; (c) mercury in higher trophic order game fish in the reservoirs; and (d) bacteria in selected reservoir watershed tributaries. Emerging concerns included elevated concentrations of sodium, chloride, and disinfection by-products (DBPs) in the drinking water from both (Liberty and Loch Raven) supply reservoirs. Climate change is also an emerging concern, affecting seasonal weather patterns and drought occurrence, which historically have led to declines in reservoir water quality [2].
A study by Tambe et al. discussed a community in South Asia where half the time the available drinking-water was contaminated with faecal organisms [3]. Although 85% of drinking-water in South Asia meets the target of the Millennium Development Goal of coming from an improved source, this contamination is still common. In the United States, at the beginning of the twentieth century, most large- scale municipal water districts distributed untreated water. Immediately following the introduction of effective water treatment, overall child mortality dropped by 46% in major US cities [4].
In Baltimore city, accepted standards of clean water are: (a) pathogen-free; (b) softened if the raw water has a high mineral content; and (c) free of harmful or unwanted chemicals and decaying matter. Treated water has chlorine to prevent the growth of microorganisms, lime to prevent corrosion of the pipes through which water flows, and fluoride to prevent tooth decay. Various city reports suggest that the drinking water meets all federal water safety standards. Baltimore’s 2013 water quality report, however, shows the chlorine by-products hover right below the legal limit. Scientific research suggests that long-term exposure to chlorine by-products through drinking, inhalation or cutaneous absorption (hot showers) is linked to higher bladder cancer rates in exposed human populations [5].
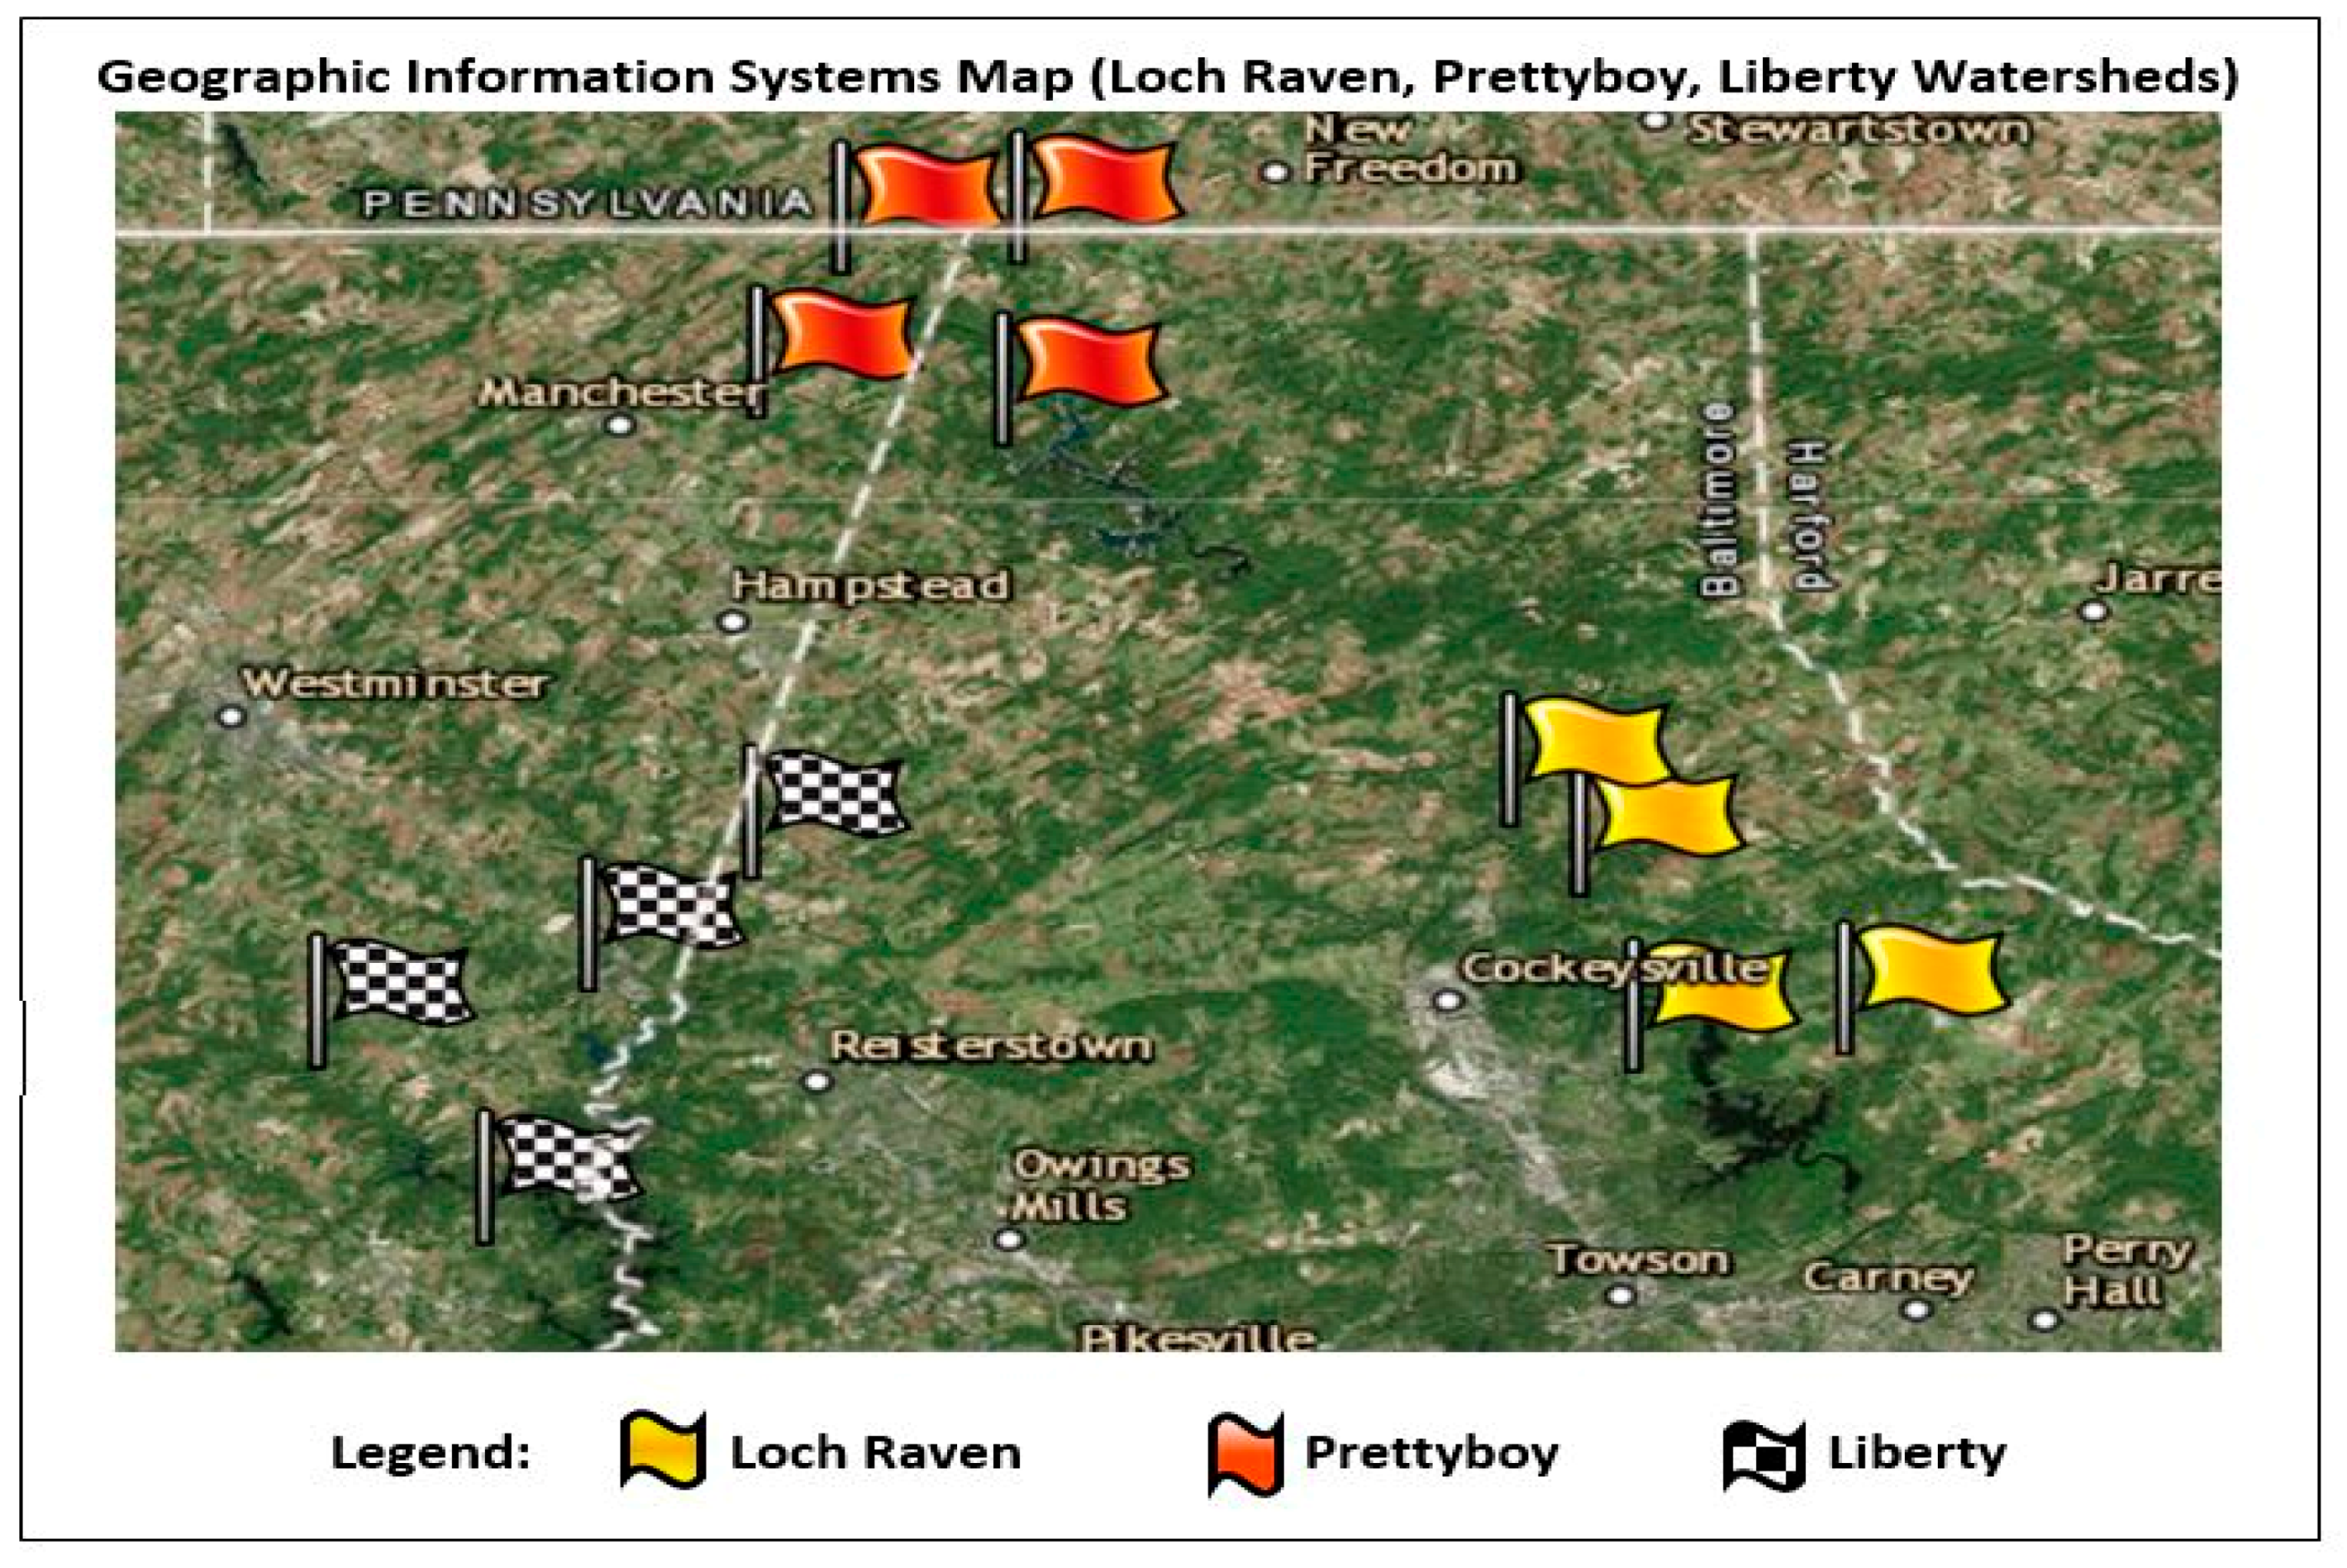
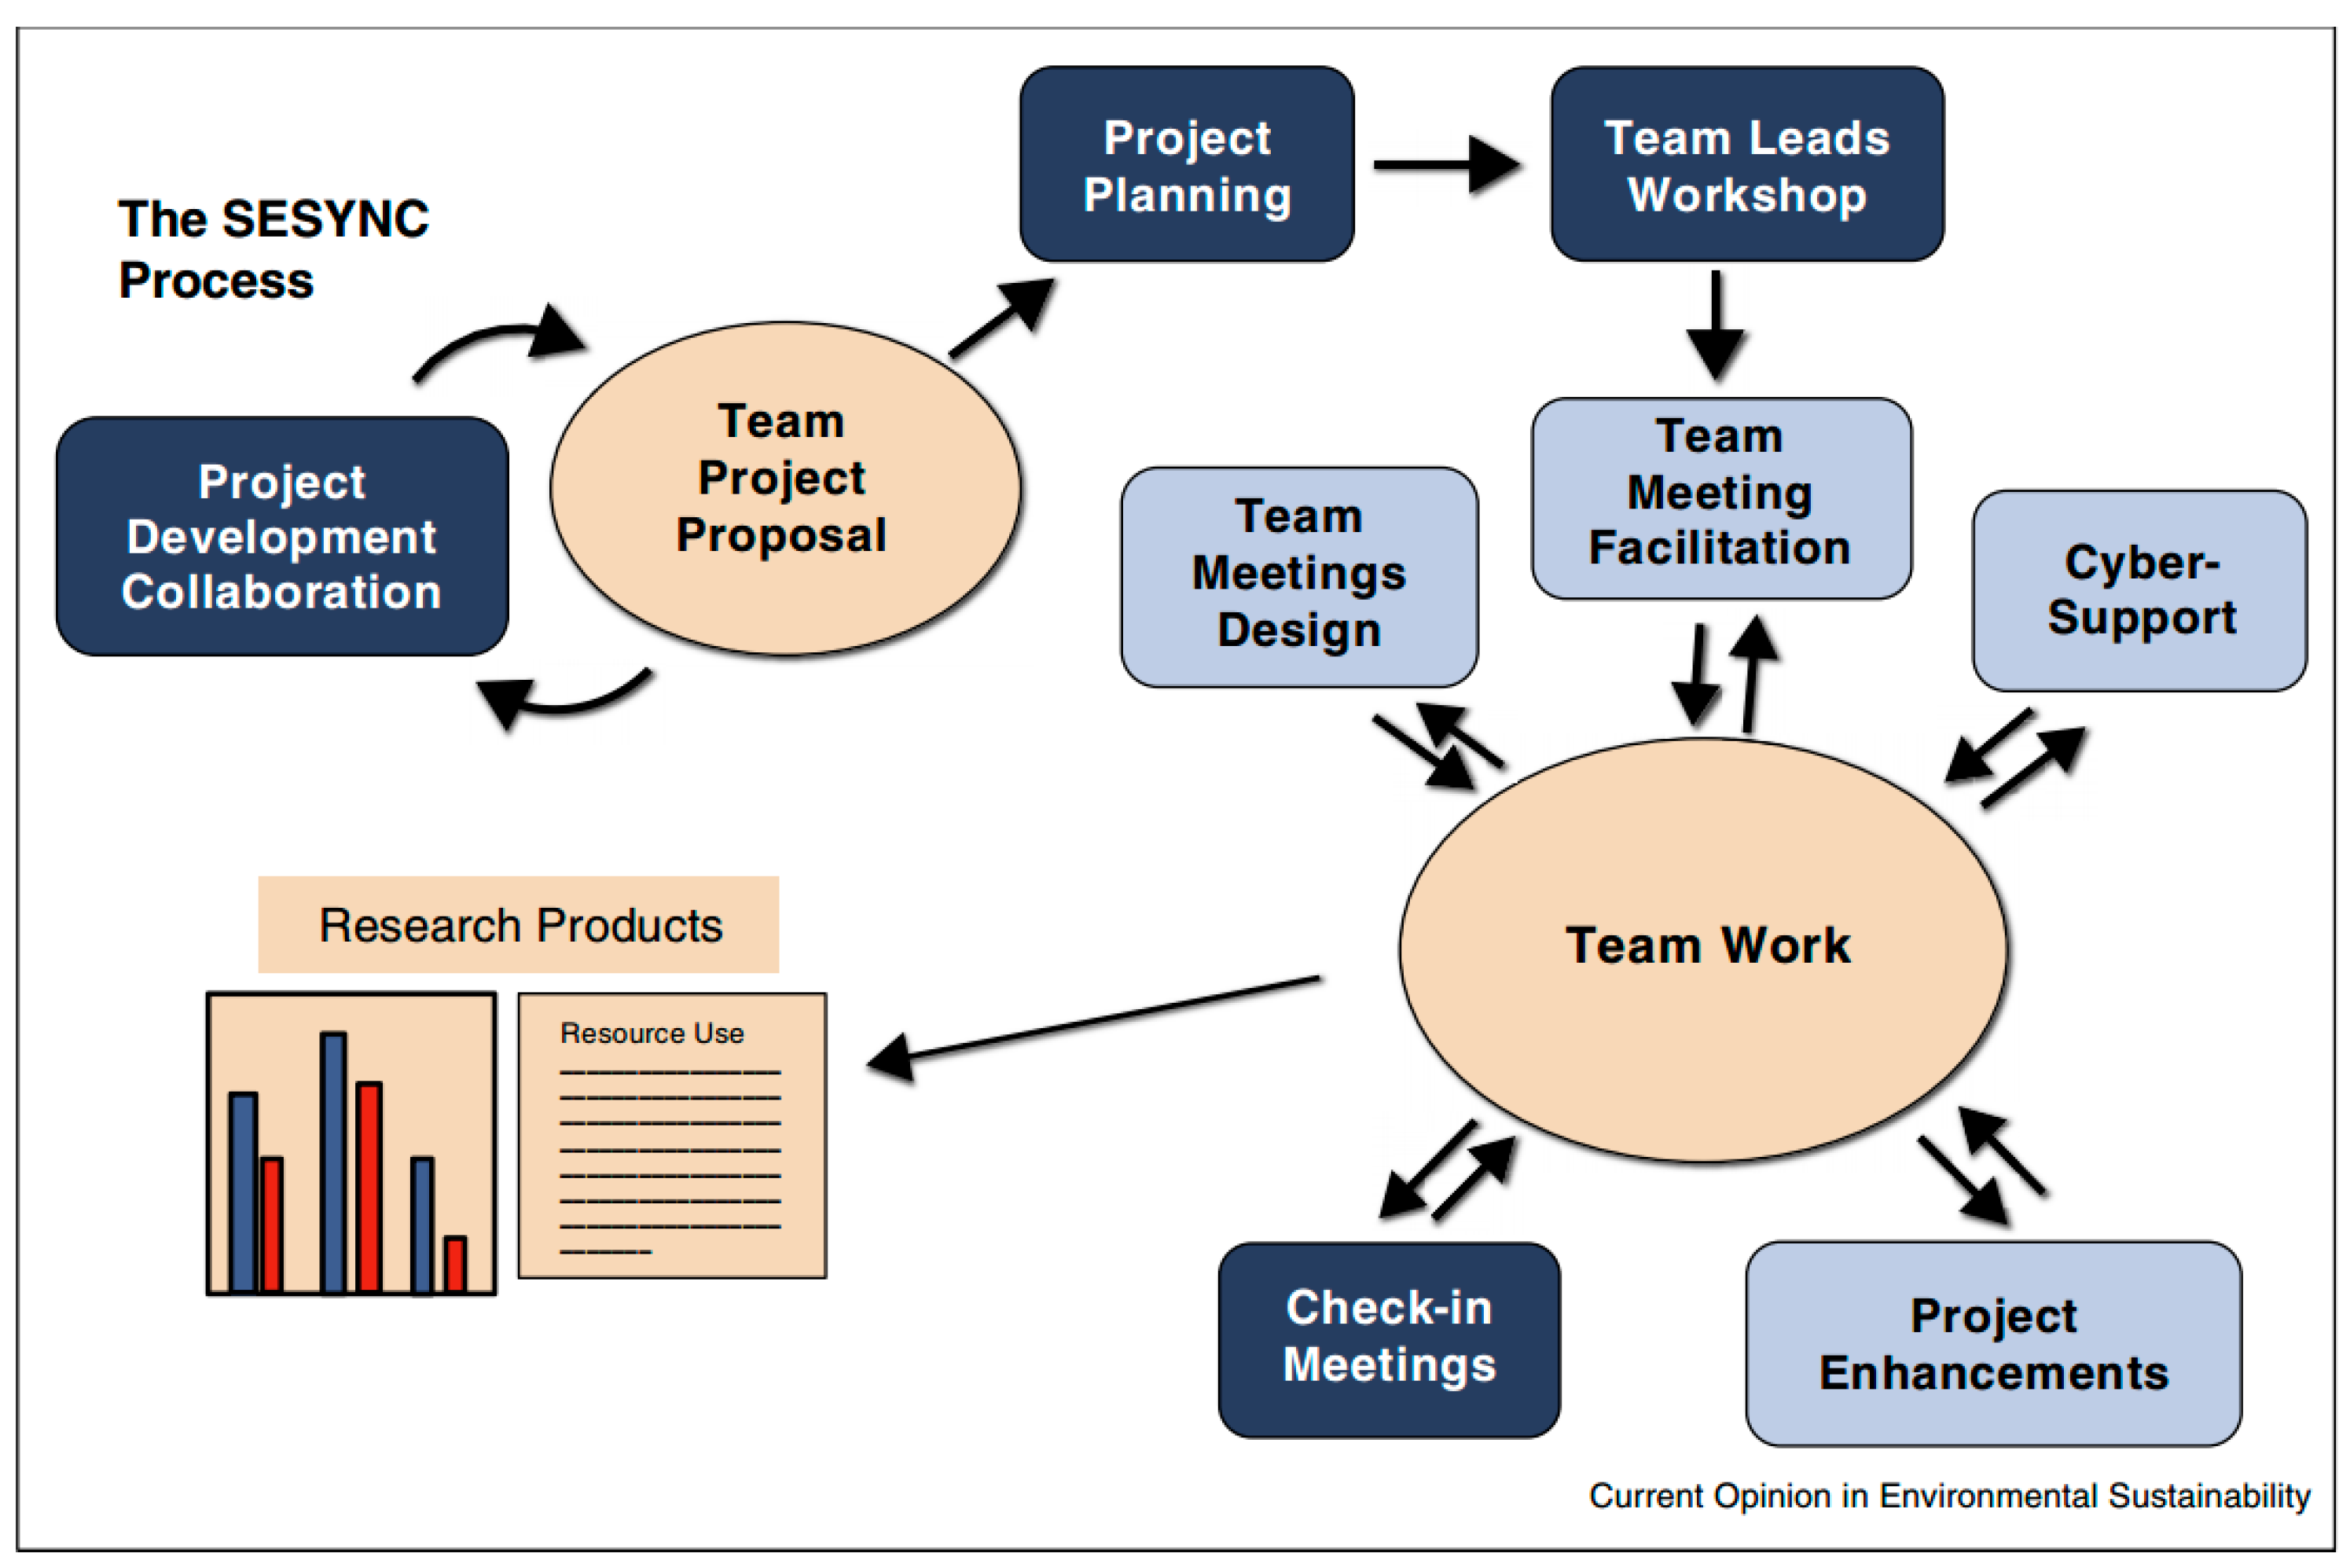
This study examines social and bio-chemical factors that potentially cause water quality impairment in Baltimore’s watershed. We used the Socio- Environmental Synthesis (SES) approach, which combines insights, methods and data from the natural and social sciences to produce knowledge and generate solutions [6]. Long-term water quality data was obtained from secondary sources and seasonal changes in water quality were analyzed both in the lab and field (described in the methods section). The Baltimore Ecosystems Study (BES), using the watershed ecosystems approach, undertook a large-scale study in Baltimore’s watershed to understand the linkages and feedbacks between the social and bio-physical components of the system and to contribute knowledge of integrated socio-ecological landscapes to the ongoing efforts to improve the quality of water draining into the Chesapeake Bay [7]. The current study is complimentary to the BES and seeks to improve our understanding of Baltimore’s three watersheds.

2. Materials and Methods

2.1. Study Area

Baltimore’s water source is primarily surface water that feeds into the Liberty, Loch Raven and Prettyboy reservoirs. Three impoundments comprising two water sources and one river provide raw water to the City’s water filtration plants. Figure 1 shows Baltimore’s watersheds and its reservoirs that supply the city’s drinking water.
Liberty Watershed is on the boundary between western Baltimore County and eastern Carroll County with the Liberty Reservoir located on the North Branch of the Patapsco River. It collects water from a 163.4 square mile drainage area that includes eastern Carroll County and southwestern Baltimore County. After traveling across seven sub watersheds (Beaver Run, Bonds Run, Liberty Reservoir, Little Morgan Run, Middle Run, Morgan Run and North Branch), water from the reservoir flows by gravity through a 12.7-mile long, 10-foot diameter tunnel to the Ashburton Water Filtration Plant for treatment [8].
Loch Raven Watershed occupies northern Baltimore County, small parts of western Harford County and southern York County, Pennsylvania and its namesake reservoir is north of Baltimore City. The capacity of Loch Raven Reservoir, largest of the three supplying reservoirs, is approximately 23 billion gallons and the impounded area is roughly 2400 acres [2]. Raw water from this reservoir travels through a 7.3-mile long, 12-foot diameter tunnel for treatment at the Montebello Filtration Plants 1 & 2 in Baltimore City.
Prettyboy Reservoir is in the northwest corner of Baltimore County and its 80-square mile watershed lies in northern Baltimore County and small portions of northeastern Carroll County and southern York County, Pennsylvania. Prettyboy Dam was completed in 1932, has a spillway crest elevation of 520 feet of mean sea level, impounds about 19 billion gallons of water, and covers about 1500 acres. Prettyboy Reservoir water is transferred to Loch Raven Reservoir via Gunpowder Falls rather than directly to Baltimore. The dam releases water as needed into the river channel, which flows into Loch Raven Reservoir [9].
Water from the Susquehanna River, approximately 11 miles north of Aberdeen near the Pennsylvania State line, is pumped via the Dear Creek Pumping Station to the Montebello Filtration Plants through the 38-mile long Susquehanna Conduit. However, this source is normally only used during times of extreme drought when storage becomes depleted in the reservoirs. The Susquehanna supply has a present capacity of about 150 million gallons per day with a planned future capacity of 200 million gallons per day.

2.2. Method

The Socio-Environmental Synthesis (SES) Approach

Because society’s most critical environmental problems are rooted in the multifaceted and deeply interconnected relationships between humans and the natural ecosystems in which they live, they require the unique knowledge sets and perspectives of scientists from both the social and natural sciences [6]. Socio-Environmental Synthesis (SES) is a research approach that analyzes complex interactions between human and natural systems. The approach involves distilling or integrating data, ideas, theories or methods from the natural and social sciences. This may result in novel analytical models that can be used to evaluate textual or oral arguments, interpret evidence, develop new applications or models, or identify new directions for research. This method allows the researcher to look at an issue from various social and environmental perspectives. Under the social umbrella, researchers study the politics, policy, and social behavior dimensions of a problem. Through the environmental lens, researchers investigate the ecological and biophysical facets of the issue.
The SES process (Figure 2) focuses on team development that engages discipline diversity [10]. The collaborations across disciplines is useful in building new communities of researchers who are able to demonstrate the relevance of socio-environmental research to decisions and behaviors via actionable science.
In this study, the SES method was used to investigate the causative interrelations between social factors and watershed biophysical and chemical factors. Four integrally related dimensions of water quality were identified: social and governmental policies, land use and climate (Figure 3).
To study the impacts of land use on water quality, the study looked into changes in agriculture, development, runoff and urbanization patterns over 40 years in the three aforementioned watersheds. As indicators of land use change, essential water quality parameters, including nitrate, alkalinity, oxygen percentage saturation and carbon dioxide levels, were analyzed. In each reservoir, four representative test points (Figure 4) were identified and surface water samples were collected using a five-foot long-handled dipper. To monitor the dynamics of water quality change, samples were taken during fall (September), winter (February), spring (April) and summer (July) seasons over a period of two years (2015 and 2016). Analysis was done both in the field (using LaMotte test kits) and laboratory according to standard research protocols [11]. For oxygen percentage saturation, water samples were incubated (fixed) in the field and analyzed in the lab using the LaMotte method.
To understand the impacts of climate change on water quality, the study examined temperature and precipitation patterns. Local climate data was obtained from the National Oceanic and Atmospheric Administration [12]. Mean averages were calculated and used to show the change of temperature and precipitation over time.
Social factors, including awareness, behavior, level of income and education, were studied using existing data sources obtained from the county’s publicly available information [2,8,9]. The impact of policy, mainly the existence of water-related laws/regulations (at local, state and federal levels) and their enforcement was also studied through interviews and review of pertinent legislations [13].

3. Results

3.1. Analysis of Water Samples

From each watershed, water samples were collected at four representative test points (Figure 4) to analyze water quality parameters that indicate change during different seasons over the study period (2015–2016). To capture seasonal variability, in 2015, samples were collected during winter (February) and summer (July) and in 2016 during spring (April) and summer (July) seasons. The measured parameters include nitrate-nitrogen, Biological Oxygen Demand (BOD), alkalinity and carbon dioxide concentration. Mean averages of test points (Figure 5) were calculated to compare the seasonal changes and the dynamics over two years.
Figure 5 charts the dynamics of nitrate concentrations seasonally over the two-year test period. The line graphs correlate the pattern of change at each test point in the three watersheds. Mean average comparison of nitrate levels across seasons shows highest concentration during winter 2015 at the Liberty watershed (4.9 ppm), with the lowest at Loch Raven (1.9 ppm) during summer. In 2016, the highest was during spring at Prettyboy (2.1 ppm), with the lowest (0.9 ppm) at Liberty during summer. The 2015 Baltimore city drinking water report [3] determined the maximum nitrate level goal to be 10 ppm, so all of the watersheds are below this determined goal.
The percentage oxygen saturation was also measured at each sampling point and the results are presented in Figure 6. Mean average comparison of oxygen saturation levels across seasons shows highest percentage (73%) during winter 2015 at the Prettyboy watershed, with the lowest (36%) at Liberty during winter. In 2016, the highest was during spring at Lock Raven (134%), with the lowest (70%) at Prettyboy during summer.
Values higher than 100% saturation indicate that the samples are supersaturated in an area where there are a lot of plants or algae on a sunny day. Cary Institute’s (Millbrook, NY, USA) modified water quality index was used to classify the BOD measured data and concluded that percentage values below 60% are considered poor quality, 60–79% acceptable for most stream animals, 80–125% excellent for most stream animals and 125% or more too high for any stream animal [14]. A similar water quality study in Korea [15] determined a BOD threshold of 33.4% as poor water quality, indicating that BOD threshold values vary with study sites.
The other water quality parameter studied was alkalinity (Figure 7). Higher alkalinity levels in surface waters will buffer acid rain and other acid wastes and prevent pH changes that are harmful to aquatic life. Mean average comparison of alkalinity levels across seasons shows the highest concentration during winter in 2015 at the Liberty watershed (94 ppm), with the lowest at Prettyboy (33 ppm) during the summer. In 2016, the highest was during the spring at Liberty (68 ppm), with the lowest (34 ppm) at Prettyboy during the summer. Most natural drinking water has an alkalinity in the range of 10 to 500 mg/L and it is due largely to the presence of sodium, calcium, and magnesium carbonates [16].
Change in carbon dioxide (CO2) levels were also monitored seasonally over a two-year period (2015–2016). Figure 8 presents the dynamics of change in the three watersheds. Mean average comparison of CO2 levels across the seasons shows the highest values during summer 2015 at the Prettyboy watershed (8.9 ppm), with the lowest at Prettyboy (3.2 ppm) during the winter. In 2016, the highest was during the summer at Prettyboy (10.8 ppm), with the lowest (2.2 ppm) at Liberty during the spring.

3.2. The Climate Dimension

To understand the impacts of climate change on water quality, 45 years of temperature and precipitation data was obtained from the National Oceanic and Atmospheric Administration [12]. Figure 9 presents the dynamics of temperature and precipitation change in the study area over time. While temperature over the period increased, average precipitation remained unchanged.
Michalak suggests that there has been scant study of how climate affects the occurrence of the extreme events that relate to water quality rather than quantity. “We do not know how to relate water-quality extremes, their causes, their severity or their occurrence directly to changes in climate” [17]. Our study reached a similar conclusion, as it is very difficult to establish a causative relationship between water quality and climate change.
Impaired water quality is a global and growing problem, limiting resources for drinking, domestic use, food production and recreation, as well as harming ecosystems. The types and causes range from excess nutrients leading to harmful algal blooms and hypoxic ‘dead zones’, to bacterial, viral and chemical contamination including personal-care products and pharmaceuticals. Cases of extreme impairment often lead to disproportionate human and ecosystem impacts [17].

3.3. The Land Use Dimension

Watersheds polluted by agricultural and urban development runoff compromise the quality of raw water ending up at treatment plants while wreaking havoc on the natural streams that drain into reservoirs. Between the two forces of human development (urbanization and agriculture), there is the potential for ecological destruction and irreversible deterioration of raw water quality. To understand the impacts of land use changes in the three watersheds, the study reviewed the changes in agriculture, development, runoff and urbanization patterns over the past 40 years.
(a) Loch Raven watershed land use
The 2014 Maryland Department of Environment’s (MDE) Biological Stressor Identification (BSID) report [18] revealed that the likely causes and sources of the biological impairments affecting ecosystems found within the Loch Raven watershed stem from anthropogenic development. The northwestern region of the watershed, which overlaps the Pennsylvania state line, is largely agriculture and meadowlands, while portions with heavy forestation mainly encircle the reservoir with clusters throughout the watershed. Focused urban development areas lie within the southern part. Figure 10 depicts the land use distribution in the watershed [18]. Being part of the aquatic system supporting Baltimore City and surrounding jurisdictions, the water supply intakes in Loch Raven Reservoir feed into Baltimore City’s Montebello Water Treatment Plant.
(b) Prettyboy watershed land use
A published review on Maryland’s 1996 Total Maximum Daily Load (TMDL) list showed that Loch Raven Reservoir and Prettyboy Reservoir were impaired by nutrients, sediments and metals [18]. Impairment listings of bacteria (Prettyboy), mercury in fish tissue, and impacts to biological communities were added in 2002. While the TMDLs to address mercury and the water quality analysis were completed for both reservoirs in 2002 and 2003, respectively, the remaining impairments within these watersheds were scheduled to be addressed at a future date. The 2007 TMDL Decision Rationale also addressed excessive eutrophication in Prettyboy and Loch Raven Reservoirs. “In conjunction with excessive nutrients, Loch Raven Reservoir has experienced excessive sediment loads, resulting in a shortened projected lifespan of the reservoir.” [19]. Figure 11 depicts the land use distribution in the Prettyboy watershed.
(c) Liberty watershed land use
During a statewide assessment of water quality, the Liberty Reservoir watershed was also identified on Maryland’s 1996 Total Maximum Daily loads (TMDL) list [18] and included two high priority elements: chromium and lead, due to their potential adverse effect on human health. The Maryland Department of Natural Resources developed a series of landscape indicators, which are used to represent landscape conditions on a watershed scale that either support good water quality or degrade water quality. This grading scale is used to measure the impact land use has on the quality of water and to allow comparisons between watersheds. It is widely accepted that effective watershed management that reduces nutrient and sediment inputs [19] to the receiving streams that feed to a surface water supply reservoir greatly improves the water quality within the reservoir. Figure 12 presents Liberty watershed land use distribution.

3.4. The Social Dimension

Social factors, including awareness, behavior, level of income and education, were studied using existing data sources obtained from the county’s Department of Environmental protection [2,8]. This study has hypothesized that there are at least two concepts that hinder the public’s understanding of the impact many factors may have on their lives: Concept #1 (Personal Impact)—‘How does any of this affect me?’ and Concept #2 (Information Overload)—‘How do I know what information is valid?’ To help change the way people interact with their environment begins with education. People need to see how what they do in their everyday lives has a great impact on something as simple as their water supply. Individuals as well as organizations should be made aware of the impending degradation of the water supply and quality if current ideas and concepts are not reformed. Accuracy in the research and establishing community relationships could go a long way in raising the awareness of the ‘personal impact’ and breaking down the ‘information overload’.
In order to determine the social climate, this multilayered research delves into the social dimension of water quality by conducting survey (questionnaire included in the Supplementary Materials) on six high schools (two from each of the three watersheds) and selected residential homeowners. The data collected reveals an understanding on the residents’ perceptions about water quality in their neighborhoods, their involvement in environmental stewardship and their political views. Elements of the survey helped gauge the social climate of the neighborhoods (Baltimore City, Baltimore and Carroll Counties) and provided a baseline data for comparison to the findings of other surveys. Analysis on the socio-economic data provided a good insight into the social values of water and what appropriate intervention needs to be taken before water crisis becomes a reality.

3.5. The Policy Dimension

The first major U.S. law to address water pollution was the Federal Water Pollution Control Act of 1948 [19]. While there was growing public awareness and increasing concern for controlling water pollution, dozens of bills that were presented to Congress went unsigned. It was not until the third largest oil spill in the United States occurred in 1969 near Santa Barbara, California that the environmental movement gained momentum. In February 1969, the National Environmental Policy Act was introduced and was later signed by President Nixon in 1970 [18], which then gave rise to the Environmental Protection Agency (EPA).
The purpose of the Federal Water Pollution Control Act was for federal, state and local entities to collaborate on the preparation of programs, which would eliminate or mitigate the pollution of waterways, improvement of hygienic conditions of surface and groundwater and the implementation of additional standards for governing water quality. The original statute has been amended extensively throughout the years before emerging as the Clean Water Act (CWA) [19], widely recognized as the cornerstone of surface water quality protection in the United States. From the CWA, the Safe Drinking Water Act (SDWA) of 1974 was established to protect the drinking water quality and is the main federal law that ensures the quality of Americans' drinking water. Under SDWA, the EPA sets standards for drinking water quality and oversees the states, localities, and water suppliers who implement those standards.
The impact policy has on water quality can be demonstrated via the Safe Drinking Water Act as it can encourage environmental justice by increasing the safety of drinking water in disparate communities most at risk for water contamination. Many minority and socio-economically challenged communities are disproportionately impacted by hazardous drinking water conditions such as the most recent Flint, Michigan event [15]. Although the SDWA requires that all drinking water meet the health standards set by the EPA, violations occur regularly. The result of such water quality equity gaps leads to widespread disproportionate adverse health outcomes [19].
The need to enhance the security of the United States after the events of 11 September 2001 led Congress to pass the Public Health Security and Bioterrorism Preparedness and Response Act of 2002 (the Bioterrorism Act), which was signed into law by President Bush on 12 June 2002. The Bioterrorism Act has five categories but the one of interest in this research is Title IV, which addresses drinking water security and safety. This Act requires that drinking utilities serving approximately 3300 individuals assess their degree of vulnerability and develop an emergency preparedness plan.

4. Discussion

Environmental problems are complex and encompass various natural, economic and social dimensions [10]. As one critical component of the environmental problems, water quality issues are intricate to study as there are a number of factors that attribute to its impairment. These factors range from biophysical to sociopolitical issues. As such, there are limited research approaches that provide a comprehensive analysis and synthesis of these factors to layout a strategic and sustainable intervention. According to the National Socio-environmental Synthesis Center [6], “it is time that we dramatically broaden the community of scholars who tackle environmental problems by going well beyond the natural sciences and even beyond the social science fields that are now within the collaborative comfort zone of environmental scientists (e.g., economics). This means figuring out how to collaborate across disciplines that use very different methods from those that most natural scientists are accustomed to, including, for example, branches of psychology or sociology”.
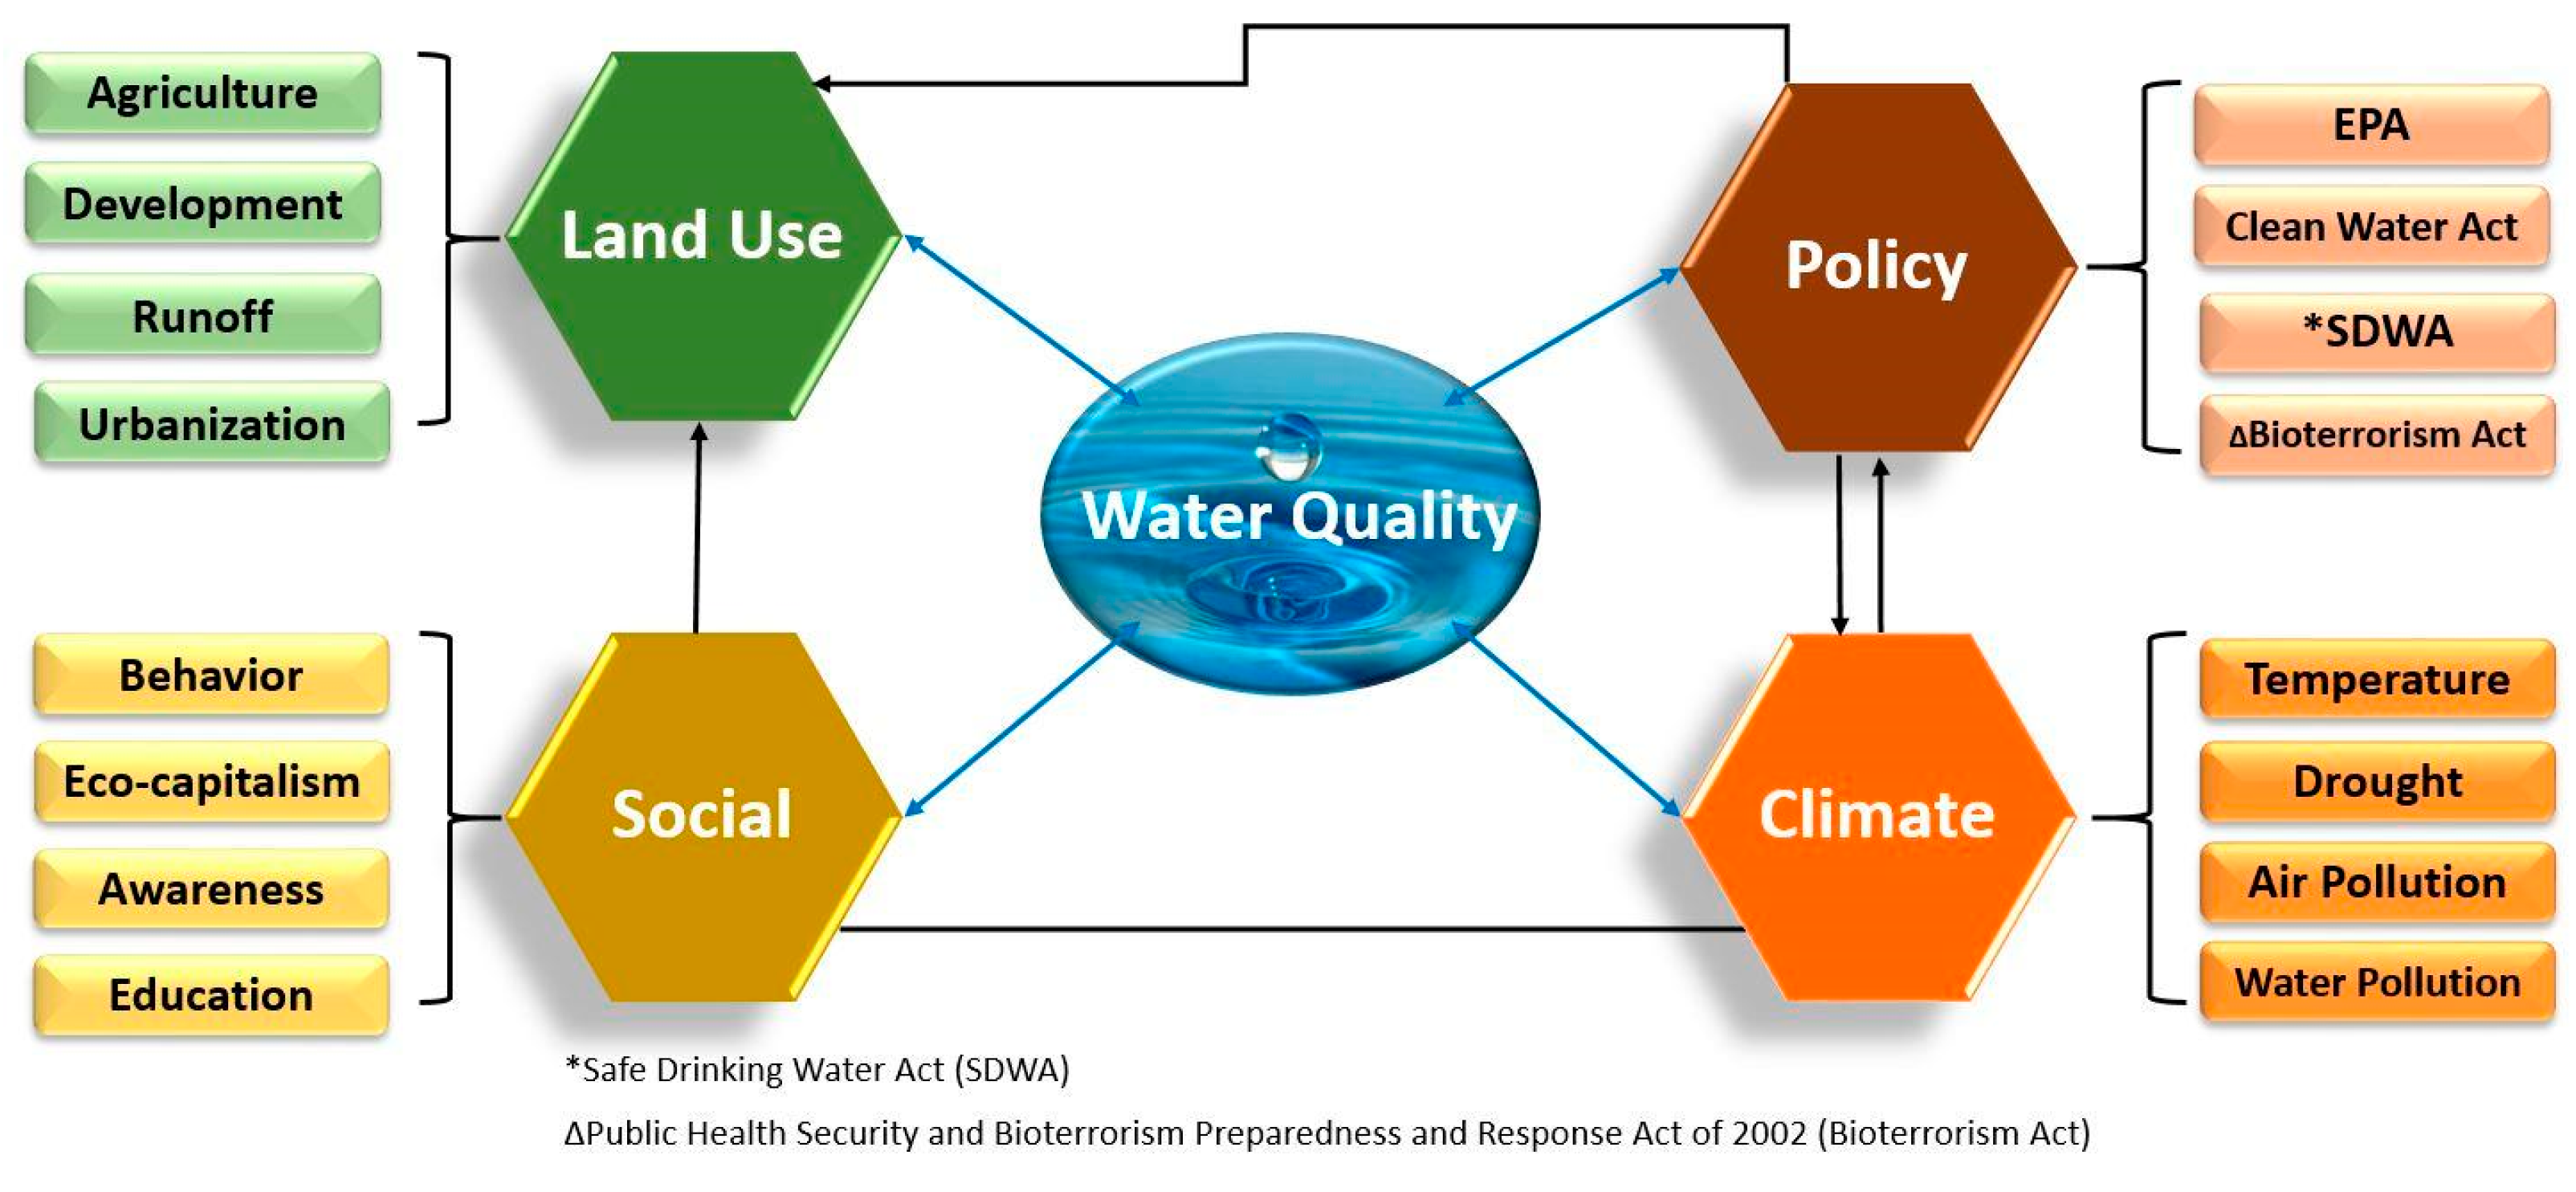
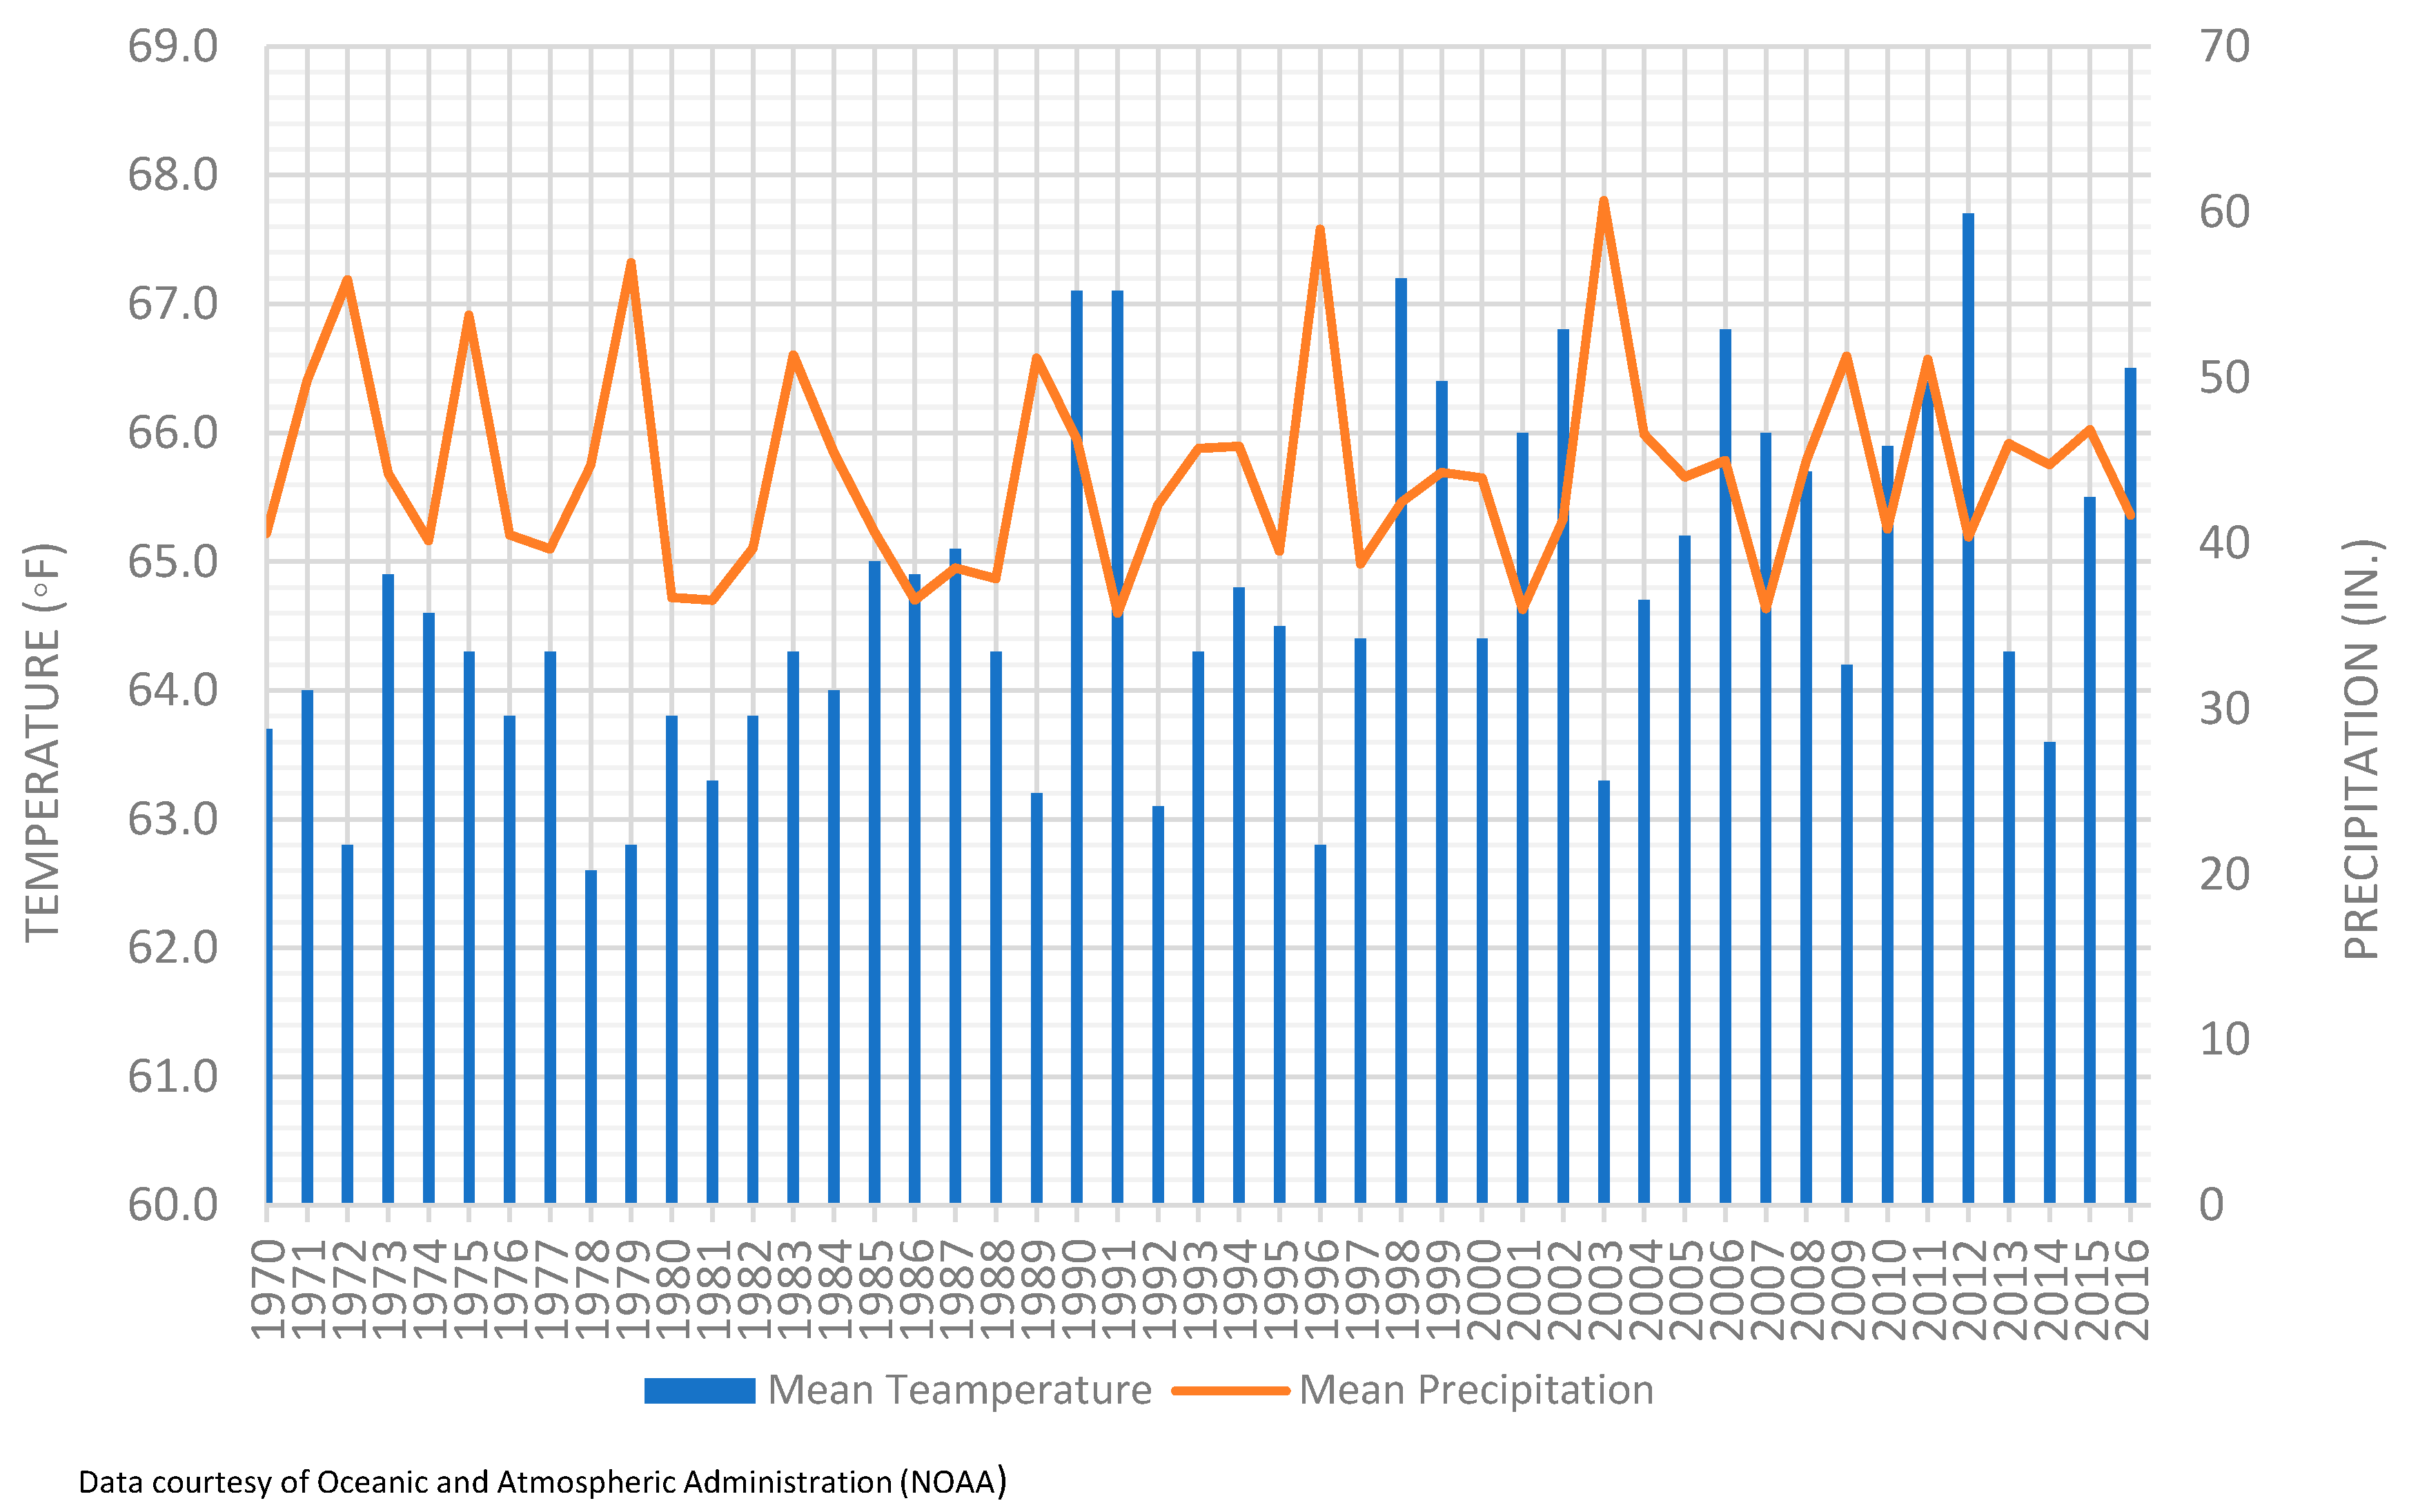
In this study, four essential components of water quality that are integrally related were identified and defined as “dimensions”. As can be seen from Figure 9, the mean temperature in the study area slightly increased over the last 45 years causing a possible impairment in the quality of water. A similar study on the effects of climate change on surface water quality [20] found out that “the combination of higher surface water and increased nutrient loading from agricultural runoff contributes to harmful algae blooms that produce bio-toxins”. Another study on the impacts of climate change on lakes in the Netherlands revealed, “climate change favors and stabilizes cyanobacterial dominance in phytoplankton communities and cause more serious incidents of botulism among waterfowl and enhance the spreading of mosquito borne diseases” [21].
Data from long-term ecosystem monitoring and research stations in North America and results of simulations made with interpretive models indicate that changes in climate (precipitation and temperature) can have a significant effect on the quality of surface waters. Changes in water quality during storms, snowmelt, and periods of elevated air temperature or drought can cause conditions that exceed thresholds of ecosystem tolerance and, thus, lead to water-quality degradation [22].
It has been widely accepted that there is a close relationship between land use type and water quality. A study conducted on “urbanization, land use, and water quality in Shanghai: 1947–1996” [21] revealed that rapid urbanization corresponds with rapid degradation of water quality. It also indicates that urban land uses are positively correlated with the decline in water quality. A regression model shows that close to 94% of the variability in water quality classifications is explained by industrial land area.
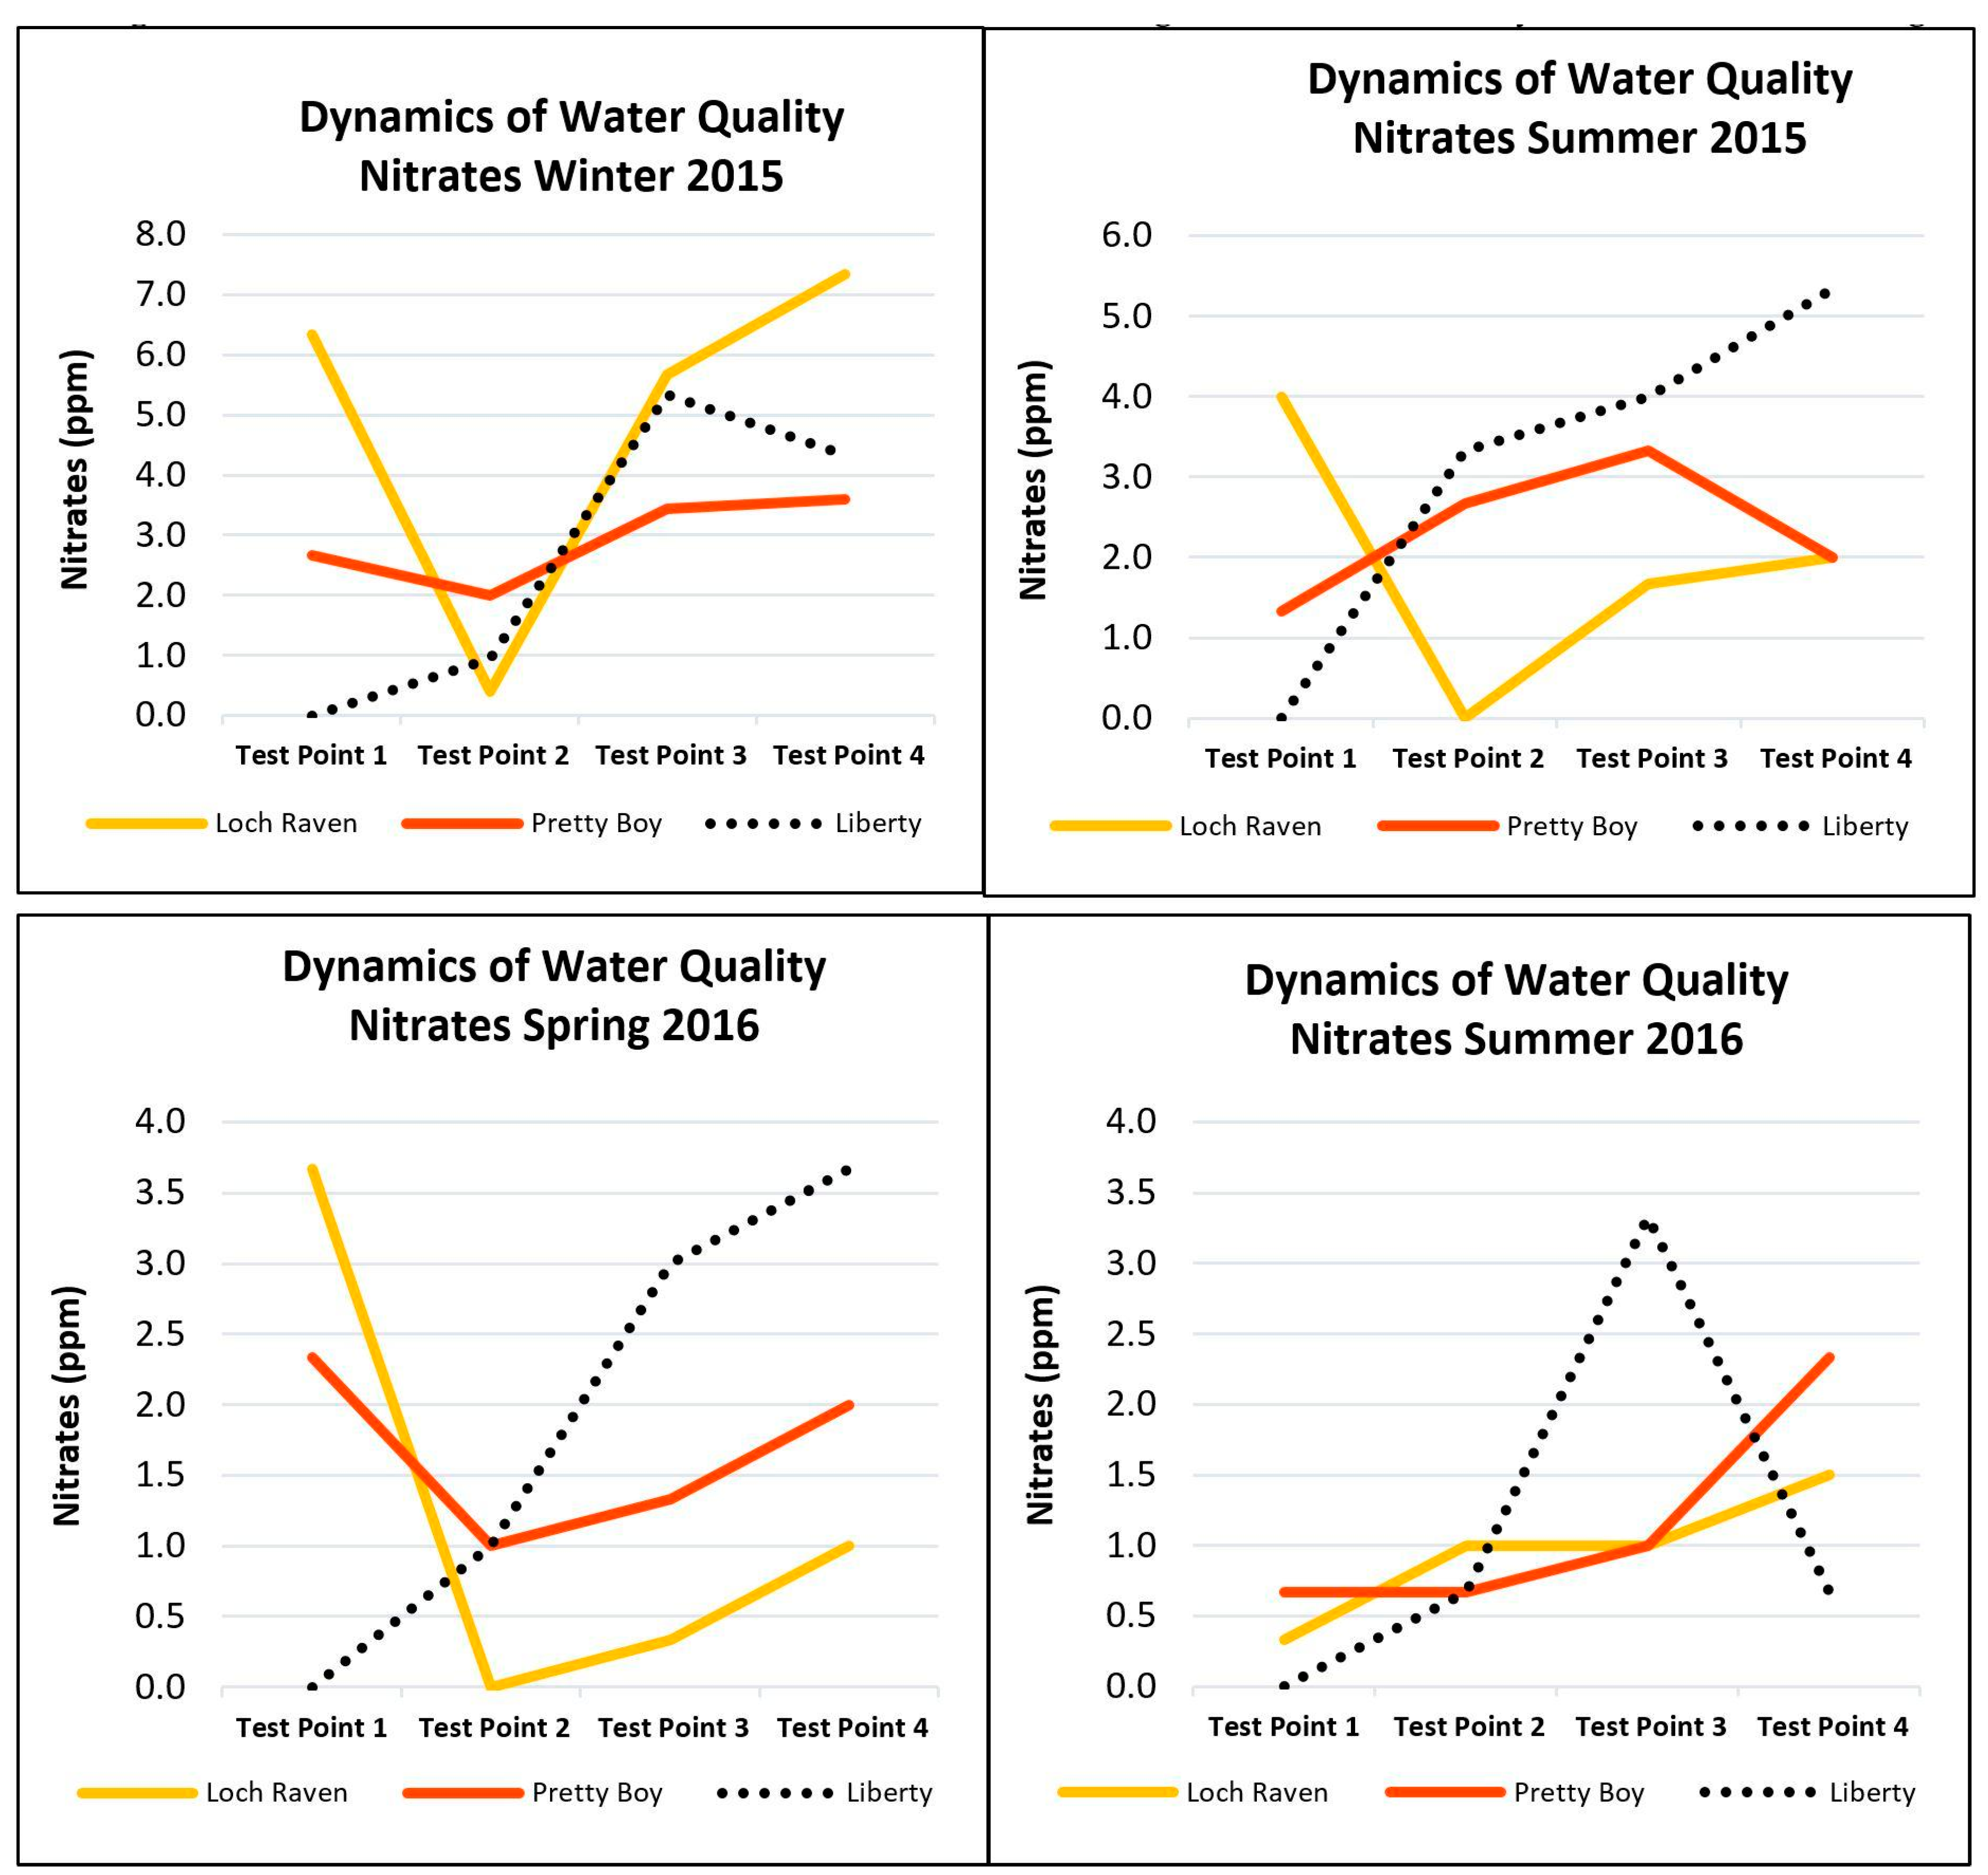
Four water quality indicators were used in the study (nitrate, alkalinity, percent oxygen saturation and carbon dioxide) to assess the seasonal changes in water quality in the three watersheds. Comparison based on mean average revealed that the nitrate levels in all three watersheds is below the maximum EPA allowed contaminant threshold (10 mg/L). Water quality monitoring in Pennsylvania showed that nitrate is present throughout much of the state at relatively low concentrations, but in areas of intense farming, the nitrate-nitrogen concentration may approach or exceed the World Health Organization (WHO) drinking water limit of 10 mg/L [23]. In addition, there are isolated cases where the concentration of nitrate-nitrogen down-gradient of large volume on-site wastewater disposal sites, septic/solids disposal, and landfills may exceed the drinking water limit. Nitrate contamination studies in Austria [24] showed higher average temperatures result to lower nitrate contamination, possibly due to increased evapotranspiration. Higher average precipitation rates dilute nitrates in the soil, further reducing nitrate concentration.
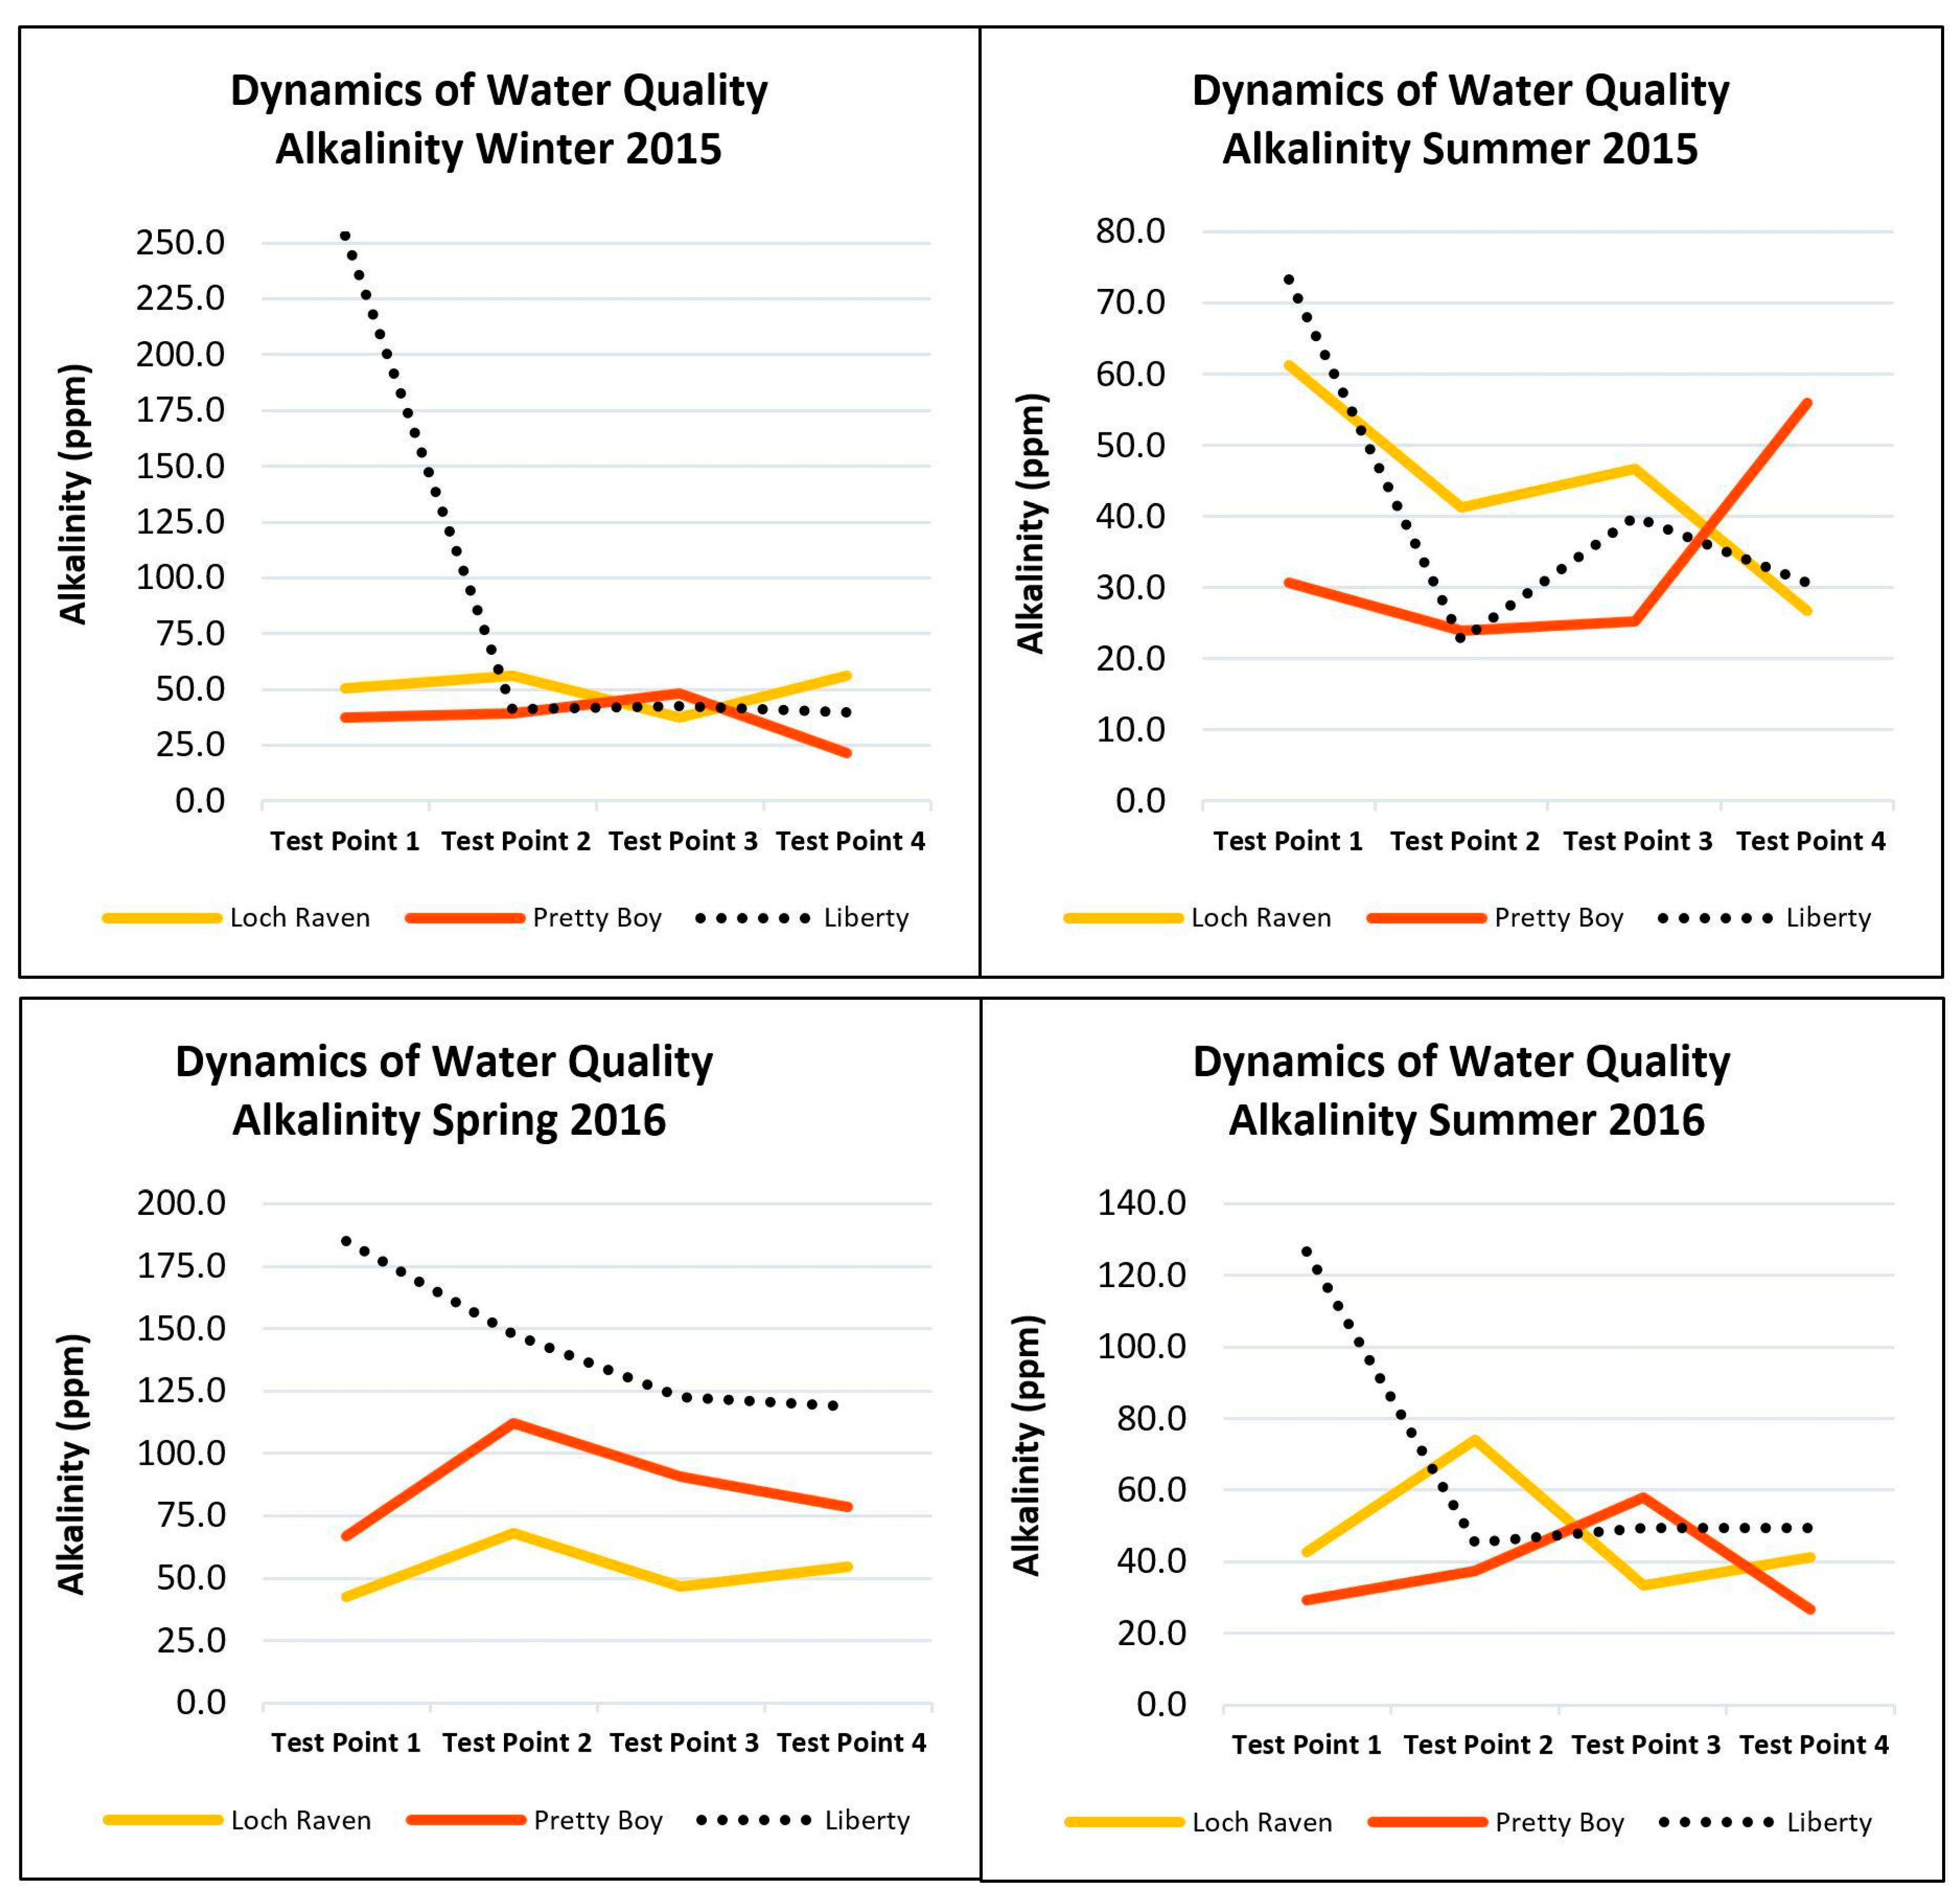
Alkalinity monitoring in the study area revealed measurements within the optimum alkalinity levels ranging between 20 and 63 ppm except Liberty (test point 1), which consistently showed very high values (73 ppm, 126.7 ppm and 253 ppm) during the three seasons (winter, summer and spring). This test point is located alongside a construction area where some effluents may enter into the streams. Mean average comparison of alkalinity levels across seasons shows highest concentration (94 ppm) during winter in 2015 at the Liberty watershed and the lowest levels (33 ppm) at Prettyboy during summer. In 2016, the highest was during spring at Liberty (68 ppm), with the lowest levels (34 ppm) at Prettyboy during winter. Alkalinity level monitoring in Pennsylvania found 20 ppm to be the minimum level to protect aquatic life [25]. Another study in Massachusetts determined the desirable alkalinity range for irrigation water to be 0 to 100 ppm calcium carbonate. Levels between 30 and 60 ppm are considered optimum for most plants [26].
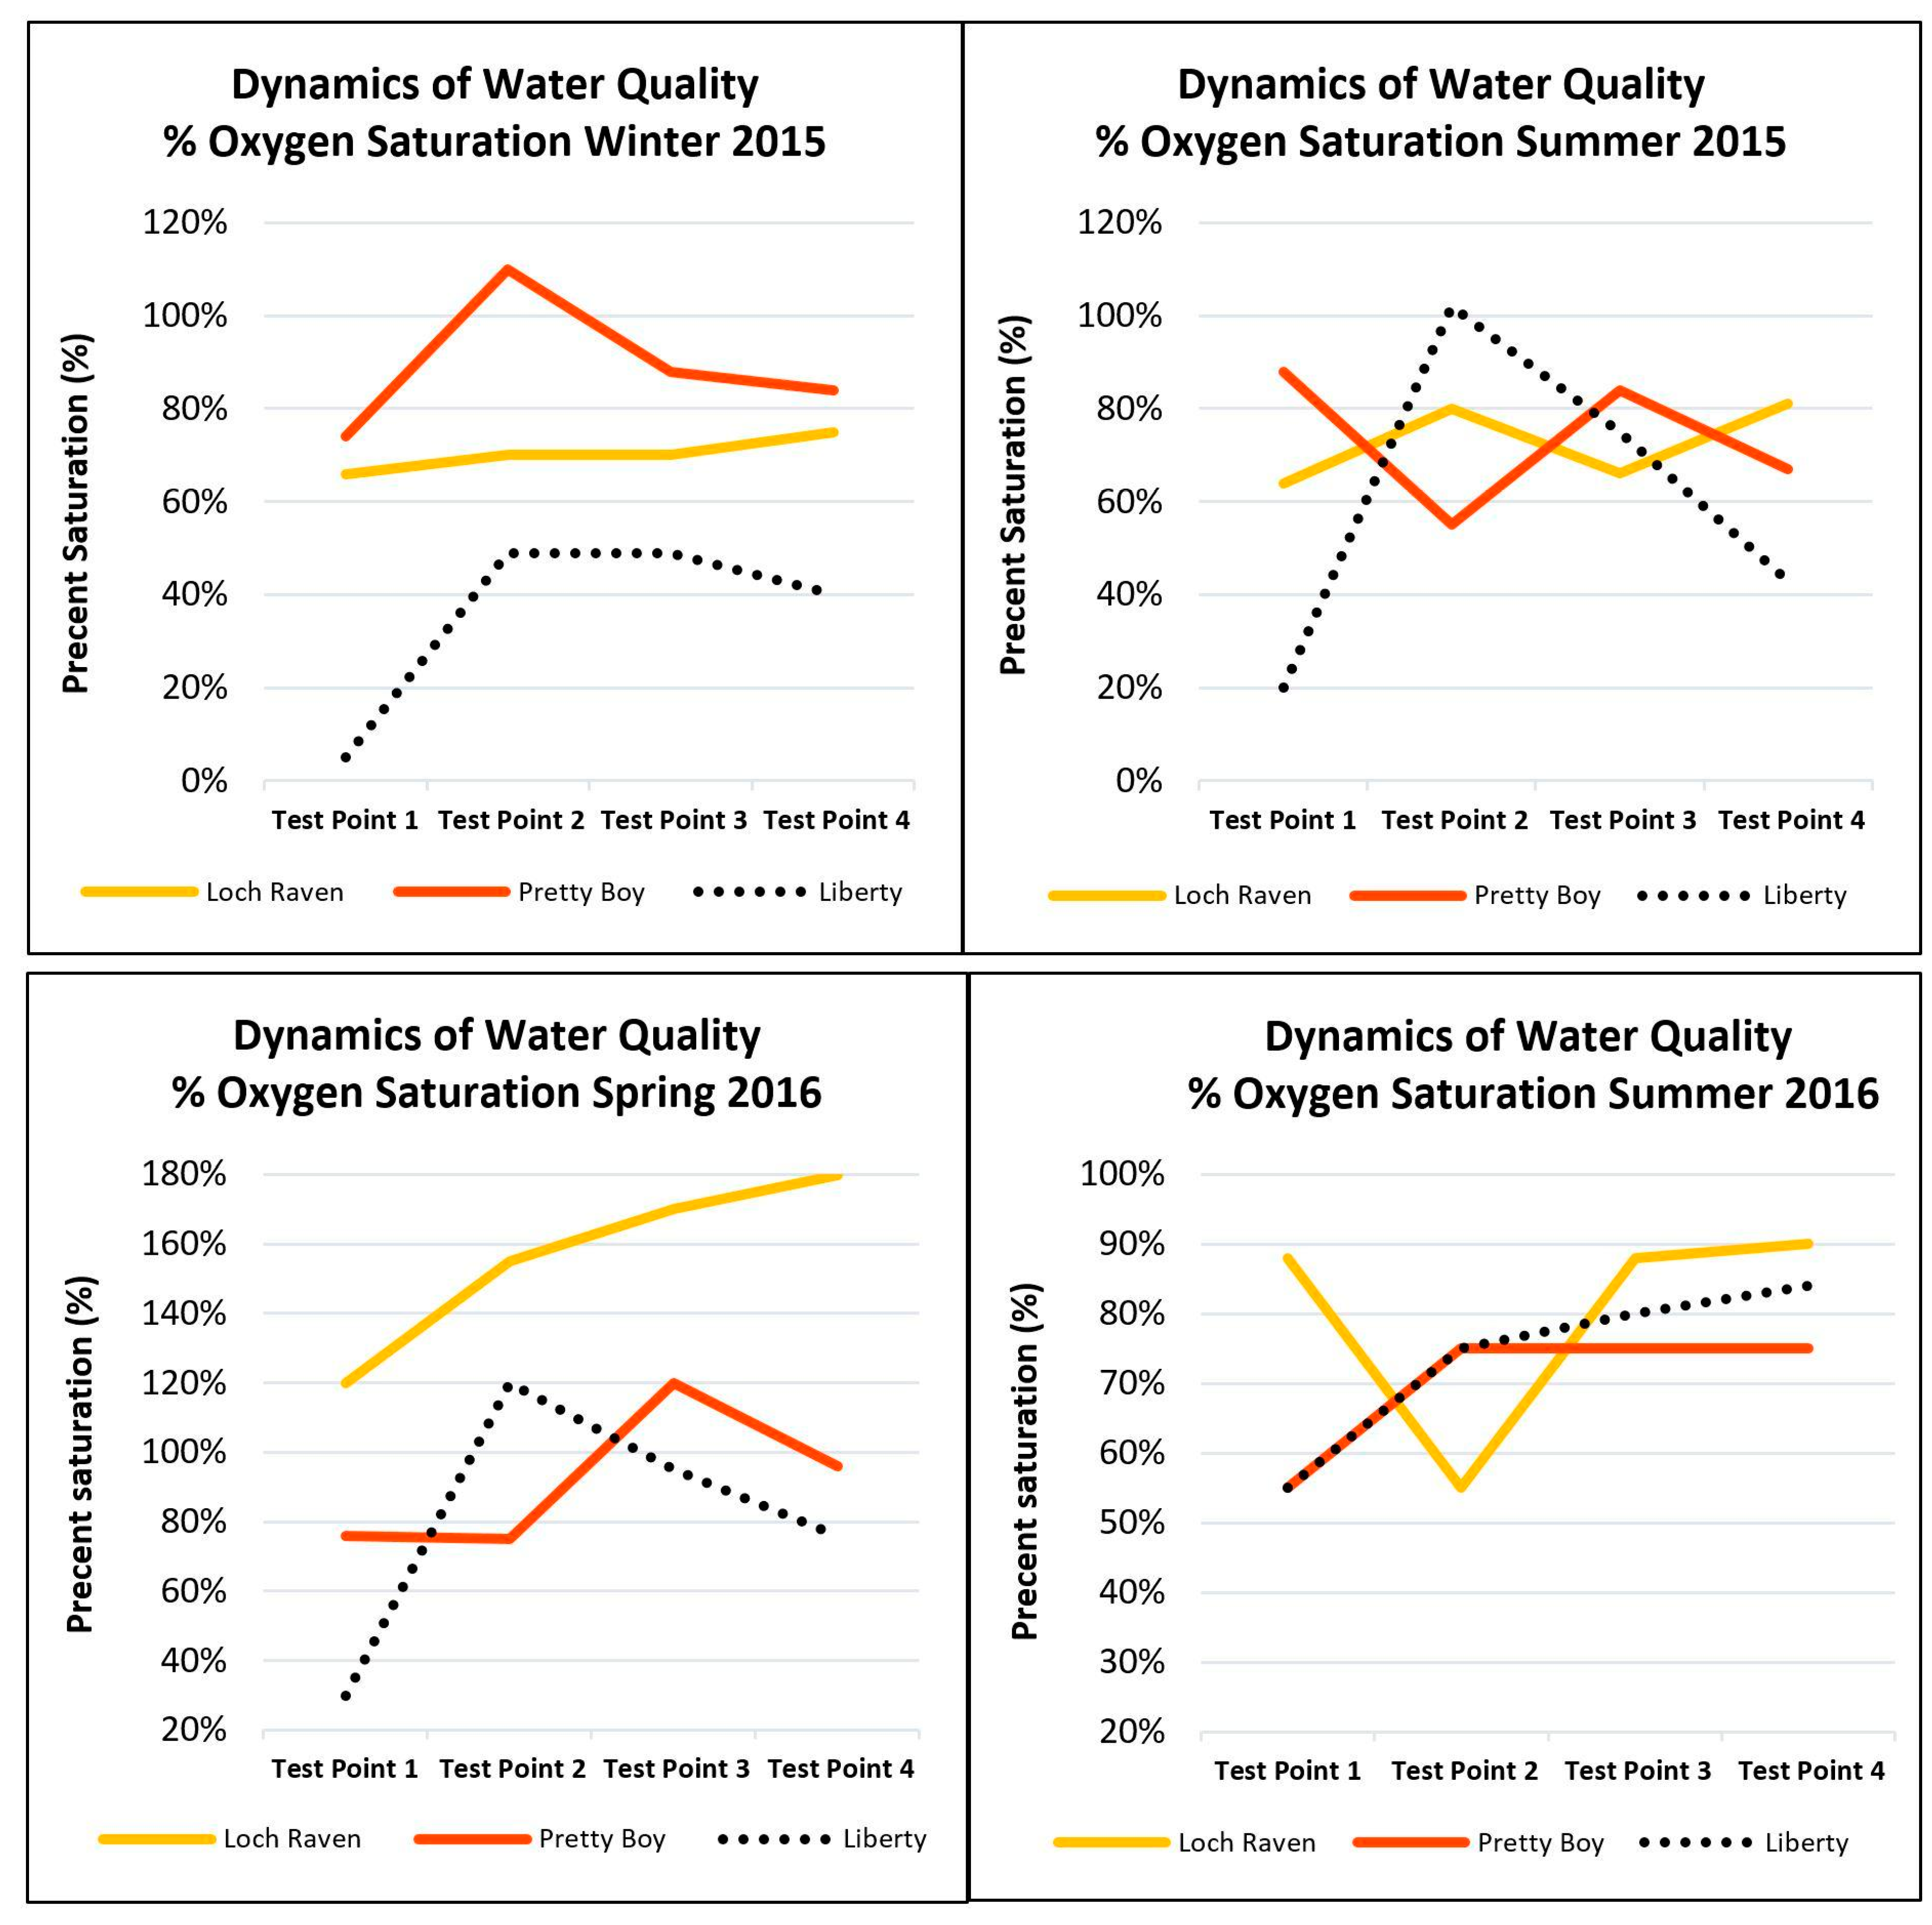
In order to study the biological activity in the watersheds, Biological Oxygen Demand (BOD) was monitored. BOD is a measure of the oxygen used by microorganisms to decompose waste. The results showed a mean average comparison of oxygen saturation levels across seasons shows the highest percentage (73%) during winter 2015 at the Prettyboy watershed, with the lowest (36%) at Liberty during winter. In 2016, the highest was during spring at Lock Raven (134%), with the lowest (70%) at Prettyboy during the summer. The Cary Institute’s modified water quality index was used to classify the BOD measured data and concluded that percentage values below 60% are considered poor quality, 60–79% acceptable for most stream animals, 80–125% excellent for most stream animals and 125% or more too high for any stream animal.
A similar study in India concluded, “Environmental impact of total dissolved solids gas concentration in water should not exceed 110% (above 13–14 mg/L). Concentration above this level can be harmful to aquatic life. Fish in waters containing excessive dissolved gases may suffer from “gas bubble disease” [16]. Another study [15] in Korea used a threshold of 33.4% (4 mg/L) as a minimum BOD value to determine the suitability of their study sites. This shows the threshold values generally vary depending on the specific sites.
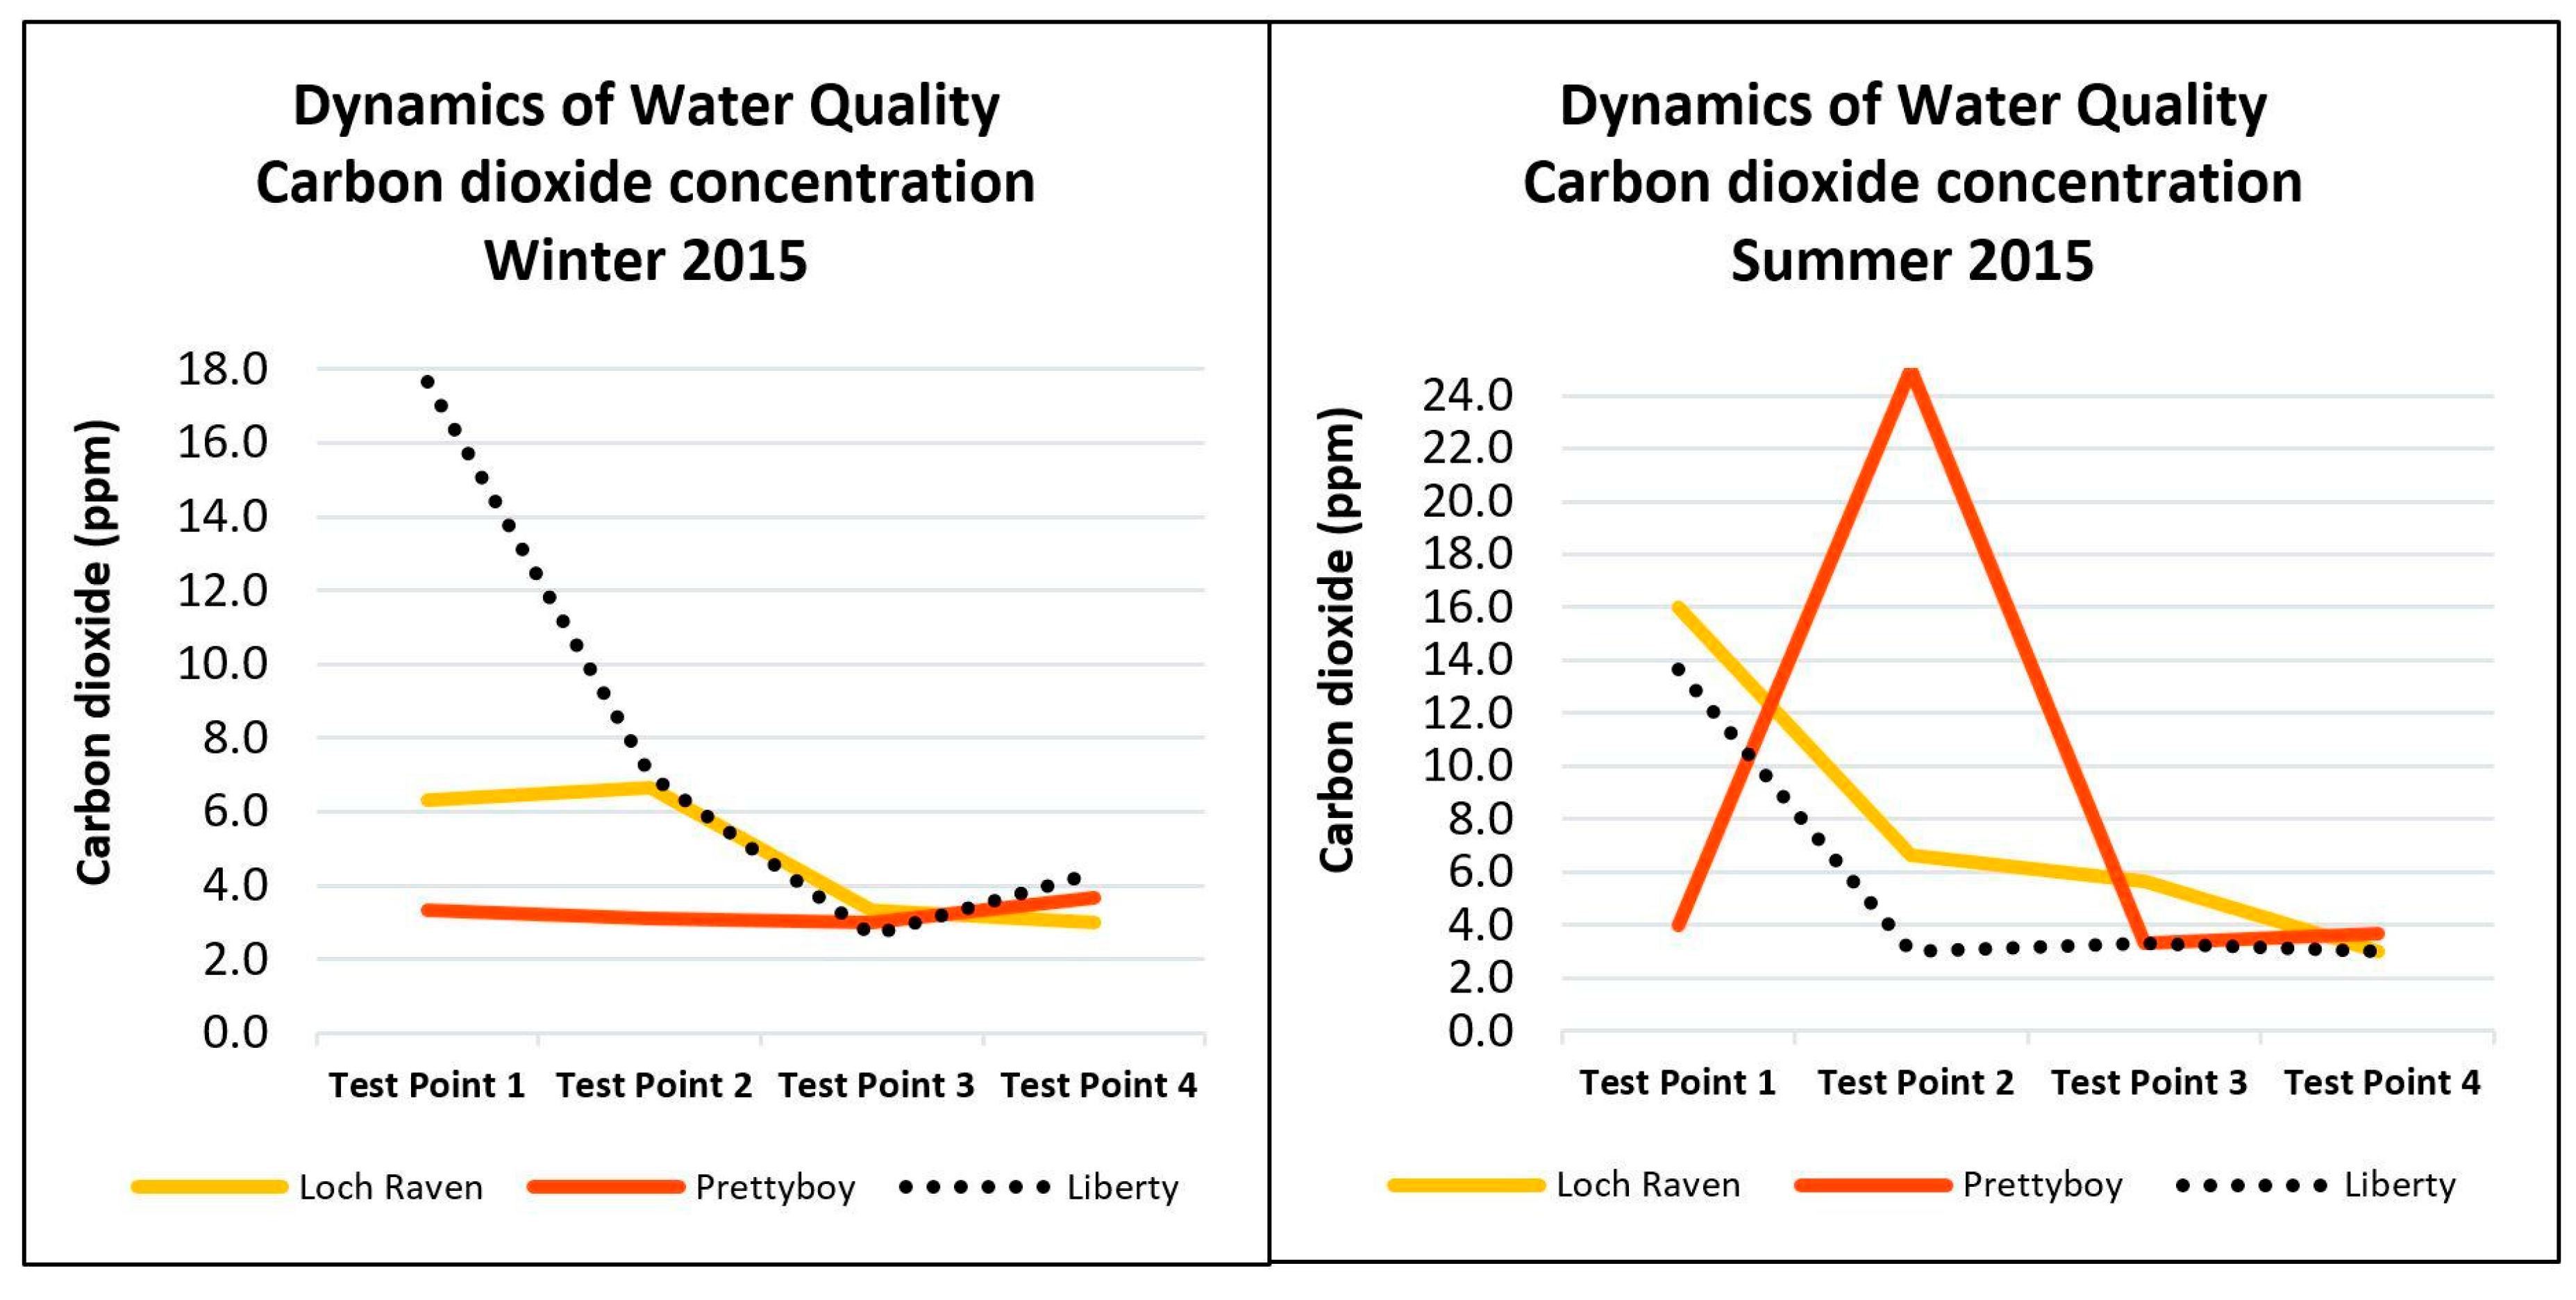
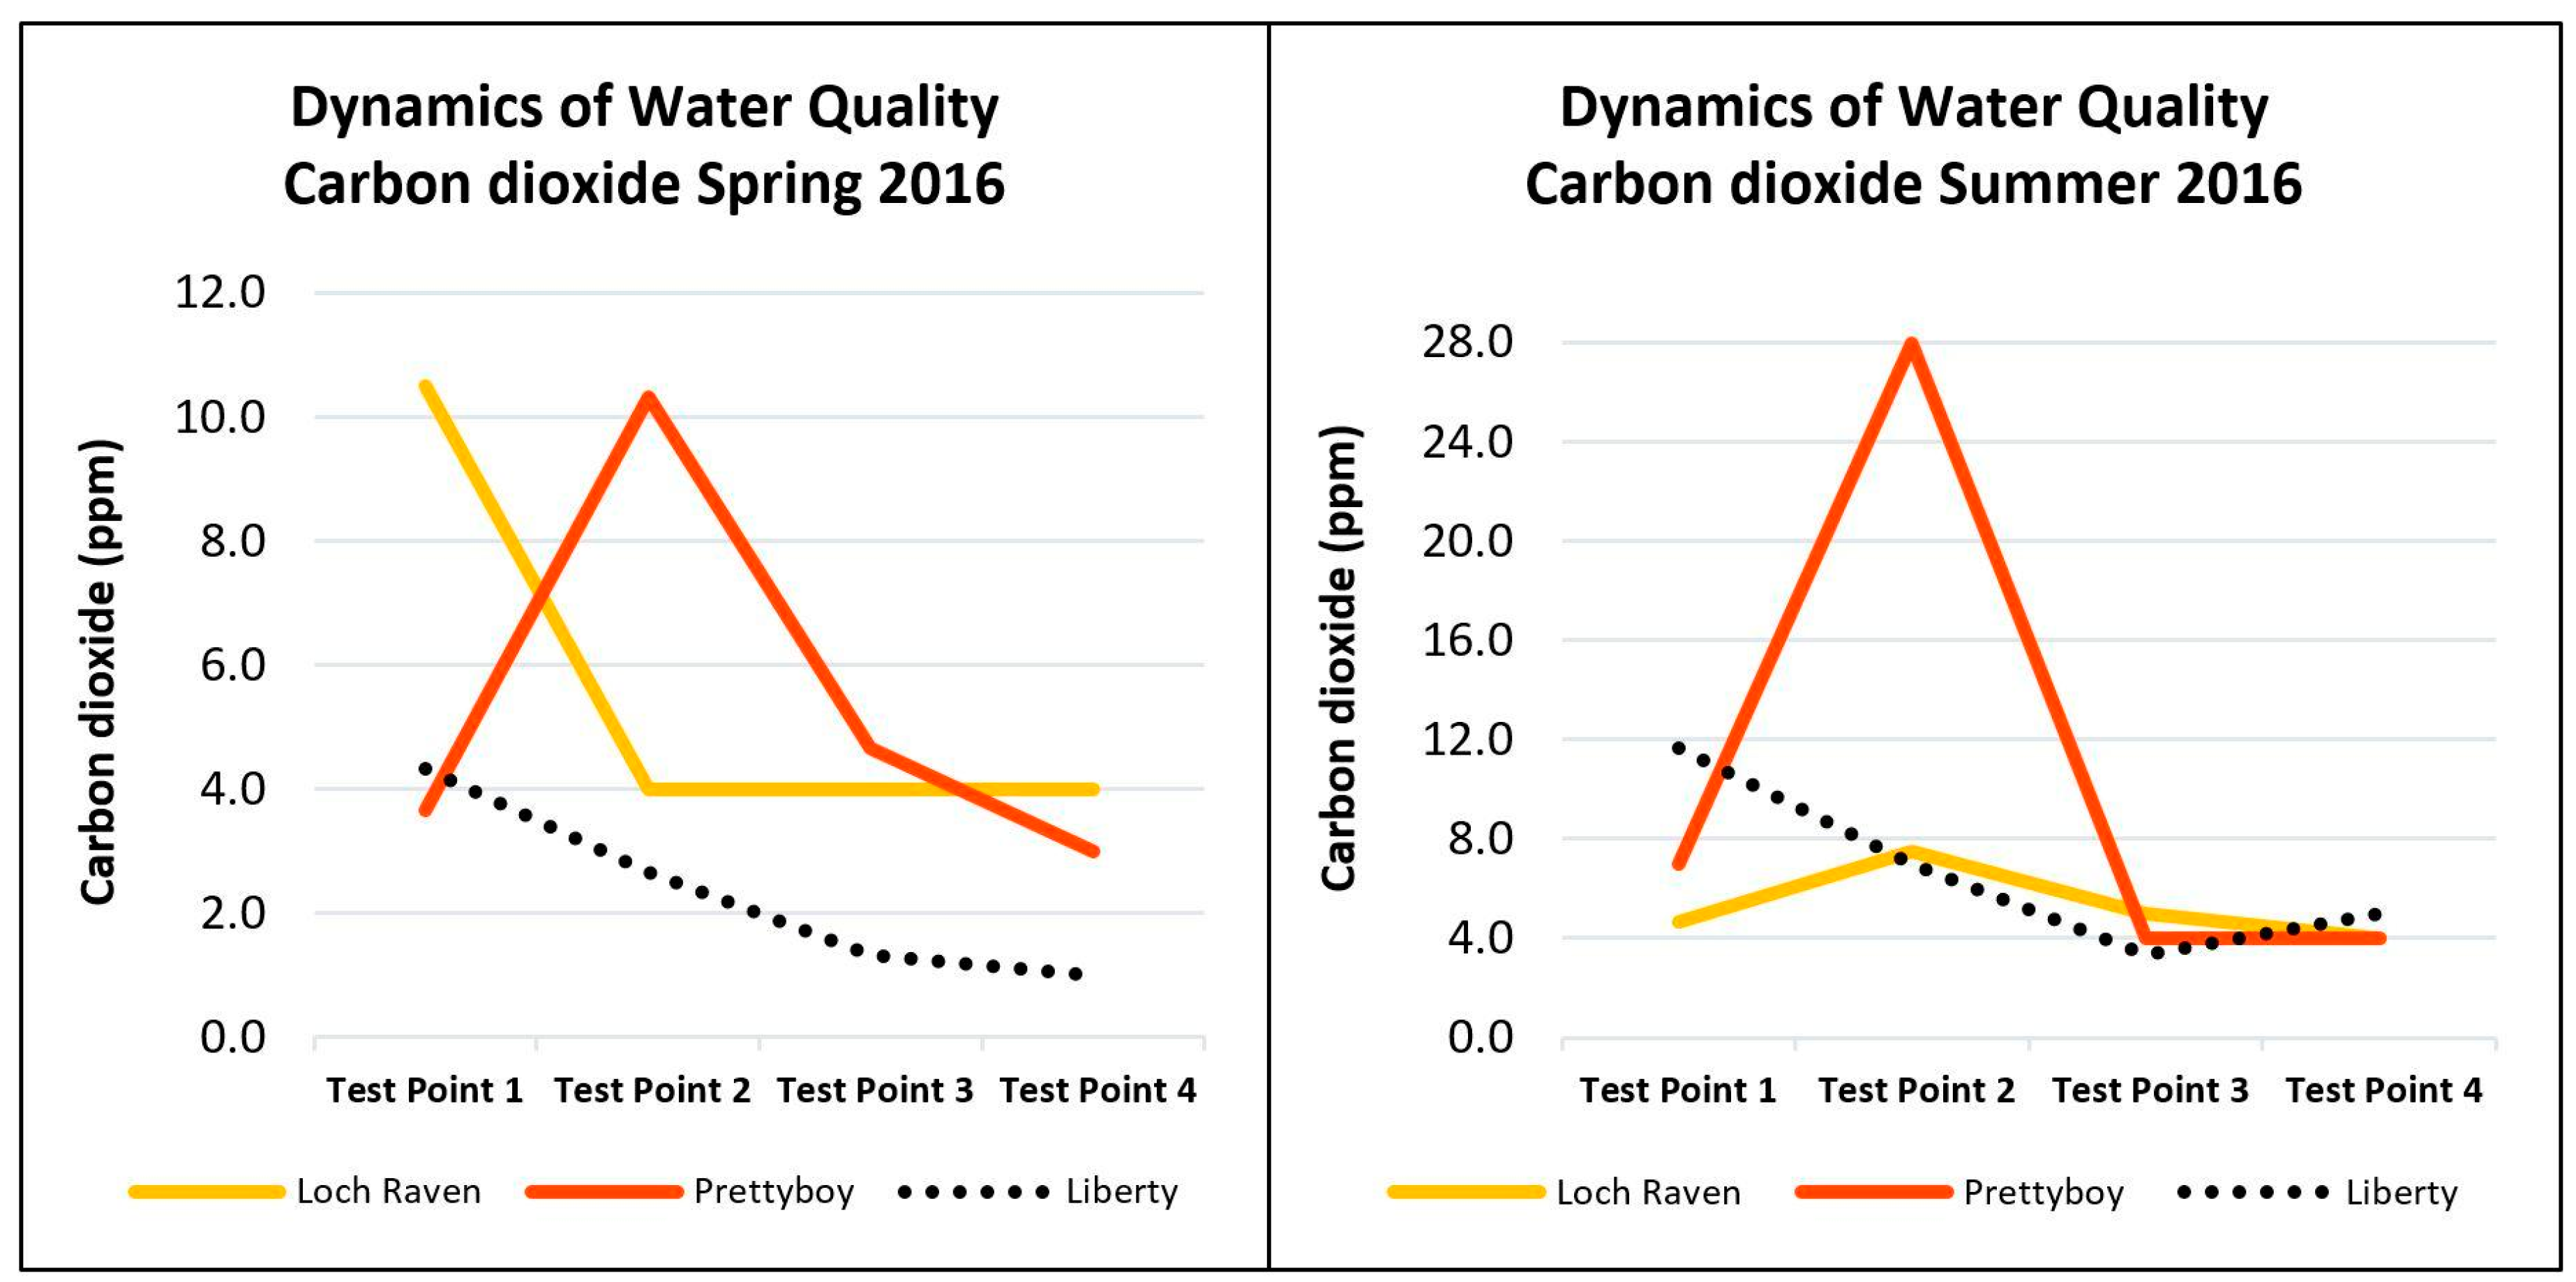
Carbon dioxide was monitored over different seasons within the study area. Mean average comparison of the carbon dioxide levels across seasons shows the highest percentage during summer 2015 at the Prettyboy watershed (8.9 ppm), with the lowest at Prettyboy (3.2 ppm) during winter of the same year. In 2016, the highest level was recorded during the summer at Prettyboy (10.8 ppm) and the lowest carbon dioxide level was recorded (2.2 ppm) at Liberty during spring. According to EPA guidelines, surface waters contain less than 10 ppm free carbon dioxide while ground waters may have much higher concentrations. All test points in the study sites are within or close to this limit, ensuring good quality for aquatic life.

5. Conclusions

This paper demonstrated how the Socio-Environmental Synthesis (SES) approach is used as a method to understand holistic causes of water quality deterioration. SES integrates existing knowledge and data from natural and social sciences to advance understanding of complex socio-environmental systems [4]. The SES approach explored the underlying socio-environmental and bio-physical causes of water quality deterioration in three Baltimore watersheds that supply drinking water for the residents of Baltimore City. As a result, four important dimensions of water quality were identified: land use, climate, social behavior and governmental policies and studied how these dimensions contribute to a deterioration in water quality.
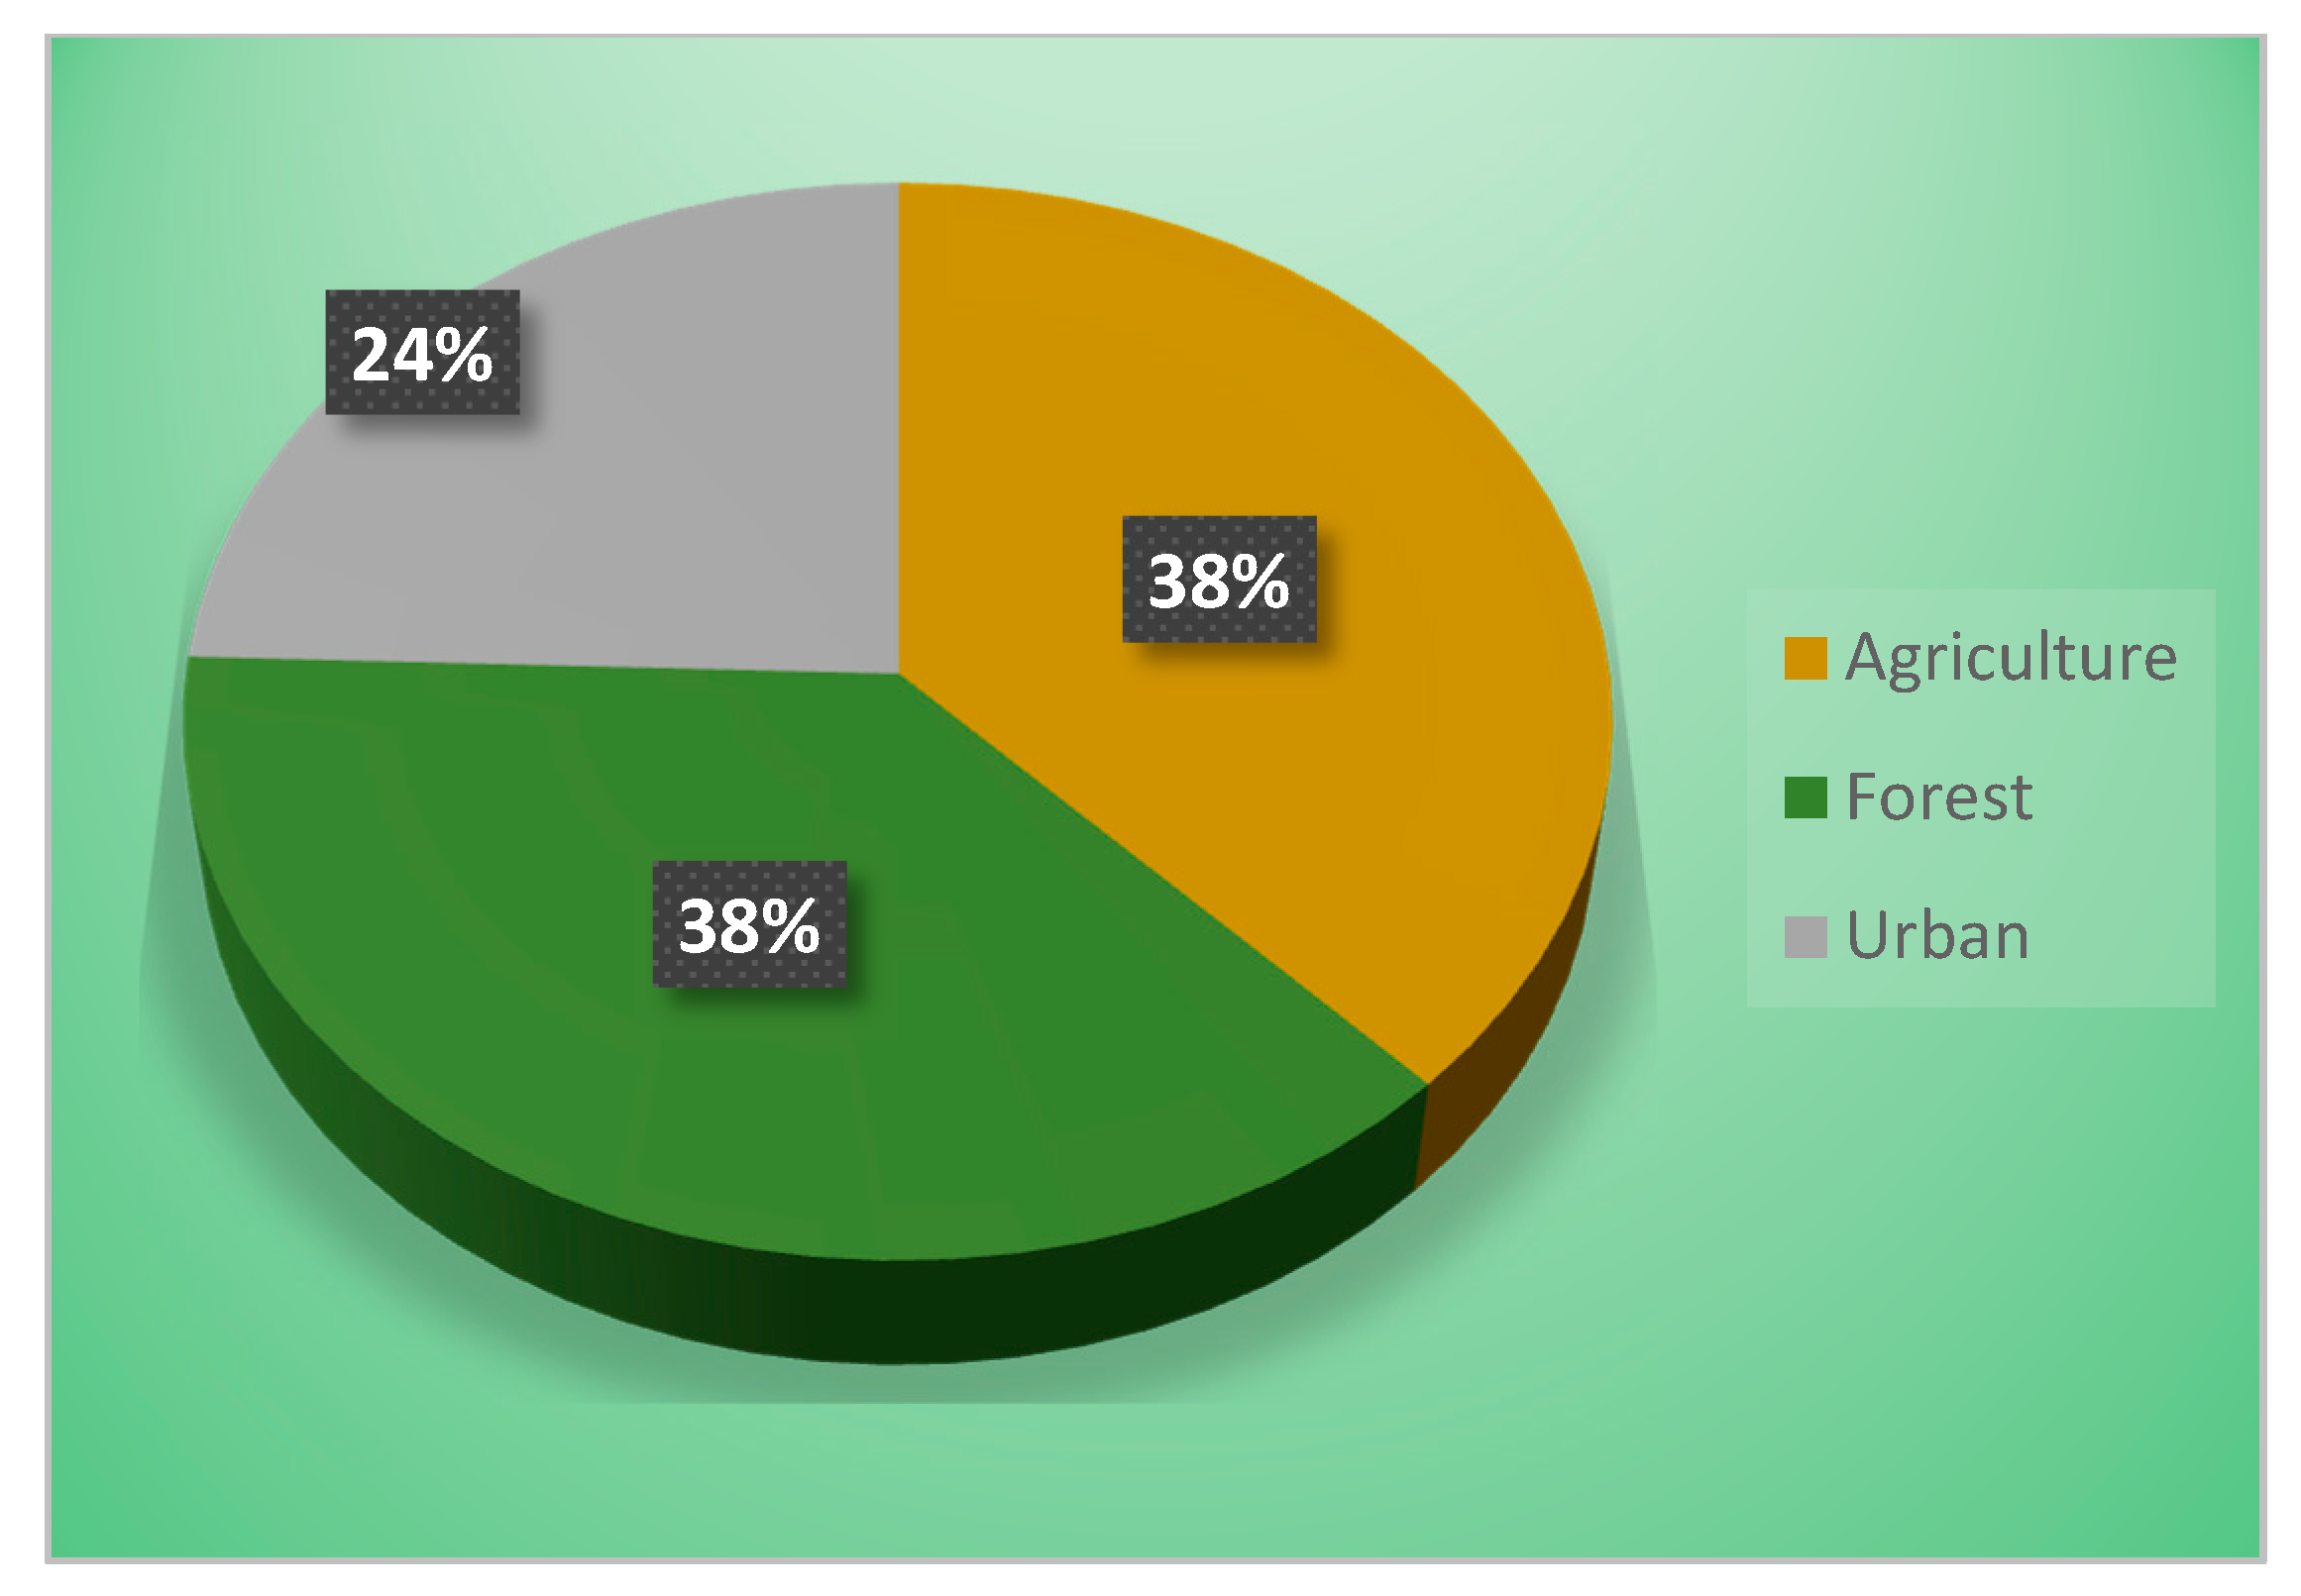
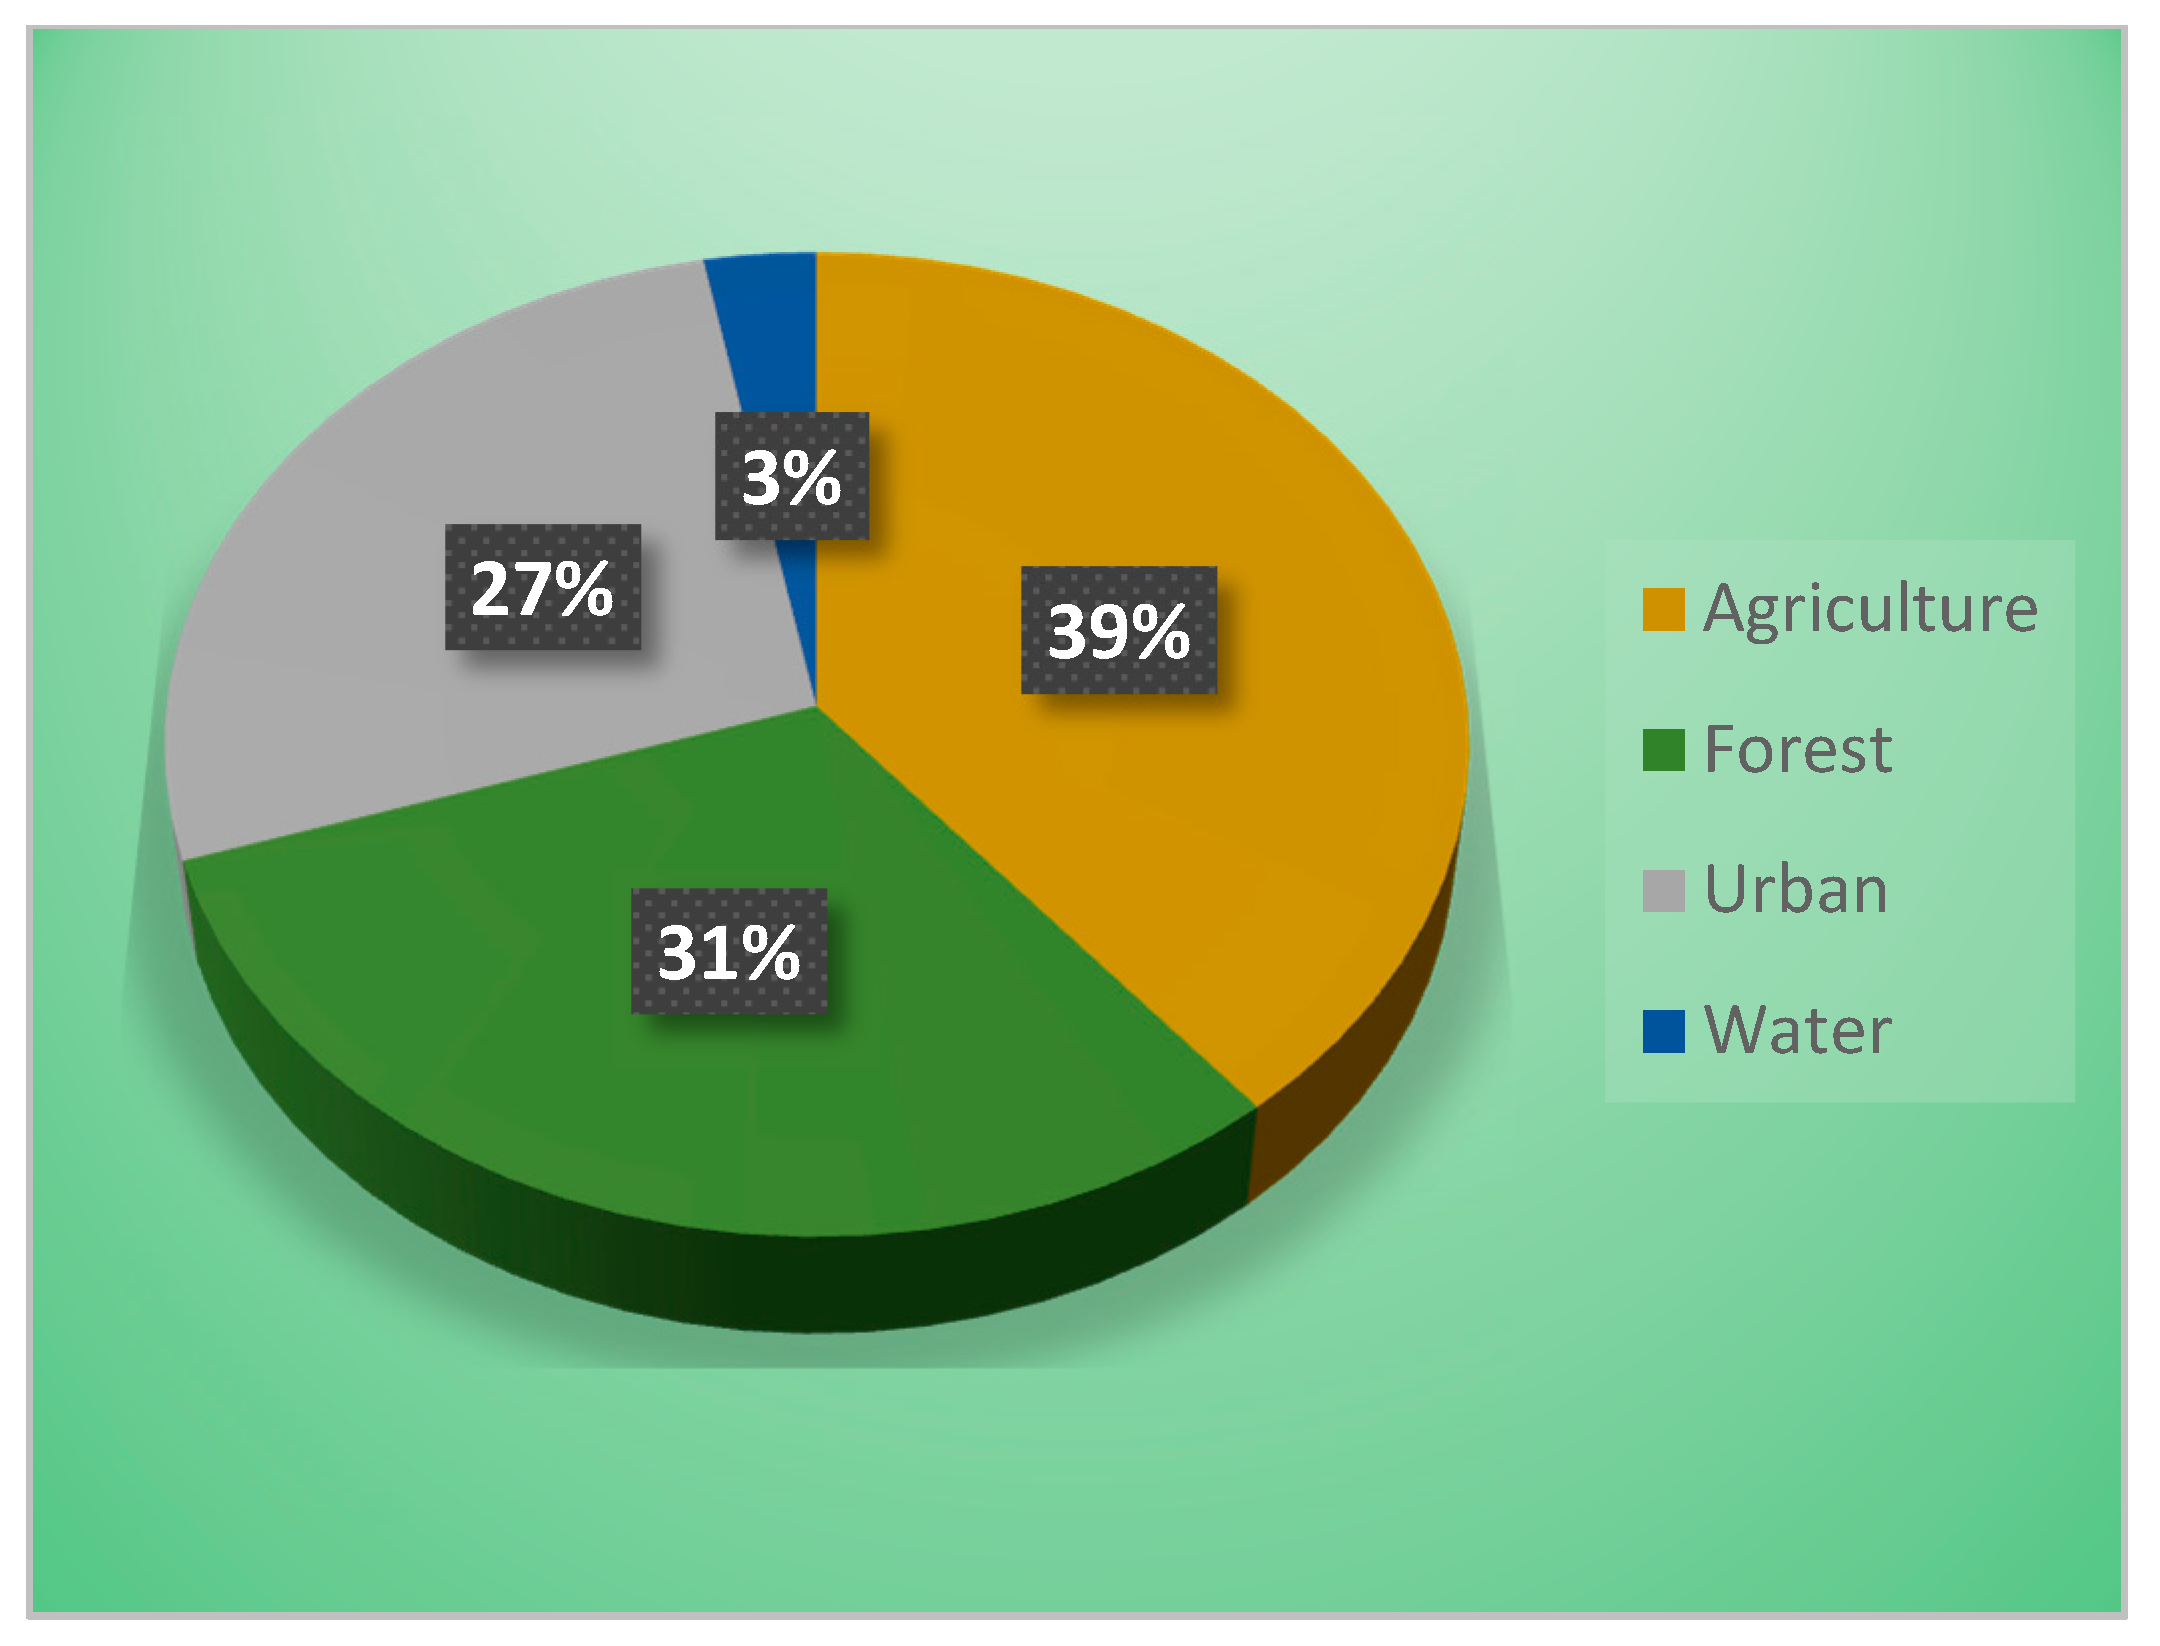
The report also found that urbanization and agriculture have been the two major threats to watershed health. The loss of vegetation due to urbanization and agriculture decreases the effectiveness of the natural filtration system, resulting in the degradation of raw water quality. In addition to natural waterway contamination, runoff from urban and agricultural settlements, concrete drains, muddy and polluted water also contribute to decreased overall water quality [2]. Changes in the land cover and land management practices have been regarded as the key influencing factors behind the alteration of the hydrological systems, which eventually lead to changes in water quality [8,10]. To understand the long-term impacts of land use changes, previous water quality study reports (Baltimore water quality monitoring report, 1981–2007) were used and did seasonal testing on select water quality characteristics in the three watersheds. Nitrate-nitrogen, BOD, alkalinity and carbon dioxide concentration were monitored over different seasons during 2015–2016 and comparisons between seasons and amongst study sites using mean averages were conducted.
The study revealed that, while the quality of the drinking water meets or exceeds EPA standards, there is a growing concern in the quality of water in the watersheds. The high levels of nitrate-nitrogen and increased concentrations of carbon dioxide are especially alarming. The high level of BOD is a good indicator of the intensity of agricultural and urbanization increase over time. A study by Ouyanga et al. has shown that human impacts from urbanization include forest cover loss, an increase in impervious surfaces, and an increase in storm run-off [16].
Climate change and increasing population pressure places an imminent threat to water quality and protecting watersheds would significantly reduce the cost of water treatment. Analysis of 20 years of temperature and precipitation data has shown that there is a correlation between increased temperature and higher levels of BOD and carbon dioxide concentration. Watershed degradation has influenced the cost of water treatment in about one-third of large cities globally, increasing those costs by about half [25]. This increase in water treatment costs borne by local taxpayers has had a real quantitative cost to hundreds of millions of urbanites. In summary, watershed conservation and restoration should be an important priority to safeguard urban water supplies.

Supplementary Materials

Supplementary materials are available online.

Acknowledgments

We acknowledge the financial support received from the National Socio-Environmental Synthesis Center (SESYNC) to undertake this study. Costs to publish this article will be covered by the grant received from SESYNC. Additionally, we would like to recognize the efforts of our interns and lab/field assistants: Deneen Gordon, Deanah Thomas, Astrid Bharath, Nikia Brown, Miracle Okoro, Brije Smith, Aisha Ward, Carentxa Goede and Alan Drew.

Author Contributions

Mintesinot Jiru conceived the study; Janette North, Tatiana Roth and Mintesinot Jiru performed the experiment and all three authors analyzed the results and wrote the paper.

Conflicts of Interest

The authors declare no conflict of interest. The funding sponsors had no role in the design of the study; in the collection, analyses, or interpretation of data; in the writing of the manuscript, and in the decision to publish the results.

References

  1. Delpla, A.V.; Jung, E.; Baures, M.; Clement, O.T. Impacts of climate change on surface water quality in relation to drinking water production. J. Environ. Int. 2009, 35, 1225–1233. [Google Scholar] [CrossRef] [PubMed]
  2. Koterba, M.T.; Waldron, M.C.; Kraus, T.E.C. The Water-Quality Monitoring Program for the Baltimore Reservoir System, 1981–2007—Description, Review and Evaluation, and Framework Integration for Enhanced Monitoring; U.S. Geological Survey Scientific Investigations Report 2011–5101; U.S. Geological Survey: Reston, VA, USA, 2011.
  3. Tambe, P.V.; Dawani, P.G.; Mistry, N.F.; Gadge, A.A.; Antia, N.H. A Community-based Bacteriological Study of Quality of Drinking-water and Its Feedback to a Rural Community in Western Maharashtra, India. J. Health Popul. Nutr. 2008, 26, 125–138. [Google Scholar]
  4. Cutler, D.; Miller, G. The role of public health improvements in health advances: The twentieth-century United States. Demography 2005, 42, 1–22. [Google Scholar] [CrossRef] [PubMed]
  5. Baltimore City Water Quality Report. Available online: http://cityservices.baltimorecity.gov/dpw/waterwastewater02/waterquality4.html (accessed on 20 November 2016).
  6. Palmer, M.A. Socioenvironmental sustainability and actionable science. Bioscience 2012, 62, 5–6. [Google Scholar] [CrossRef]
  7. Pickett, S.T.A.; Belt, K.T.; Galvin, M.F.; Groffman, P.M.; Grove, J.M.; Outen, D.C.; Pouyat, R.V.; Stack, W.P.; Cadenasso, M.L. Watersheds in Baltimore, Maryland: Understanding and Application of Integrated Ecological and Social Processes. J. Contemp. Water Res. Educ. 2007, 136, 44–55. [Google Scholar] [CrossRef]
  8. Liberty Reservoir Watershed Characterization. Available online: https://studylib.net/doc/8288598/water-quality-testing-data-sheet (accessed on 4 September 2016).
  9. Baltimore County Department of Environmental Protection and Resource Management. Prettyboy Reservoir Watershed Characterization Report. Available online: http://resources.baltimorecountymd.gov/Documents/Environment/Watersheds/pbcharacterization.pdf (accessed on 10 October 2016).
  10. Palmer, M.A.; Kramer, J.G.; Boyd, J.; Hawthorne, D. Practices for facilitating interdisciplinary synthetic research: The National Socio-Environmental Synthesis Center (SESYNC). Curr. Opin. Environ. Sustain. 2016, 19, 111–122. [Google Scholar] [CrossRef]
  11. RGISC. Available online: http://www.rgisc.org/uploads/5/6/8/7/56872033/low-cost-water-monitoring-kit-manual.pdf (accessed on 10 October 2016).
  12. National Center for Environmental Information. Available online: http://www.ncdc.noaa.gov/ (accessed on 11 September 2016).
  13. FDA. Available online: https://www.fda.gov/regulatoryinformation/lawsenforcedbyfda/ucm148797.htm (accessed on 10 March 2017).
  14. Goodwin, K.; Caraco, N; Cole, J. Temporal dynamics of dissolved oxygen in a floating–leaved macrophyte bed. Freshwater Biol. 2008, 53, 1632–1641. [Google Scholar] [CrossRef]
  15. Hakkwan, K.; Hanseok, J.; Jihye, J.; Seungjong, B. The Impact of Impervious Surface on Water Quality and Its Threshold in Korea. Water 2016, 8, 111–120. [Google Scholar]
  16. Ouyanga, Y.P.; Nkedi-Kizzab, Q.T.; Wuc, D.; Shindeb, C.H.; Huang, D. Assessment of seasonal variations in surface water quality. Water Resour. 2006, 40, 3800–3810. [Google Scholar] [CrossRef] [PubMed]
  17. Peter, S.M.; Jill, S.B.; Timothy, L.M. Potential effects of climate change on surface water quality in northern America. J. Am. Water Resour. Assoc. 2000, 11, 112–115. [Google Scholar]
  18. MDE. Available online: http://www.mde.state.md.us/programs/Water/TMDL/Integrated303dReports/Documents/IntegratedReport_Section_PDFs/303d_1996-1998/1996_1998list.pdf (accessed on 10 March 2017).
  19. EPA. Available online: https://www.epa.gov/laws-regulations/history-clean-water-act (accessed on 14 March 2017).
  20. Ren, W.W. Urbanization, land use, and water quality in Shanghai: 1947–1996. J. Environ. Int. 2006, 9, 649–659. [Google Scholar] [CrossRef]
  21. Wolf, M.M.; Stephan, H.L.; De Senerpont Domis, L.N.; Nolet, P.L.E.; Bodelier, P.C.; Boers, L.M. D.; GonsBas, W. The impact of climate change on lakes in The Netherlands: A review. Aquat. Ecol. 2005, 39, 381–400. [Google Scholar]
  22. Huang, J.; Zhan, J.; Yan, H.; Wu, F.; Deng, X. Evaluation of the Impacts of Land Use on Water Quality: A Case Study in the Chaohu Lake Basin. Sci. World J. 2013, 7, 32. [Google Scholar] [CrossRef] [PubMed]
  23. WHO. Guidelines for Drinking-Water Quality, 4th ed.; WHO: Geneva, Switzerland, 2011. [Google Scholar]
  24. Katharina, W.; Christine, H.; Erwin, S. Groundwater nitrate contamination: Factors and indicators. J. Environ. Manag. 2012, 111, 178–186. [Google Scholar]
  25. Interlandi, S.J.; Crockett, C.S. Recent water quality trends in the Schuylkill River, Pennsylvania, USA: A preliminary assessment of the relative influences of climate, river discharge and suburban development. J. Water Res. 2013, 37, 1737–1748. [Google Scholar] [CrossRef]
  26. Clausen, J.; Robb, J.; Curry, D.; Korte, N. Case study of contaminants on military ranges: Camp Edwards, Massachusetts, USA. Environ. Pollut. 2014, 129, 13–21. [Google Scholar] [CrossRef]
Figure 1. Map depicting watersheds and reservoirs supplying Baltimore City’s drinking water.
Hydrology 04 00032 g001
Figure 2. “The Socio-Environmental Synthesis Process”: a set of reflexive practices for fostering team progress.
Hydrology 04 00032 g002
Figure 3. Dimensions of water quality as identified in the Socio-Environmental Synthesis framework.
Hydrology 04 00032 g003
Figure 4. Map showing representative test points in the Liberty, Loch Raven and Prettyboy watersheds.
Hydrology 04 00032 g004
Figure 5. Dynamics of nitrate levels at Liberty, Loch Raven and Prettyboy watersheds during 2015–2016.
Hydrology 04 00032 g005
Figure 6. Dynamics of percentage oxygen saturation levels in Liberty, Loch Raven and Prettyboy watersheds during 2015–2016.
Hydrology 04 00032 g006
Figure 7. Dynamics of alkalinity levels in Liberty, Loch Raven and Prettyboy watersheds during 2015–2016.
Hydrology 04 00032 g007
Figure 8. Dynamics of carbon dioxide levels in Liberty, Loch Raven and Prettyboy watersheds during 2015–2016.
Hydrology 04 00032 g008aHydrology 04 00032 g008b
Figure 9. Dynamics of temperature and precipitation change over 45 years.
Hydrology 04 00032 g009
Figure 10. Loch Raven watershed land use distribution.
Hydrology 04 00032 g010
Figure 11. Prettyboy watershed land use distribution.
Hydrology 04 00032 g011
Figure 12. Liberty watershed land use distribution.
Hydrology 04 00032 g012

