Future Climate Change Impacts on Streamflows of Two Main West Africa River Basins: Senegal and Gambia
by
 , and
, and
Ansoumana Bodian
1,*, 
Alain Dezetter
2,
Lamine Diop
3,
Abdoulaye Deme
4,
Koffi Djaman
5 and
and
Aliou Diop
6 1
Laboratoire Leïdi “Dynamique des Territoires et développement”, Université Gaston Berger (UGB), BP 234-Saint-Louis, Senegal
2
Institut de Recherche pour le Développement, UMR HydroSciences Montpellier, Université de Montpellier, CC 057, Place Eugène Bataillon, 34095 Montpellier CEDEX 5, France
3
UFRS2ATA: “Sciences Agronomiques, de l’Aquaculture et des Technologies Alimentaires”, Université Gaston Berger (UGB), BP 234 Saint-Louis, Senegal
4
Laboratoire LSAO “Laboratoire des Sciences de l’Atmosphère et de l’Océan”, Université Gaston Berger (UGB), BP 234 Saint-Louis, Senegal
5
NMSU: Agricultural Science Center at Farmington, Department of Plant and Environment Sciences, New Mexico State University, Farmington, NM 87401, USA
6
LERSTAD “Laboratoire d’Etudes et de Recherche en Statistique et Développement”, Université Gaston Berger (UGB), BP 234 Saint-Louis, Senegal
*
Author to whom correspondence should be addressed.
Hydrology 2018, 5(1), 21; https://doi.org/10.3390/hydrology5010021
Submission received: 7 February 2018
/
Revised: 13 March 2018
/
Accepted: 15 March 2018
/
Published: 16 March 2018
(This article belongs to the Special Issue Climatic Change Impact on Hydrology)
Abstract
:This research investigated the effect of climate change on the two main river basins of Senegal in West Africa: the Senegal and Gambia River Basins. We used downscaled projected future rainfall and potential evapotranspiration based on projected temperature from six General Circulation Models (CanESM2, CNRM, CSIRO, HadGEM2-CC, HadGEM2-ES, and MIROC5) and two scenarios (RCP4.5 and RCP8.5) to force the GR4J model. The GR4J model was calibrated and validated using observed daily rainfall, potential evapotranspiration from observed daily temperature, and streamflow data. For the cross-validation, two periods for each river basin were considered: 1961–1982 and 1983–2004 for the Senegal River Basin at Bafing Makana, and 1969–1985 and 1986–2000 for the Gambia River Basin at Mako. Model efficiency is evaluated using a multi-criteria function (Fagg) which aggregates Nash and Sutcliffe criteria, cumulative volume error, and mean volume error. Alternating periods of simulation for calibration and validation were used. This process allows us to choose the parameters that best reflect the rainfall-runoff relationship. Once the model was calibrated and validated, we simulated streamflow at Bafing Makana and Mako stations in the near future at a daily scale. The characteristic flow rates were calculated to evaluate their possible evolution under the projected climate scenarios at the 2050 horizon. For the near future (2050 horizon), compared to the 1971–2000 reference period, results showed that for both river basins, multi-model ensemble predicted a decrease of annual streamflow from 8% (Senegal River Basin) to 22% (Gambia River Basin) under the RCP4.5 scenario. Under the RCP8.5 scenario, the decrease is more pronounced: 16% (Senegal River Basin) and 26% (Gambia River Basin). The Gambia River Basin will be more affected by the climate change.

1. Introduction
Availability of freshwater in sub-Saharan Africa is fundamental to economic growth and social development [1]. In Africa, more than 70% of the population is rural and mainly depend on agriculture in which water availability is one of the most limiting factors. Among the key elements to determine the water availability, the streamflow is the major component. Therefore, it is primordial to have knowledge on streamflow in order to better assess the quantity of existing water for multiple purposes. However, hydrological cycle has been altered by human activities and climate change [2,3]. Therefore, it is essential to account for water inflow in order to insure a correct monitor and assessment of water for multipurpose reservoir or river basin [2,3]. However, a major effect of climate change is likely to be alterations in hydrologic cycles and changes in water availability [4]. All sectors depending on water availability are now vastly exposed to the climate change impacts [5]. Hence, climate change can also impact sediment export [6,7], crop yield and biomass [8,9], water quality [10], etc. All these are driven by streamflow.
According to the Intergovernmental Panel on Climate Change (IPCC) [11], nearly most regions of the world are expected to experience a net negative impact of climate change on water resources and freshwater ecosystems. Increased evaporation, combined with changes in precipitation, has the potential to affect runoff, the frequency and intensity of floods and droughts, soil moisture, and available water for irrigation and hydroelectric generation [4]. Azari et al. [12] highlighted that a long trend increase in temperature will considerably impact the hydrological cycle, thus changing rainfall pattern and the magnitude and timing of runoff. In Africa, climate change and its impact on water resources availability in space and time have put complex challenges to the African countries in their objective to better manage water resources and improve food security [13]. Several studies were conducted across the world to determine the impact of climate change on streamflow under different climate models and scenarios by using a large group of hydrological models [4,14]. The results of these studies showed that climate change will impact considerably the availability of water resources across the world. The severity and the magnitude of the impact depend on the geographical area and context. In West Africa, Roudier et al. [15] summarized different funding related to the impact of climate change on water resources. Overall, a decrease of rainfall going from 20% to 30% was noticed, which led to a decrease in river flows ranging from 40% to 60% [5].
In the Senegal and Gambia River Basin, strategic areas for the development of the Senegal River Basin Organization (OMVS) countries (Guinea, Mali, Mauritania, and Senegal) and the Gambia River Basin organization (OMVG) countries (Gambia, Guinea, Bissau Guinea, and Senegal), few studies have been conducted to assess streamflow under future climate change. Bodian et al. [16] investigated the impact of climate change on some sub-basins in the upper Senegal River Basin by using 4 GCMs (CSMK3, HADCM3, MPEH5, and NCPCM) under A2 SRES scenario and the hydrological model GR2M. They showed that some GCM models (CSMK3, HADCM3, MPEH5) predict decrease of streamflow while NCPCM GCM model exhibit the opposite. However, Bodian et al. [16] used a model at monthly step to predict streamflow which is not adapted for flood and base-flow modeling. Recently, Mbaye et al. [17] used the regional climate model REMO as input for the Max Planck Institute for Meteorology-Hydrology Model (MPI-HM) and found general decrease of river discharge, runoff, evapotranspiration, soil moisture under the two Representative Concentration Pathways (RCP4.5 and RCP8.5) by the end of the century in the Upper Senegal Basin (West Africa) at Bakel station. Mbaye et al. [17] did not take into account the effect of Manantali dam in the river and used only one climate model which can bias the results. In the Gambia River Basin, only the study of Ardoin-Bardin et al. [18] was interested to the impact of climate on river basin water resources at Gouloumbou station by using four GCM (CSIRO-Mk2, ECHAM4, HadCM3 and NCAR-PC) under the AR3 (A2) scenario and the GR2M hydrological model.
This shows the lack of study related to the evaluation of the impact of climate change on water resources in this area. Several projects have been implemented in both watersheds. At the level of the Senegal River Basin, the OMVS authorities update the objectives defined in the 70s and defined an ambitious program to increase food security, hydroelectric production and to develop irrigated agriculture; while in the Gambia River Basin, the construction of the Sambangalou Dam, a hydraulic infrastructure which project to store 3 billion of m3 of water, to produce 402 GWh/year, and to irrigate 90,000 ha of land is planned to boost agriculture, hydropower production, and water supply for riparian states. All of these ongoing and planned initiatives require information on the evolution of the water resource mainly in this context of climate change. Also any negative impacts of water supply in respect to the two important basins is likely to affect the energy production and agriculture sectors of those countries, which are the two keys elements of economic development in Africa. Therefore, it is vital to monitor, assess and predict the water availability in both Senegal and Gambia River Basins, particularly in its upstream regions that have influence of water management practices downstream of river systems. Therefore, effort need to be undertaken in order to evaluate how climate change will impact streamflow of the two main basins under the new scenarios (RCPs) using several climate models. The main objective of this study is to quantify the near future (2036–2065) of climate change impact on streamflow at Senegal and Gambia River Basins by using daily hydrological model and six different climate models under RCP4.5 and 8.5. The output from this research will allow the OMVS and OMVG Authorities to improve water management and planning of future developments in OMVS and OMVG countries in the context of climate change.
2. Materials and Methods
2.1. Study Area
The study area covers both the Senegal River Basin at Bafing Makana station and the Gambia River Basin at Mako station (Figure 1). The Senegal River Basin covers Guinea (Conakry) and Mali with a total surface area of 21,290km2 at the gauging station of Bafing Makana; while the Gambia River Basin covers Guinea (Conakry) and Senegal with a total surface area of 8262km2 at the gauging station of Mako. Both watersheds have their source at Fouta Djalon in Guinea. These two basins are characterized by dense vegetation with some signs of deterioration due to the conjunction of several natural factors, such as drought and erosion, and anthropogenic factors, such as deforestation, bush fires, over-exploitation of forest resources, and overgrazing [19]. Elevations vary from 215 to 1389 m for the Senegal River and between 77 and 1531 m for the Gambia River. The mean annual rainfall is 1490 mm for the Senegal River Basin at Bafing Makana and 1208 mm for the Gambia River Basin at Mako. The mean annual discharge is 242 m3/s (1961–2004) and 87 m3/s (1970–2000) for Bafing Makana and Mako, respectively.
2.2. Data and Tools
2.2.1. Data
In this study, daily observed climate data (rainfall and temperature), daily observed streamflows, and simulated daily temperature and rainfall of six climate models under RCP4.5 and 8.5 were used.
Observed Climate and Hydrological Data
Daily rainfall and temperatures were provided by Guinean, Malian and Senegalese National Meteorology Agencies. Twelve rainfall stations and five temperature measurement stations have been used for Senegal River Basin and nine rainfall stations and two temperature stations for Gambia basin. Table 1 and Table 2 show the data used. Hydrological data were provided by the Senegal River Basin Organization (OMVS) and the Gambia River Basin Organization (OMVG). Due to the lack or no accessibility of recent rainfall and temperature data [19], the reference period 1961 to 2004 and 1969 to 2000 were chosen for Senegal River Basin and Gambia basin, respectively. These two reference periods have concomitant data (rainfall, temperature and streamflow).
Climate Models
2.2.2. GR4J Hydrological Model
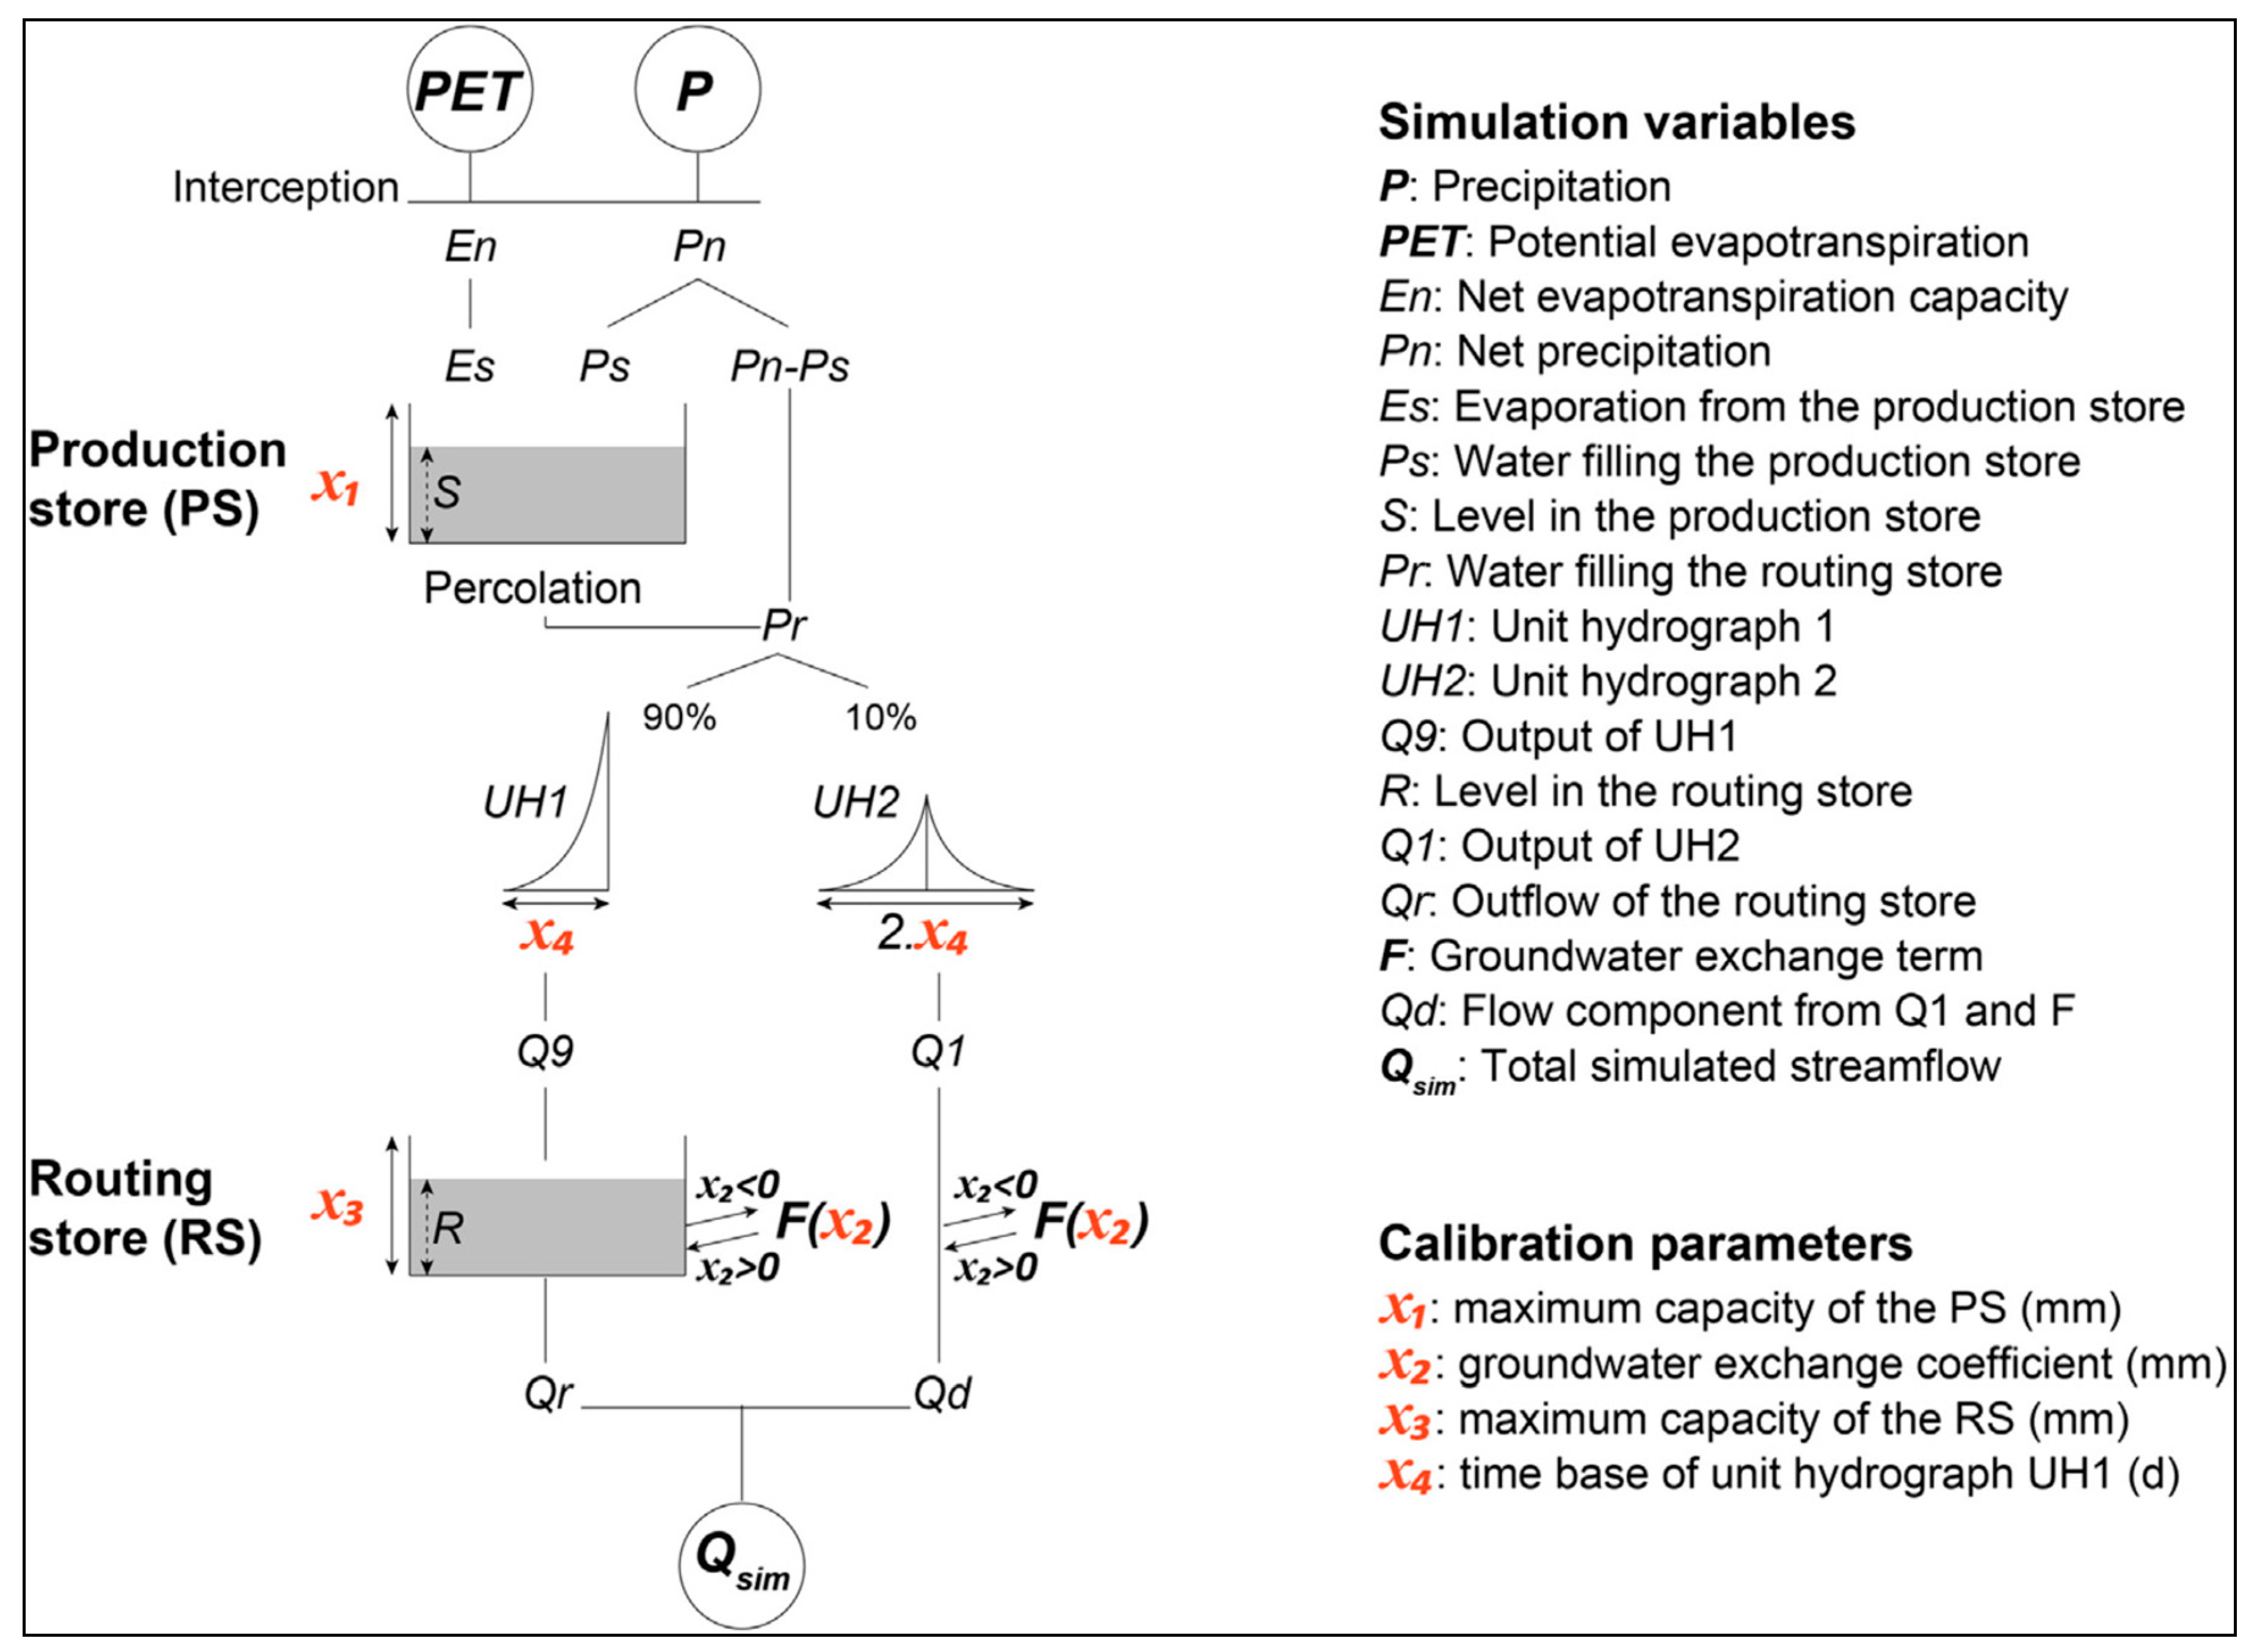
There are several models used in hydrological modeling. In this study, the lumped and conceptual model GR4J [22] that successfully simulates streamflow in a West African context [23,24,25] was used. The structure of the GR4J model is based on a production reservoir, a routing reservoir, and on two unit hydrographs. The model simulates runoffs through the production and transfer functions (Figure 2). The production function uses daily rainfalls (P) and daily potential evapotranspiration (PET) to determine the estimated quantity of rainfall that contribute to the runoff and feed the production reservoir [26]. Then a routing function delays water to contribute to the discharge at the basin’s outlet. The combination of a fraction of the net precipitation (Pn) and the percolation noticed Pr feeds routing function. Then, Pr is divided in two parts: (i) 90% is routed by a unit hydrograph (UH1) and by the routing reservoir; (ii) the other 10% is routed by a second unit hydrograph (UH2). The objectives of UH1 and UH2 is to consider the lag time between the rainfall and the runoff. Four parameters are used to calibrate the GR4J model: X1 (mm), the size of the production reservoir; X2 (mm) are the exchanges between surface and groundwater, if X2 < 0, groundwater feeds surface runoffs, and inversely if X2 > 0, surface runoffs feed groundwater. X3 (mm) is the maximum capacity of the transfer reservoir, and X4 (days) is the time base of the unit hydrograph UH1 (Figure 2). A more detailed description of the model is available in Perrin et al. [22].
2.3. Methods
The method adopted in this work involves the following steps: (i) model input and setup; (ii) calibration and validation of the GR4J model; (iii) construction of climate scenarios; and (iv) simulation of future flows at the 2050 horizon.
2.3.1. Model Input and Setup
The data needed for the GR4J include daily rainfall and potential evapotranspiration. Data on river discharge were also used for calibration and validation purposes. Daily rainfall series were derived from 12 rain gauges for the Senegal River Basin and nine rain gauges for the Gambia River Basin (Table 2). Daily average rainfall of all rain gauges for each basin was calculated by the inverse distance weighted method [27]. Potential evapotranspiration (PET) was estimated by using the Oudin et al. [28] formula (Equation 1). In the literature, there are several methods for calculating the PET. The FAO-56 Penman Monteih [29] method is the recommended methods by the Food and Agriculture Organization (FAO). However, they require a great deal of climate data (wind speed, temperature, relative humidity, solar radiation) that were not available in this area. Thus, in this study we used the formula proposed by Oudin et al. [28], which only needs daily air temperature, Julian day of the year, and latitude, and that was designed for rainfall-runoff modeling. This method underestimates PET values [21] but Khediri and Drugs [30] and Ardoin et al. [31] showed that the GR4J model is not very sensitive to PET:
where PET is the potential evapotranspiration (mm/day), R is the extra-atmospheric global radiation (MJ/m2/day), and T the temperature of the air at 2 m of altitude (°C).
Daily discharge data are from the Bafing Makana station located at the upper Senegal River Basin and Mako station located at the upper Gambia River Basin.
2.3.2. Calibration and Validation of GR4J Model
Automated calibration was used in the GR4J model by iteratively adjusting the parameter values until the minimum value of the selected objective function was achieved. This optimization has been carried out in three phases: (1) a random draw of 1715 combinations of parameters (X1, X2, X3, and X4) of the model enabled us to identify the best set of parameters which was subsequently used as a starting point for the Rosenbrock [32] non-linear optimization of the production function, followed by a second Rosenbrock optimization of the parameters of the transfer function; (2) 100 repetitions of the first phase enabled us to identify the best combination of parameters; and, finally, (3) we carried out a local fine-tuning of parameters, using the Nelder and Mead [33] simplex technique in order to optimize all the parameters depending on the combination chosen during phase (2). This three-phase optimization procedure was chosen among others because of his capability to avoid local minima in the objective function and because of its short execution time. It has also been successfully used with the GR4J model for other studies [34].
Marek et al. [35] pointed out that the division of the calibration and validation periods for model testing is not standardized. They reported the two main methods for selecting the calibration and validation periods: (1) divide the simulation period into two equal parts and use one part for calibration and the other for validation; or (2) use alternating years of simulation for calibration and validation. For this research the second method was used; two periods for each river basin were considered: 1961–1982 and 1981–2004 for Bafing Makana station, and 1969–1985 and 1986–2000 for Mako station. For each of those periods a warmup period of two years was used. Model efficiency was measured using on a multi-criteria function (Fagg) proposed by Ruell and et al. [36] which aggregates the Nash and Sutcliffe criterion (NSE), cumulative volume error (VE) and mean volume error (VEm) (Table 4). The model’s parameters were adjusted for each period before validating the model over the other period. This process allows us to choose the parameters that best reflect the rainfall-runoff relationship. Once the model was calibrated and validated, we have simulated streamflow at Bafing Makana and Mako stations in the near future at a daily scale.
2.3.3. Construction of Climate Scenarios
Description of Climate Change Scenarios
Predicting the impact of climate change on water resources, agriculture, and other sectors is difficult [37] and needs the use of possible scenario changes defined by the Intergovernmental Panel on Climate Change (IPCC) [38]. The Fifth Assessment Report (AR5) of the IPCC was published in 2014. Compared to the previous reports, AR5 uses the Representative Concentration Pathways (RCPs) [38]. The RCPs describe different 21st century pathways of greenhouse gas emissions and atmospheric concentrations, air pollutant emissions, and land use [39]. Four RCPs have been developed (RCP2.6, RCP4.5, RCP6, and RCP8.5) by the IPCC. Under the RCP8.5, the highest greenhouse gas emission scenario, the radiation forcing is approximately 8.5 W/m2 in 2100 [40,41]. The RCP4.5 scenario predicts the forcing to be approximately 4.5 W/m2 in 2100. Under the RCP2.6 scenario, the radiation forcing is approximately 2.6 W/m2 in 2100 [42]. RCP2.6 is a stringent mitigation scenario, RCP4.5 and RCP6.0 are intermediate scenarios, and RCP8.5 is a scenario with very high greenhouse gas emissions [39]. Compared to the Special Report Emission Scenario (SRES) used in the Fourth IPCC Assessment Report (AR4), RCP8.5 is broadly comparable to the SRES A2/A1FI scenario, RCP6.0 to B2, and RCP4.5 to B1. For RCP2.6, there is no equivalent scenario in SRES [39]. In this present study, RCP8.5 and RCP4.5 have been considered.
Downscaling of Global Climate Models to the Watershed Level
GCMs cannot provide the details on very small spatial scales due to incomplete scientific understanding and limitations of available observations [43]. Due to the coarse scales, it is not advised to directly use GCM output for hydrological impact studies [44]. Therefore, outputs from GCMs need to be downscaled at the area of study. There are two main methods of downscaling: dynamical and statistical. The statistical downscaling performs statistical relationships between large-scale climate information and local variables [44] whereas, in dynamical downscaling, either a higher resolution climate model or regional climate model is forced by using a GCM [4]. In this research we have not applied a specific approach to select the climatic models. We just used the most familiar model utilized in West Africa [20]. This fact could be one of the limits of our methodology. For this study, statistical downscaling, particularly the delta method, was chosen. The “delta method” has been widely used in hydrology and water management studies [45]. The strength of this method is that: (i) it incorporates realistic historical daily time series and spatial variability; and (ii) it is easy to develop. However, it does not incorporate extremes, but only average changes in mean monthly temperature and rainfall. For this method, the average of the simulated and observed series was calculated over the reference period (1961–1990), and then we computed the monthly adjustments that would allow projected scenarios to be built. This was done by applying Equations (2) and (3) between, respectively, the mean monthly rainfall and temperature simulated over the reference period (1961–1990, RCP scenarios) and the monthly rainfall and temperatures simulated over the future period (2036–2065):
where P: rainfall (mm); T: temperature (°C); m: month; and y: year
The last step was to construct climatic scenarios for each model cell on a daily time step using a spatial and temporal downscaling:
where Prj: projected; d = day.
3. Results
3.1. Efficiency of the Model GR4J on Calibration-Validation
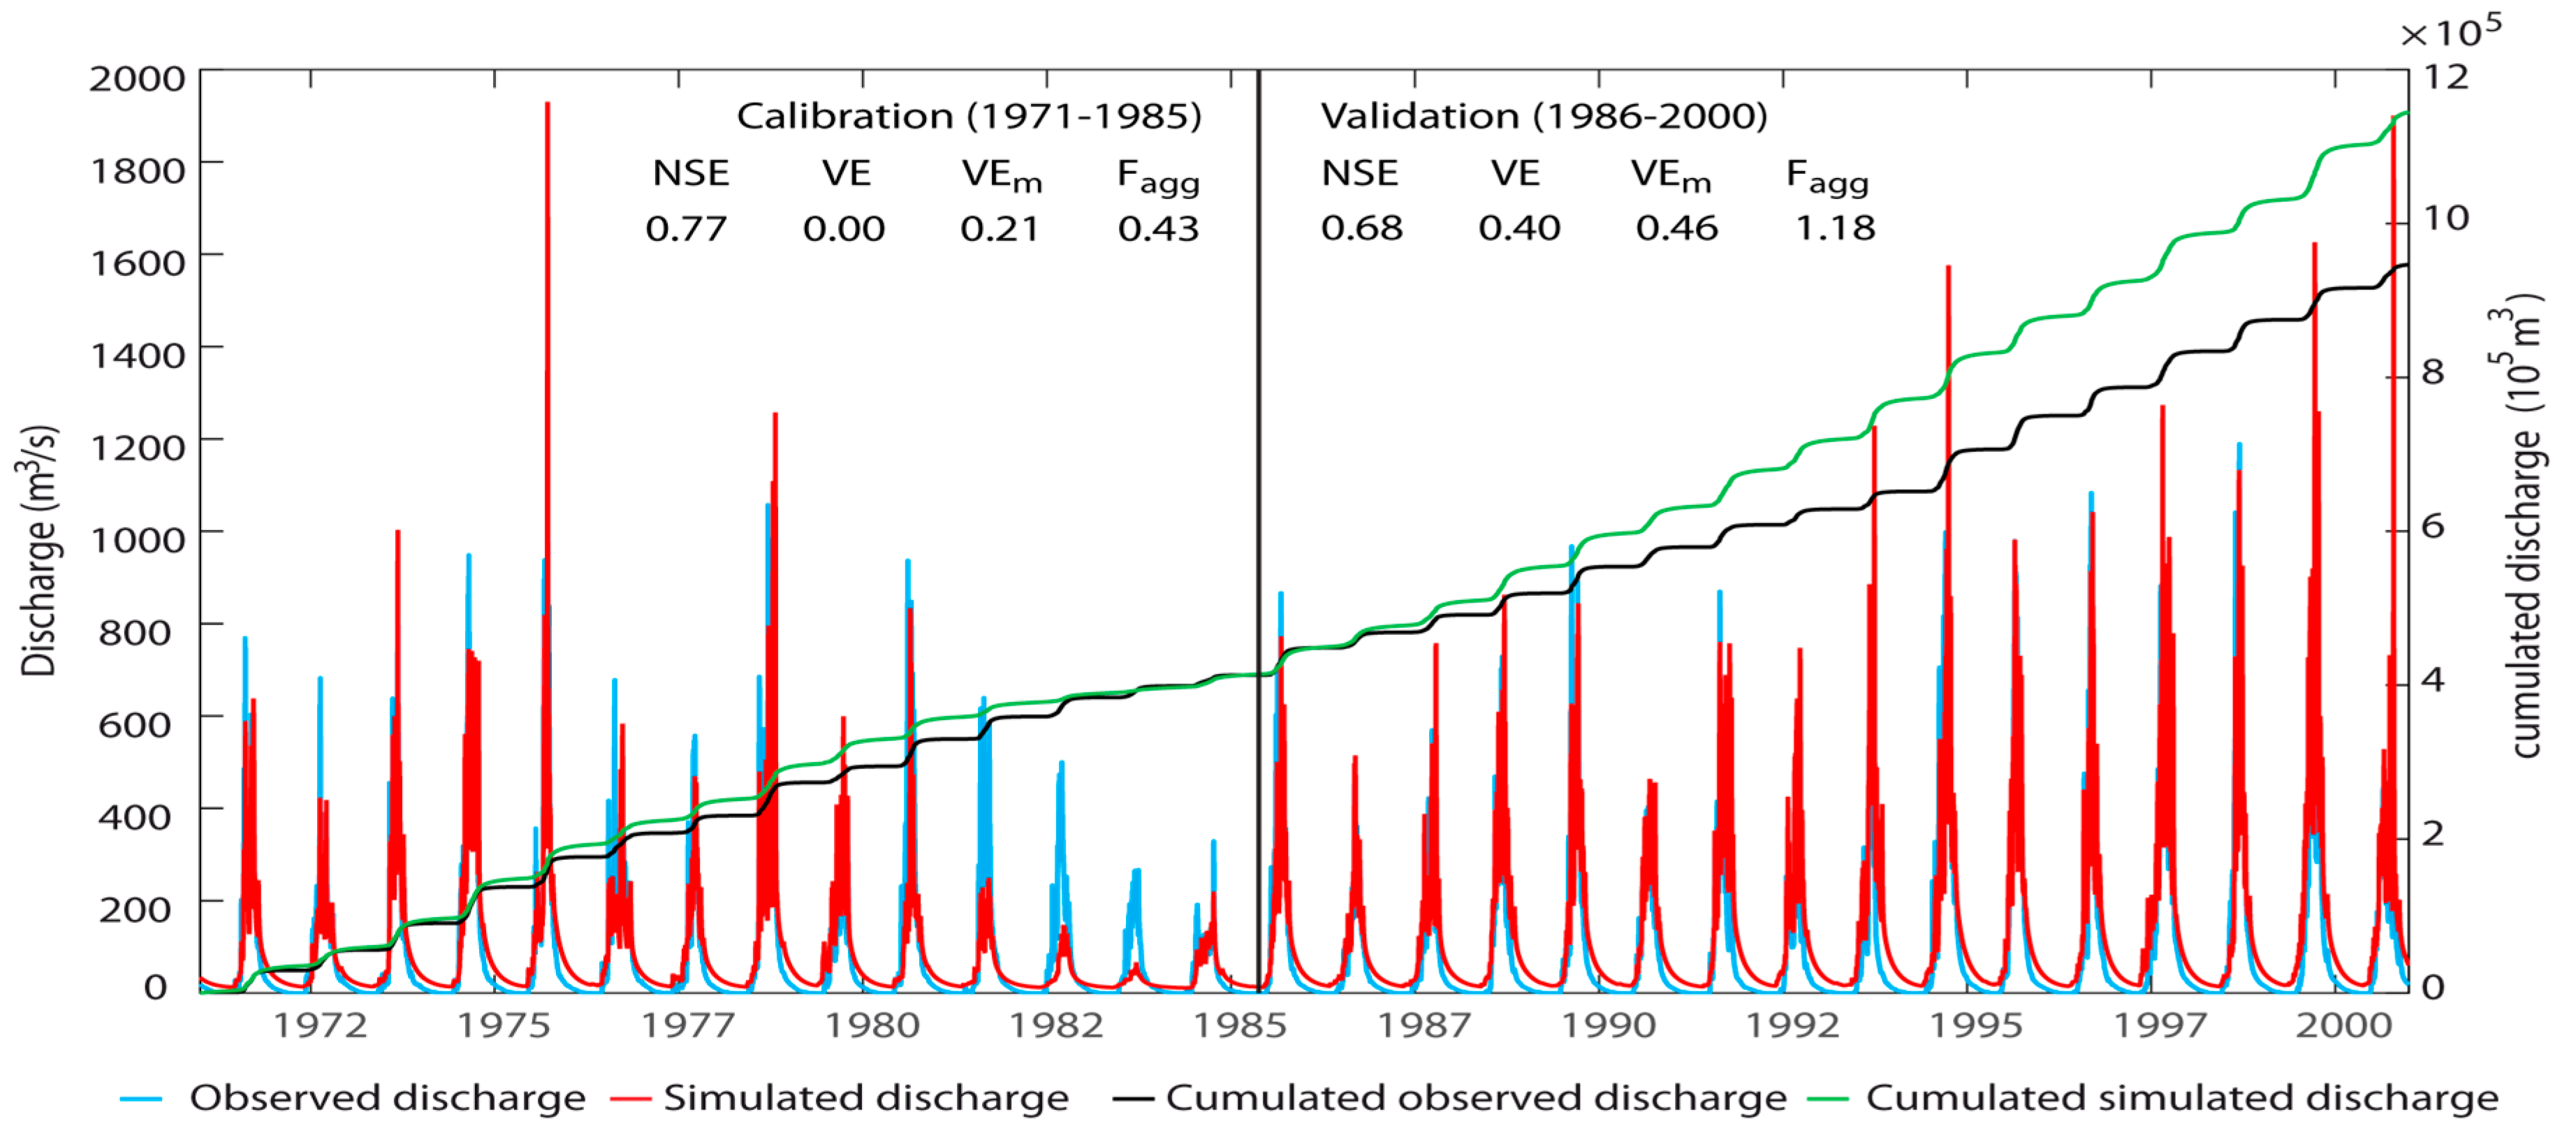
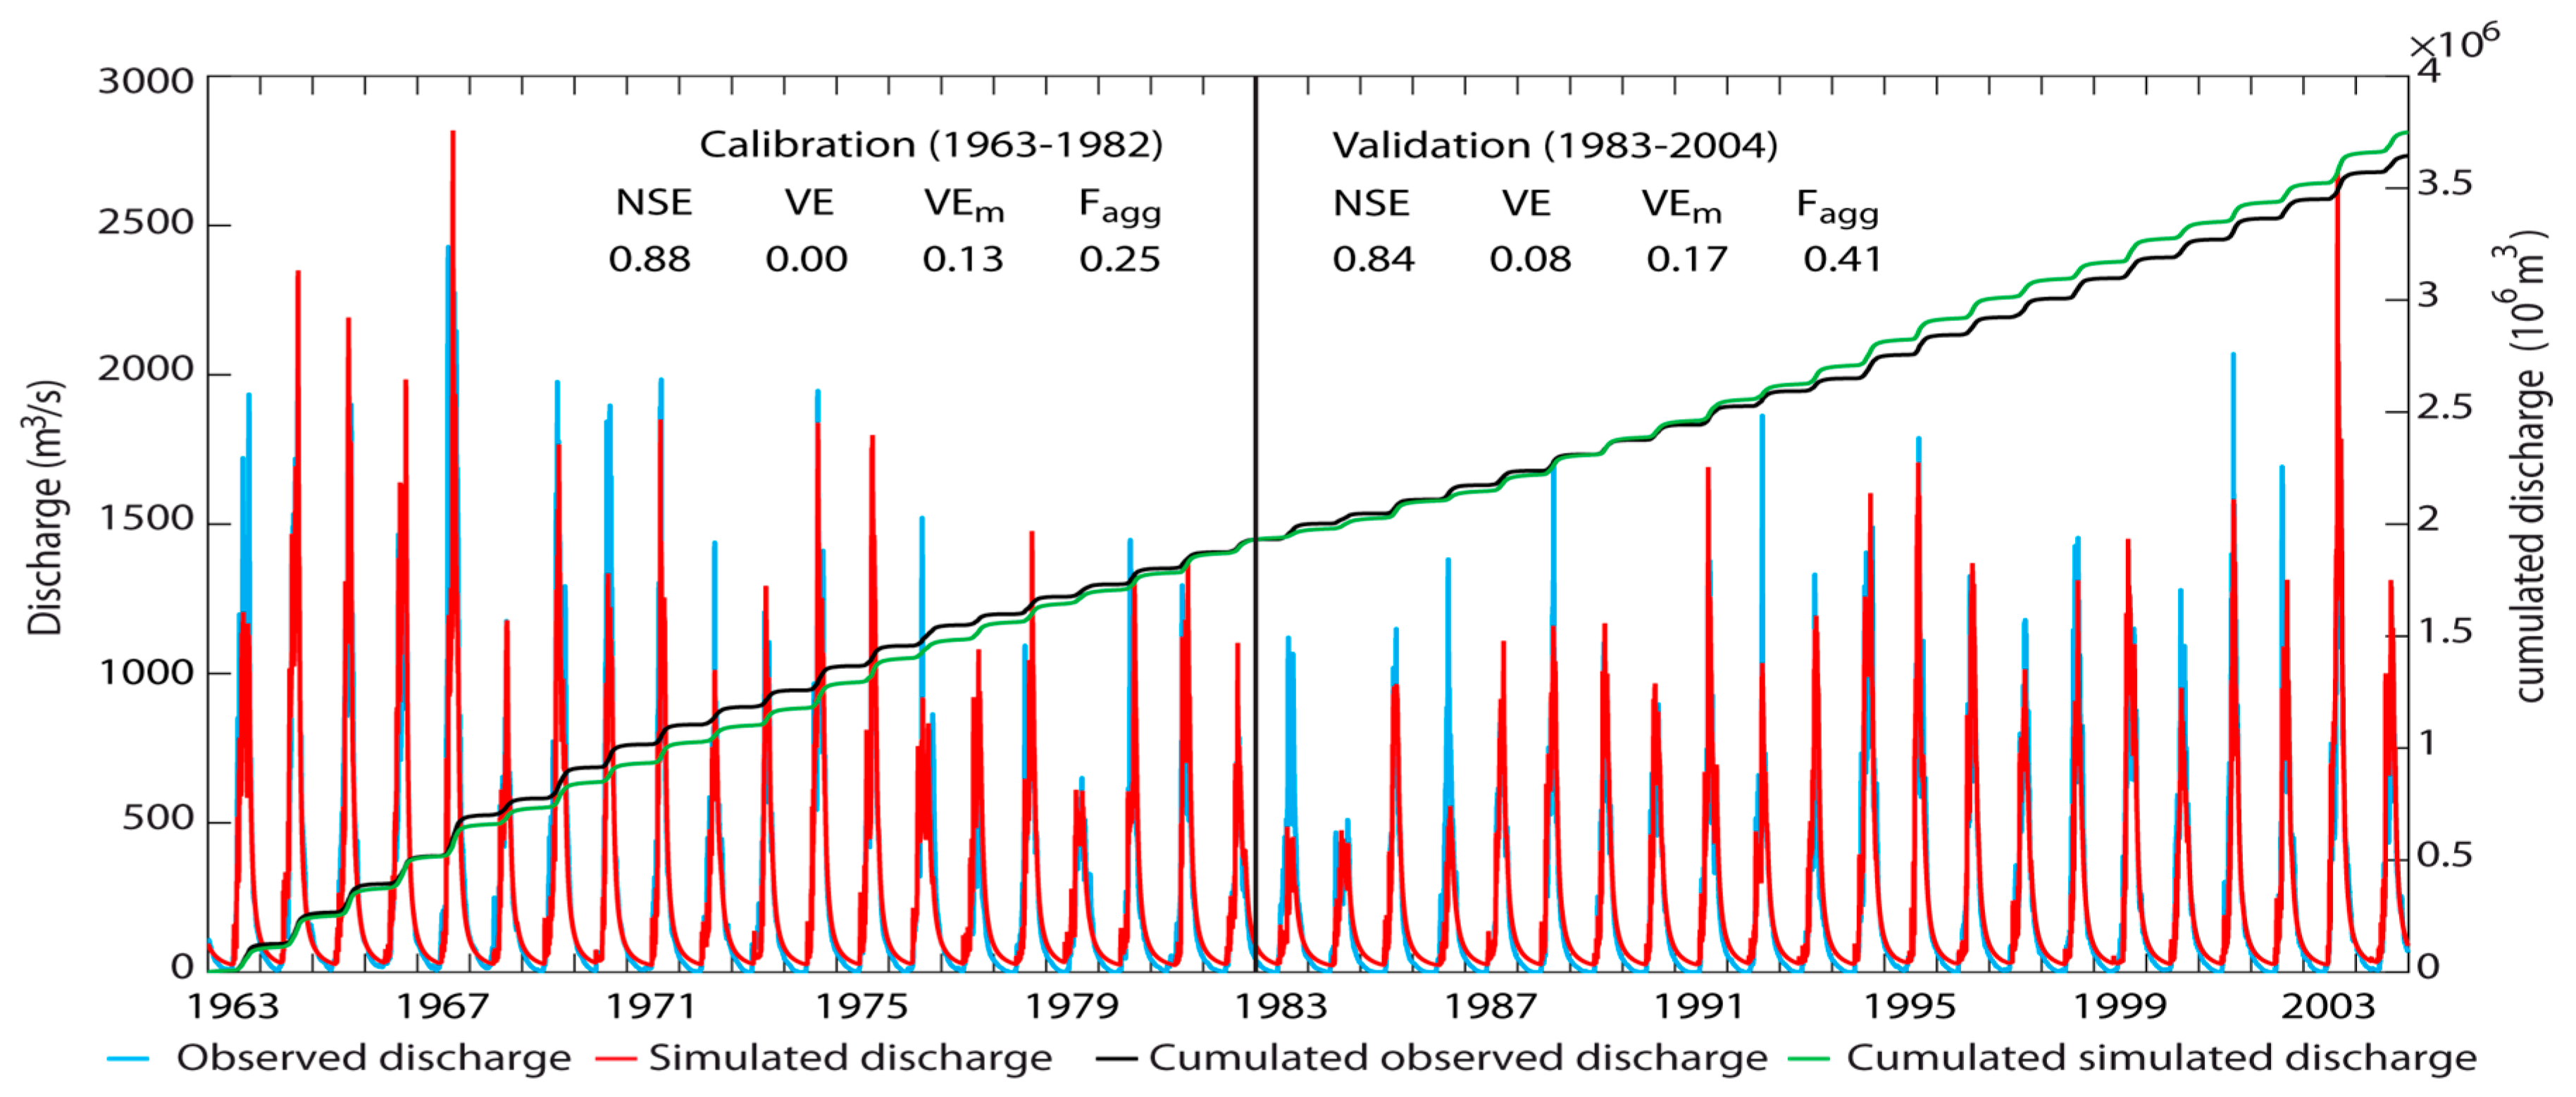
Values of the criteria function obtained after the cross validation are presented in Figure 3 and Figure 4. The Nash values are greater than 0.63 for both calibration and validation. The model tends to overestimate low flows and slightly underestimate high flows (Figure 3 and Figure 4). Through the effect of compensation, we end up with near zero cumulative volume error (Figure 3 and Figure 4). In fact, the runoff volume errors compensate over the whole period [26,27]. The mean annual volume error gives the same weight for both dry and wet years in the evaluation of the model efficiency [26,27]. For Bafing Makana station, the GR4J model overestimates by 12% to 17% the streamflow on calibration and validation. Parameters calibrated over 1963–1982 for Bafing Makana station and 1971–1985 for Mako station give the best Nash criteria (0.88 and 0.84 for Bafing Makana and 0.77 and 0.68 for Mako on calibration and validation, respectively). These periods give also the best values of the multi-criteria aggregating function Fagg (0.25 and 0.41 for Bafing Makana and 0.43 and 1.18 for Mako on calibration and validation, respectively). Therefore, we chose X1, X2, X3 and X4 parameters of 1963–1982 (for Bafing Makana station) and 1971–1985 (for Mako station) calibration period as the ones that should be used to extrapolate to the future.
3.2. Evolution of Annual Streamflow and Characteristic Flow Rate by 2050
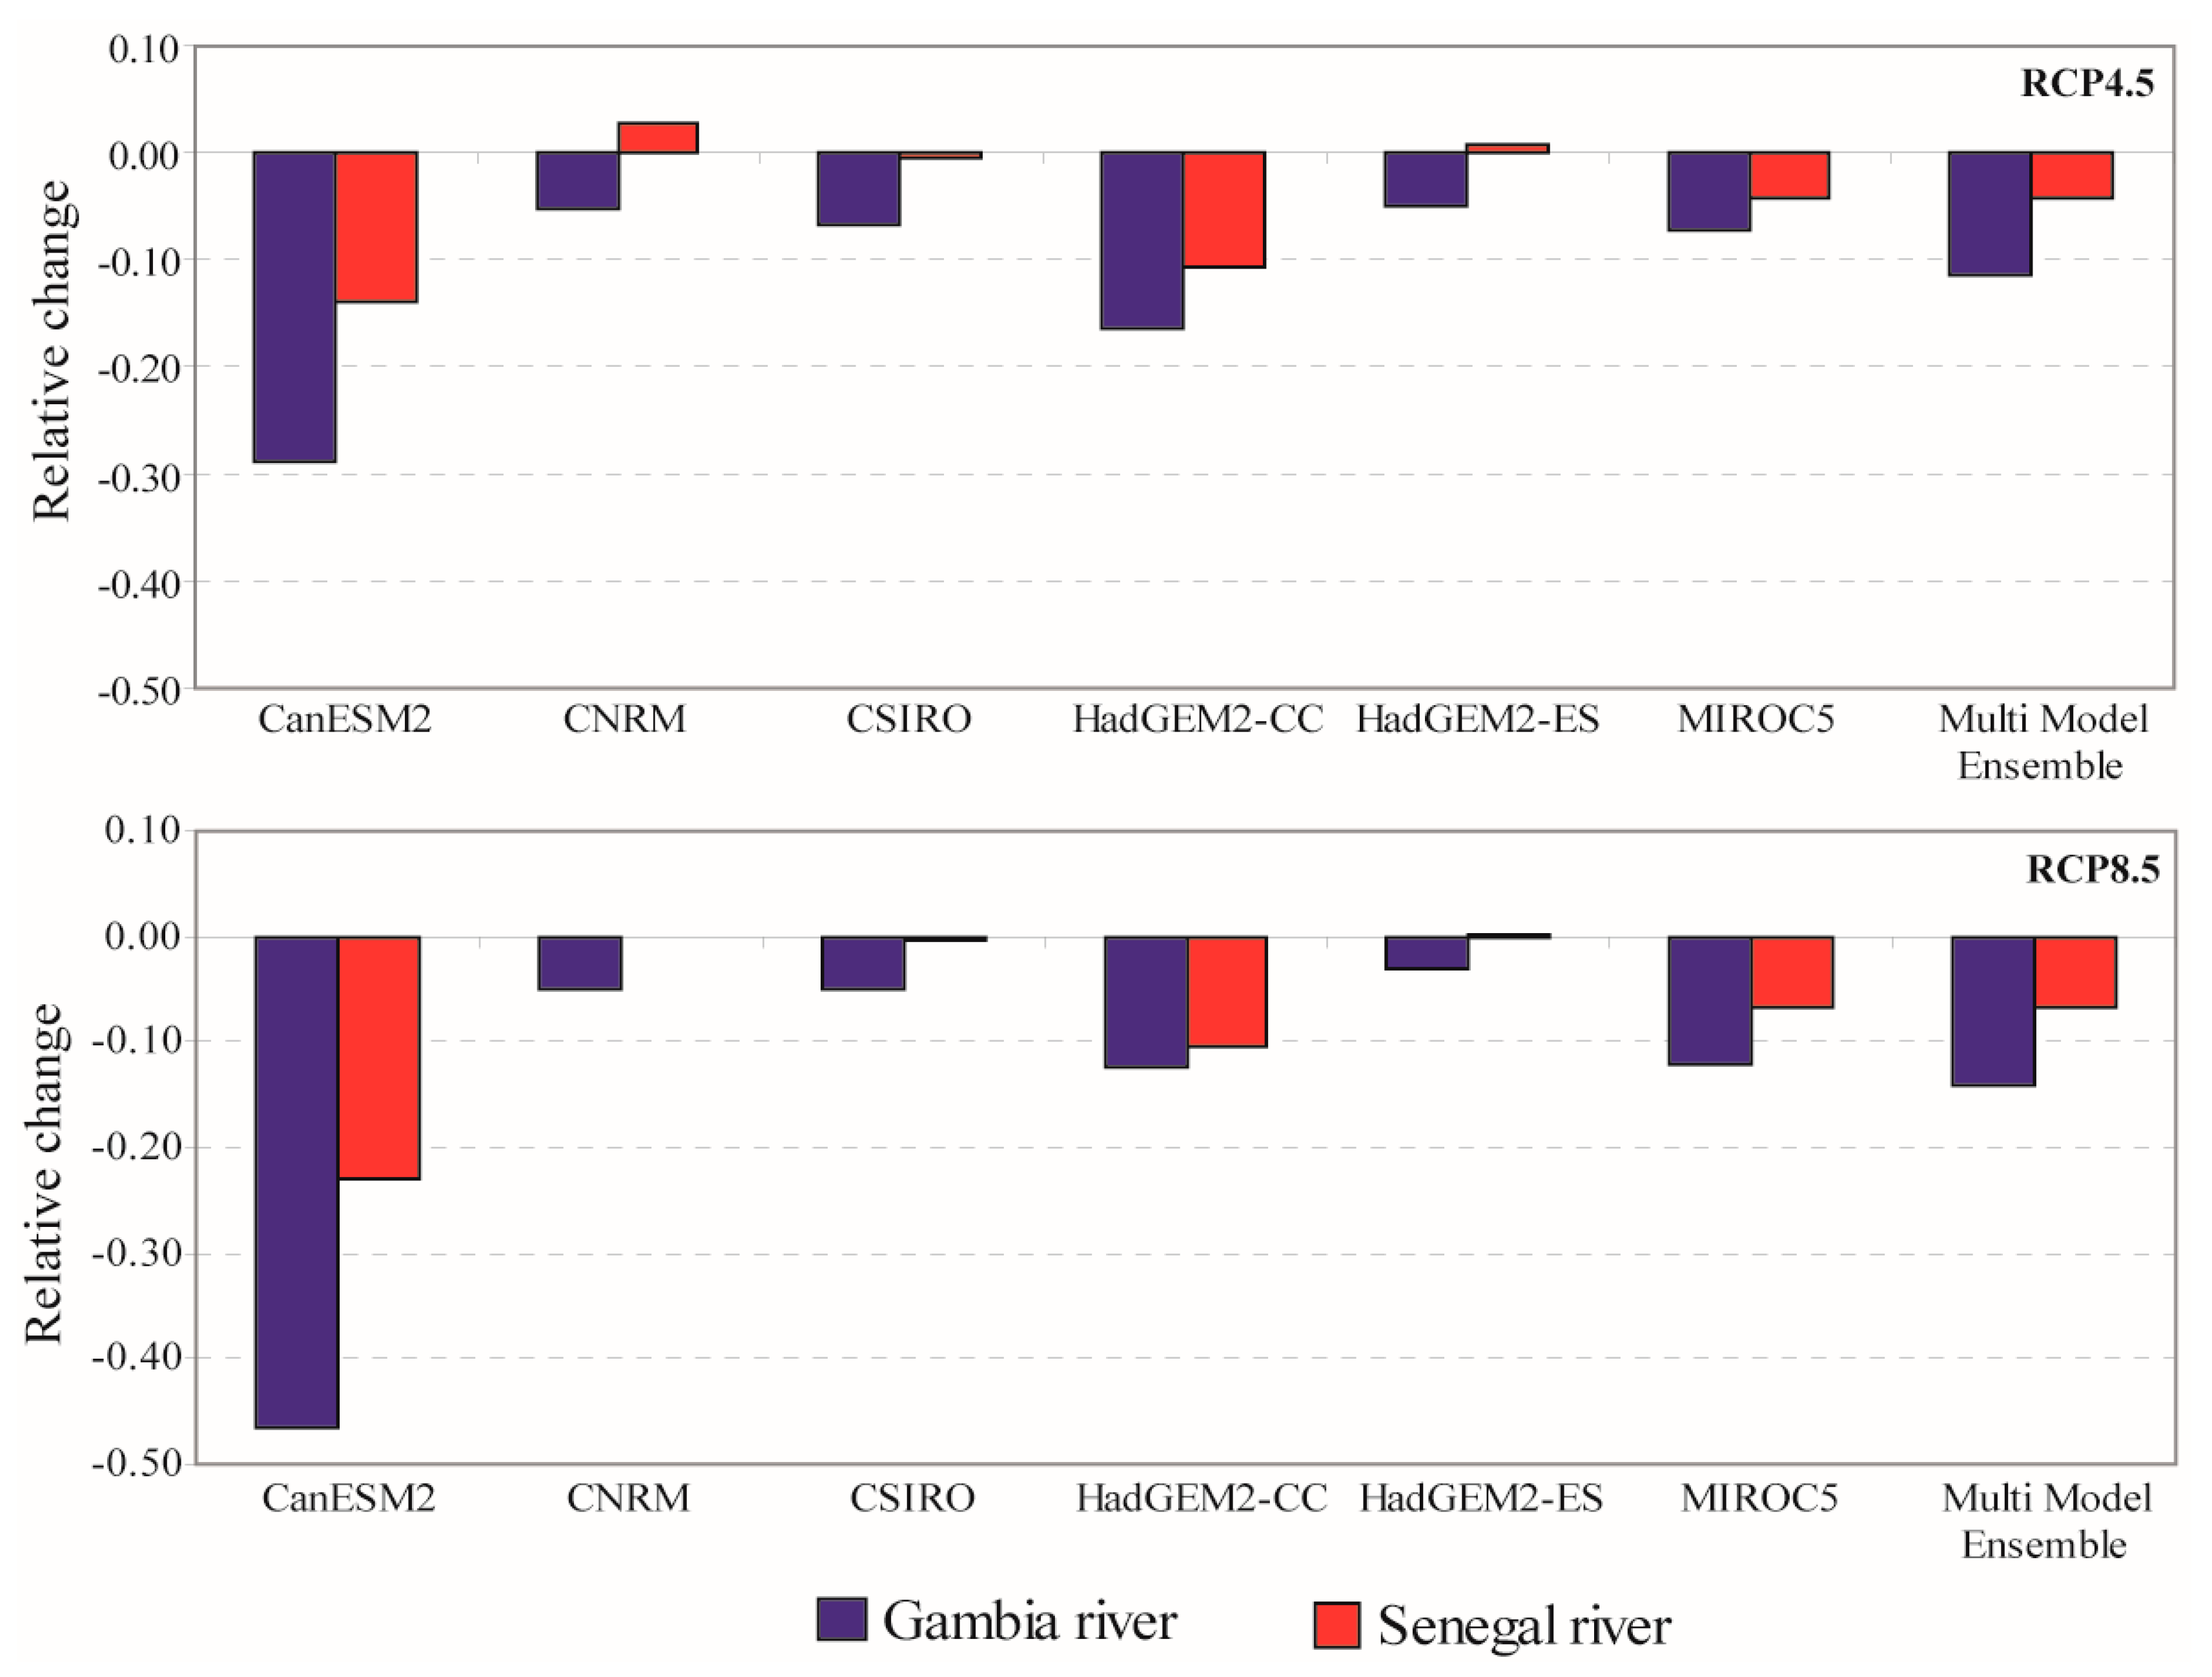
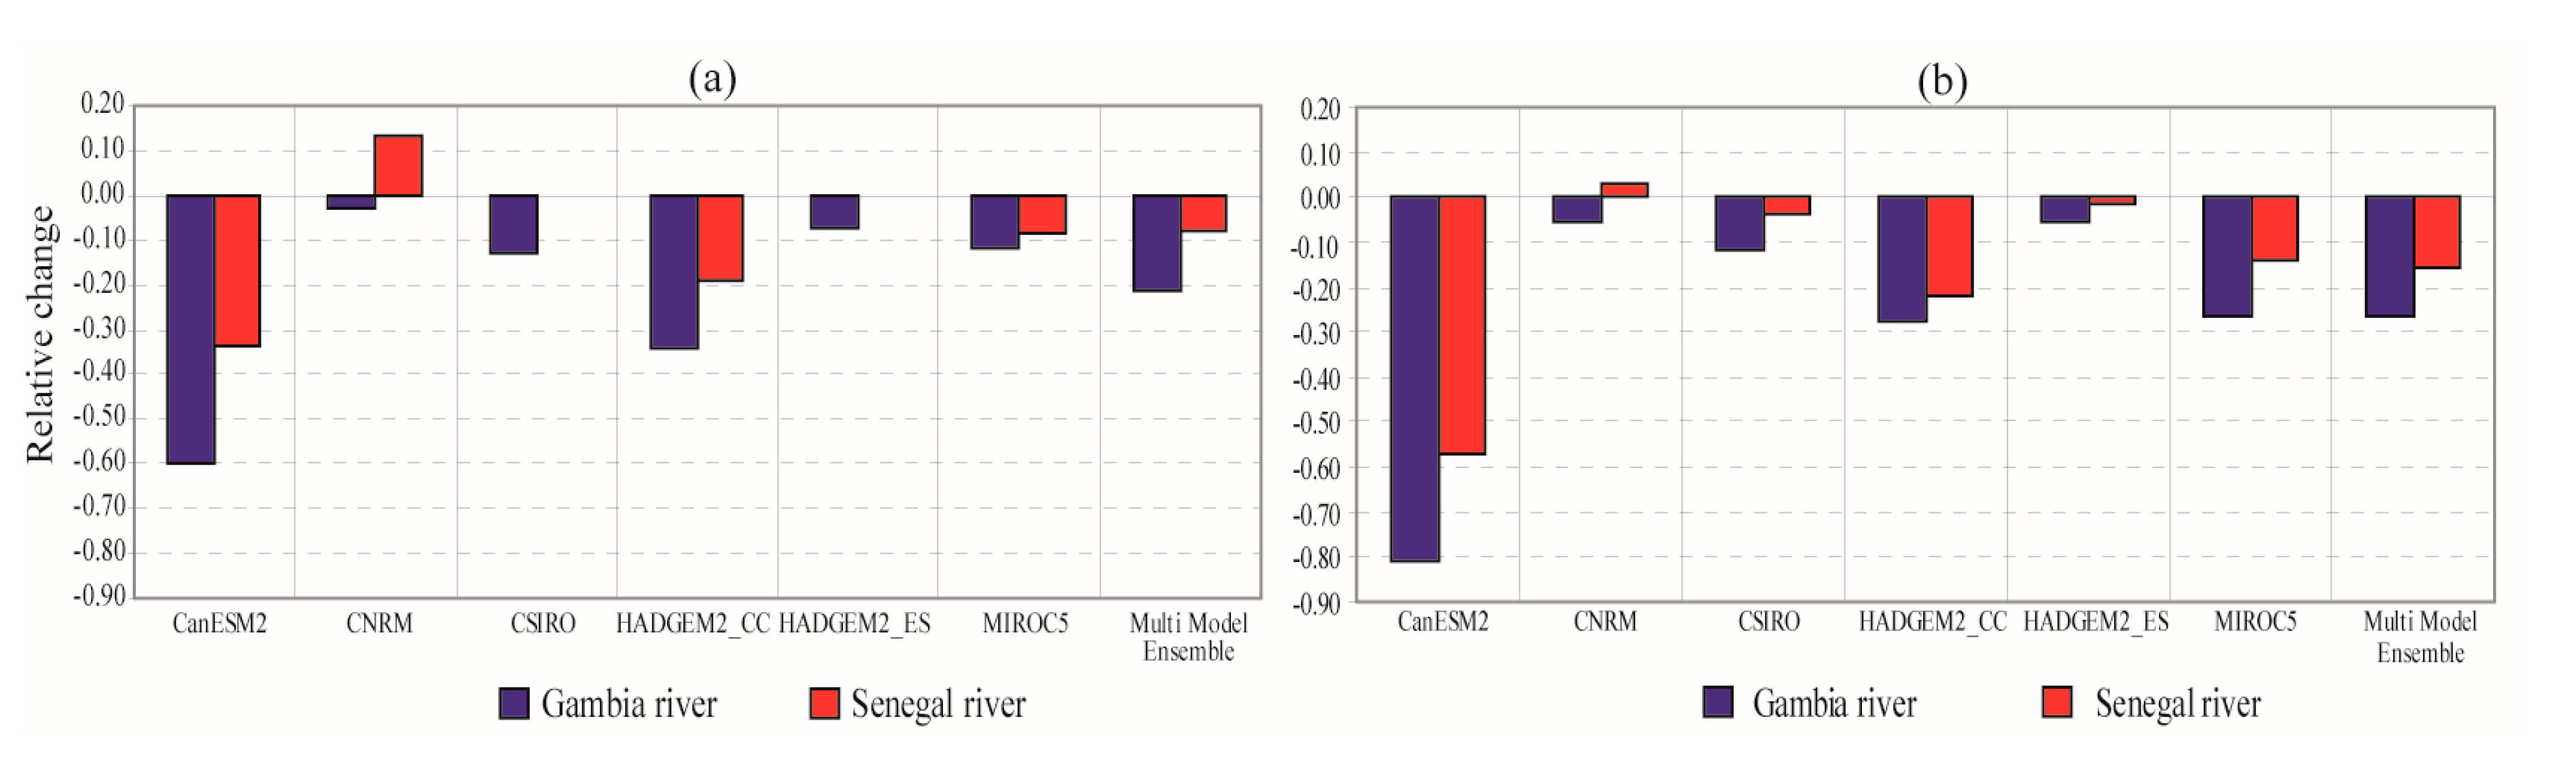
The outputs of climate models were used to force the hydrological model to make projections on the flows at the 2050 horizon. Compared to the 1971–2000 reference period, results showed that, for both river basins (Figure 5), multi-model ensemble (average of all models) predicted a decrease of annual streamflow from 8% (Senegal River Basin) to 22% (Gambia River Basin) under RCP4.5 scenario for the near future. Under RCP8.5 scenario, the decrease is more pronounced: 16% (Senegal River Basin) and 26% (Gambia River Basin). The Gambia River Basin will be more affected by climate change.
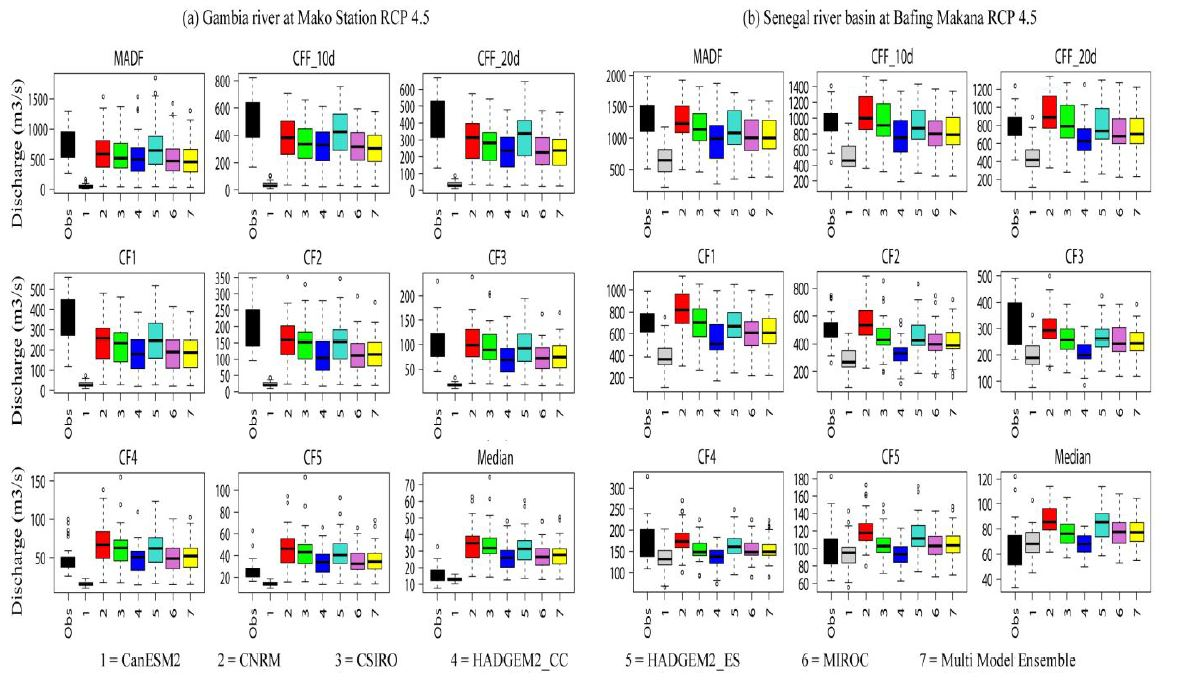
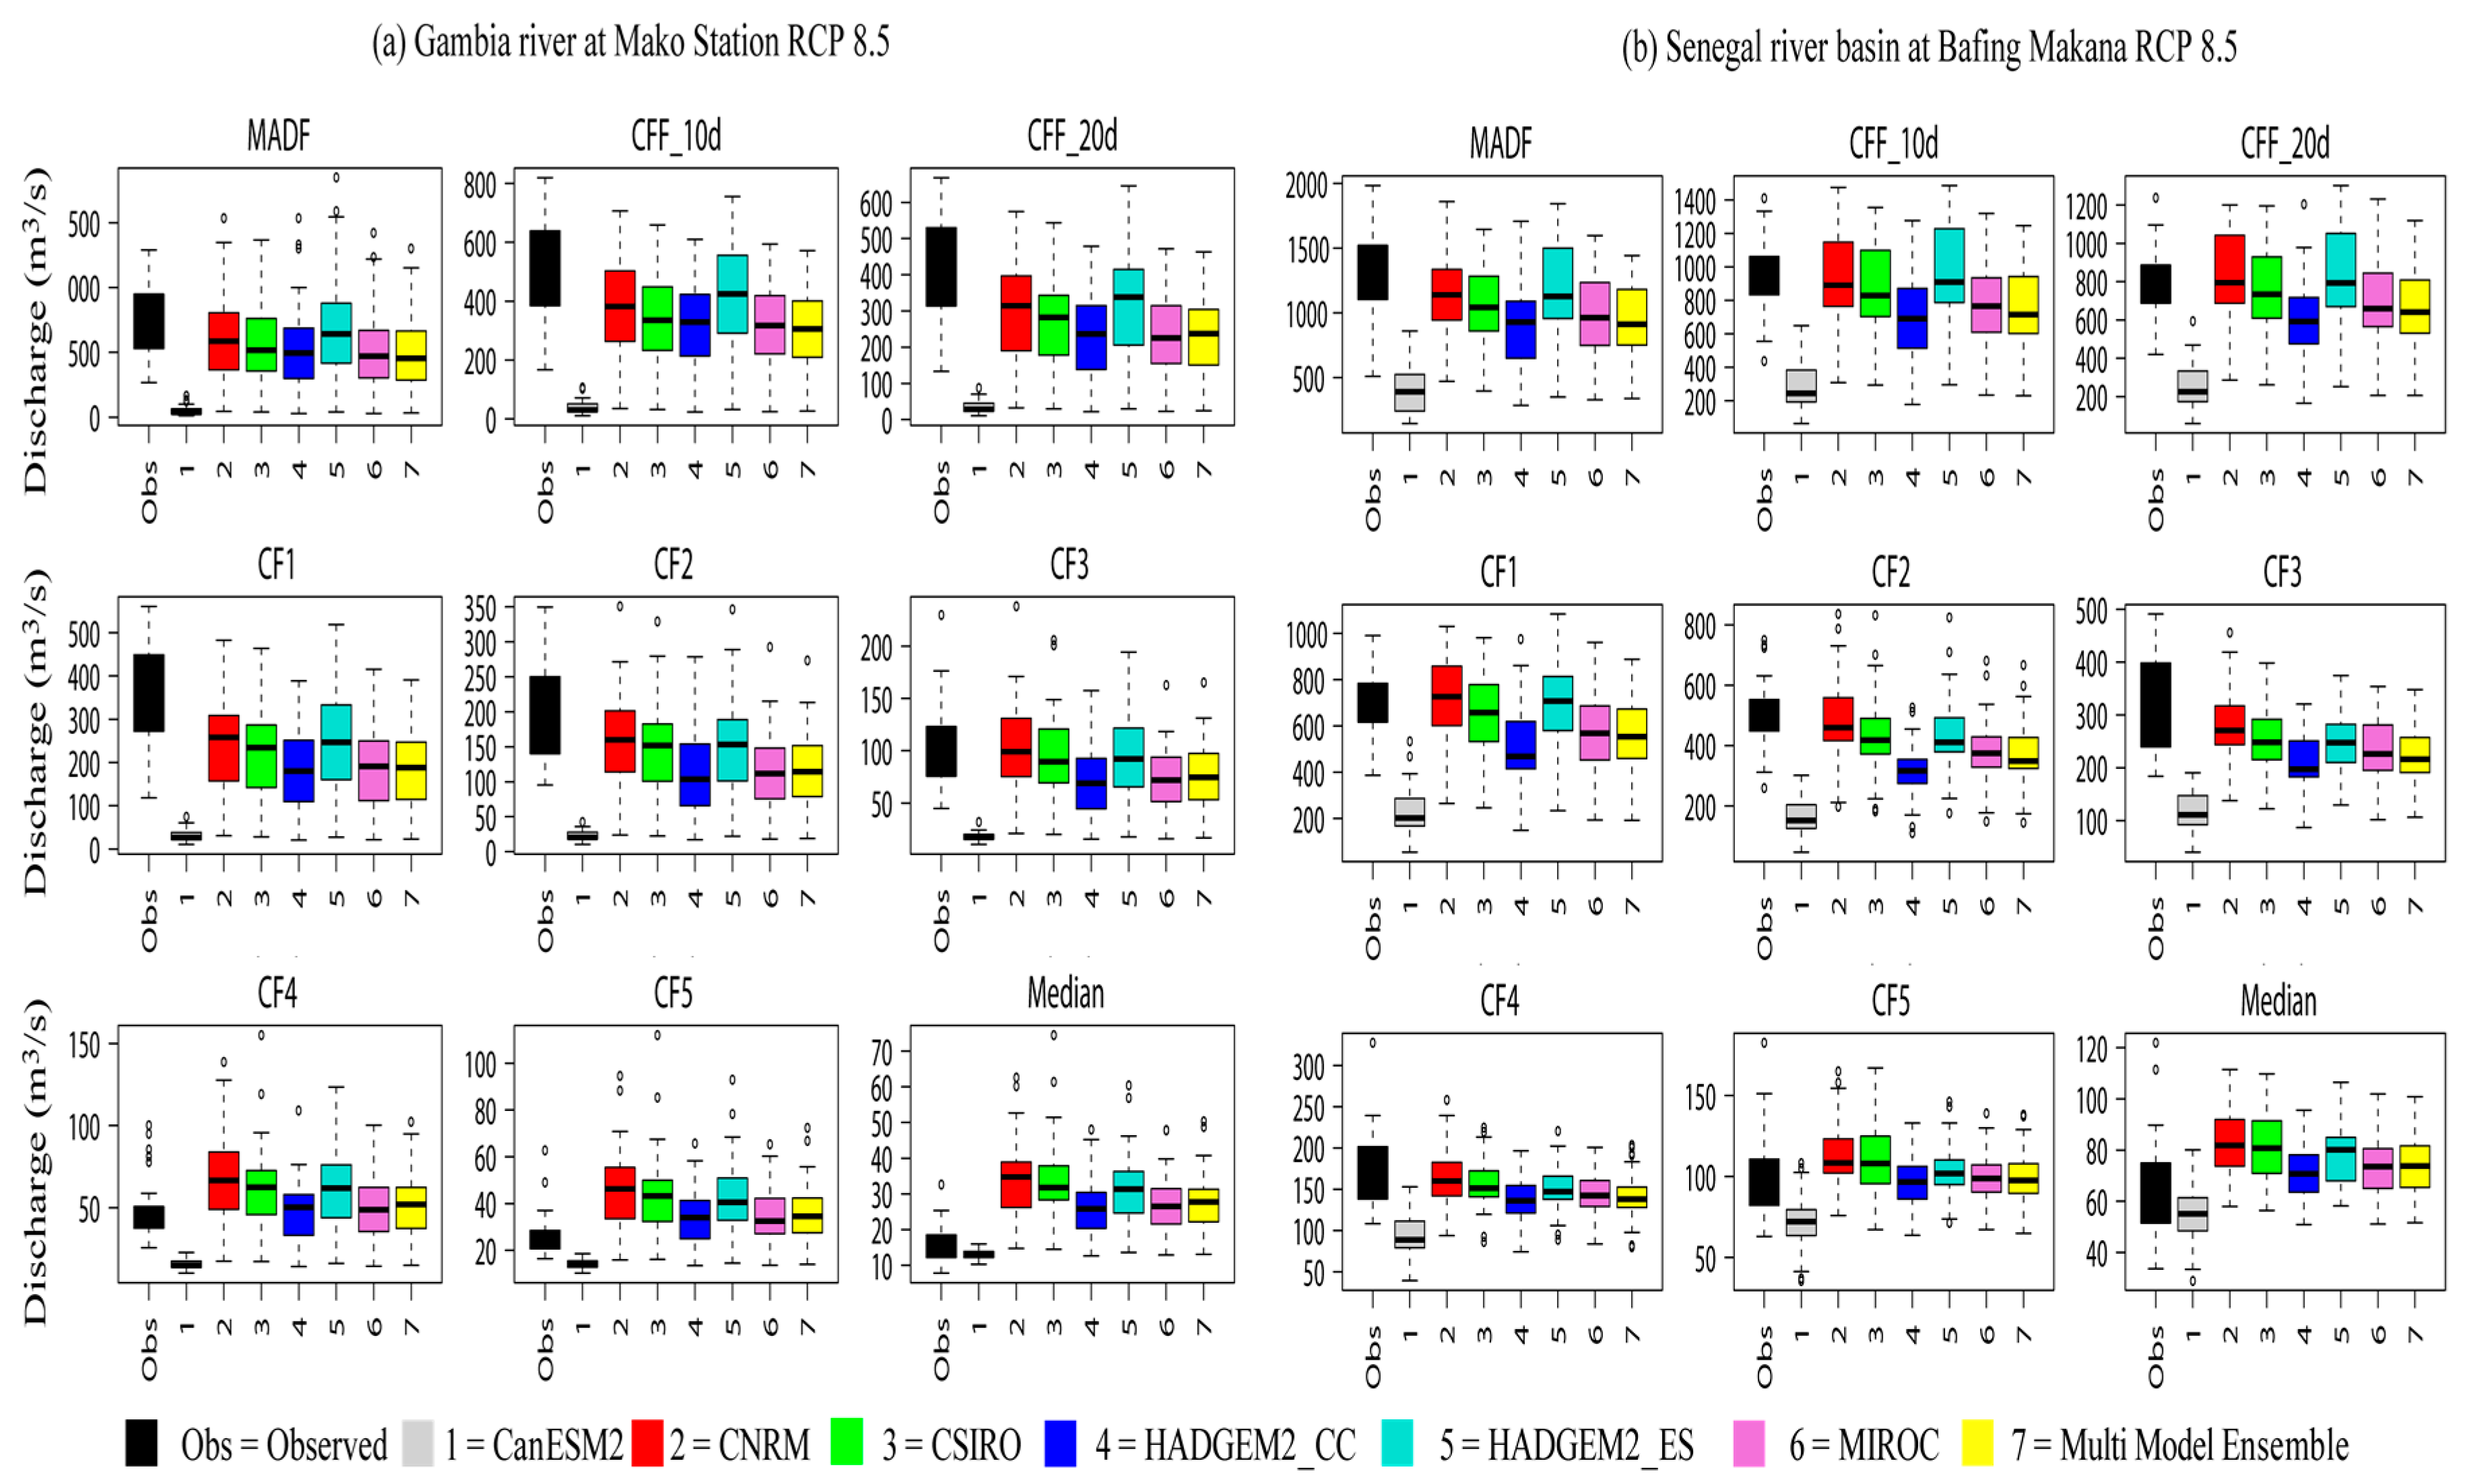
Furthermore, several characteristic flow rates (Appendix A) were calculated to evaluate their future evolution compared to the values of the 1971–2000 reference period. However, Bodian et al. [19] have shown that the GR4J model is more robust at simulating high flows than low flows. It was noticed a high percentage relative change for low flow. These high relative change values are not realistic because of the fact that climate models used simulated low rainfall in the dry season and any small increase of a low value can lead to high value of relative change. For example, an increase from 2 to 15m3/s gives a relative change of 650%; whereas an increase from 102 to 115 m3/s shows a relative change of 12.7%. Results related to flow below the median are presented in Appendix F and Appendix G. In this study, only the detail of characteristic high flows were considered. Thus, the maximum daily flow (MADF), characteristic flood flow exceeded 10 days per year (CFF_10d), characteristic flood flow exceeded20days per year (CFF_20d), characteristic flow exceeded three months in the year (CF3), characteristic flow exceeded four months in the year (CF4), characteristic flow exceeded five months in the year (CF5), and flows exceeded six months in the year (Median) were calculated to evaluate their evolution under the 2050 climate scenarios. Figure 6 and Figure 7 present a series of box plots that show the variation of the projected characteristic high flows compared to those of the 1971–2000 reference period. Appendix D and Appendix E give the predicted relative change in characteristic high flow by different GCM under RCP4.5 (Appendix D) and RCP8.5 (Appendix E). The simulation results for the Gambia River Basin projected a decrease from 93% (CanESM2 model) to 6% (HADGEM2_ES model) under RCP4.5 scenario for the near future whereas, in the Senegal River Basin, the simulation results projected a decrease from 69% (CanESM2 model) to an increase of 185% (CNRM model) under RCP8.5 scenario for the near future. Under both scenarios, multi-model ensemble (average of all models) predicted a decrease of the MADF except for the Senegal River Basin where we have an increase of 2% under RCP4.5. CanESM2 model give the highest values of stream decreasing under both scenarios for the two river basin. HADGEM2_ES model projected an increase of the MADF under both scenarios for the Senegal River Basin. In general, all models predicted a decrease of characteristic high flow (MADF, CFF_10d, CFF_20d and CF3) except the CNRM model which simulated an increase of characteristic high flow in both RCP4.5 and RCP8.5scenarios. The decrease of characteristic high flow will be more severe under RCP8.5.
4. Discussion and Conclusions
Predicting the change in water volume in river basins are crucial because it helps to have an idea of water storage of hydraulic infrastructures like the Manantali Dam. It also permits the evaluation of the adequacy between user demand and the availability of water, thus managing probable conflicts between users and sectors. For the near future (2050 horizon), compared to the 1971–2000 reference period, results showed that for the two river basins, the multi-model ensemble predicted a decrease of annual streamflow. This decrease of annual streamflow will be more pronounced in the Gambia River Basin. A combination of increase of temperature (Appendix C) and decrease in annual rainfall (Appendix B) may explain this decrease of annual streamflow. The decrease was more pronounced in the Gambia River Basin, which may be related to the greatest decrease of rainfall in that area. This decrease of streamflow is consistent with recent findings of Biao [3] in the Oueme River Basin (Benin, West Africa). In his study, he used two regional climate models (HIRHAM5 and RCA4) and the HyMoLAP hydrological model to assess the impacts of climate changes on river discharge dynamics. He showed that the projected mean annual river discharge in Bétérou and Bonou stations decreased from −25% to −39% and −20% to −37%, respectively, under RCP4.5 and from −15% to −34% and −18% to −36% under RCP8.5. These results confirm that streamflow is vastly sensitive to both temperature and rainfall [46]. However, these results are not in agreement with the finding of Angelina et al. [20] who showed an increase of mean annual flow of the Niger river basin at Koulikoro by 6.9% (2026–2050), 0.9% (2051–2075), and 5.6% (2076–2100) by using a SWAT model under the SRES A1B emissions scenario. Additionally, Azari et al. [12] showed an increase in stream-flow under RCP4.5 and RCP8.5 in the Gorganroud River basin in the North of Iran. The differences in hydrological models used as well as the area of study (difference in climate, soil, relief, land use, etc.) may be key factors determined for this difference. In fact, streamflow depends not only on climate variables but on other variables which may considerably impact the modeling results. Thus, a modeling study has to be site-specific and cannot be generalized. Faramarzi et al. [13] concluded that the African continent will experience an increase of mean annual quantity of water resources, however, they pointed out that variations (increasing or decreasing) are specific to individual sub-basins and countries. Some sub-basins may exhibit increases in mean annual runoff and others, the inverse.
It is to be noticed that GR4J gave poor results to simulate low flow. In fact, the model presents some weakness to simulate base flows because it does not fully account for groundwater and groundwater-surface flow links [21]. It is true that other models exists that properly account for surface water and ground water interactions [47,48]. Their application at the scale of the upper Senegal and Gambia River Basins is difficult due to the complexity of the hydrogeological context, as well as the scarcity of hydrogeological data. New soft computing techniques [49] may be an alternative to improve streamflow modeling and forecasting in these areas. It is hoped that future research efforts will focus in these directions to explore the application of these different methods to see if they can bring added value in the simulation of flows. Additionally, GR4J does not take into account the dynamics of land use in simulating discharge and any change in land use in the future can impact runoff [50]. Even though GR4J does not consider land use, however, with changing trends of other parameters in the river basins, like rainfall [51], the calibrated and validated model gave good accuracy in simulating the streamflow. Furthermore, the inability of the GR4J model to consider the integrated cycle of atmosphere-water-vegetation would have introduced significant uncertainty in the modeling results. For future research, it would be interesting to use hydrological models that integrate land use dynamics, like SWAT. GCM have great difficulties taking into account regional heterogeneities of variability and changes of climate, according to Biao [5]. Therefore, these models may not be suitable to produce climate projections at regional, national, and local scales, which are necessary to assess the impacts of climate change and to develop adaptation policies [52]. In recent years, some initiatives, like the Coordinated Regional Climate Downscaling Experiment (CORDEX AFRICA), have been implemented to produce climate-projected variables at regional scales from Regional Climate Models (RCM) forced by GCM outputs in the West Africa region with a spatial resolution of 50 km. In this regard, it will be interesting to compare results from GCM and RCM.
Therefore, these results must be handled with caution because of some difficulties inherent to hydrological modeling and uncertainties from climatic models and downscaling methods. Even though progress in climatic models have been noticed in recent years, there are some biases from climate output models [18] which exclude their use without applying methods of correction. The delta downscaling method used in this study gave poor results for extreme values [39]. Yet, the use of the bias correction generally has the inconvenience of not taking into account the different physical laws that govern the atmosphere [53]. However, Angelina et al. [20] showed that the quantile-quantile transformation can improve the simulation of extreme values. It is also necessary to take into account difficulties associated with the transfer of the parameters of the hydrological model on periods other than those where the model was calibrated. In fact, the values of model parameters of a climatic and environmental situation met during a period in a river basin may not be the same in a different context [54] and this may produce errors. Therefore, modeling results cannot be presented in terms of forecasting, rather as an approach on the evolution of the resource in water in terms of risk under particular hypotheses of changes of climate.
The outputs of this research suggests defining, designing, and developing suitable adaptation measures to promote resilience to climate change in order to improve water security in the two basin. This will require new policies and adaption techniques and technologies in order to better manage water resources in these basins. The particularity of the Senegal and Gambia River Basins shared by many countries requires a powerful “win-win” cooperation between all the stakeholder countries. Therefore, OMVS and OMVG will remain the ideal motor to enhance new strategies and policies to tackle the negative effect of climate change. The results indicated negative impact of climate change, particularly for the high flow, and suggest the importance of integrating this analysis into adaptive management plans and programs. This study will be helpful to decision-makers of the two river basin organizations for adaptive water resource management practices in the context of climate change. However, it is to be noticed that this research investigated the impact of climate change on streamflow and did not take into account the adequacy between availability and demand for water resources. Therefore, it will be valuable to examine how climate change will impact the different users of the Senegal and Gambia River Basin water resources and investigate the adequacy between demand and available water resources in different horizons and different scenarios. This study is a first step.
Acknowledgments
This study was funded by the University Gaston Berger through a study trip to Hydro Sciences Montpellier and to Laboratoire Mixte International TREMA (Télédétection et Ressources en Eau en Méditerranée semi-Aride), Marrakech. The authors also wish to thank the anonymous reviewers for their suggestions, which resulted in an improvement of the manuscript.
Author Contributions
Ansoumana Bodian, Alain Dezetter and Lamine Diop designed the study, developed the methodology, and wrote the manuscript. Ansoumana Bodian collected the data, and conducted the computer analysis with Alain Dezetter, while Abdoulaye Deme, Koffi Djaman, and Aliou Diop read the manuscript.
Conflicts of Interest
The authors declare no conflict of interest.
Appendix A. Characteristics Flow Rates Used
| Acronym | Description |
| MADF | Maximum Daily Flow |
| CFF_10d | Characteristic Flood Flow exceeded 10 day per year |
| CFF_20d | Characteristic Flood Flow exceeded 20 day per year |
| CF1 | Characteristic Flow exceeded 1 months in the year |
| CF2 | Characteristic Flow exceeded 2 months in the year |
| CF3 | Characteristic Flow exceeded 3 months in the year |
| CF4 | Characteristic Flow exceeded 4 months in the year |
| CF5 | Characteristic Flow exceeded 5 months in the year |
| Median | Flows exceeded six months in the year |
| CF7 | Characteristic Flow exceeded 7 months in the year |
| CF8 | Characteristic Flow exceeded 8 months in the year |
| CF9 | Characteristic Flow exceeded 9 months in the year |
| CF10 | Characteristic Flow exceeded 10 months in the year |
| CF11 | Characteristic Flow exceeded 11 months in the year |
| CLF_20d | Characteristic Low Flow on a 20-day period |
| CLF_10d | Characteristic Low Flow on a 10-day period |
| MDF | Minimum Daily Flow |
Appendix B
Figure A1.
Relative change of annual rainfall in the two river basins under RCP4.5 and RCP8.5.
Appendix C
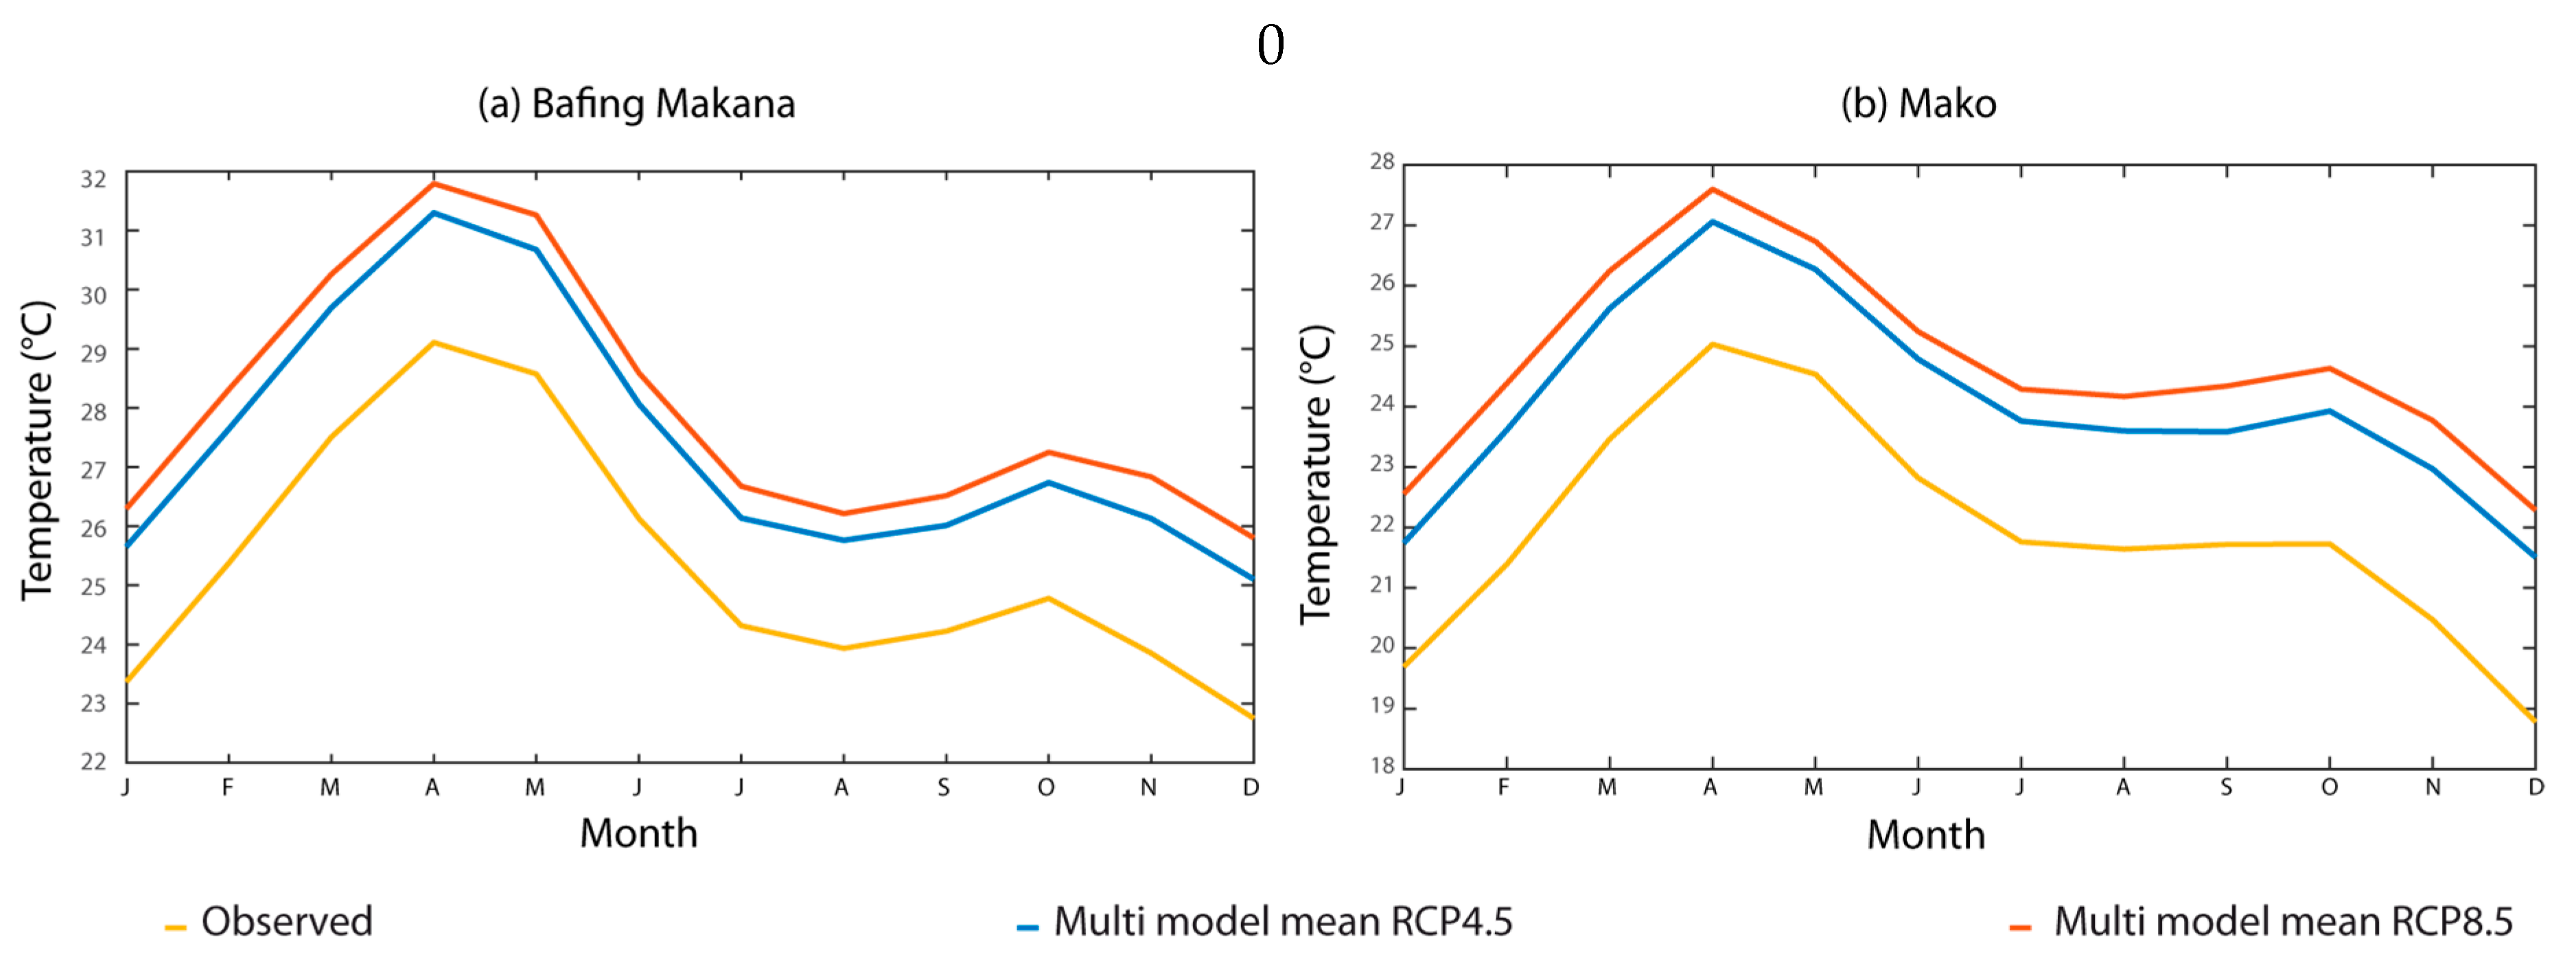
Figure A2.
Projected temperature at Bafing Makana (a) and Mako (b) under RCP4.5 and RCP8.5.
Appendix D

Table A1.
Relative change in characteristic high flow for different used GCM under RCP4.5.
| River Basin | Flow Rates | CanESM2 | CNRM | CSIRO | HadGEM2-CC | HadGEM2-ES | MIROC5 | Multi Model Ensemble |
|---|---|---|---|---|---|---|---|---|
| Gambia river RCP4.5 | MADF | −0.69 | −0.10 | −0.21 | −0.35 | −0.15 | −0.11 | −0.27 |
| CFF_10d | −0.72 | −0.22 | −0.31 | −0.44 | −0.26 | −0.25 | −0.37 | |
| CFF_20d | −0.72 | −0.25 | −0.33 | −0.48 | −0.29 | −0.30 | −0.40 | |
| CF1 | −0.72 | −0.25 | −0.32 | −0.50 | −0.29 | −0.32 | −0.40 | |
| CF2 | −0.77 | −0.41 | −0.46 | −0.62 | −0.44 | −0.48 | −0.53 | |
| CF3 | −0.63 | 0.03 | −0.10 | −0.38 | −0.03 | −0.13 | −0.21 | |
| CF4 | −0.45 | 0.36 | 0.19 | −0.15 | 0.30 | 0.17 | 0.07 | |
| CF5 | −0.29 | 0.55 | 0.38 | 0.03 | 0.48 | 0.37 | 0.25 | |
| Median | −0.17 | 0.59 | 0.44 | 0.15 | 0.52 | 0.44 | 0.33 | |
| Senegal river RCP4.5 | MADF | −0.52 | 1.00 | −0.08 | −0.18 | 0.16 | −0.10 | 0.02 |
| CFF_10d | −0.47 | 1.03 | −0.08 | −0.18 | 0.16 | −0.09 | 0.01 | |
| CFF_20d | −0.45 | 1.01 | −0.09 | −0.21 | 0.21 | −0.09 | 0.01 | |
| CF1 | −0.44 | 1.04 | −0.11 | −0.22 | 0.24 | −0.09 | 0.01 | |
| CF2 | −0.44 | 0.92 | −0.17 | −0.27 | 0.38 | −0.10 | 0.00 | |
| CF3 | −0.36 | 0.55 | −0.16 | −0.20 | 0.31 | −0.07 | −0.01 | |
| CF4 | −0.22 | 0.34 | −0.13 | −0.12 | 0.20 | −0.06 | 0.00 | |
| CF5 | −0.08 | 0.27 | −0.12 | −0.11 | 0.22 | −0.08 | 0.01 | |
| Median | 0.02 | 0.27 | −0.11 | −0.12 | 0.24 | −0.08 | 0.00 |
Appendix E
Table A2.
Relative change in characteristic high flow for different used GCM under RCP8.5.
| River Basin | Flow Rates | CanESM2 | CNRM | CSIRO | HadGEM2-CC | HadGEM2-ES | MIROC5 | Multi Model Ensemble |
|---|---|---|---|---|---|---|---|---|
| Gambia river RCP8.5 | MADF | −0.93 | −0.17 | −0.23 | −0.28 | −0.06 | −0.30 | −0.33 |
| CFF_10d | −0.92 | −0.26 | −0.32 | −0.39 | −0.20 | −0.40 | −0.42 | |
| CFF_20d | −0.92 | −0.28 | −0.34 | −0.44 | −0.23 | −0.43 | −0.44 | |
| CF1 | −0.91 | −0.30 | −0.35 | −0.48 | −0.28 | −0.46 | −0.46 | |
| CF2 | −0.89 | −0.19 | −0.25 | −0.43 | −0.22 | −0.40 | −0.40 | |
| CF3 | −0.83 | 0.00 | −0.08 | −0.32 | −0.10 | −0.30 | −0.27 | |
| CF4 | −0.69 | 0.38 | 0.30 | −0.01 | 0.26 | 0.00 | 0.04 | |
| CF5 | −0.48 | 0.75 | 0.69 | 0.30 | 0.63 | 0.32 | 0.37 | |
| Median | −0.19 | 1.12 | 1.11 | 0.66 | 0.98 | 0.68 | 0.73 | |
| Senegal river RCP8.5 | MADF | −0.69 | 1.85 | −0.07 | −0.17 | 0.33 | −0.19 | −0.02 |
| CFF_10d | −0.69 | 2.13 | −0.07 | −0.18 | 0.32 | −0.18 | −0.03 | |
| CFF_20d | −0.67 | 2.08 | −0.06 | −0.20 | 0.35 | −0.17 | −0.03 | |
| CF1 | −0.67 | 2.08 | −0.08 | −0.23 | 0.39 | −0.16 | −0.04 | |
| CF2 | −0.67 | 1.91 | −0.10 | −0.27 | 0.36 | −0.13 | −0.03 | |
| CF3 | −0.62 | 1.37 | −0.10 | −0.18 | 0.20 | −0.07 | −0.03 | |
| CF4 | −0.46 | 0.77 | −0.06 | −0.11 | 0.09 | −0.04 | −0.02 | |
| CF5 | −0.31 | 0.59 | −0.03 | −0.13 | 0.08 | −0.04 | −0.01 | |
| Median | −0.19 | 0.54 | −0.02 | −0.13 | 0.11 | −0.07 | 0.01 |
Appendix F
Table A3.
Relative change in flows below the median for different chosen GCM under RCP4.5.
| River Basin | Flow Rates | CanESM2 | CNRM | CSIRO | HadGEM2-CC | HadGEM2-ES | MIROC5 | Multi Model Ensemble |
|---|---|---|---|---|---|---|---|---|
| Gambia river RCP4.5 | MDF | 1160.4 | 1341.3 | 1298.5 | 1238.6 | 1304.0 | 1304.4 | 1274.5 |
| CLF_10d | 625.6 | 733.9 | 709.9 | 673.2 | 711.7 | 713.0 | 694.5 | |
| CLF_20d | 397.7 | 475.6 | 460.7 | 431.9 | 461.7 | 461.2 | 448.1 | |
| CF7 | 0.8 | 2.0 | 1.8 | 1.3 | 1.9 | 1.7 | 1.6 | |
| CF 8 | 2.2 | 4.0 | 3.7 | 2.9 | 3.8 | 3.6 | 3.4 | |
| CF 9 | 7.2 | 10.6 | 10.0 | 8.7 | 10.1 | 9.9 | 9.4 | |
| CF 10 | 35.6 | 48.1 | 45.9 | 41.4 | 45.8 | 45.7 | 43.8 | |
| CF 11 | 253.2 | 310.1 | 301.1 | 277.8 | 299.6 | 298.3 | 290.0 | |
| Senegal river RCP4.5 | MDF | 2.68 | 2.99 | 3.02 | 2.70 | 3.02 | 2.96 | 2.89 |
| CLF_10d | 2.61 | 2.93 | 2.95 | 2.63 | 2.96 | 2.89 | 2.83 | |
| CLF_20d | 2.44 | 2.75 | 2.76 | 2.43 | 2.77 | 2.71 | 2.64 | |
| CF7 | 0.00 | 0.22 | 0.11 | −0.02 | 0.20 | 0.11 | 0.10 | |
| CF 8 | 0.29 | 0.54 | 0.44 | 0.26 | 0.52 | 0.44 | 0.41 | |
| CF 9 | 1.05 | 1.36 | 1.26 | 0.97 | 1.35 | 1.25 | 1.20 | |
| CF 10 | 1.93 | 2.29 | 2.20 | 1.85 | 2.29 | 2.19 | 2.12 | |
| CF 11 | 2.36 | 2.69 | 2.67 | 2.31 | 2.70 | 2.64 | 2.56 |
Appendix G
Table A4.
Relative change in flows below the median for different chosen GCM under RCP8.5.
| River Basin | Flow Rates | CanESM2 | CNRM | CSIRO | HadGEM2-CC | HadGEM2-ES | MIROC5 | Multi Model Ensemble |
|---|---|---|---|---|---|---|---|---|
| Gambia river RCP8.5 | MDF | 1078.0 | 1324.3 | 1296.9 | 1245.6 | 1303.4 | 1256.8 | 1250.8 |
| CLF_10d | 578.1 | 724.3 | 709.4 | 676.4 | 712.5 | 684.3 | 680.8 | |
| CLF_20d | 366.2 | 468.9 | 460.5 | 434.0 | 461.9 | 439.7 | 438.5 | |
| CF7 | 0.4 | 2.0 | 2.0 | 1.4 | 1.8 | 1.4 | 1.5 | |
| CF 8 | 1.7 | 3.9 | 3.8 | 3.0 | 3.7 | 3.1 | 3.2 | |
| CF 9 | 6.1 | 10.3 | 10.2 | 8.8 | 10.0 | 9.0 | 9.1 | |
| CF 10 | 32.0 | 47.0 | 46.2 | 41.9 | 45.7 | 42.5 | 42.6 | |
| CF 11 | 232.2 | 304.2 | 302.1 | 278.9 | 299.9 | 283.2 | 283.4 | |
| Senegal river RCP8.5 | MDF | 2.3 | 2.9 | 3.1 | 2.7 | 3.0 | 2.9 | 2.8 |
| CLF_10d | 2.3 | 2.9 | 3.0 | 2.7 | 3.0 | 2.8 | 2.8 | |
| CLF_20d | 2.1 | 2.7 | 2.8 | 2.5 | 2.8 | 2.6 | 2.6 | |
| CF7 | −0.2 | 0.2 | 0.2 | 0.0 | 0.1 | 0.1 | 0.1 | |
| CF 8 | 0.1 | 0.5 | 0.5 | 0.3 | 0.5 | 0.4 | 0.4 | |
| CF 9 | 0.7 | 1.3 | 1.4 | 1.1 | 1.3 | 1.2 | 1.1 | |
| CF 10 | 1.5 | 2.2 | 2.3 | 2.0 | 2.2 | 2.1 | 2.1 | |
| CF 11 | 2.0 | 2.6 | 2.8 | 2.4 | 2.7 | 2.5 | 2.5 |
References
- Kankam-Yeboah, K.; Obuobie, E.; Amisigo, B.; Opoku-Ankomah, Y. Impact of climate change on streamflow in selected river basins in Ghana. Hydrol. Sci. J. 2013, 58, 773–788. [Google Scholar] [CrossRef]
- Milano, M.; Ruelland, D.; Fernandez, S.; Dezetter, A.; Fabre, J.; Servat, E. Facing climatic and anthropogenic changes in the Mediterranean basin: What will be the medium-term impact on water stress? C. R. Geosci. 2012, 344, 432–440. [Google Scholar] [CrossRef]
- Milano, M.; Ruelland, D.; Dezetter, A.; Fabre, J.; Ardoin-Bardin, S.; Servat, E. Modeling the current and future capacity of water resources to meet water demands in the Ebro basin. J. Hydrol. 2013, 500, 114–126. [Google Scholar] [CrossRef]
- Setegn, S.G.; Rayner, D.; Melesse, A.M.; Dargahi, B.; Srinivasan, R. Impact of climate change on the hydroclimatology of Lake Tana Basin, Ethiopia. Water Resour. Res. 2011, 47. [Google Scholar] [CrossRef]
- Biao, E.I. Assessing the Impacts of Climate Change on River Discharge Dynamics in Oueme River Basin (Benin, West Africa). Hydrology 2017, 4, 47. [Google Scholar] [CrossRef]
- Shrestha, N.K.; Wang, J. Predicting sediment yield and transport dynamics of a cold climate region watershed in changing climate. Sci. Total Environ. 2018, 625, 1030–1045. [Google Scholar] [CrossRef]
- Zabaleta, A.; Meaurio, M.; Ruiz, E.; Antigüedad, I. Simulation Climate Change Impact on Runoff and Sediment Yield in a Small Watershed in the Basque Country, Northern Spain. J. Environ. Qual. 2014, 43, 235–245. [Google Scholar] [CrossRef] [PubMed]
- Ali, S.; Liu, Y.; Ishaq, M.; Shah, T.; Ilyas, A.; Din, I.U. Climate Change and Its Impact on the Yield of Major Food Crops: Evidence from Pakistan. Foods 2017, 6, 39. [Google Scholar] [CrossRef] [PubMed]
- Shrestha, L.; Shrestha, N.K. Assessment of climate change impact on crop yield and irrigation water requirement of two major cereal crops (rice and wheat) in Bhaktapur district, Nepal. J. Water Clim. Chang. 2017, 8, 320–335. [Google Scholar] [CrossRef]
- Hosseini, N.; Johnston, J.; Lindenschmidt, K.-E. Impacts of Climate Change on the Water Quality of a Regulated Prairie River. Water 2017, 9, 199. [Google Scholar] [CrossRef]
- Intergovernmental Panel on Climate Change (IPCC). Climate Change 2007; Synthesis Report; Cambridge Press: Cambridge, UK, 2007. [Google Scholar]
- Azari, M.; Moradi, H.R.; Saghafian, B.; Faramarzi, M. Climate change impacts on streamflow and sediment yield in the North of Iran. Hydrol. Sci. J. 2016, 61, 123–133. [Google Scholar] [CrossRef]
- Faramarzi, M.; Abbaspour, K.C.; Vaghefi, S.A.; Farzaneh, M.R.; Zehnder, A.J.; Srinivasan, R.; Yang, H. Modeling impacts of climate change on freshwater availability in Africa. J. Hydrol. 2013, 480, 85–101. [Google Scholar] [CrossRef]
- McBean, E.; Motiee, H. Assessment of impact of climate change on water resources: A long term analysis of the Great Lakes of North America. Hydrol. Earth Syst. Sci. Discuss. 2008, 12, 239–255. [Google Scholar] [CrossRef]
- Roudier, P.; Ducharne, A.; Feyen, L. Climate change impacts on runoff in West Africa: A review. Hydrol. Earth Syst. Sci. 2014, 18, 2789–2801. [Google Scholar] [CrossRef]
- Bodian, A.; Dezetter, A.; Dacosta, H.; Ardoin-Bardin, S. Impact du changement climatique sur les ressources en eau du haut bassin du fleuve Sénégal. Rev. Géogr. Lab. Leïd. 2013, 2515, 236–251. (In French) [Google Scholar]
- Mbaye, M.L.; Haensler, A.; Hagemann, S.; Gaye, A.T.; Moseley, C.; Afouda, A. Impact of statistical bias correction on the projected climate change signals of the regional climate model REMO over the Senegal River Basin. Am. J. Clim. Chang. 2015, 4, 77–93. [Google Scholar] [CrossRef]
- Ardoin-Bardin, S.; Dezetter, A.; Servat, E.; Paturel, J.E.; Mahé, G.; Niel, H.; Dieulin, C. Using General Circulation Model Outputs to Assess Impacts of Climate Change on Runoff for Large Hydrological Catchments in West Africa. Hydrol. Sci. J. 2009, 54, 77–89. [Google Scholar] [CrossRef]
- Bodian, A.; Dezetter, A.; Deme, A.; Diop, L. Hydrological Evaluation of TRMM Rainfall over the Upper Senegal River Basin. Hydrology 2016, 3, 15. [Google Scholar] [CrossRef]
- Angelina, A.; Djibo, A.G.; Seidou, O.; Seidou, I.S.; Sittichok, K. Changes to flow regime on the Niger River at Koulikoro under a changing climate. Hydrol. Sci. J. 2015, 60, 1709–1723. [Google Scholar] [CrossRef]
- Fabre, J.; Ruelland, D.; Dezetter, A.; Grouillet, B. Simulating past changes in the balance between water demand and availability and assessing their main drivers at the river basin scale. Hydrol. Earth Syst. Sci. 2015, 19, 1263. [Google Scholar] [CrossRef]
- Perrin, C.; Michel, C.; Andréassian, V. Improvement of a parsimonious model for streamflow simulation. J. Hydrol. 2003, 279, 275–289. [Google Scholar] [CrossRef]
- Le Lay, M. Modélisation Hydrologique Dans un Contexte de Variabilité Hydro-Climatique. Une Approche Comparative Pour L’étude du Cycle Hydrologique à Méso-Échelle au Bénin. Ph.D. Thesis, Institut National Polytechnique de Grenoble, Laboratoire d’études des Transferts en Hydrologie et Environnement, Grenoble, France, February 2006. (In French). [Google Scholar]
- Amoussou, E.; Tramblay, Y.; Totin, H.S.V.; Mahé, G.; Camberlin, P. Dynamique et modélisation des crues dans le bassin du Mono à Nangbéto (Togo/Bénin). Hydrol. Sci. J. 2014, 59, 2060–2071. (In French) [Google Scholar] [CrossRef]
- NkaNnomo, B. Contribution à l’Actualisation des Normes Hydrologiques en Relation Avec les Changements Climatiques et Environnementaux en Afrique de l’Ouest. Ph.D. Thesis, Université Pierre et Marie Curie-Paris VI, Paris, France, January 2016. (In French). [Google Scholar]
- Collet, L. Capacité à Satisfaire la Demande en eau Sous Contraintes Climatique et Anthropique sur un Bassin Versant Méditerranéen. Ph.D. Thesis, Université de MontpellierII, Montpellier, Hérault, France, November 2013. (In French). [Google Scholar]
- Bodian, A.; Dezetter, A.; Dacosta, H. Rainfall-Runoff Modelling of Water Resources in the Upper Senegal River Basin. Int. J. Water Resour. Dev. 2015, 32, 89–101. [Google Scholar] [CrossRef]
- Oudin, L.; Hervieu, F.; Michel, C.; Perrin, C.; Andréassian, V.; Anctil, F.; Loumagne, C. Which potential evapotranspiration input for a lumped rainfall–runoff model? Part 2—Towards a simple and efficient potential evapotranspiration model for rainfall–runoff modelling. J. Hydrol. 2005, 303, 290–306. [Google Scholar] [CrossRef]
- Allen, R.; Pereira, G.L.S.; Raes, D.; Smith, M. Crop Evapotranspiration: Guidelines for Computing Crop Water Requirements; FAO Irrigation and Drainage Paper 56; Food and Agriculture Organization: Rome, Italy, 1998; p. 300. [Google Scholar]
- Ben Khediri, W.; Drogue, G. Quel est l’impact de l’échantillonnage spatial des précipitations et de l’évapotranspiration potentielle sur le pouvoir prédictif d'un modèle hydrologique empirique? Climatologie 2015, 12, 1–24. (In French) [Google Scholar] [CrossRef]
- Ardoin, S.; Dezetter, A.; Servat, E.; Bocquillon, C. Redéfinition des fonctions de production des modèles globaux de relation pluie–débit en milieu semi-aride africain. C. R. l'Acad. Sci. Ser. IIA Earth Planet. Sci. 2001, 333, 611–616. [Google Scholar] [CrossRef]
- Rosenbrock, H.H. An automatic method for finding the greatest or least value of a function. Comput. J. 1960, 3, 175–184. [Google Scholar] [CrossRef]
- Nelder, J.A.; Mead, R.A. Simplex method for function minimization. Comput. J. 1965, 7, 308–313. [Google Scholar] [CrossRef]
- Dezetter, A.; Fabre, J.; Ruelland, D.; Servat, E. Selecting an optimal climatic dataset for integrated modelling of the Ebro hydrosystem. In Hydrology in a Changing World: Environmental and Human Dimensions Proceedings of FRIEND-Water; IAHS Press: Montpellier, France, 2014. [Google Scholar]
- Marek, G.W.; Gowda, P.H.; Evett, S.R.; Baumhardt, R.L.; Brauer, D.K.; Howell, T.A.; Srinivasan, R. Calibration and validation of the SWAT model for predicting daily ET over irrigated crops in the Texas High Plains using lysimetric data. Am. Soc. Agric. Biol. Eng. 2016, 59, 611–622. [Google Scholar] [CrossRef]
- Ruelland, D.; Ardoin-Bardin, S.; Collet, L.; Roucou, P. Simulating future trends in hydrological regime of a large Sudano-Sahelian catchment under climate change. J. Hydrol. 2012, 424–425, 207–216. [Google Scholar] [CrossRef]
- Shrestha, B.; Babel, M.S.; Maskey, S.; Griensven, A.V.; Uhlenbrook, S.; Green, A.; Akkharath, I. Impact of climate change on sediment yield in the Mekong River basin: A case study of the Nam Ou basin, Lao PDR. Hydrol. Earth Syst. Sci. 2013, 17, 1–20. [Google Scholar] [CrossRef]
- Intergovernmental Panel on Climate Change (IPCC). Climate Change Synthesis Report: Fifth Assessment Report of the Intergovernmental Panel on Climate Change; Core Writing Team, Pachauri, R.K., Meyer, L., Eds.; IPCC: Geneva, Switzerland, 2014; p. 133. [Google Scholar]
- Taylor, K.E.; Stouffer, R.J.; Meehl, G.A. An overview of CMIP5 and the experiment design. Bull. Am. Meteorol. Soc. 2012, 93, 485. [Google Scholar] [CrossRef]
- Van Vuuren, D.P.; Edmonds, J.; Kainuma, M.; Riahi, K.; Thomson, A.; Hibbard, K.; Masui, T. The representative concentration pathways: An overview. Clim. Chang. 2011, 109, 5–31. [Google Scholar] [CrossRef]
- Park, C.-K.; Byun, H.; Deo, R.; Lee, B.R. Drought prediction till 2100 under RCP 8.5 climate change scenarios for Korea. J. Hydrol. 2015, 526, 221–230. [Google Scholar] [CrossRef]
- Su, B.; Zeng, X.; Zhai, J.; Wang, Y.; Li, X. Projected precipitation and stream flow under SRES and RCP emission scenarios in the Songhuajiang River basin, China. Quat. Int. 2014, 380–381, 95–105. [Google Scholar]
- Maraun, D.; Wetterhall, F.; Ireson, A.M.; Chandler, R.E.; Kendon, E.J.; Widmann, M.; Venema, V.K.C. Precipitation downscaling under climate change: Recent developments to bridge the gap between dynamical models and the end user. Rev. Geophys. 2010, 48. [Google Scholar] [CrossRef] [Green Version]
- Teutschbein, C.; Wetterhall, F.; Seibert, J. Evaluation of different downscaling techniques for hydrological climate-change impact studies at the catchment scale. Clim. Dyn. 2011, 37, 2087–2105. [Google Scholar] [CrossRef]
- Hamlet, A.F.; Elsner, M.M.; Mauger, G.S.; Lee, S.Y.; Tohver, I.; Norheim, R.A. An overview of the Columbia Basin Climate Change Scenarios Project: Approach, methods, and summary of key results. Atmosphere-Ocean 2013, 51, 392–415. [Google Scholar] [CrossRef]
- Saha, P.P.; Zeleke, K. Rainfall-Runoff modelling for sustainable water resources management: SWAT model review in Australia. In Sustainability of Integrated Water Resources Management; Springer International Publishing: Berlin, Germany, 2015; pp. 563–578. [Google Scholar]
- Pulido-Velazquez, D.; Sahuquillo, A.; Andreu, J.; Pulido-Velazquez, M. An efficient conceptual model to simulate water body-aquifer interaction in Conjunctive Use Management Model. Water Resour. Res. 2007, 43. [Google Scholar] [CrossRef]
- Pulido-Velazquez, D.; Sahuquillo, A.; Andreu, J. A conceptual-numerical model to simulate hydraulic head in aquifers that are hydraulically connected to surface water bodies. Hydrol. Processes 2012, 26, 1435–1448. [Google Scholar] [CrossRef]
- Yaseen, Z.M.; Ebtehaj, I.; Bonakdari, H.; Deo, R.C.; Mehr, A.D.; Mohtar, W.H.M.W.; Diop, L.; El-shafie, A.; Singh, V.P. Novel approach for streamflow forecasting using a hybrid ANFIS-FFA model. J. Hydrol. 2017, 554, 263–276. [Google Scholar] [CrossRef]
- D’Herbès, J.-M.; Valentin, C. Land surface conditions of the Niamey region: Ecological and hydrological implications. J. Hydrol. 1997, 188, 18–42. [Google Scholar] [CrossRef]
- Bodian, A.; Ndiaye, O.; Dacosta, H. Evolution des caractéristiques des pluies journalières dans le bassin versant du fleuve Sénégal: Avant et après rupture. Hydrol. Sci. J. 2016, 61, 905–913. (In French) [Google Scholar] [CrossRef]
- Ehret, U.; Zehe, E.; Wulfmeyer, V.; Warrach-Sagi, K.; Liebert, J. Should we apply bias correction to global and regional climate model data? Hydrol. Earth Syst. Sci. Discuss. 2012, 9, 5355–5387. [Google Scholar] [CrossRef]
- Paeth, H.; Hall, N.M.; Gaertner, M.A.; Alonso, M.D.; Moumouni, S.; Polcher, J.; Ruti, P.M.; Fink, A.H.; Gosset, M.; Lebel, T. Progress in regional downscaling of West African precipitation. Atmos. Sci. Lett. 2011, 12, 75–82. [Google Scholar] [CrossRef]
- Coron, L.; Andréassian, V.; Perrin, C.; Lerat, J.; Vaze, J.; Bourqui, M.; Hendrickx, F. Crash testing hydrological models in contrasted climate conditions: An experiment on 216 Australian catchments. Water Resour. Res. 2012, 48. [Google Scholar] [CrossRef]
Figure 1.
Situation map of the river basins.
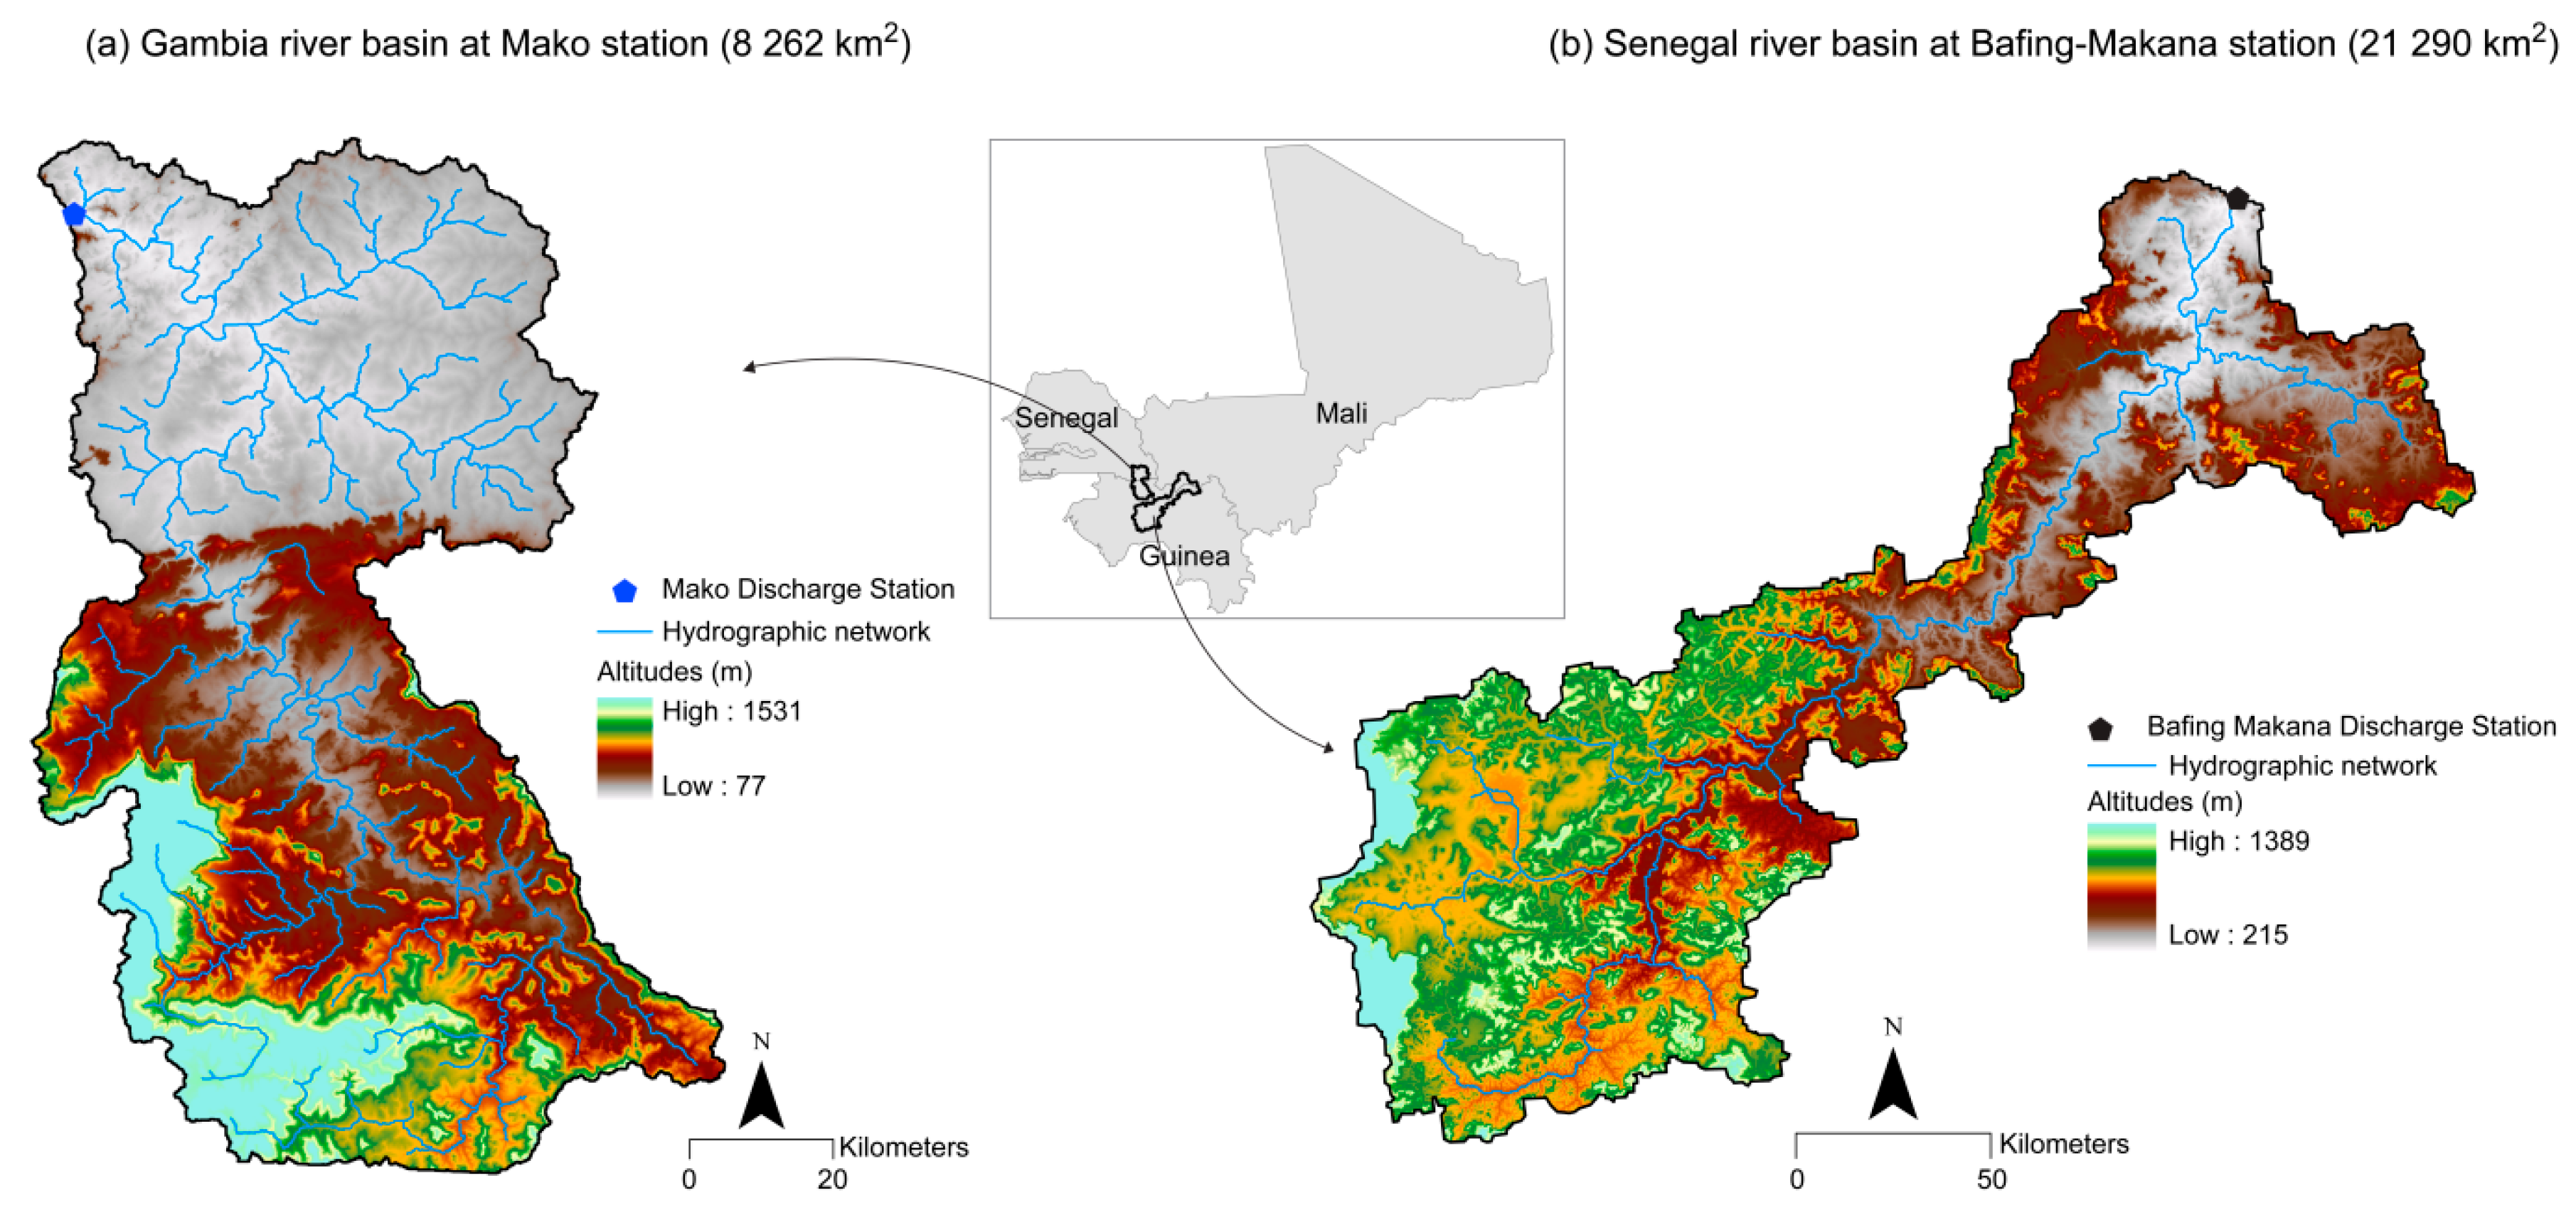
Figure 2.
Conceptual scheme of the GR4J model [22].
Figure 2.
Conceptual scheme of the GR4J model [22].

Figure 3.
Comparison of observed and simulated hydrographs at Mako station (NSE is the Nash Sutcliffe coefficient, VE is the cumulative volume error, VEm is the yearly mean volume error, and Fagg is the multi-criteria aggregating function).
Figure 3.
Comparison of observed and simulated hydrographs at Mako station (NSE is the Nash Sutcliffe coefficient, VE is the cumulative volume error, VEm is the yearly mean volume error, and Fagg is the multi-criteria aggregating function).

Figure 4.
Comparison of observed and simulated hydrographs at Bafing Makana station (NSE is the Nash Sutcliffe coefficient, VE is the cumulative volume error, VEm is the yearly mean volume error, and Fagg is the multi-criteria aggregating function).
Figure 4.
Comparison of observed and simulated hydrographs at Bafing Makana station (NSE is the Nash Sutcliffe coefficient, VE is the cumulative volume error, VEm is the yearly mean volume error, and Fagg is the multi-criteria aggregating function).

Figure 5.
Relative change of mean annual streamflow for the two river basins under RCP4.5 (a) and RCP8.5 (b).
Figure 5.
Relative change of mean annual streamflow for the two river basins under RCP4.5 (a) and RCP8.5 (b).

Figure 6.
Evolution of characteristic flow rates by 2050 under the RCP4.5 scenario.
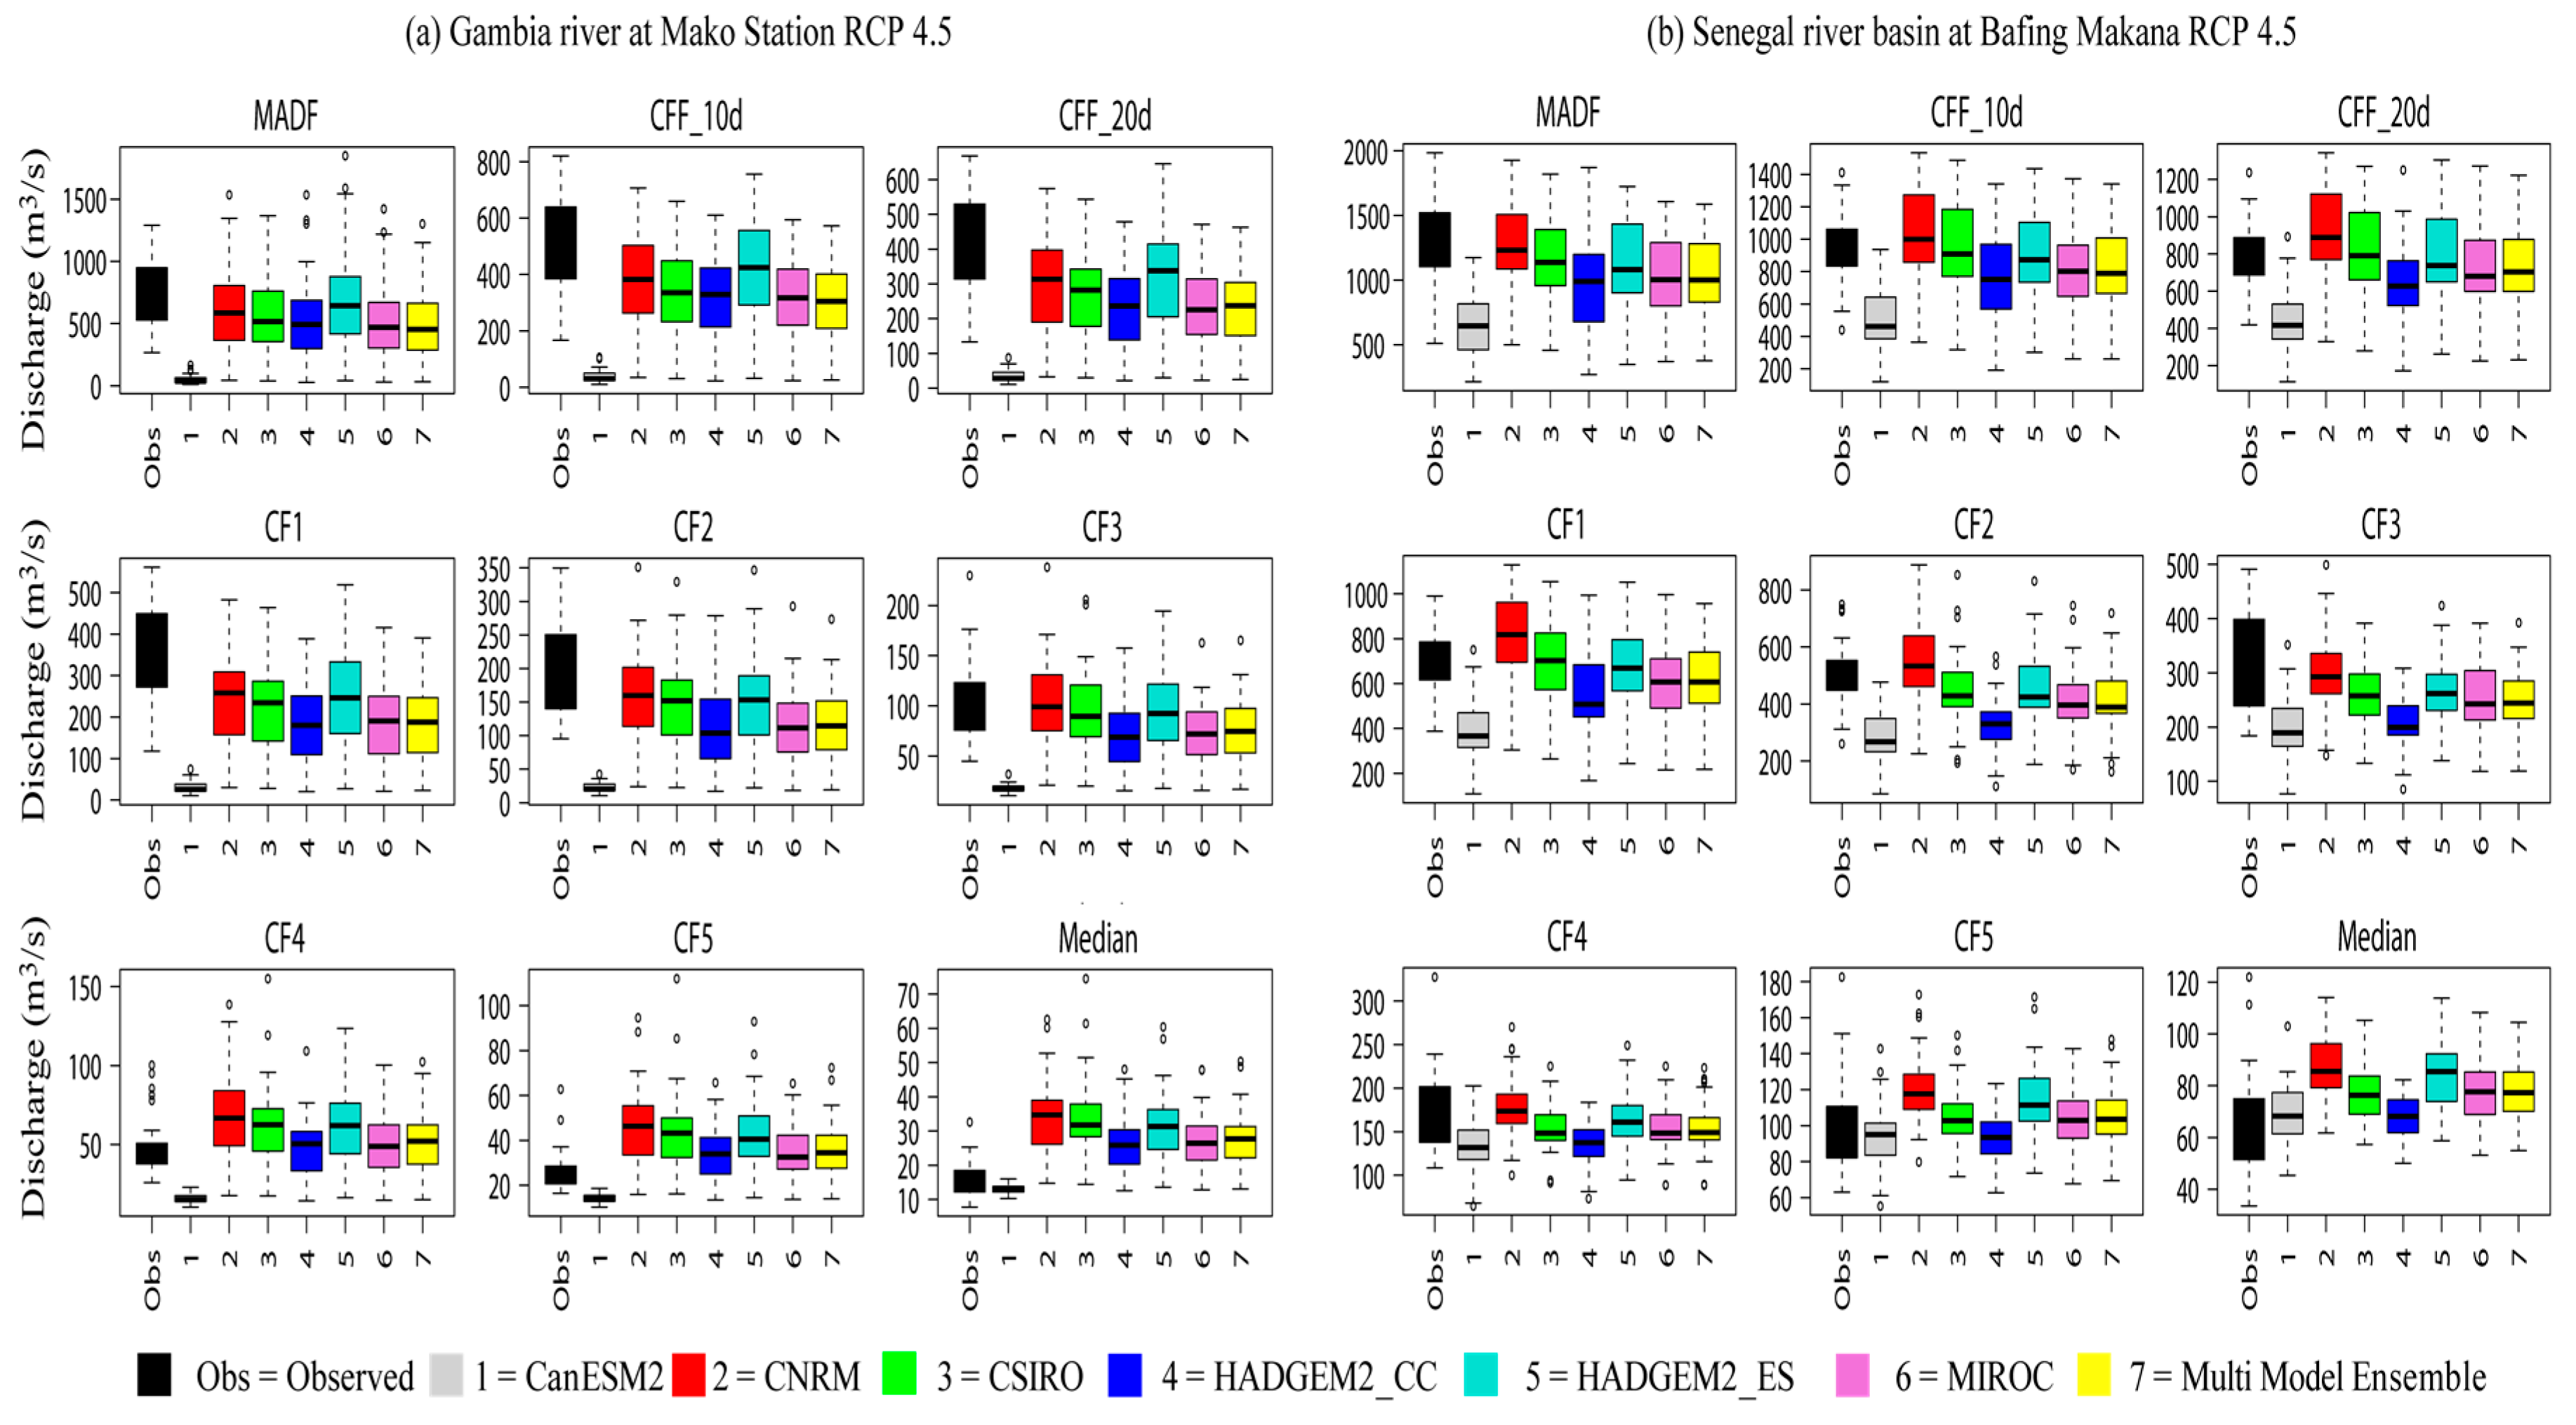
Figure 7.
Evolution of characteristic flow rates by 2050 under the RCP8.5 scenario.

Table 1.
Rainfall stations for the two river basins: Mean annual rainfalls from observed series without gaps; %gaps = percentage of days without measurement.
Table 1.
Rainfall stations for the two river basins: Mean annual rainfalls from observed series without gaps; %gaps = percentage of days without measurement.
| River Basin | Stations | Longitude | Latitude | Elevation(m) | Start of Record (dd/mm/yyyy) | End of Record (dd/mm/yyyy) | % Gaps | Mean Annual Rainfall (mm) |
|---|---|---|---|---|---|---|---|---|
| Senegal | Bafing Makana | −10.28 | 12.55 | 239 | 01/01/1963 | 01/09/1997 | 37.5 | 1190 |
| Dabola | −11.11 | 10.75 | 438 | 01/01/1933 | 01/10/2001 | 14.6 | 1514 | |
| Dinguiraye | −10.71 | 11.30 | 490 | 16/01/1922 | 16/12/2005 | 43.7 | 1375 | |
| Faléa | −11.28 | 12.26 | 455 | 01/03/1956 | 31/12/2003 | 30.4 | 1433 | |
| Labé | −12.30 | 11.31 | 1025 | 16/01/1923 | 16/12/2006 | 0.7 | 1626 | |
| Mali | −12.30 | 12.13 | 1464 | 16/01/1931 | 16/12/2005 | 26.2 | 1625 | |
| Mamou | −12.08 | 10.36 | 782 | 02/01/1921 | 31/12/2008 | 1.9 | 1881 | |
| Siguiri | −9.16 | 11.43 | 362 | 02/01/1922 | 30/06/2007 | 1.7 | 1272 | |
| Tougué | −11.66 | 11.43 | 86 | 16/01/1923 | 16/08/2004 | 22.3 | 1559 | |
| Kita | −9.46 | 13.06 | 328 | 01/01/1931 | 30/09/2009 | 1.5 | 1007 | |
| Guene-Gore | −11.01 | 12.73 | 240 | 01/05/1956 | 31/12/2002 | 26.8 | 1246 | |
| Sagabari | −9.80 | 12.60 | 332 | 01/07/1959 | 01/09/1997 | 18.8 | 1151 | |
| Gambia | Gourbassi | −11.63 | 13.40 | 196 | 01/01/1950 | 31/12/2005 | 3.7 | 896 |
| Salemata | −12.83 | 12.63 | 84 | 01/01/1973 | 20/09/2012 | 0 | 941 | |
| Kedougou | −12.21 | 12.56 | 121 | 01/01/1941 | 31/12/2015 | 0 | 1232 | |
| Saraya | −11.78 | 12.78 | 184 | 01/01/1950 | 31/12/2015 | 0.1 | 1080 | |
| Kenieba | −11.23 | 12.85 | 343 | 01/06/1942 | 31/12/2003 | 2.4 | 1201 | |
| Fongolimby | −12.01 | 12.41 | 399 | 01/01/1963 | 31/12/2010 | 0 | 1139 | |
| Labé | −12.30 | 11.31 | 1025 | 16/01/1923 | 16/12/2006 | 0.7 | 1626 | |
| Mali | −12.30 | 12.13 | 1464 | 16/01/1931 | 16/12/2005 | 26.2 | 1625 | |
| Tougué | −11.66 | 11.43 | 86 | 16/01/1923 | 16/08/2004 | 22.3 | 1559 |
Table 2.
Temperature stations for the two river basins.
| River Basin | Stations | Longitude | Latitude | Elevation (m) | Start of Record (dd/mm/yyyy) | End of Record (dd/mm/yyyy) | % Gaps | Mean Annual Temperature (°C) |
|---|---|---|---|---|---|---|---|---|
| Senegal | Labé | −12.30 | 11.31 | 1025 | 05/01/1939 | 31/12/2004 | 2.2 | 22 |
| Mamou | −12.08 | 10.36 | 782 | 01/01/1924 | 31/12/2006 | 2.4 | 23 | |
| Siguiri | −9.16 | 11.43 | 362 | 01/08/1943 | 28/01/2005 | 5.6 | 27 | |
| Kita | −9.46 | 13.06 | 328 | 01/01/1950 | 31/12/2008 | 2.3 | 28 | |
| Kenieba | −11.23 | 12.85 | 136 | 01/01/1950 | 31/12/2004 | 4.1 | 29 | |
| Gambia | Labé | −12.30 | 11.31 | 1025 | 05/01/1939 | 31/12/2004 | 2.2 | 22 |
| Tambacounda | −13.68 | 13.76 | 52 | 01/01/1960 | 31/12/2010 | 4.1 | 29 |
Table 3.
Resolutions and abbreviations of the six models used.
| Research Center for Climate Model | Abbreviated Name of the Model | Resolution (Lat × Long) |
|---|---|---|
| Canadian Center for Climate Modeling and Analysis CCCMA | CanESM2 | 2.7673° × 2.8125° |
| Centre National de Recherches Météorologiques/Centre Européen de Recherche et Formation Avancée en Calcul Scientifique—CNRM | CNRM | 1.3890° × 1.4062° |
| Commonwealth Scientific and Industrial Research Organization in collaboration with Queensland Climate Change Center of Excellence—CSIRO | CSIRO | 1.875° × 1.875° |
| Met Office Hadley Centre—MOHC | HadGEM2-CC | 1.25° × 1.875° |
| Met Office Hadley Centre—MOHC | HadGEM2-ES | 1.25° × 1.875° |
| Atmosphere and Ocean Research Institute (The University of Tokyo), National Institute for Environmental Studies, and Japan Agency for Marine-Earth Science and Technology | MIROC5 | 1.4° × 1.4° |
Table 4.
The hydrological calibration criteria.
| Criterion | Formula | Scale | Ideal Value |
|---|---|---|---|
| 0 | |||
| 1 | |||
| 0 | |||
| 0 |
Qobs,i is the observed flow at time step i, Qsim,I is the simulated flow at time step i, is the average flow observed, N is the total number of time steps of the simulation period, NSE is the Nash–Sutcliffe coefficient, Fagg is the multi-criteria aggregating function, VE is the cumulative volume error, VEm is the yearly mean volume error, Vobs,i is the observed volume at time step i, Vsim,i is the simulated volume at time step i.
© 2018 by the authors. Licensee MDPI, Basel, Switzerland. This article is an open access article distributed under the terms and conditions of the Creative Commons Attribution (CC BY) license (http://creativecommons.org/licenses/by/4.0/).
Share and Cite
MDPI and ACS Style
Bodian, A.; Dezetter, A.; Diop, L.; Deme, A.; Djaman, K.; Diop, A. Future Climate Change Impacts on Streamflows of Two Main West Africa River Basins: Senegal and Gambia. Hydrology 2018, 5, 21. https://doi.org/10.3390/hydrology5010021
AMA Style
Bodian A, Dezetter A, Diop L, Deme A, Djaman K, Diop A. Future Climate Change Impacts on Streamflows of Two Main West Africa River Basins: Senegal and Gambia. Hydrology. 2018; 5(1):21. https://doi.org/10.3390/hydrology5010021
Chicago/Turabian StyleBodian, Ansoumana, Alain Dezetter, Lamine Diop, Abdoulaye Deme, Koffi Djaman, and Aliou Diop. 2018. "Future Climate Change Impacts on Streamflows of Two Main West Africa River Basins: Senegal and Gambia" Hydrology 5, no. 1: 21. https://doi.org/10.3390/hydrology5010021
Note that from the first issue of 2016, this journal uses article numbers instead of page numbers. See further details here.