Article

Socioeconomic Impact Evaluation for Near Real-Time Flood Detection in the Lower Mekong River Basin

1
Universities Space Research Association (USRA), Columbia, MD 21046, USA
2
Hydrological Sciences Laboratory, NASA Goddard Space Flight Center, Greenbelt, MD 20771, USA
3
Department of Geophysics, Stanford University, Stanford, CA 94025, USA
*
Author to whom correspondence should be addressed.
Hydrology 2018, 5(2), 23; https://doi.org/10.3390/hydrology5020023
Submission received: 16 March 2018 / Revised: 6 April 2018 / Accepted: 7 April 2018 / Published: 10 April 2018
(This article belongs to the Special Issue Advances in Large Scale Flood Monitoring and Detection)

Abstract

:
Flood events pose a severe threat to communities in the Lower Mekong River Basin. The combination of population growth, urbanization, and economic development exacerbate the impacts of these events. Flood damage assessments, critical for understanding the effects of flooding on the local population and informing decision-makers about future risks, are frequently used to quantify the economic losses due to storms. Remote sensing systems provide a valuable tool for monitoring flood conditions and assessing their severity more rapidly than traditional post-event evaluations. The frequency and severity of extreme flood events are projected to increase, further highlighting the need for improved flood monitoring and impact analysis. In this study we integrate a socioeconomic damage assessment model with a near real-time flood remote sensing and decision support tool (NASA’s Project Mekong). Direct damages to populations, infrastructure, and land cover are assessed using the 2011 Southeast Asian flood as a case study. Improved land use/land cover and flood depth assessments result in rapid loss estimates throughout the Mekong River Basin. Results suggest that rapid initial estimates of flood impacts can provide valuable information to governments, international agencies, and disaster responders in the wake of extreme flood events.

1. Introduction

Flood events are among the costliest natural disasters and pose significant threats to many low-lying and coastal communities [1,2,3]. The Mekong River Basin (MRB) is one of the most flood-prone regions in the world. Approximately 60 million people reside there, with many inhabiting areas along flood plains or within a few meters of sea level [4,5]. As populations and economic growth continue to increase, so do the expected damages from future events [6]. Nicholls et al. (2008) estimate that by the year 2070 Vietnam and Thailand alone will account for 6% of global assets and 12% of global population exposed to flooding [7].
The effects of climate change are also expected to exacerbate threats caused by flooding. Increased frequency, severity, and variability of storm surge, combined with rising sea levels, pose significant risks to coastal populations [6,8]. For inland areas, changes to precipitation patterns and monsoons can disturb the delicate balance between the necessary seasonal flood cycles and destructive extreme events [9]. In light of these potential risks, it is increasingly important for flood managers and decision makers to understand the socioeconomic effects of flooding on communities.
Impact assessments are commonly used to quantify the socioeconomic effects of flooding. Estimates of potential damages are critical to land-use planning and risk mapping, and serve as inputs for cost-benefit analyses of flood protection systems [3,10,11]. Post-event evaluations are commonly formulated by national governments or international agencies like the United Nations (UN), Red Cross, World Bank, or United States Agency for International Development (USAID) [12,13]. However, these evaluations often require a significant amount of time to produce, thereby delaying insights which could otherwise reduce vulnerability to future flood events. The ability to acquire rapid damage estimates can provide emergency responders, public administrators, and insurance companies valuable information in the wake of a hazardous event [14,15].
Geographic information system (GIS) and remote sensing technologies offer a way to synthesize geospatial and socioeconomic data more rapidly and efficiently. While several recent studies have demonstrated the efficacy of structured flood damage assessments in the MRB, these analyses were largely constrained to local or community-level evaluations (see: [16,17,18]). Impact evaluations across broader scales can be complicated by the need for trans-boundary coordination between countries, as is the case in the MRB [19]. Here, we propose a framework that couples the near real-time (NRT) flood detection capabilities of an existing web application (NASA’s Project Mekong; http://projectmekongnasa.appspot.com) with a rapid damage assessment module to estimate flood impacts on a regional scale [2].
Project Mekong is a decision support tool that leverages the rapid revisit time and low latency afforded by NASA’s Land, Atmosphere Near Real-Time Capability for Earth Observing Systems (LANCE) system. Imagery from the Moderate-resolution Imaging Spectroradiometer (MODIS) sensors on the Aqua and Terra satellites are obtained twice daily at 3-hr latency. Cloud filters are applied and a dynamic surface water classifier identifies flooding using the spectral Normalized Difference Vegetation Index (NDVI) signatures of permanent water bodies (MOD44W). For a more detailed description of the flood detection scheme used in the tool, see [2].
In addition to producing operational flood conditions in NRT, the Project Mekong system has previously been benchmarked against historical imagery. One notable example is the 2011 Southeast Asia flood, which was an event of historic magnitude and the effects of which are well documented in the literature [20,21,22,23]. Using the 2011 flood event as a case study, this analysis seeks to: (1) demonstrate the feasibility of assessing and visualizing socioeconomic impacts on a regional scale and (2) use readily-accessible data to establish a framework to produce damage estimates in NRT in conjunction with the Project Mekong tool.

2. Background and Motivation
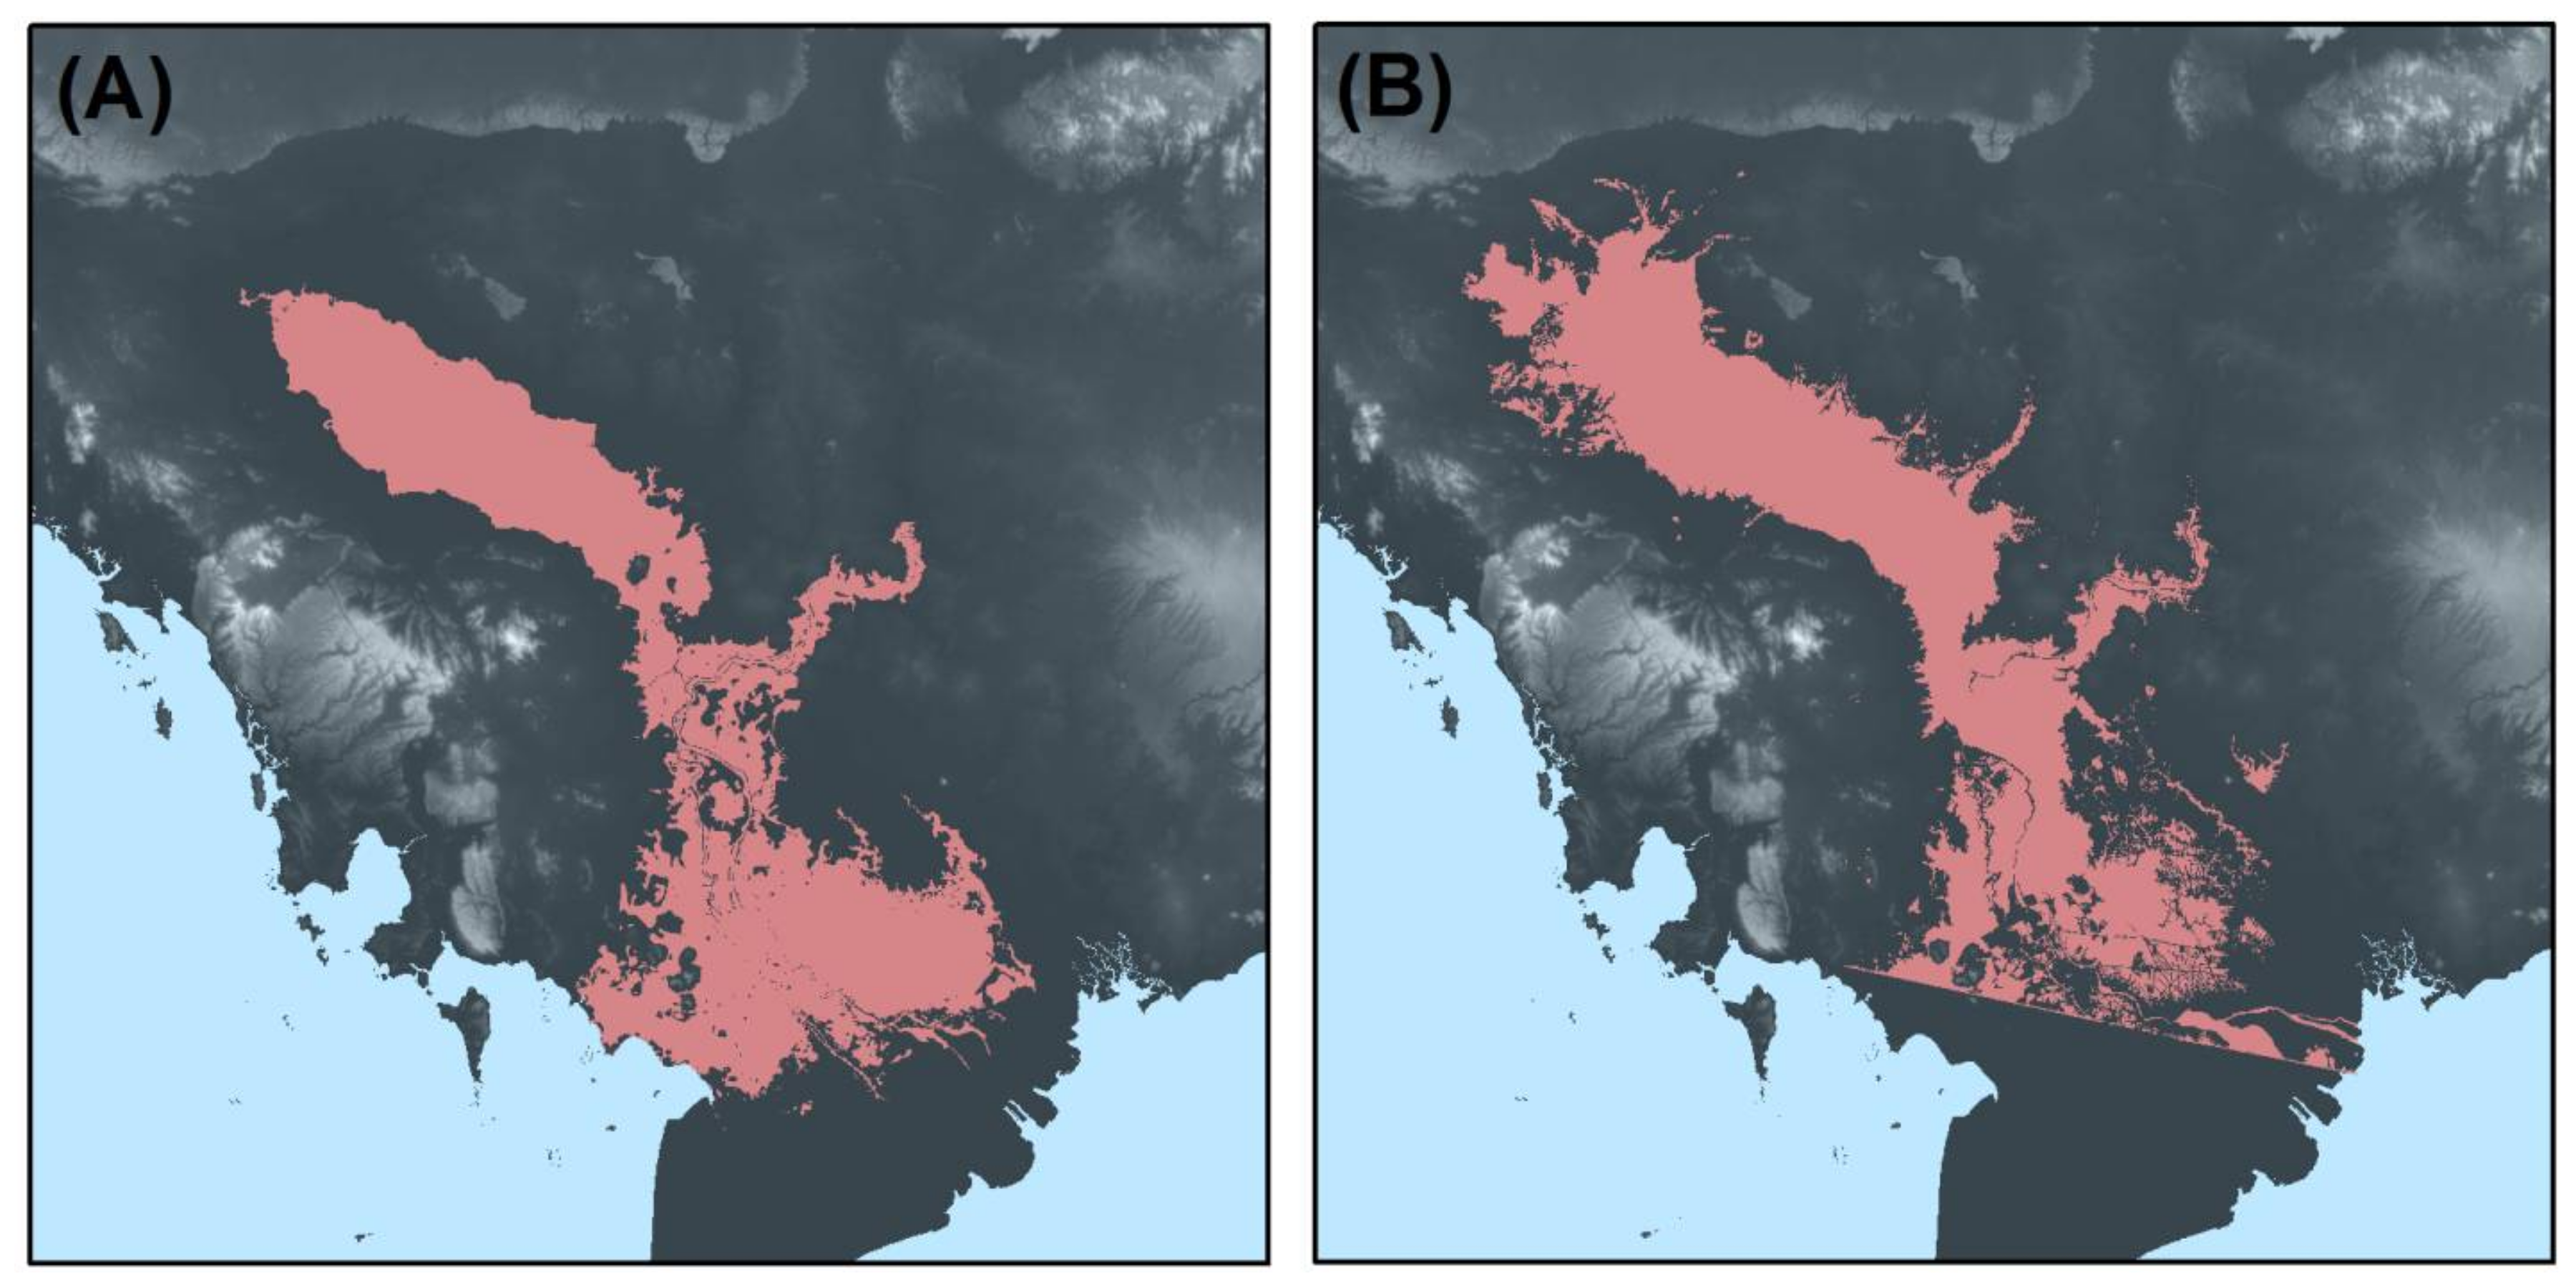
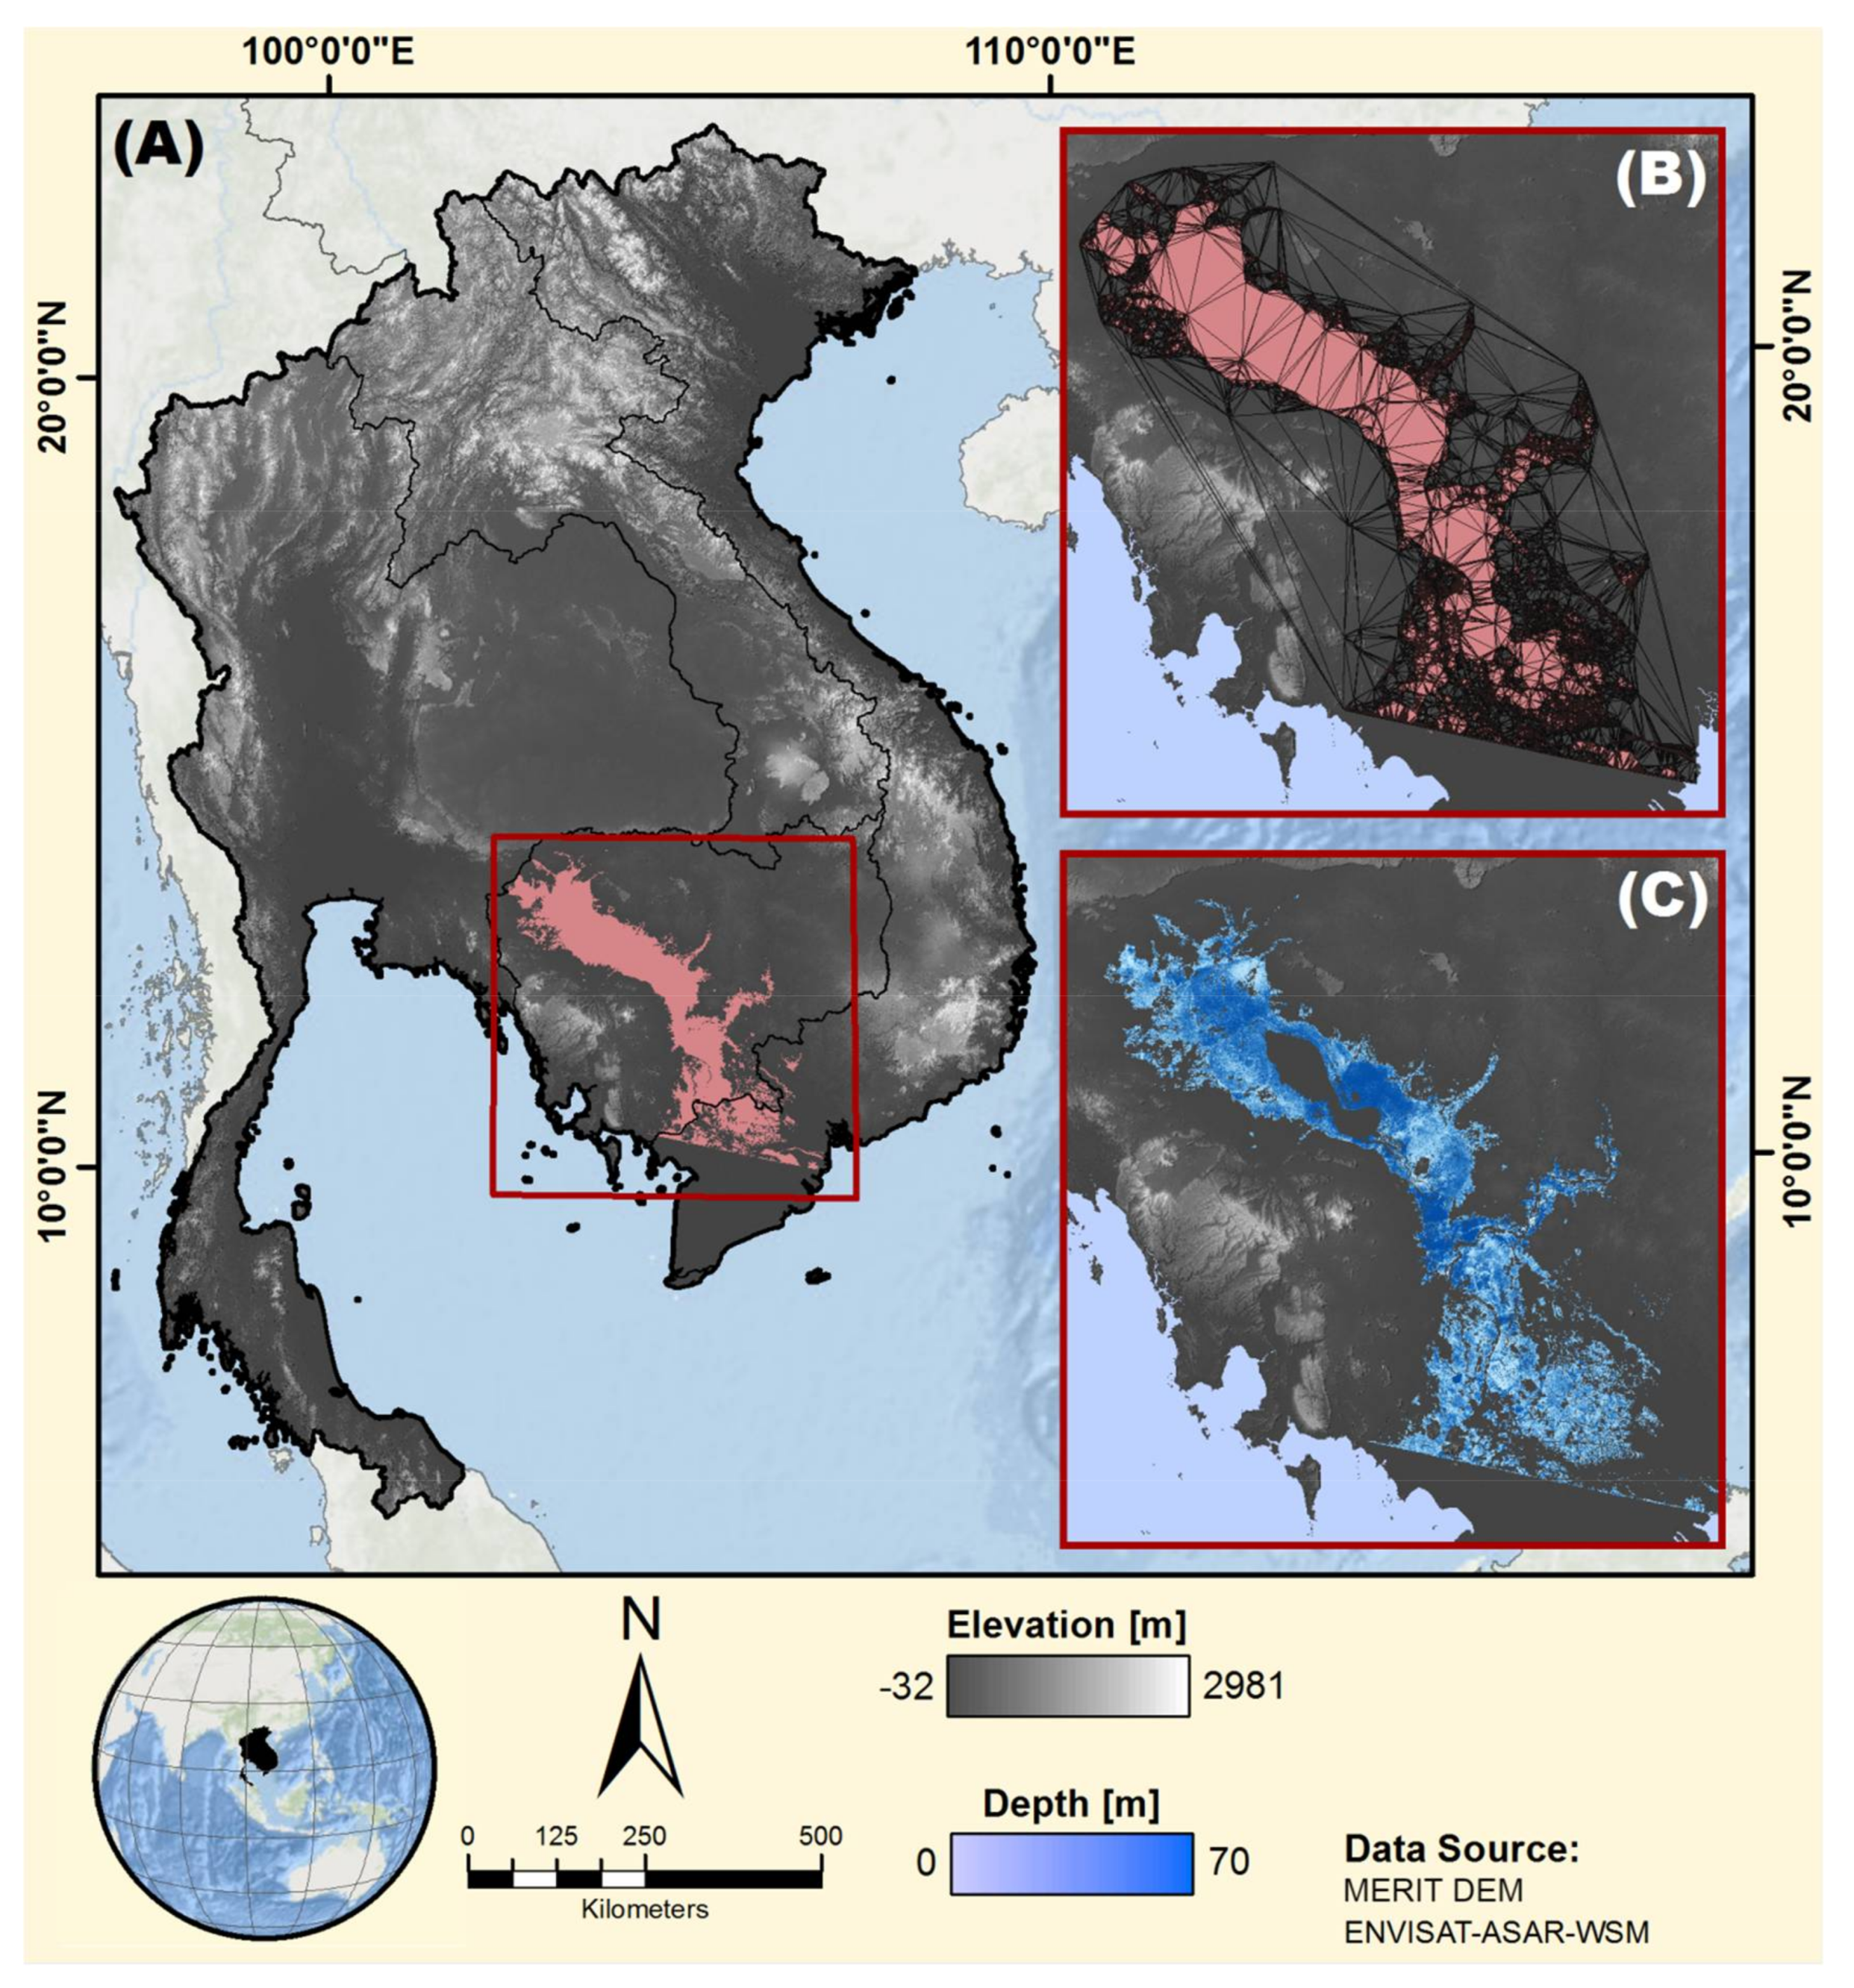
2.1. Study Area

The Mekong is the world’s 12th longest river and provides a critical source of water for one of the world’s most densely populated landscapes. Originating in the Tibetan plateau, it extends over 4300 km and spans parts of China, Laos, Myanmar, Thailand, Cambodia, and Vietnam (Figure 1A) [24,25]. The basin drains an area of approximately 795,000 km2 and can be divided into two primary catchments, known as the Upper and Lower Mekong Basins (LMB) [4]. The LMB can be further characterized by four physiographic regions: Khorat Plateau, Tonle Sap Basin, Northern Highlands, and Mekong Delta. The delta itself covers 39,000 km2 and is home to over 18 million people [26]. The combination of low-lying terrain and high population density make communities in the LMB prone to river and coastal flooding [27].
The LMB is well adapted to seasonal inundation cycles, which typically occur between July and November. In the Mekong Delta, regular flooding affects up to 50% of the land surface [28]. The influx of nutrient-rich waters from these cycles replenishes fertile sediment for agriculture, recharges groundwater reservoirs, and provides habitat for aquaculture [21]. While many inhabitants of the LMB rely on seasonal inundation for their livelihoods, they remain highly susceptible to extreme events [29].

2.2. The 2011 Southeast Asia Floods

During the 2011 monsoon season, record flooding caused by a confluence of natural and human-made factors struck communities across Thailand, Myanmar, Cambodia, Laos, and Vietnam. La Ninã meteorological conditions resulted in a 143% increase in rainfall in Northern Thailand alone [30]. This extended period of above-average precipitation coincided with the onset of the southwest monsoon, which occurred between May and September over Thailand and the Andaman Sea [31].
Topography and land use played an important role in the distribution of flood damages. The gently sloping landscape resulted in an inundation of large geographic areas. Reservoir capacities were quickly overwhelmed and increased runoff channeled a high volume of water into the LMB [19]. Several densely-populated urban areas were significantly affected by these extreme hydrologic conditions, despite the existence of flood management infrastructure like levees and water gates. The area around Bangkok, Thailand, for instance, had subsided between 0.5–1.6 m during the preceding several decades [30]. The combination of increased vulnerability and the dense concentration of people and infrastructure is believed to have increased the resulting flood damages.

2.3. Flood Impact Assessments

Impact assessments are a critical component of flood management plans. Most modern flood management strategies rely on risk analyses that consider the probability of a given hazard (e.g., the 100-year flood) and its associated effects [10,32]. The expected damages from a flood event are a function of the vulnerability of a given population. Many factors can affect the vulnerability of a population, including socioeconomic variables like accumulated wealth, mobility, or the health status of households; robustness of infrastructure; flood characteristics like depth, duration, or flow velocity; and the existence of warning and response variables [16].
There are multiple ways to structure a flood impact assessment, all of which is subject to challenges and assumptions. Flood impacts are often described using a framework that classifies damages as ‘direct vs. indirect’ and ‘tangible vs. intangible’ [33]. Direct, tangible damages are those that occur as a result of direct contact with water and can be readily quantified by established metrics [3,10]. Other direct damages, such as the loss of human life, pose distinct ethical challenges when it comes to assigning damage values, leading them to be considered intangible [34,35]. Examples of indirect damages would be loss of income due to displacement, suspension of education, or issues of intergenerational justice [32,36]. Here, we focus primarily on the direct, tangible damages associated with flood inundation throughout the LMB.
Several countries have developed standardized flood impact frameworks which allow flood events to be compared across time [10]. In the U.S., the Federal Emergency Management Agency (FEMA) uses the Hazards U.S. (HAZUS) model for mitigation and recovery planning, as well as disaster preparedness and response [37]. The model is highly detailed, and is used to calculate exposure for a variety of different types of residential and commercial infrastructures. However, the most detailed version of the multi-hazard module requires “extensive additional economic and engineering studies by the user,” [3] (p. 3741). Performing such analyses on a regional scale can, therefore, pose nontrivial practical and computational challenges. In the following section, we outline a streamlined workflow to rapidly produce flood damage estimates across the MRB.

3. Materials and Methods

Here, we adapt and employ a damage assessment framework originally developed by civil engineers in the Netherlands. This so-called “Standard Method,” as outlined in Kok et al. (2004), calculates flood damages according to different land cover types and infrastructure categories [38]. Like the HAZUS model in the U.S., it relies on depth-dependent damage functions to determine severity of flood impacts. While other studies consider additional flood characteristics such as flow velocity or duration, this analysis considers only inundation depth as a simplifying assumption. This assumption is supported by Tang et al. (1992), who found that inundation depth was the primary driving variable for flood damages in the Bangkok area, particularly for commercial and agricultural areas [27] (p. 55). For an extended discussion of assumptions and limitations, see the Discussion and Conclusions section. The following sections describe how inundation depths are estimated and fed into the model to assess damages.

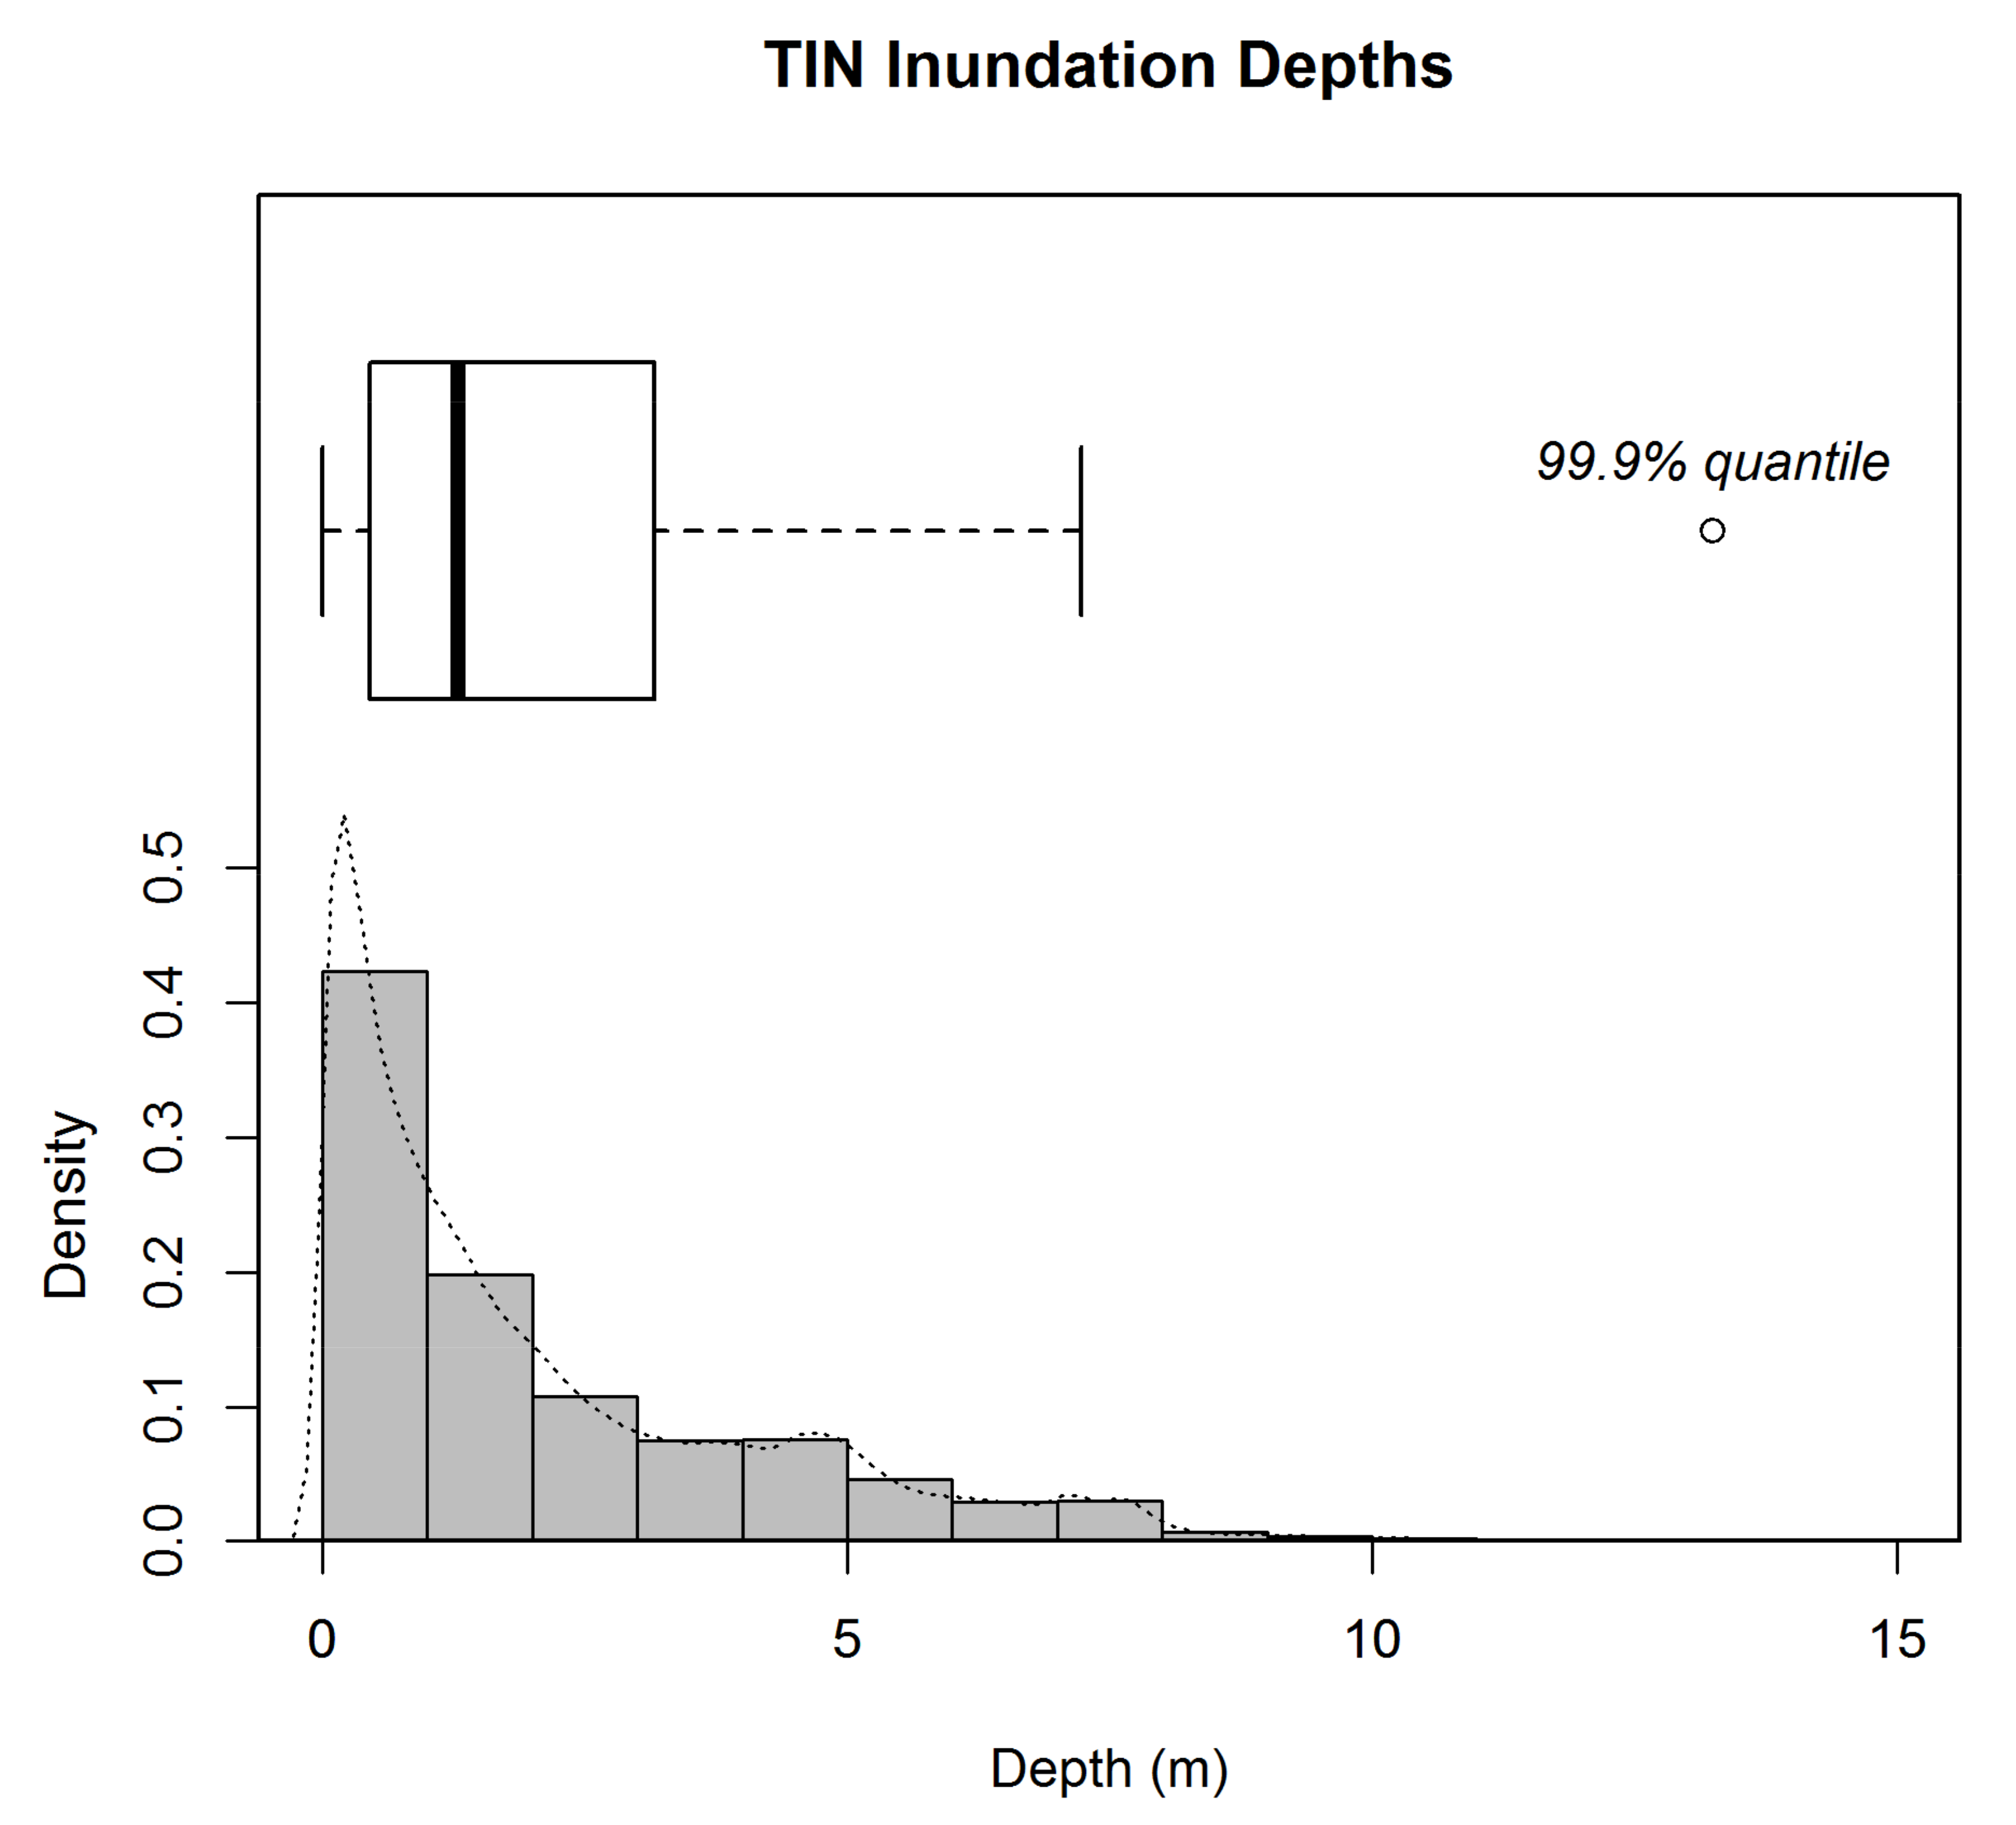
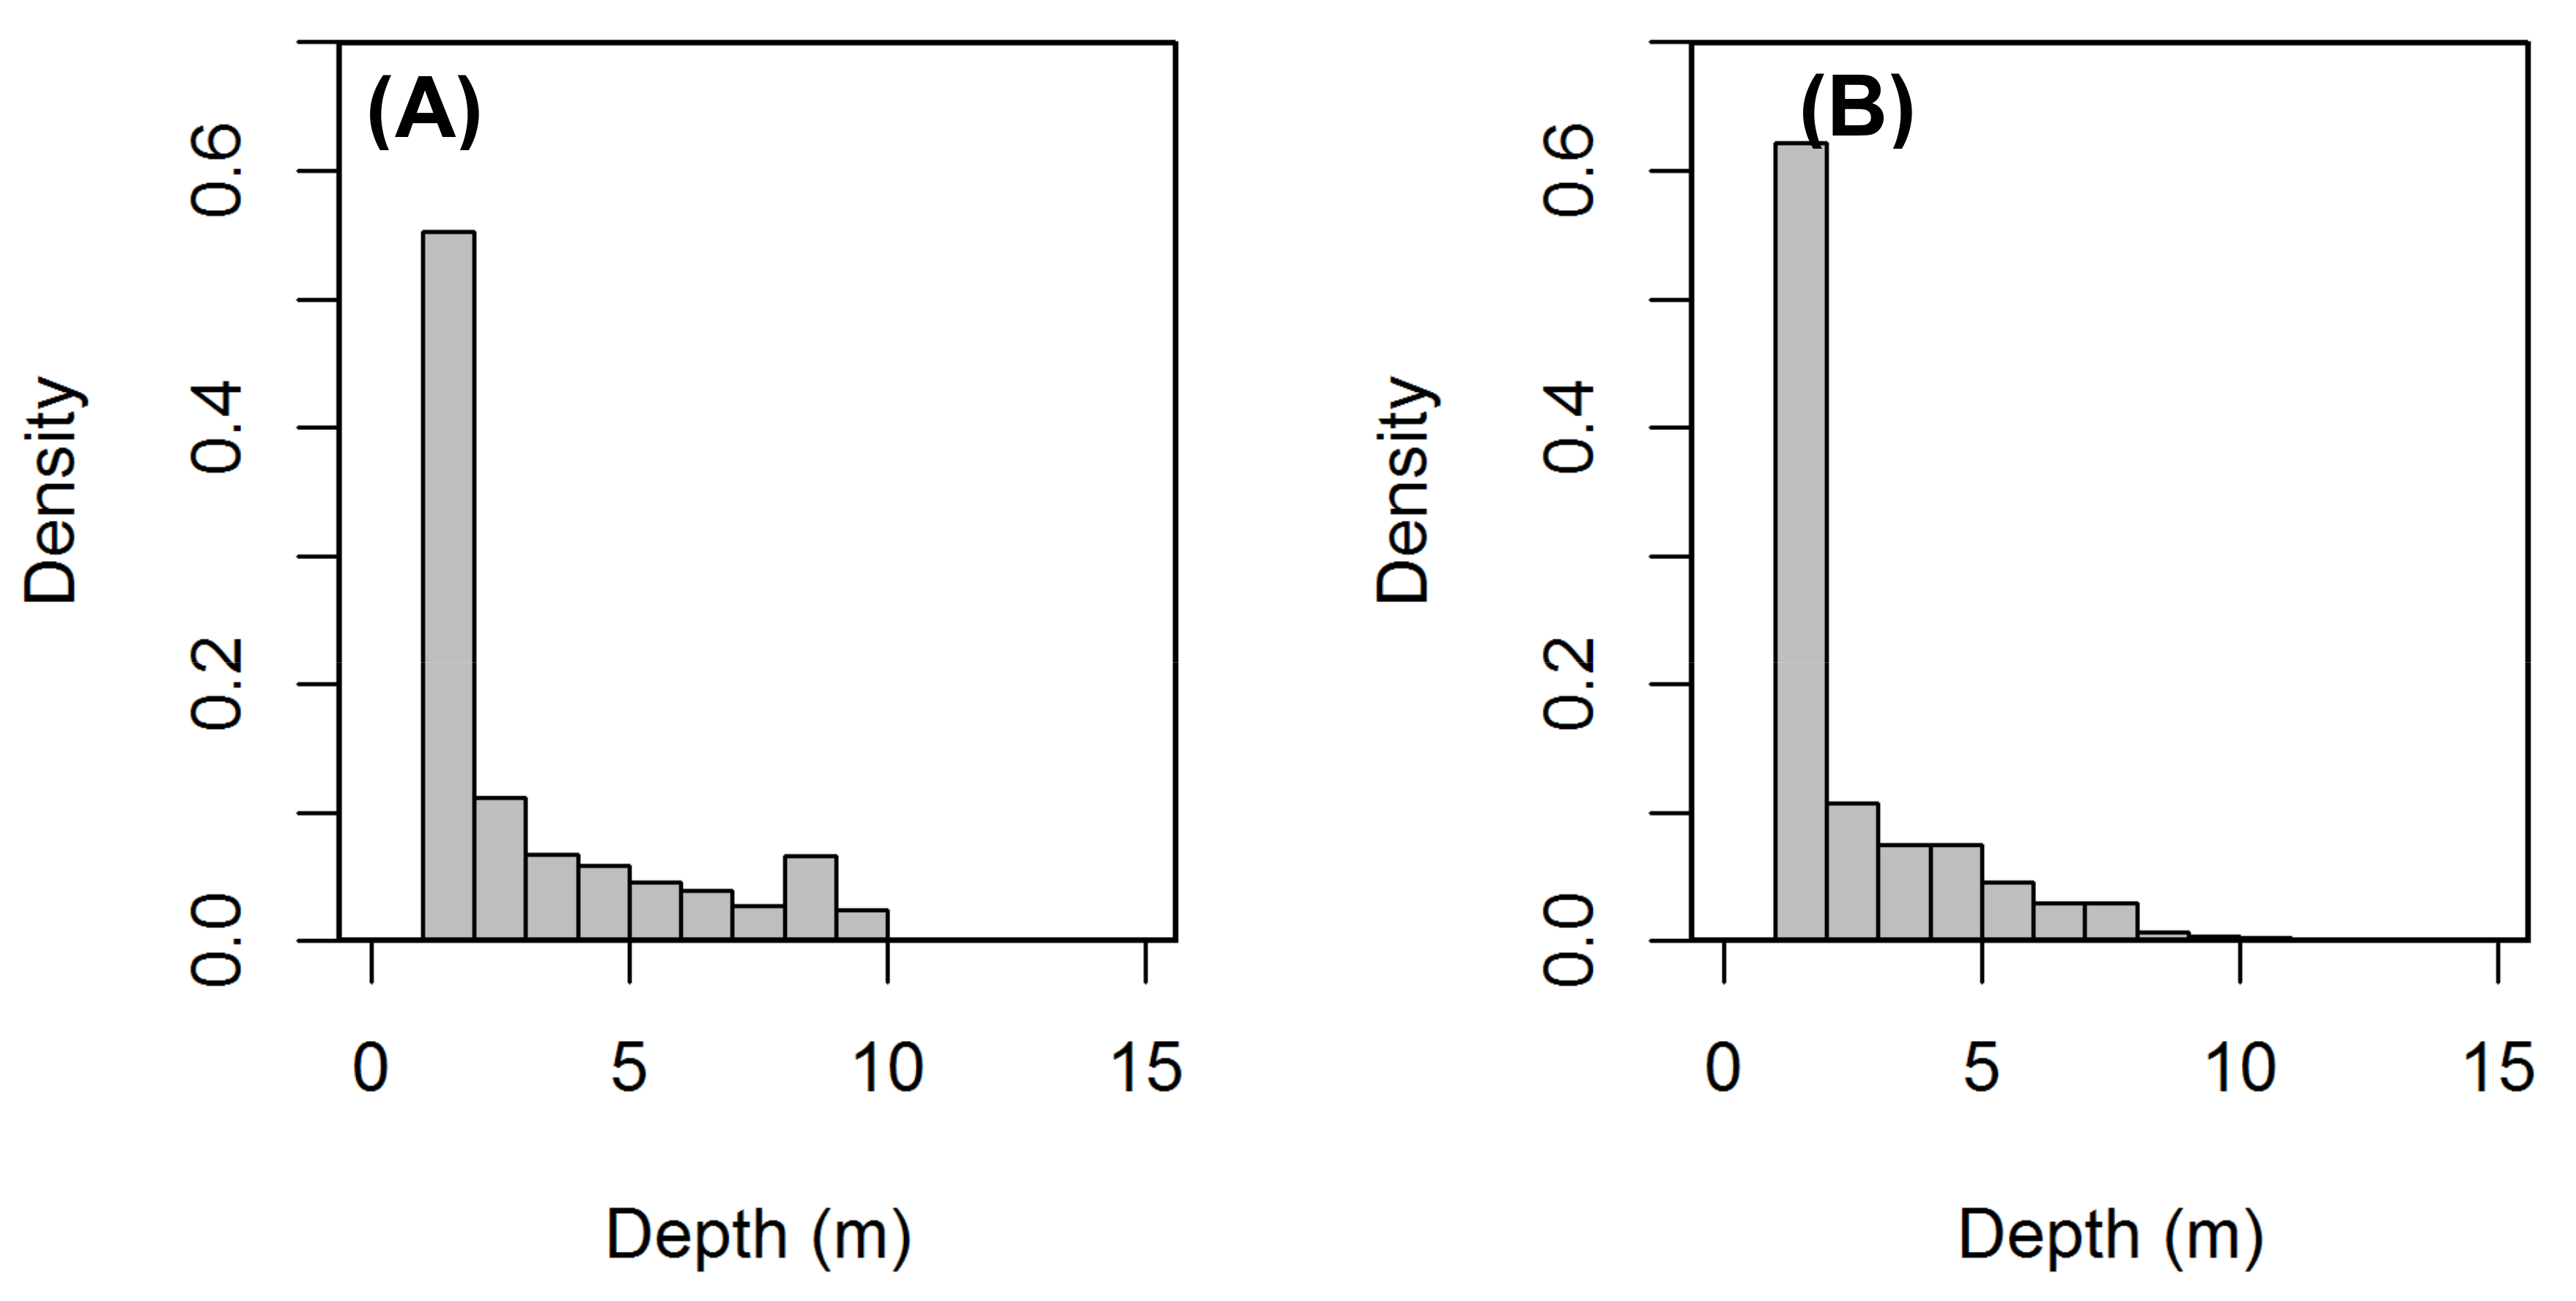
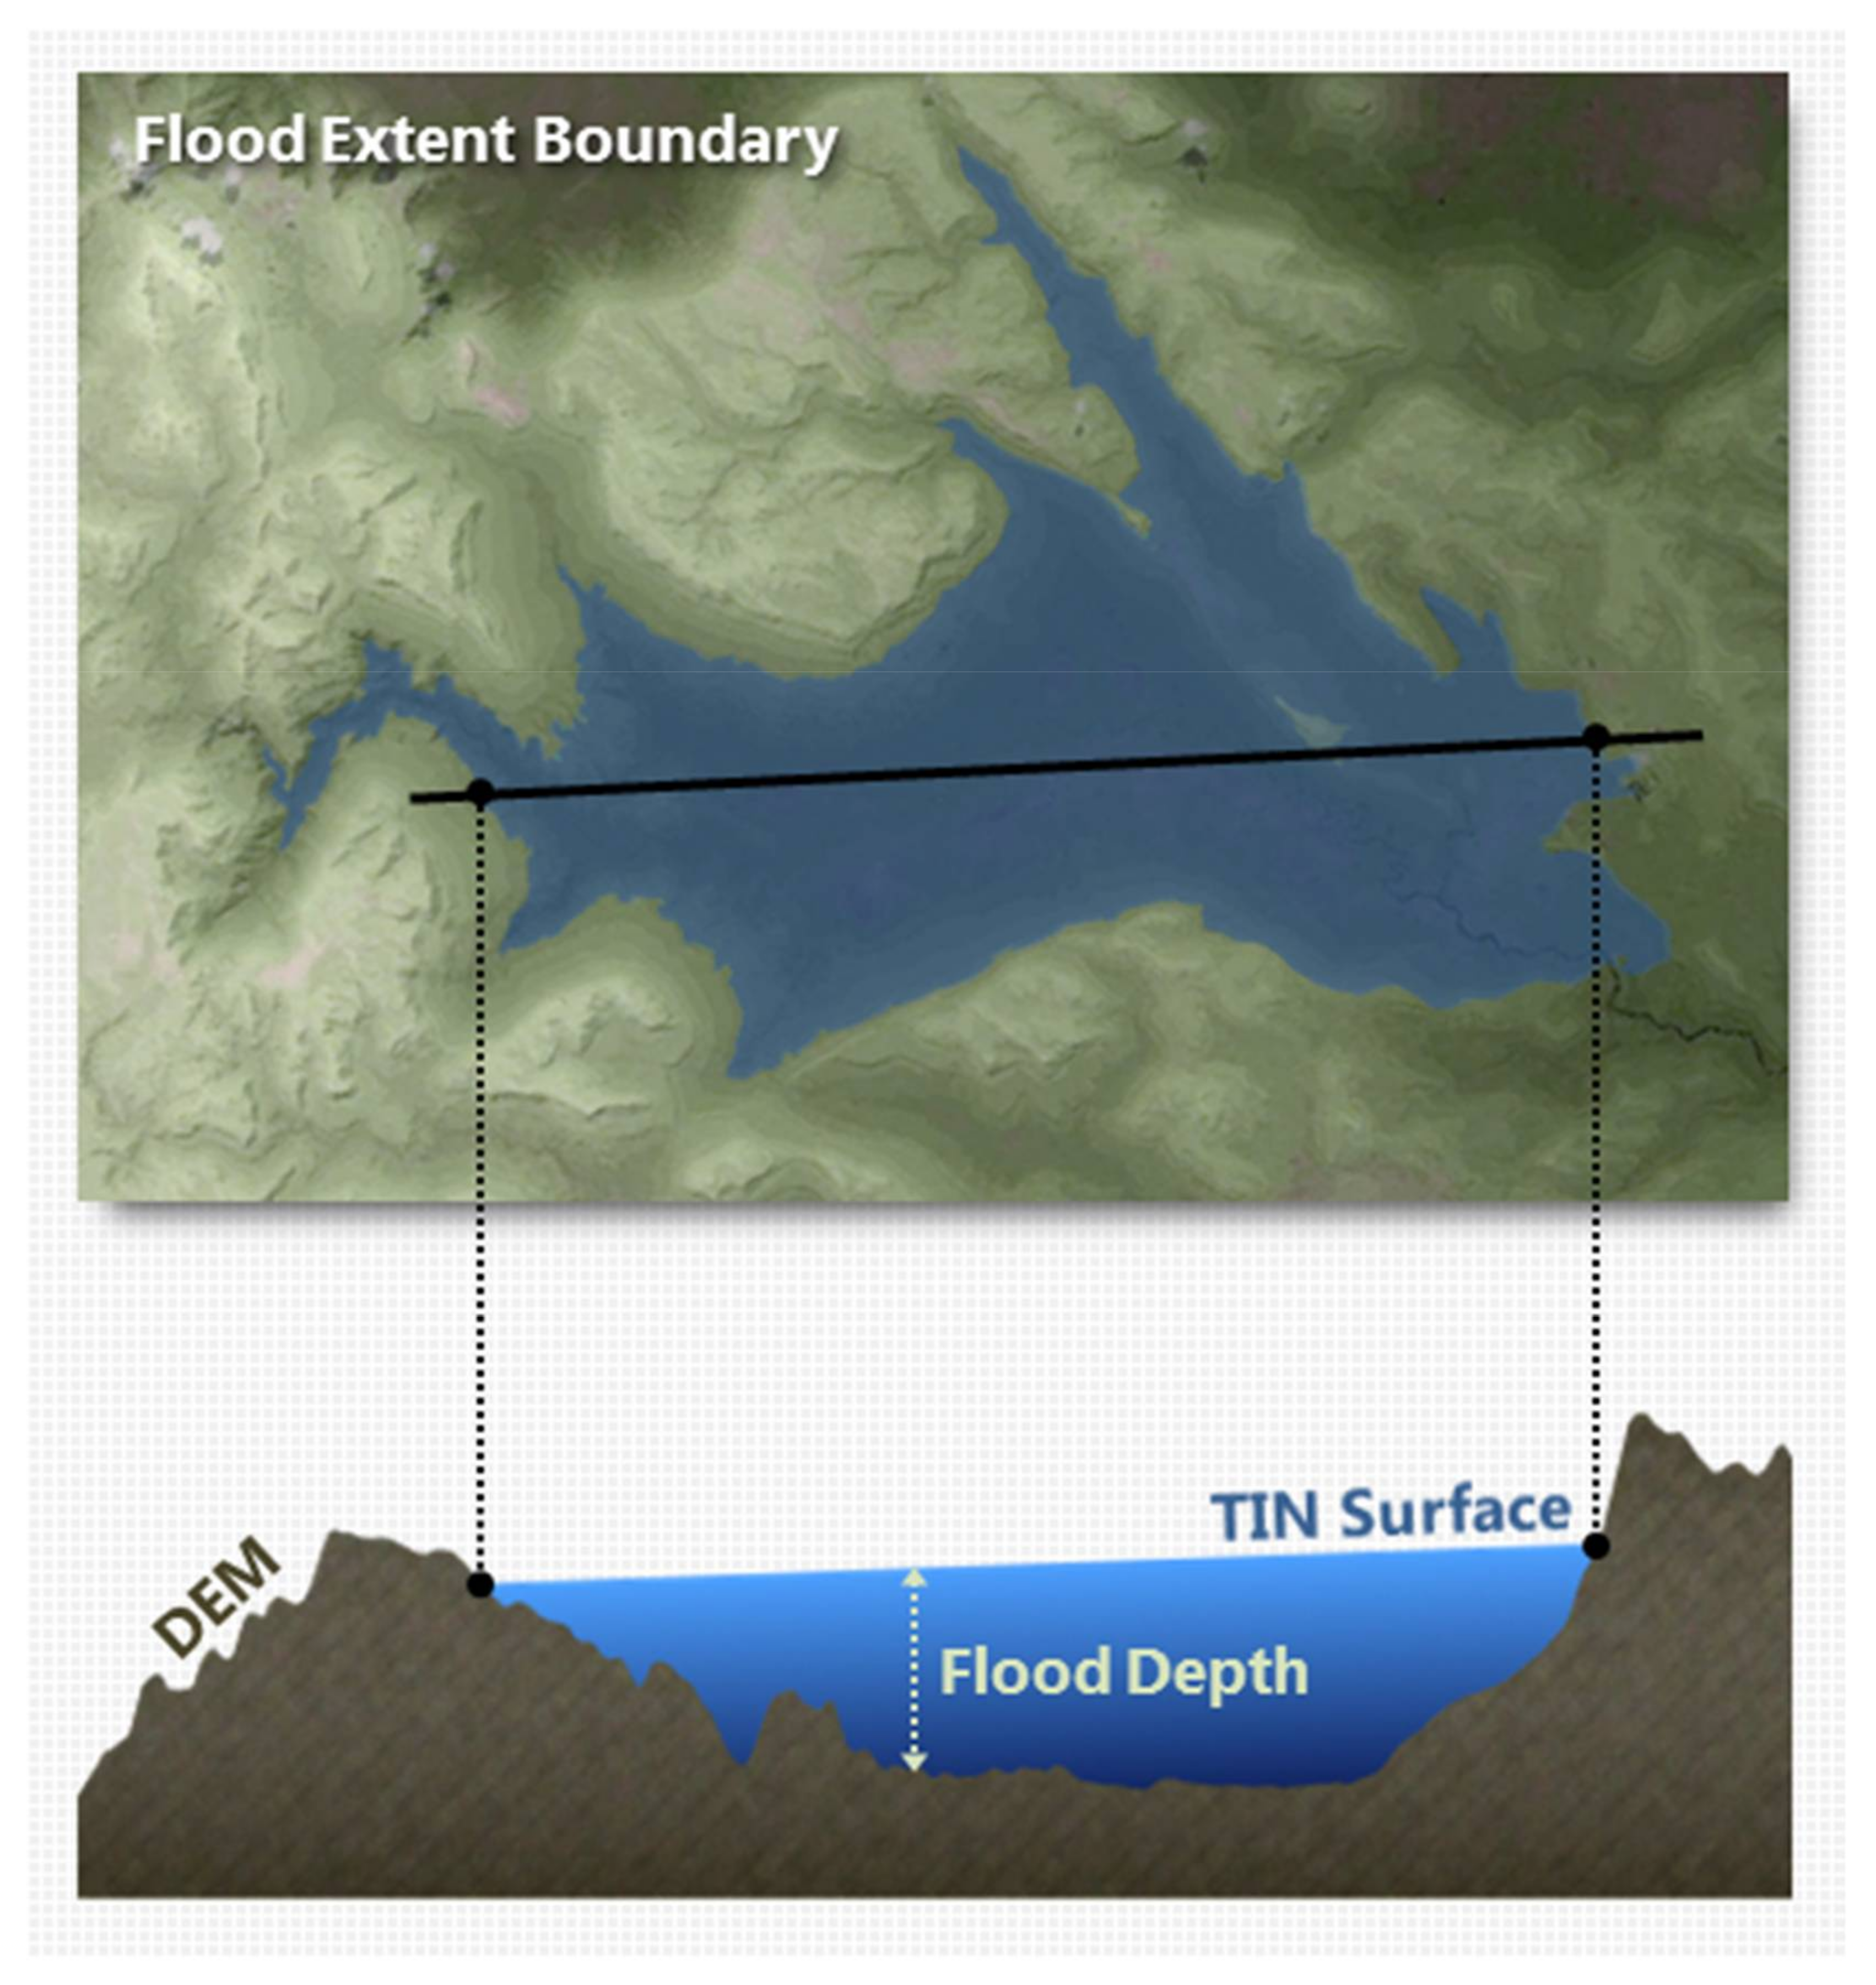
3.1. Inundation Depth Estimation

To illustrate the workflow for the near real-time assessment, we consider the 2011 Southeast Asia floods as a case study. Surface water extent estimates were obtained through The United Nations Institute for Training and Research (UNITAR), which supports satellite data collection of natural disasters through the Operational Satellite Applications Programme (UNOSAT). Imagery collected by the European Space Agency’s ENVISAT Advanced Synthetic Aperture Radar Wide Swath Mode (ASAR-WSM) shows the extent of the surface inundation between 27 and 30 September, 2011 at a spatial resolution of 150-m [39] (Figure 1A). A geodatabase containing the vector data of the detected 2011 flood extent is available in [40].
QGIS software was used to process the ASAR flood extent vectors according to the method described in Cham et al. (2015) [41]. The flood extent polygon was converted to a polyline feature. Sample points were generated around the boundary of the flood extent at 250-m intervals. Twelve tiles from the “Multi-Error-Removed Improved-Terrain” digital elevation model (MERIT DEM) were stitched together to produce a regional elevation layer at 3 arc-second (90-m) resolution [42]. The MERIT DEM improves on many of the sources of error present in other global elevation datasets (e.g., speckling, striping, and vegetation biases). However, its vertical accuracy is not without uncertainty, especially when used in a flood modeling context. For a more detailed discussion of uncertainties see the Discussion and Conclusions section.
At each of the sampled points, the land surface elevation from the MERIT DEM was extracted. These elevation points were used to generate a triangular interpolated network (TIN) to serve as an estimate for the flood surface elevation (Figure 1B). Finally, flood depths were determined by subtracting the land surface elevation from the interpolated flood surface at each grid cell (Figure 1C). A cross-section schematic of this process is illustrated in Figure 2.

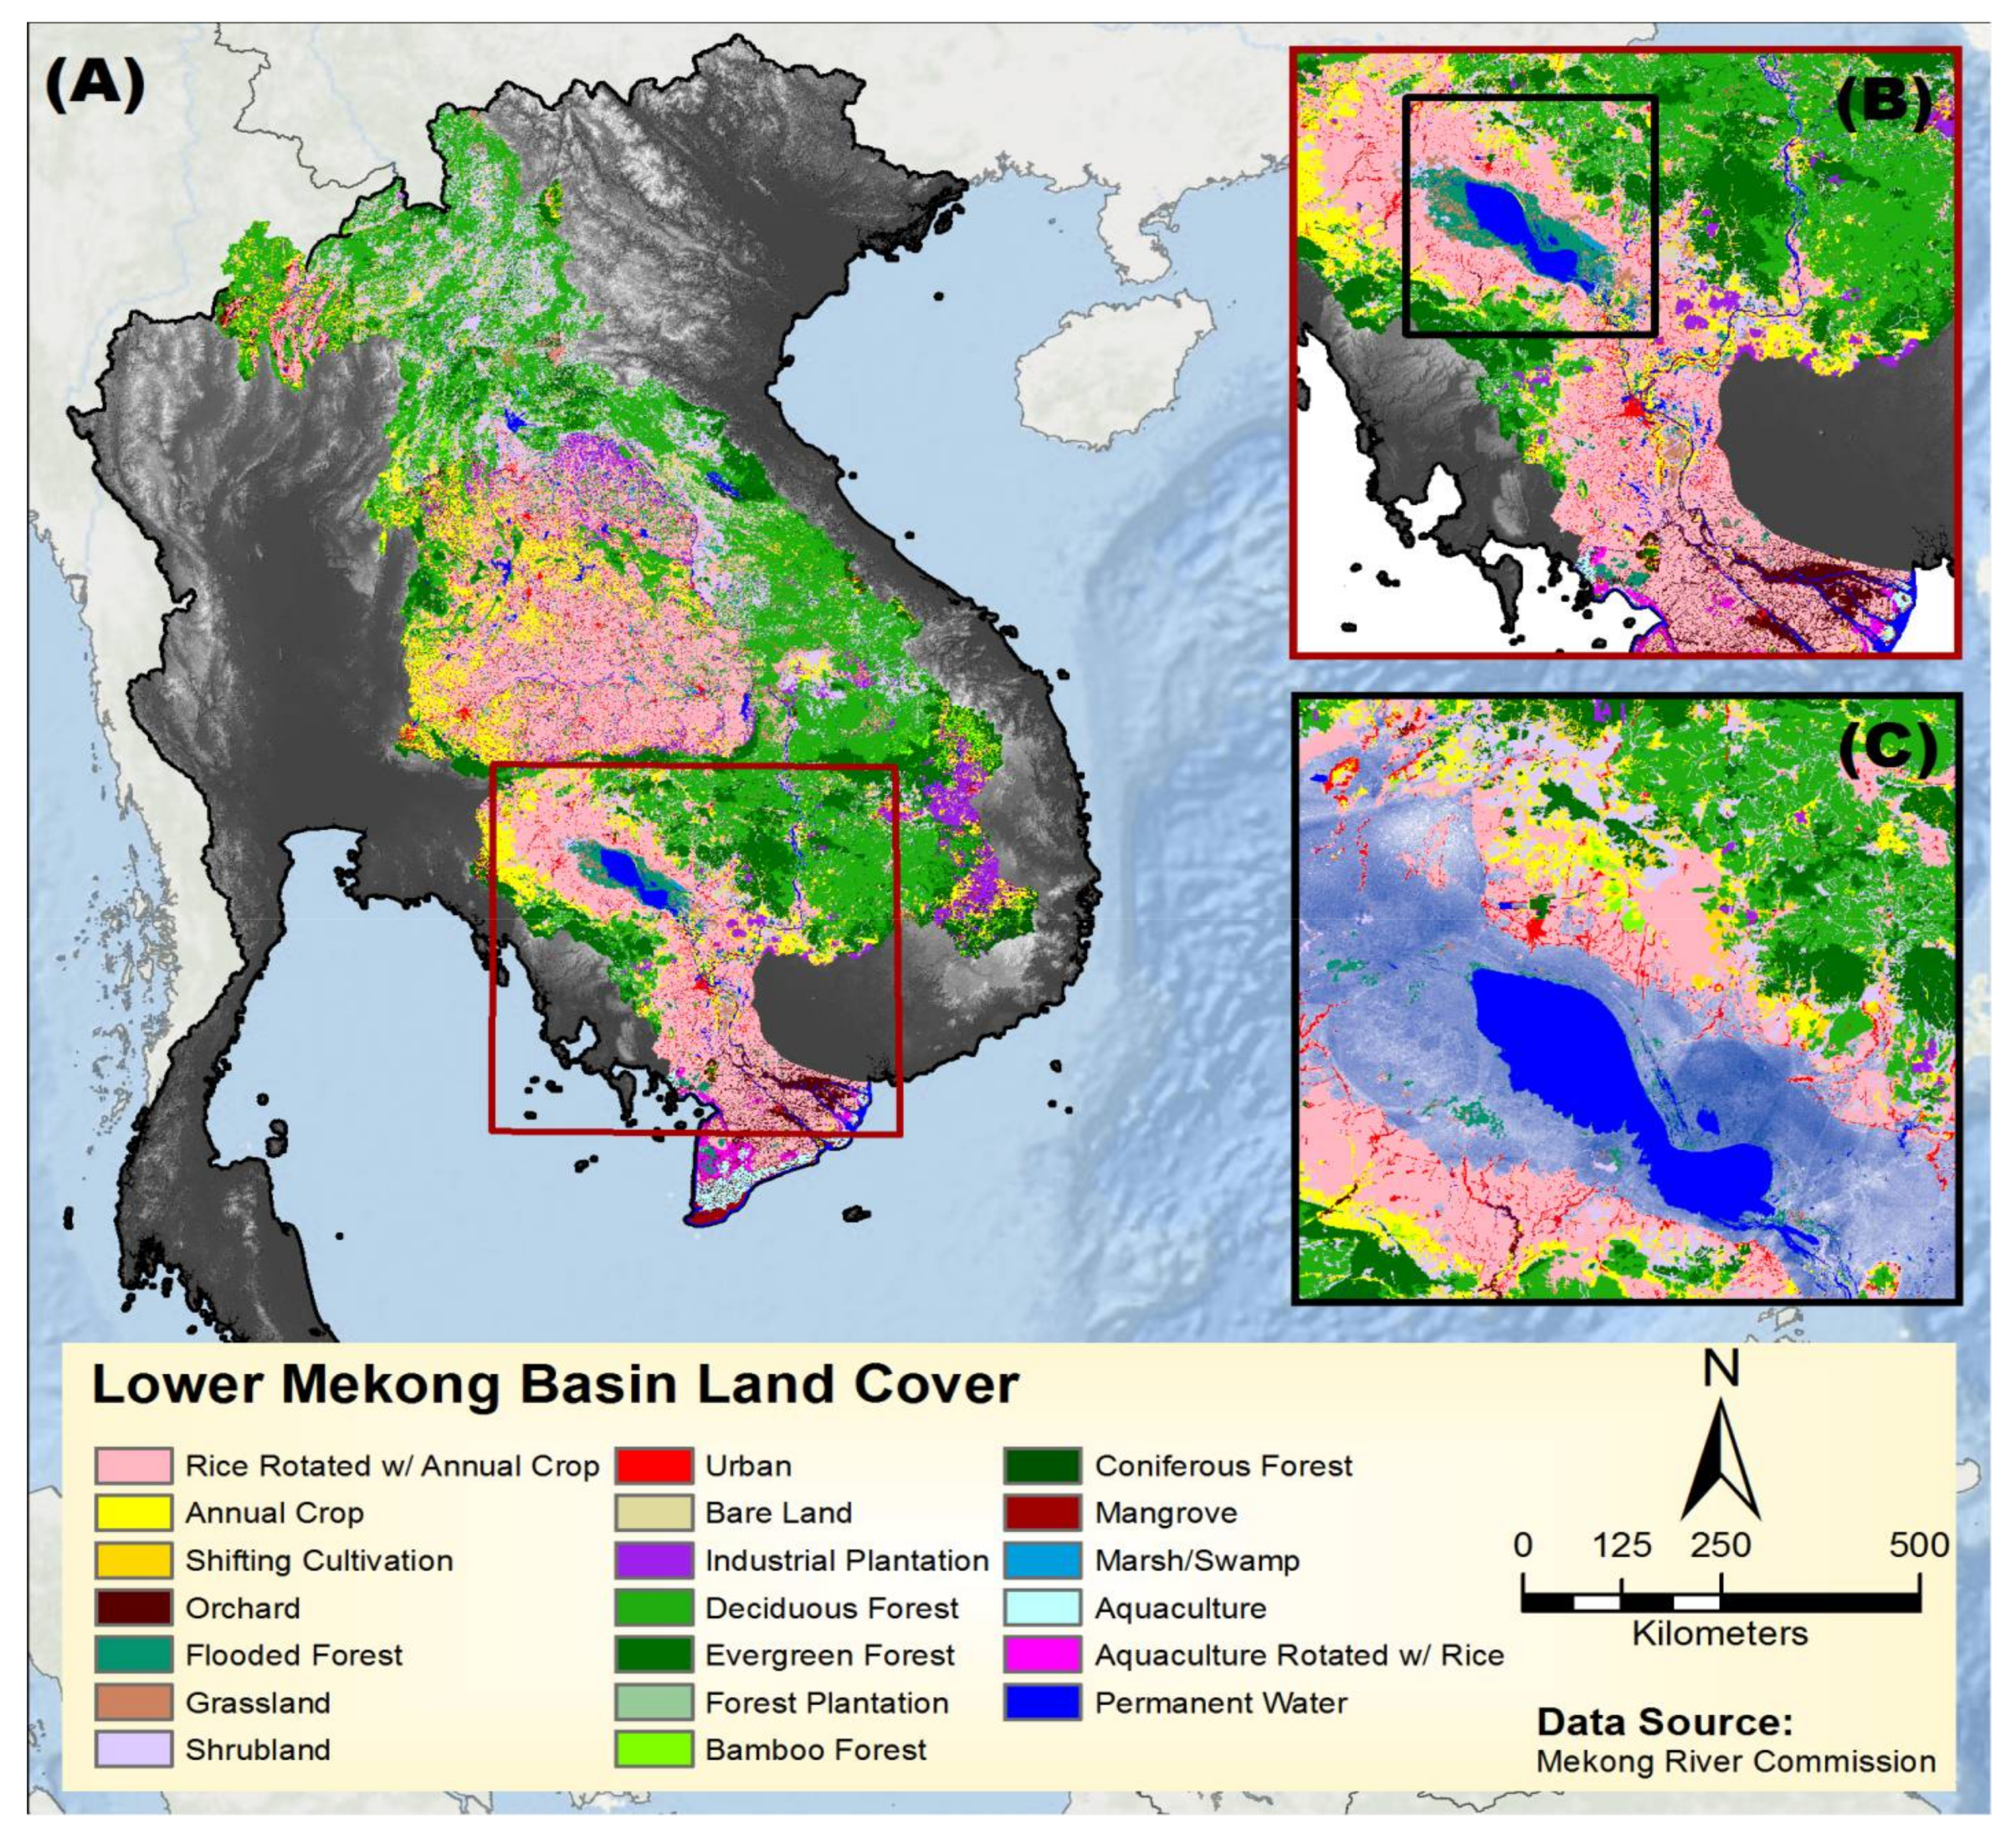
3.2. Land Use/Land Cover Map

An updated land use/land cover (LULC) map produced by the Mekong River Commission (MRC) was used to determine damages according to different types of land cover. Land cover classifications were derived using imagery from Landsat 5 Thematic Mapper to produce a map with 30-m spatial resolution. Field surveys were conducted on 9357 points across the LMB to validate classifications [43]. In total, 19 unique land classifications were derived (Figure 3). The LULC map was resampled to match the DEM resolution using nearest neighbor method and was exported as an array. Arrays for land cover and inundation depths were imported in an R model to calculate damages on a per-pixel basis.

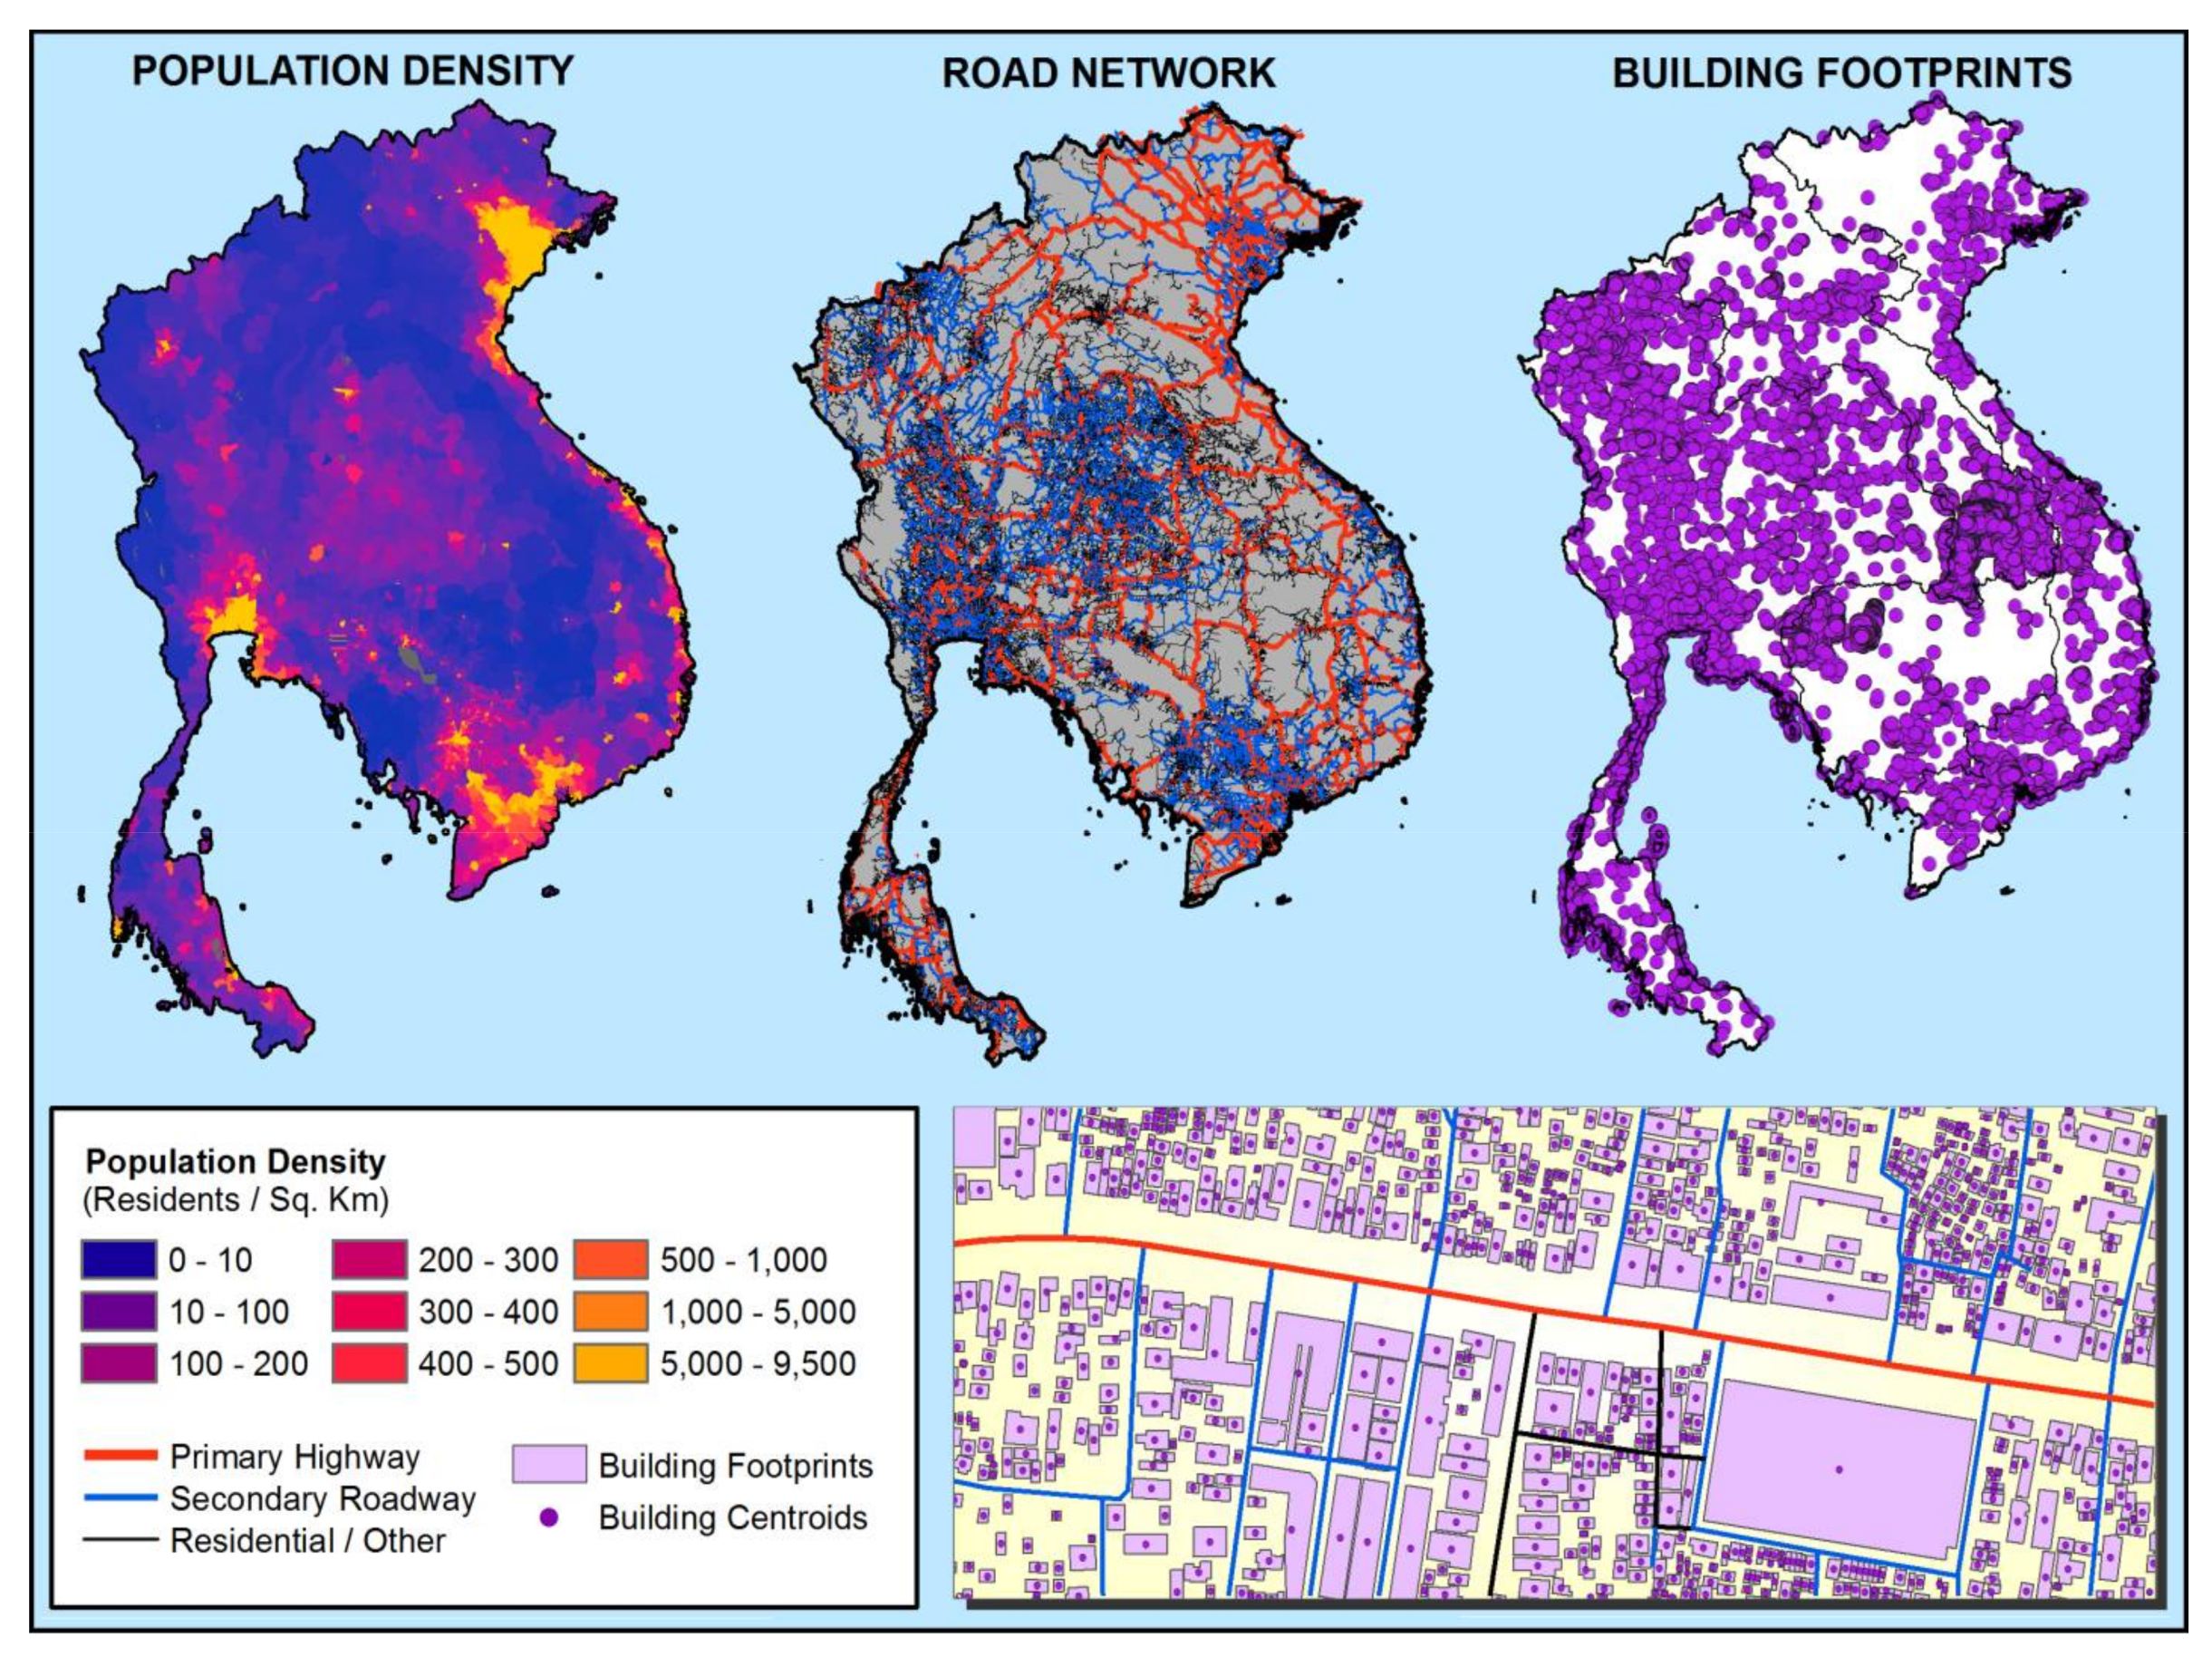
3.3. Infrastructure and Population Density
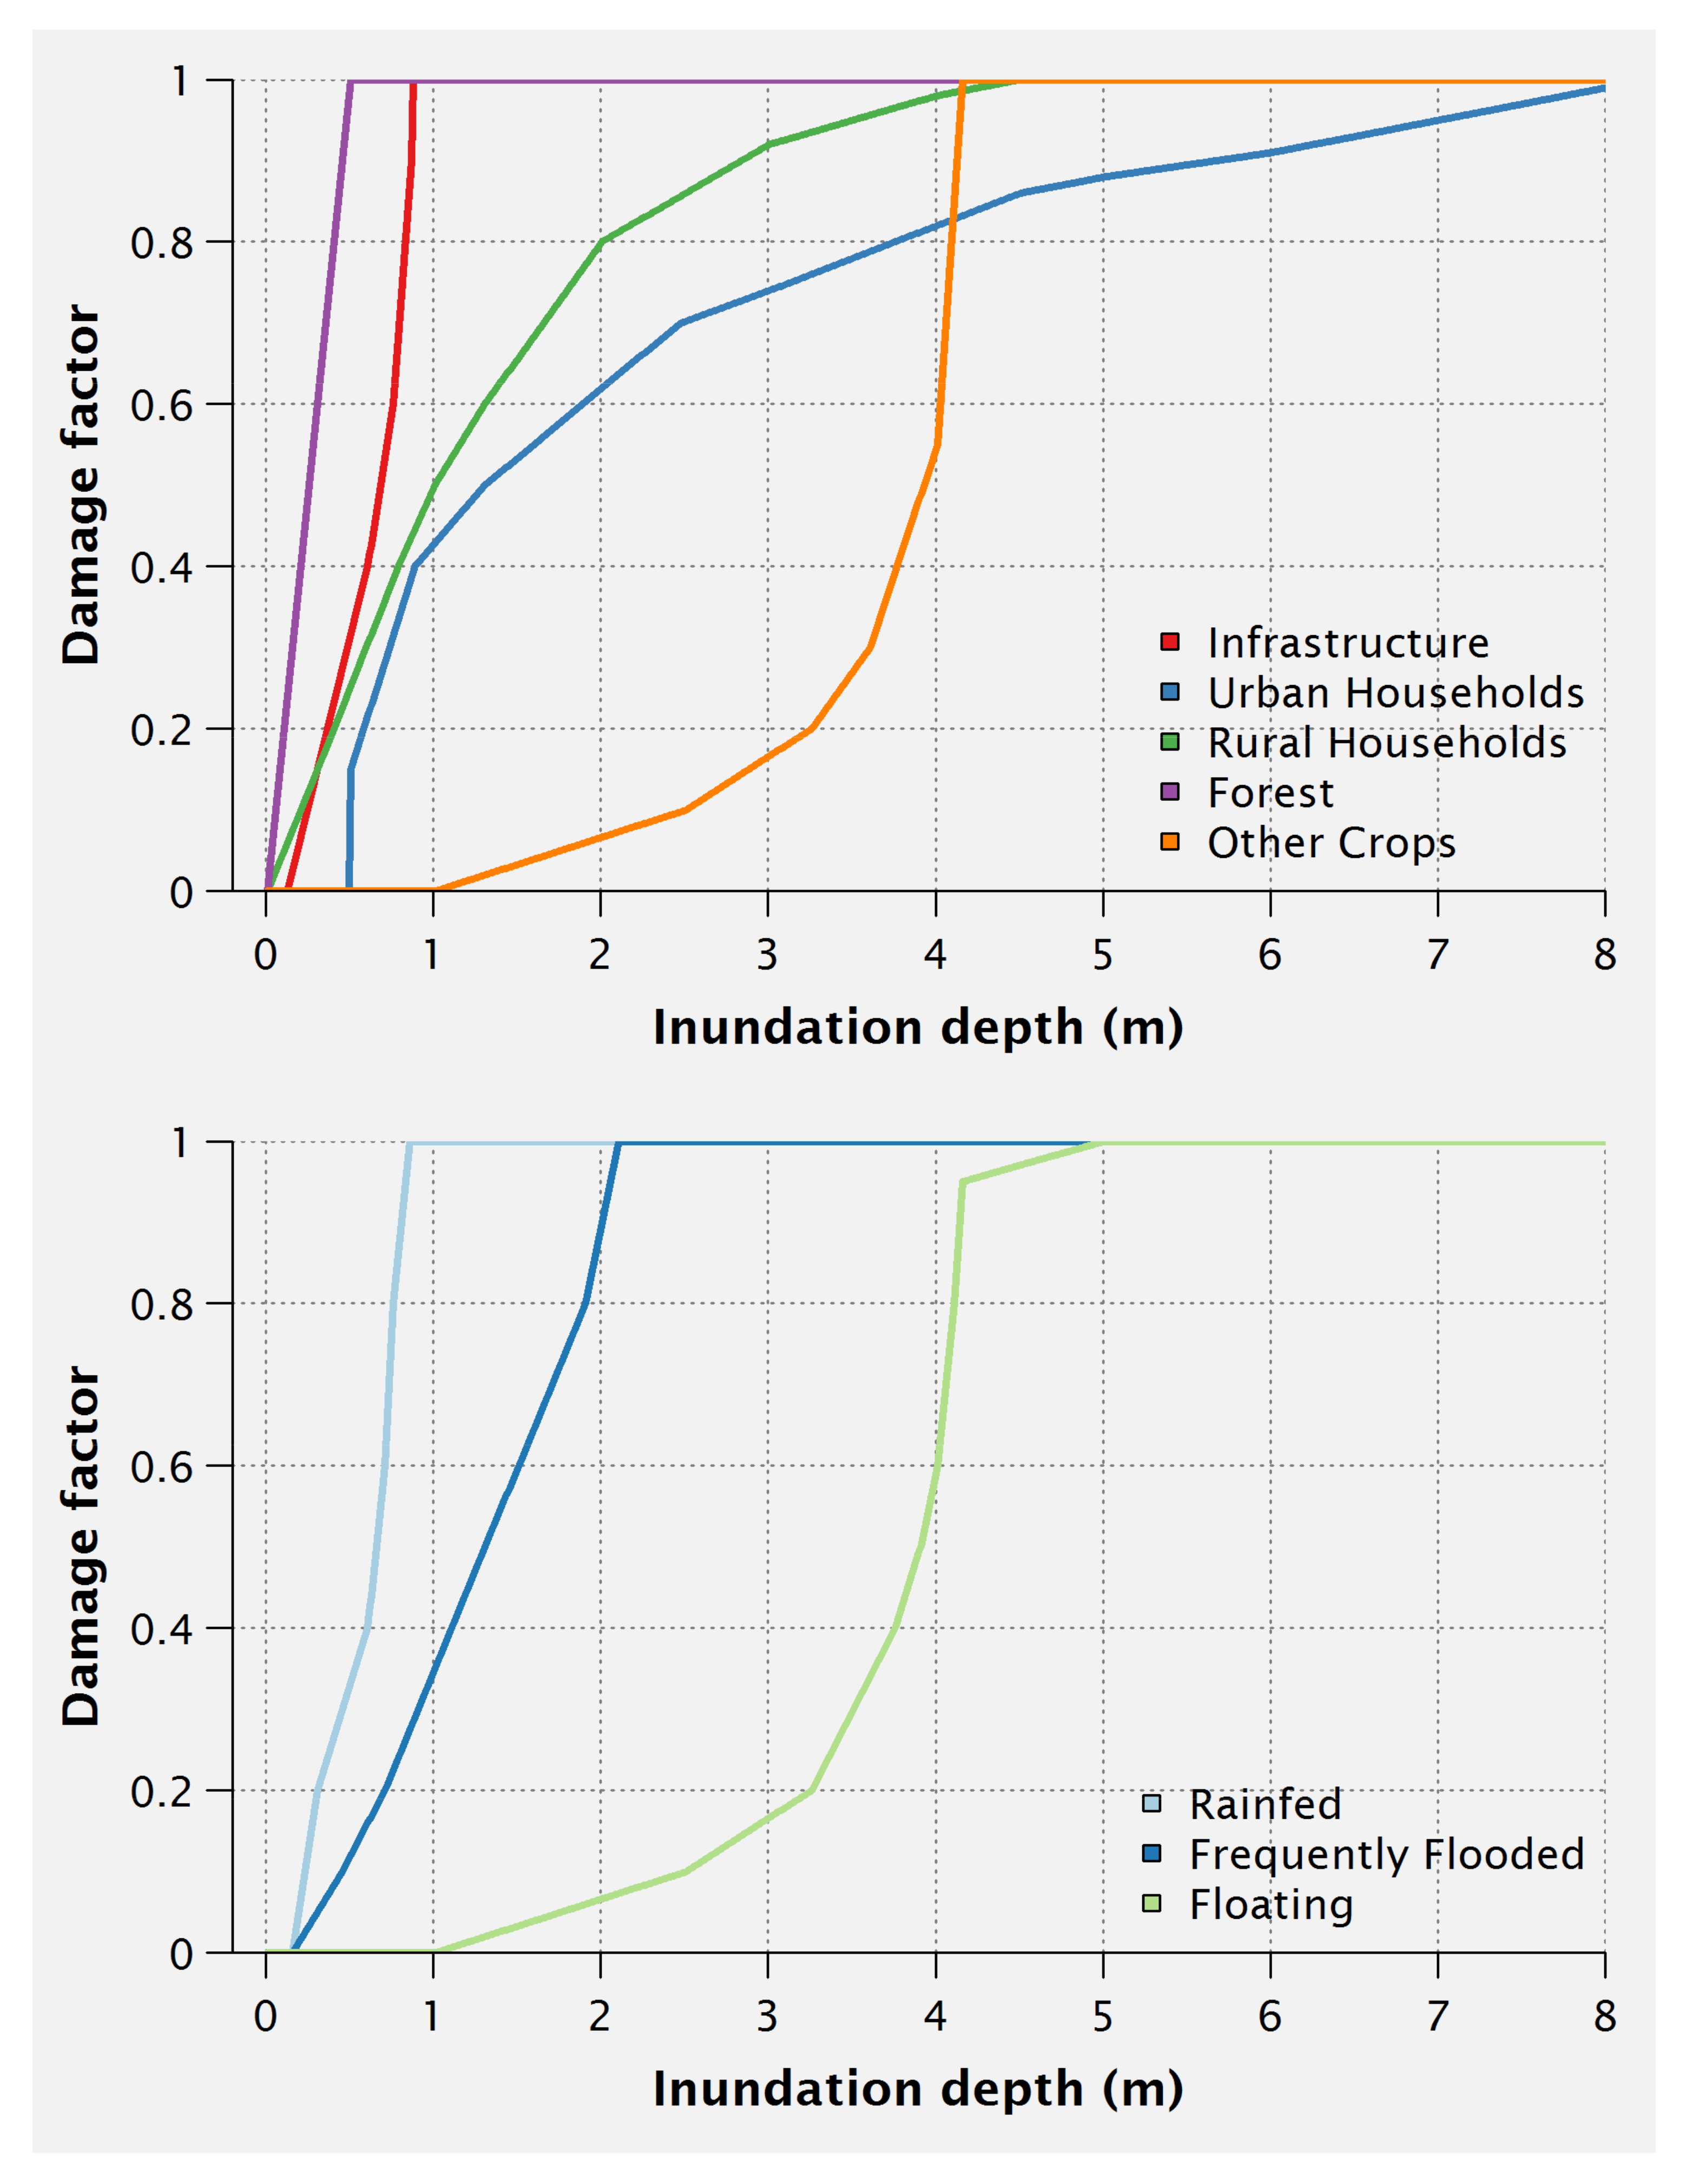
Population data produced by NASA’s Socioeconomic Data and Applications Center (SEDAC) provide global, gridded estimates of population density at a resolution of 30 arc-second (~1 km) [44]. SEDAC also provides global datasets for roadways. Road data were clipped to the study area and classified as primary (highway), secondary (roadway), or residential/other according to the attribute ‘fclass’ designation (Figure 4) [45]. Road vectors were rasterized to match the resolution of the depth raster. Rasterized roads were exported as an array with indices corresponding to road type.
Building infrastructure data were obtained from OpenStreetMap (OSM) [46,47]. Building locations and footprints were collected for the entirety of Thailand, Cambodia, Laos, and Vietnam and merged into a single dataset in QGIS. Building centroids were used to extract flood depths at point locations to estimate flood damages on a per-structure basis. Individual buildings were classified as either ‘urban’ or ‘rural’ structures according to a population density threshold of 1000/km2 (Figure 4) [48].
Leveraging open-source data presents a unique opportunity for understanding community-level impacts. However, since OSM data is user-generated, there are likely nontrivial data gaps and inconsistencies. Over 955,000 digitized structures across the Mekong region are included in this dataset, which would almost certainly underestimate the actual total number of residential and commercial buildings. For locations where OSM data does not exist but was classified as ‘Urban’ on the MRC LULC map, we supplement our understanding of infrastructure damages using the method described in Chen (2007). This approach calculates damages according to the area of urban land affected and uses a 40% correction factor to estimate the proportion of urban land occupied by infrastructure [49]. Damage estimates for both methods were combined to produce estimates for total building infrastructure damages.

3.4. Damage Model

Flood damages are calculated as a function of three variables: damage factor category, a; maximum damage value, S; and the number of affected units, n
S = i = 1 n a i n i S i
Damage factors for each category are determined by depth-damage functions (Figure 5). For each affected grid cell, the associated inundation depth is fed into the appropriate damage curve for the underlying land cover. The curves used in this study were derived primarily for use in the Huong River Basin, Vietnam, but we assume validity for other communities throughout the MRB [49]. For some of the land use classes considered in this study, no documented depth-damage relationship exists. In such cases, we adopt the closest analogue in order to approximate damage values (e.g., use ‘forest’ curve for ‘orchard’ class). This is a noted limitation of this approach and can also be seen as a motivation for the development of refined depth-damage curve datasets as well as more established land cover proxies.
Maximum damage values, Si, are also regionally-derived from studies performed in Vietnam and Thailand (Table 1) [16,17]. Maximum damage values indicate the total value assigned to a land cover type or infrastructure class per a unit area (e.g., crop destruction/m2, roads impacted/m). Specific damage amounts are calculated based on either cost of replacement or cost of reconstruction [38,49]. For the purposes of this case study, we assume any crop that comes into contact with flood waters is considered ‘totally destroyed.’ However, the literature provides alternative damage values for partially destroyed crops. For a full table of the maximum damages values used in this study, see Table A1.

4. Results

4.1. Land Cover Damages

The majority of inundation for the 2011 case study example extends from Tonle Sap Lake south toward the Mekong Delta (Figure 6). In total, approximately 23,000 km2 was found to be inundated, with the majority (58%) classified as annual cropped rice. While rice paddies did comprise most of the inundated land area, they were only found to account for around 14% of the total damages (Table 2). The flooded forest belt surrounding the Tonle Sap Lake accounted for the majority of land cover damages (64%), due to its comparatively higher maximum damage value for Forests (0.84 vs. 0.078 USD/m2), as well as the sensitivity of the ‘Forest’ damage curve to inundation depths between 0 and 0.5 m. The exact damage values for the forest class were derived from the Vietnamese Central Region Urban Environment Improvement Project (CRUEIP) as the unit cost to replace forest in the Thua Thien Hué Province [49,50]. As the expected damages for each land cover class are highly dependent on the associated maximum damage value, it is worth evaluating whether local values can be applied regionally. For a more detailed discussion of the limitations of this framework, see the Discussion and Conclusions section.

4.2. Infrastructure Damages

Over 275 km2 of ‘urban’ land and 29,170 individual structures were exposed to inundation across the study area, according to the open source data. Total estimates of urban and residential damages amounted to $710 million. Nearly 5000 km of roads were flooded with nearly all being classified as either secondary roadways or residential streets. Roads were flooded at an average depth of 1.1 m, with an upper 95% quantile depth of 3.63 m.

4.3. Populations Affected

The ASAR-WSM flood extent encompassed an area of roughly 40,500 km2. Based on population densities of the SEDAC dataset, it was estimated that approximately 4.1 million people resided within the inundated extent. Estimates from the United States Agency for International Development (USAID) place the total number of ‘affected people’ at over 4.73 million across Thailand, Cambodia, Laos, and Vietnam (USAID, 2011). Due to the satellite path, part of the inundated area along the Mekong Delta was not included in this analysis, which could potentially explain the discrepancy between these figures.

5. Discussion and Conclusions

The 2011 Southeast Asia flood provides a valuable case study for demonstrating the feasibility of near real-time damage assessments. Our results demonstrate that GIS-based approaches to such assessments can efficiently synthesize geospatial and economic data to produce damage estimates at time scales useful for first responders and decision makers. Furthermore, the impact assessment framework can be readily implemented at different spatial scales and locations, providing that associated depth-damage relationships and maximum damage values are known. While the method described here may have some advantages over traditional post-even evaluations, it is subject to uncertainties surrounding the estimated flood depths as well as the damage factors used.

5.1. Flood Depth Estimates

Flood depth estimates serve as the primary driving variable for the damage curves used in this study. While organizations like the MRC have an extensive network of hydrological monitoring stations (e.g., discharge, meteorological, or rain gauge stations), there is a limited distribution of real-time river gauges [51,52]. In the absence of widespread field-based observations of inundation depths from the 2011 flood, we compared the output of the TIN-derived depths with modeled estimates produced by the MRC. A simulation of a large flood event was generated using the MIKE11 hydrodynamic model, which produced estimates of inundation extent and depth at 100-m horizontal resolution. Geographic agreement between the ASAR-detected flood extent and the modeled extent was fair, with the modeled output failing to capture flooding north of the Tonle Sap Lake (Figure A1). Where inundation extents overlapped, the flood depths also showed good agreement (Figure A2). For this comparison, TIN-derived depths less than one meter were binned up to one meter, to match the MIKE11 output (the full distribution of the inundation depths produced by this study can be seen in Figure A3).
As previously mentioned, the MERIT DEM used to generate the flood depth estimates is also not without uncertainty. While this updated dataset achieves a nearly 20% improvement in land-area mapped with ±2 m or better vertical accuracy, higher-resolution elevation datasets would prove more useful for community-level flood assessment [42].

5.2. Damage Estimate Validation

Comparing modeled damages with government or agency estimates raises distinct methodological challenges. In the case of the 2011 floods, multiple storms occurred over the course of several anomalous months. It is, therefore, difficult to distinguish which damages were a direct result of specific flood events [30]. When damage figures are reported in post-event evaluations, statistics detailing affected population and infrastructure are reported by a wide array of sources (e.g., governments, agencies, and news outlets). Estimates can vary widely depending on the source and the timing [53]. Limited documentation can also make it unclear whether reported damages contain just direct tangible effects, or if estimates of indirect and intangible damages are included. Furthermore, methods by which agencies formulate estimates can often be ambiguous and can be based on little or no accurate information [49,50]. Therefore, we make no attempt to directly compare the estimates in this study to those produced by any government agencies. Instead, we emphasize that the lack of transparency surrounding many existing damage assessments highlights the benefits of using structured, standardized frameworks like HAZUS or the Standard Method.
While the inclusion of open-source data from OSM can potentially provide some community-level insight into flood impacts, the sparseness of user-generated data likely means that urban damage figures are underestimated. In particular, critical infrastructure like healthcare facilities, schools, transportation hubs, and energy infrastructure were all classified simply as ‘urban.’ The framework as designed, however, can readily be updated with newer data as they are generated, allowing for more granular valuations of high priority infrastructure.
As previously discussed, the lack of locally-specific depth-damage relationships can potentially obscure our findings. While several of the damage curves and maximum damage values used in this study are regionally-sourced, the diverse landscape in the LMB requires a more detailed understanding of how to value flood impacts. The high magnitude of the damages surrounding the Tonle Sap region, for example, illustrates the need for a more nuanced understanding of the unique depth-damage relationships for each specific land cover class. In this analysis, all forest classes were considered using the same damage curves, yet the specific morphology of the flooded forest ecosystem makes it highly adapted to seasonal inundation. It is, therefore, unlikely flood levels of under 1-m would result in the total losses assumed by the current ‘Forest’ damage curve.
Another potential limitation is the ethnography of the region. Mekong communities are well adapted to seasonal flooding and have been living in floodplains for thousands of years. Many residents have experienced periodic flooding in their lifetimes (e.g., in 2000), and are accustomed to living in flood conditions or relocating in times of flood [28]. Further, houses in the LMB can be semi-resilient to flooding by employing high stilts and sometimes being constructed as floating houses. These factors complicate the estimation of “affected” population, and on-the-ground efforts as well as higher-resolution remote sensing images should be employed where possible to fill these data gaps. One possibility is to employ a probabilistic approach in which affected populations are assessed in terms of possible ranges or likelihoods.
Ultimately, the damage values presented here require an explicit understanding of the limitations of the analysis. The previously discussed uncertainties in both model parameters and structure make it difficult to view the damages themselves as much more than rapid, initial estimates. However, these estimates can still provide valuable information by pinpointing areas of interest for more focused investigation. Several recent studies note that rapid assessments of economic losses can aid in the allocation of potentially scarce resources during the recovery and reconstruction phases of a flood event [54,55]. The case study application presented here illustrates how the damages could be assessed using historical imagery, but the same process could also be applied to flood forecast maps, further increasing its value for future risk planning.

6. Future Work

The aim of this analysis was to demonstrate the feasibility of a rapid damage assessment framework to assess and visualize flood impacts of the 2011 Southeast Asia floods. The analysis can be readily expanded to the entire Mekong region as it is integrated with the near real-time product, Project Mekong. The damage model used in this analysis has a number of simplifying assumptions that could merit further investigation. While inundation depth was the only driver of flood damages considered here, future analysis of time series data could provide insight into flood duration as a driver.
The updated LCLU maps provided by the LMB improve our understanding of damages to different land classes but further refinement is still possible, particularly with respect to crop production. The Mekong Delta is known as the “rice bowl” of Vietnam, and food security is an ongoing area of research in such a densely-populated part of the world [21,28]. Crop rotations and planting calendars play a large role in which varieties of rice are growing in any given month, so improved treatment of crop distributions would better constrain our damage estimates.
Many of the socioeconomic datasets used here are static and could benefit from improved spatial resolution. As new socioeconomic data (e.g., power lines, power plants, internet/cable lines, etc.) and satellite data (e.g., Sentinel 1B) become available, the system should be updated to include the most relevant and latest data.

Acknowledgments

The authors would like to thank Joseph Spruce and members of the Bolten research group for exploratory research and thoughtful discussion of this research. Support for this study provided by the NASA Applied Sciences Program with cooperation from the Asian Disaster Preparedness Center (ADPC). This work made use of the Open Science Data Cloud (OSDC) which is an Open Cloud Consortium (OCC)-sponsored project. OSDC is supported in part by grants from Gordon and Betty Moore Foundation and the National Science Foundation and major contributions from OCC members like the University of Chicago.

Author Contributions

P.C.O., A.A., and J.D.B. conceived and designed the research; A.A. designed the flood detection model while P.C.O. designed and integrated the impact assessment model; P.C.O., A.A., and J.D.B. analyzed the data; P.C.O. wrote the manuscript.

Conflicts of Interest

The authors declare no conflict of interest.

Appendix A

Table A1. Land utilities with corresponding maximum damage values used in this study.
Land UtilityMaximum Damage Value (Si)
Rice Rotated with Annual Crop0.078
Annual Crop0.109
Shifting Cultivation0.109
Orchard0.03
Flooded Forest0.84
Grassland0.03
Shrub Land0.03
Urban29
Bare Land-
Industrial Plantation0.3
Deciduous Forest0.84
Evergreen Forest0.84
Forest Plantation0.84
Bamboo Forest0.147
Coniferous Forest0.84
Mangrove0.639
Marsh/Swamp0.03
Aquaculture1.706
Aquaculture Rotated with Rice0.639
Figure A1. Comparison of inundation extent between the MIKE11 hydrodynamic simulation of a large flood event (A) and the Advanced Synthetic Aperture Radar (ASAR)-detected flooding (B).
Hydrology 05 00023 g0a1
Figure A2. Histogram comparing MIKE11 hydrodynamic model simulation of a large-scale flood event (A) versus the TIN estimation from this study (B). For the purposes of this comparison, TIN estimations less than one meter were binned up to one meter to match the MIKE11 convention.
Hydrology 05 00023 g0a2
Figure A3. Full distribution of inundation depths produced by TIN estimates.
Hydrology 05 00023 g0a3

References

  1. Guha-Sapir, D.; Vos, F.; Below, R.; Ponserre, S. Annual Disaster Statistical Review 2011: The Numbers and Trends; Centre for Research on the Epidemiology of Disasters (CRED): Brussels, Belgium, 2012. [Google Scholar]
  2. Ahamed, A.; Bolten, J.D. A MODIS-based automated flood monitoring system for Southeast Asia. Int. J. Appl. Earth Obs. Geoinf. 2017, 61, 104–117. [Google Scholar] [CrossRef]
  3. Jongman, B.; Kreibich, H.; Apel, H.; Barredo, J.I.; Bates, P.D.; Feyen, L.; Gericke, A.; Neal, J.; Aerts, J.C.J.H.; Ward, P.J. Comparative flood damage model assessment: Towards a European approach. Nat. Hazards Earth Syst. Sci. 2012, 12, 3733–3752. [Google Scholar] [CrossRef] [Green Version]
  4. Mekong River Commission (MRC). State of the Basin Report 2010; Mekong River Commission: Vientiane, Laos, 2010. [Google Scholar]
  5. Pech, S.; Sunada, K. Population growth and natural-resources pressures in the Mekong River Basin. AMBIO J. Hum. Environ. 2008, 37, 219–224. [Google Scholar] [CrossRef]
  6. IPCC Managing the Risks of Extreme Events and Disasters to Advance Climate Change Adaptation. In A Special Report of Working Groups I and II of the Intergovernmental Panel on Climate Change; Field, C.B.; Barros, V.; Stocker, T.F.; Dahe, Q.; Dokken, D.J.; Ebie, K.L.; Mastrandrea, M.D.; Mach, K J.; Plattner, G.-K.; Allen, S.K.; et al. (Eds.) Cambridge University Press: Cambridge, UK, 2012; p. 582. ISBN 978-1-107-02506-6. [Google Scholar]
  7. Nicholls, R.J.; Hanson, S.; Herweijer, C.; Patmore, N.; Hallegatte, S.; Corfee-Morlot, J.; Château, J.; Muir-Wood, R. Ranking Port Cities with High Exposure and Vulnerability to Climate Extremes; Organisation for Economic Co-operation and Development: Paris, France, 2008. [Google Scholar]
  8. Perera, E.D.P.; Sayama, T.; Magome, J.; Hasegawa, A.; Iwami, Y. RCP8.5-Based Future Flood Hazard Analysis for the Lower Mekong River Basin. Hydrology 2017, 4, 55. [Google Scholar] [CrossRef]
  9. Fayne, J.V.; Bolten, J.D.; Doyle, C.S.; Fuhrmann, S.; Rice, M.T.; Houser, P.R.; Lakshmi, V. Flood mapping in the lower Mekong River Basin using daily MODIS observations. Int. J. Remote Sens. 2017, 38, 1737–1757. [Google Scholar] [CrossRef]
  10. Merz, B.; Kreibich, H.; Schwarze, R.; Thieken, A. Review article “Assessment of economic flood damage”. Nat. Hazards Earth Syst. Sci. Katlenburg-Lindau 2010, 10, 1697. [Google Scholar] [CrossRef]
  11. Oddo, P.C.; Lee, B.S.; Garner, G.G.; Srikrishnan, V.; Reed, P.M.; Forest, C.E.; Keller, K. Deep Uncertainties in Sea-Level Rise and Storm Surge Projections: Implications for Coastal Flood Risk Management. Risk Anal. 2017. [Google Scholar] [CrossRef] [PubMed]
  12. Gaume, E.; Borga, M. Post-flood field investigations in upland catchments after major flash floods: Proposal of a methodology and illustrations. J. Flood Risk Manag. 2008, 1, 175–189. [Google Scholar] [CrossRef]
  13. World Bank. Vietnam 2016: Rapid Flood Damage and Needs Assessment; The World Bank Group: Washington, DC, USA, 2016; Available online: https://www.gfdrr.org/sites/default/files/publication/Vietnam%20Rapid%20Damage_FinalWebv3.pdf (accessed on 4 April 2018).
  14. Kwak, Y.; Arifuzzanman, B.; Iwami, Y. Prompt Proxy Mapping of Flood Damaged Rice Fields Using MODIS-Derived Indices. Remote Sens. 2015, 7, 15969–15988. [Google Scholar] [CrossRef]
  15. Poser, K.; Dransch, D. Volunteered geographic information for disaster management with application to rapid flood damage estimation. Geomatica 2010, 64, 89–98. [Google Scholar]
  16. Leenders, J.K.; Wagemaker, J.; Roelevink, A.; Rientjes, T.H.M.; Parodi, G. Development of a damage and casualties tool for river floods in northern Thailand. In Flood Risk Management: Research and Practice; Taylor & Francis: London, UK, 2009; pp. 1707–1715. ISBN 978-0-415-48507-4. [Google Scholar]
  17. Giang, N.T.; Chen, J.; Phuong, T.A. A method to construct flood damage map with an application to Huong River basin, in Central Vietnam. J. Sci. Earth Environ. Sci. 2009, 25, 10–19. [Google Scholar]
  18. Wagemaker, J.; Leenders, J.; Huizinga, J. Economic valuation of flood damage for decision makers in the Netherlands and the Lower Mekong River Basin. In Proceedings of the 6th Annual Mekong Flood Forum, Phnom Penh, Cambodia, 27–28 May 2008; pp. 27–28. [Google Scholar]
  19. Mekong River Commission (MRC). Annual Mekong Flood Report 2011; Mekong River Commission: Vientiane, Laos, 2011; p. 72. [Google Scholar]
  20. Ahamed, A.; Bolten, J.; Doyle, C.; Fayne, J. Near Real-Time Flood Monitoring and Impact Assessment Systems. In Remote Sensing of Hydrological Extremes; Lakshmi, V., Ed.; Springer: Cham, Switzerland, 2017; pp. 105–118. ISBN 978-3-319-43743-9. [Google Scholar]
  21. Chinh, D.T.; Bubeck, P.; Dung, N.V.; Kreibich, H. The 2011 flood event in the Mekong Delta: Preparedness, response, damage and recovery of private households and small businesses. Disasters 2016, 40, 753–778. [Google Scholar] [CrossRef] [PubMed]
  22. Chinh, D.; Dung, N.; Gain, A.; Kreibich, H. Flood Loss Models and Risk Analysis for Private Households in Can Tho City, Vietnam. Water 2017, 9, 313. [Google Scholar] [CrossRef]
  23. Kamoshita, A.; Ouk, M. Field level damage of deepwater rice by the 2011 Southeast Asian Flood in a flood plain of Tonle Sap Lake, Northwest Cambodia. Paddy Water Environ. 2015, 13, 455–463. [Google Scholar] [CrossRef]
  24. Liu, S.; Lu, P.; Liu, D.; Jin, P.; Wang, W. Pinpointing the sources and measuring the lengths of the principal rivers of the world. Int. J. Digit. Earth 2009, 2, 80–87. [Google Scholar] [CrossRef]
  25. Mekong River Commission (MRC). Overview of the Hydrology of the Mekong Basin; Mekong River Commission: Vientiane, Laos, 2005. [Google Scholar]
  26. Kuenzer, C.; Guo, H.; Schlegel, I.; Tuan, V.Q.; Li, X.; Dech, S. Varying Scale and Capability of Envisat ASAR-WSM, TerraSAR-X Scansar and TerraSAR-X Stripmap Data to Assess Urban Flood Situations: A Case Study of the Mekong Delta in Can Tho Province. Remote Sens. 2013, 5, 5122–5142. [Google Scholar] [CrossRef] [Green Version]
  27. Tang, J.C.; Vongvisessomjai, S.; Sahasakmontri, K. Estimation of flood damage cost for Bangkok. Water Resour. Manag. 1992, 6, 47–56. [Google Scholar] [CrossRef]
  28. Dun, O. Migration and Displacement Triggered by Floods in the Mekong Delta. Int. Migr. 2011, 49, e200–e223. [Google Scholar] [CrossRef]
  29. Guha-Sapir, D.; Below, R.; Hoyois, P. EM-DAT: International Disaster Database; Catholic University of Louvain: Brussels, Belgium, 2015. [Google Scholar]
  30. Haraguchi, M.; Lall, U. Flood risks and impacts: A case study of Thailand’s floods in 2011 and research questions for supply chain decision making. Int. J. Disaster Risk Reduct. 2015, 14, 256–272. [Google Scholar] [CrossRef]
  31. Department of Disaster Prevention and Mitigation (DDPM). National Disaster Risk Management Plan; Department of Disaster Prevention and Mitigation, Ministry of Interior: Bankok, Thailand, 2015.
  32. Sluimer, G.; Ogink, H.; Diermanse, F.; Keukelaar, F.; Jonkman, B.; Thanh, T.K.; Sopharith, T. Best Practice Guidelines for Flood Risk Assessment in the Lower Mekong River Basin. In Proceedings of the 7th Annual Mekong Flood Forum, Bankok, Thailand, 13–14 May 2009; p. 284. [Google Scholar]
  33. Lekuthai, A.; Vongvisessomjai, S. Intangible flood damage quantification. Water Resour. Manag. 2001, 15, 343–362. [Google Scholar] [CrossRef]
  34. Jonkman, S.N. Global perspectives on loss of human life caused by floods. Nat. Hazards 2005, 34, 151–175. [Google Scholar] [CrossRef]
  35. Jonkman, S.N. Loss of Life Estimation in Flood Risk Assessment: Theory and Applications. Ph.D. Thesis, Delft University of Technology, Delft, The Netherlands, June 2007. [Google Scholar]
  36. Bessette, D.L.; Mayer, L.A.; Cwik, B.; Vezér, M.; Keller, K.; Lempert, R.J.; Tuana, N. Building a Values-Informed Mental Model for New Orleans Climate Risk Management. Risk Anal. 2017, 37, 1993–2004. [Google Scholar] [CrossRef] [PubMed]
  37. Federal Emergency Management Agency (FEMA). HAZUS: Multi-Hazard Loss Estimation Model Methodology—Flood Model; Federal Emergency Management Agency: Washington, DC, USA, 2003.
  38. Kok, M.; Huizinga, H.J.; Vrouwenfelder, A.; Barendregt, A. Standard Method 2004. Damage and Casualties Caused by Flooding; Rijkswaterstaat: Delft, The Netherlands, 2004. [Google Scholar]
  39. UN Operational Satellite Applications Programme (UNOSAT). Flood Analysis for Cambodia 2014; UNOSAT: Phnom Penh, Cambodia, 2014; Available online: http://floods.unosat.org/geoportal/catalog/search/resource/details.page?uuid=%7B85A44723-2428-4387-B509-70191C0F7B60%7D (accessed on 28 March 2018).
  40. UNOSAT Flood Vectors-ASARWSM (27 September 2011) 2014. Available online: http://floods.unosat.org/geoportal/FP01/FL20111012KHM.gdb.zip (accessed on 28 March 2018).
  41. Cham, T.C.; Mitani, Y.; Fujii, K.; Ikemi, H. Evaluation of flood volume and inundation depth by GIS midstream of Chao Phraya River Basin, Thailand. In WIT Transactions on the Built Environment; Brebbia, C.A., Ed.; WIT Press: Southampton, UK, 2016; Volume 2, pp. 1049–1960. ISBN 978-1-78466-157-1. [Google Scholar]
  42. Yamazaki, D.; Ikeshima, D.; Tawatari, R.; Yamaguchi, T.; O’Loughlin, F.; Neal, J.C.; Sampson, C.C.; Kanae, S.; Bates, P.D. A high-accuracy map of global terrain elevations. Geophys. Res. Lett. 2017, 44, 5844–5853. [Google Scholar] [CrossRef]
  43. Kityuttachai, K.; Heng, S.; Sou, V. Land Cover Map of the Lower Mekong Basin; Mekong River Commission: Phnom Penh, Cambodia, 2016; p. 82. [Google Scholar]
  44. Center for International Earth Science Information Network (CIESIN). Gridded Population of the World, Version 4 (GPWv4): Population Density 2016. Available online: http://dx.doi.org/10.7927/H4NP22DQ (accessed on 7 November 2017).
  45. CIESIN. ITOS Global Roads Open Access Data Set, Version 1 (gROADSv1) 2013. Available online: http://dx.doi.org/10.7927/H4VD6WCT (accessed on 7 November 2017).
  46. OpenStreetMap Contributors. OpenStreetMap. Available online: https://www.openstreetmap.org/ (accessed on 7 November 2017).
  47. Haklay, M.; Weber, P. Openstreetmap: User-generated street maps. IEEE Pervasive Comput. 2008, 7, 12–18. [Google Scholar] [CrossRef]
  48. Organisation for Economic Co-operation and Development (OECD). Definition of Functional Urban Areas (FUA) for the OECD Metropolitan Database; Organisation for Economic Co-operation and Development: Paris, France, 2013. [Google Scholar]
  49. Chen, J. Flood Damage Map for the Huong River Basin; University of Twente: Enschede, The Netherlands, 2007. [Google Scholar]
  50. Central Region Urban Environmental Improvement Project (CRUEIP). Supplementary Appendix [Resettlement plan]; Report and Recommendation of the President to the Board of Directors on a Proposed Loan to the Socialist Republic of Viet Nam for the Central Region Urban Environmental Improvement Project; Asian Development Bank: Manila, Philippines, 2003. [Google Scholar]
  51. Wang, W.; Lu, H.; Yang, D.; Sothea, K.; Jiao, Y.; Gao, B.; Peng, X.; Pang, Z.; Schumann, G.J.-P. Modelling Hydrologic Processes in the Mekong River Basin Using a Distributed Model Driven by Satellite Precipitation and Rain Gauge Observations. PLoS ONE 2016, 11, e0152229. [Google Scholar] [CrossRef] [PubMed]
  52. MRC. Mekong River Real Time Water Level Monitoring. Available online: http://monitoring.mrcmekong.org/ (accessed on 12 February 2018).
  53. Vinck, P. World Disasters Report: Focus on Technology and the Future of Humanitarian Action; International Federation of Red Cross and Red Crescent Societies: Geneva, Switzerland, 2013. [Google Scholar]
  54. Raza, S.F.; Ahsan, M.S.; Ahmad, S.R. Rapid assessment of a flood-affected population through a spatial data model. J. Flood Risk Manag. 2017, 10, 219–225. [Google Scholar] [CrossRef]
  55. Dutta, D.; Herath, S.; Musiake, K. A mathematical model for flood loss estimation. J. Hydrol. 2003, 277, 24–49. [Google Scholar] [CrossRef]
Figure 1. (A) Map of Mekong River Basin countries with flood extent from 2011 event. (B) Study extent showing results of the triangular interpolated network (TIN). (C) Depth raster produced by inundation depth analysis.
Hydrology 05 00023 g001
Figure 2. Plan view (upper) and cross-section schematic (lower) illustrating flood depth estimation using inundation extent. Figure adapted from Cham et al. (2015) [41]. DEM = digital elevation model.
Hydrology 05 00023 g002
Figure 3. (A) Land use/land cover (LULC) map produced by Mekong River Commission (MRC, 2010). (B) Inset showing study extent and LULC details considered in this analysis. (C) Close view of the Tonle Sap Lake region, Cambodia.
Hydrology 05 00023 g003
Figure 4. Population density (left), regional road networks (center), and building centroid and footprint data (right, below) considered in this study.
Hydrology 05 00023 g004
Figure 5. Damage factor curves for agriculture, forest, and infrastructure classes (upper) and rice varieties (lower) found in the Lower Mekong Basins (LMB). Curves digitized and adapted from Chen (2007) [49].
Hydrology 05 00023 g005
Figure 6. Results of damage assessment for land cover categories. Color gradient represents severity of damages in USD/m2.
Hydrology 05 00023 g006
Table 1. Maximum damage values (Si) used in this study.
Land UtilityUSD/m2Source
Agriculture
Rice, totally destroyed0.078Leenders et al. (2009)
Crop, totally destroyed0.109
Other plants, totally destroyed0.147
Rice, partially destroyed0.027
Crop, partially destroyed0.030
Other plants, partially destroyed0.030
Fishery
Farm ponds and paddy fields0.639Leenders et al. (2009)
Shrimp and shell fish 1.706
Freshwater fish0.048
Infrastructure
Urban area29Giang et al. (2009)
Rural area22
Provincial road80
National road400
Railway1000
Other crops0.02
Forest0.84
Table 2. Affected area and damage estimates for land utilities considered in this study.
Land UtilityArea (km2)Damages (USD)
Rice Rotated with Annual Crop 13,355.05 645,235,056
Annual Crop1502.03 126,696,853
Shifting Cultivation38.02 3,073,550
Orchard332.35 6,572,509
Flooded Forest 3542.54 2,889,181,644
Grassland 1938.22 44,535,518
Shrub Land 1398.63 34,103,750
Urban 275.17 710,538,630
Bare Land 68.65 0
Industrial Plantation1.42 24,608
Deciduous Forest 8.43 2,905,977
Evergreen Forest 2.28 1,530,465
Forest Plantation --
Bamboo Forest11.35 8,798,317
Coniferous Forest --
Mangrove1.71842,254
Marsh/Swamp 482.85 12,703,670
Aquaculture 8.32 211,169
Aquaculture Rotated with Rice 26.39 27,770
Total22,9934,486,981,740

