Case Report

Overflow Discharges and Flooding Areas from Flood Hydrographs Routing in Arda River, Greece

1
Department of Civil Engineering, Democritus University of Thrace, 67100 Xanthi, Greece
2
Department of Forestry and Management of the Environment and Natural Resources, Democritus University of Thrace, 68200 Orestiada, Greece
*
Author to whom correspondence should be addressed.
Hydrology 2018, 5(3), 31; https://doi.org/10.3390/hydrology5030031
Submission received: 20 May 2018 / Revised: 18 June 2018 / Accepted: 19 June 2018 / Published: 21 June 2018

Abstract

:
Flooding is a natural disaster that damages infrastructure, properties, and may even cause loss of life. Major floods occur in the Arda river basin, which is shared between Greece and Bulgaria in Southeastern Europe. A flood warning system can sufficiently minimize adverse effects by helping to create a more successful and well-organized response plan. This paper presents an extensive numerical simulation of flood hydrograph routing between levees of the downstream section of the Arda river for floods with return periods from 2 to 10,000 years, using the one-dimensional software HEC-RAS. The main objective is to calculate the inundation areas, travel times of flood waves, water depths, water levels, flow velocities, and overflow volumes by simulating the hydraulic behavior of the Arda river outside its mountain watershed, where it flows through agricultural plane land with very mild slope. The great importance of the water level at the confluence of the Arda and Evros rivers (downstream boundary condition) has been pointed out for the regions near the confluence because the flow is the subcritical type. A significant finding of this work is the determination of the upper limit of the peak discharge hydrograph entering from the Arda to the Evros river to prevent the flooding of the Evros river. This finding is very important for the management of the flood flows of the Evros river, which is a major river with a complicated river system.

1. Introduction

Flooding is a major natural disaster, which considerably affects various regions all over the world. In recent years, it is one of the disasters that results in the most annual life loss [1]. Floods have caused great economic and life loss all around the world in the last two decades. For example in West Africa in 2007 [2], in Pakistan in 2010, and in China in 2010 [3].
Existing flood prediction tools, such as a flood warning system, are very useful to protect lives and infrastructures [4]. They are more often utilized to prepare at-risk communities in order to minimize flood consequences [5]. Flood warning systems can save people’s lives and reduce property damage by giving adequate lead time for leaving homes in an emergency [6]. There are two key factors to be determined: the extent of the inundation area and the travel time of the flood wave. Flood travel time is critical for people to move on in time from flood prone areas. Also, flood inundation maps are very important in representing the spatial variation of flood hazards and to provide a clearer visualization of flood behavior [7,8], on the condition that they are carefully produced and made easily available to the public [9].
The main objective of this work is to calculate the inundation areas, travel time of flood waves, water depths, water levels, and overflow volumes, etc., for various return periods by simulating the hydraulic behavior of the transboundary Arda river. The Arda river lies in southeastern Europe and the regions next to it frequently suffer from major floods. The Hydraulic Engineering Center-River Analysis System (HEC-RAS) has been used for 12 different input flood hydrographs, which have been routed through the river. Based on the results of this study, for any of these upstream inflow hydrographs of the inundation area, the water depths, the flood travel time, the overflow discharges, and various other parameters have been evaluated to draw flood inundation maps. Thus, in real-time flood warnings can be issued for the possible affected regions and online access can be provided to the public to those pre-developed inundation maps.
Bulgaria and Greece cooperated within the “European cross-border cooperation program Greece-Bulgaria 2007–2013” in a common project titled “Flood warning system establishment in Arda river basin for minimizing the risk in the cross border area—ARDAFORECAST”, in order to confront together the flood events in the area. The present work is a part of the total research carried out during this project and the results presented in this paper were used to setup a real-time flood forecasting and warning system. The project, ARDAFORECAST, includes scientific research and simulation models of natural processes such as meteorological, hydrological, and hydraulic and also considers the economic dimension of the problem [10]. Its main actions are precipitation forecast, runoff evaluation, development of a specialized software for dam management and flood avoidance, flood wave routing and inundation maps, early warning system, civil protection, hydro-meteorological system information, installation of hydrometric, and meteorological stations.
Despite the fact that the present study refers to a specific river, similar approaches can be implemented in any similar river and the results can be helpful for planners to setup a flood early warning system. Inundation maps can be very useful for stakeholders to focus on certain regions throughout evacuation actions [11]. In general, the information found in this study can lead to a more successful and well-organized way of developing a warning system based on forecasting a flood event and adopting the appropriate evacuation plan.

2. Materials and Methods
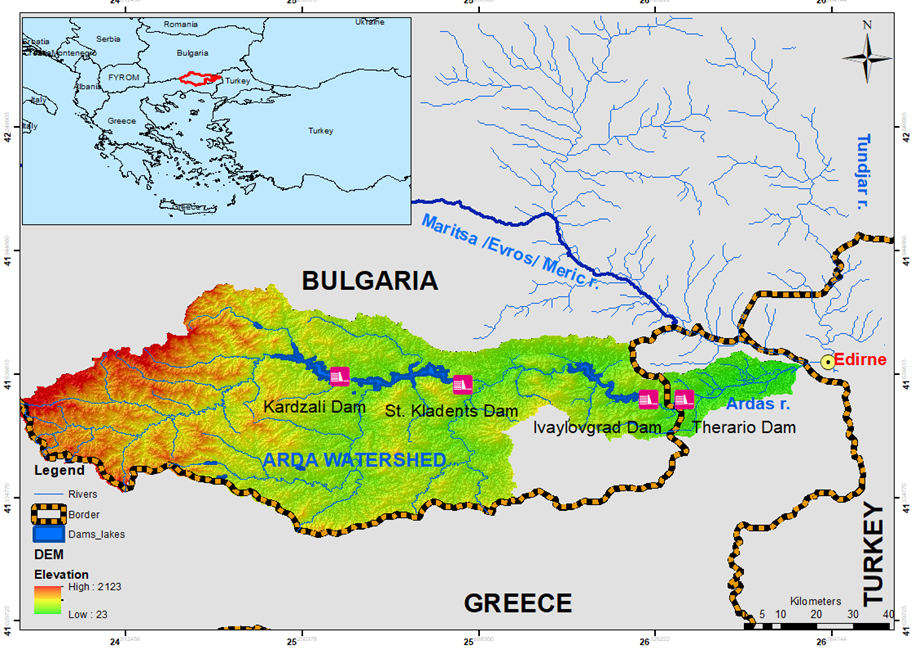
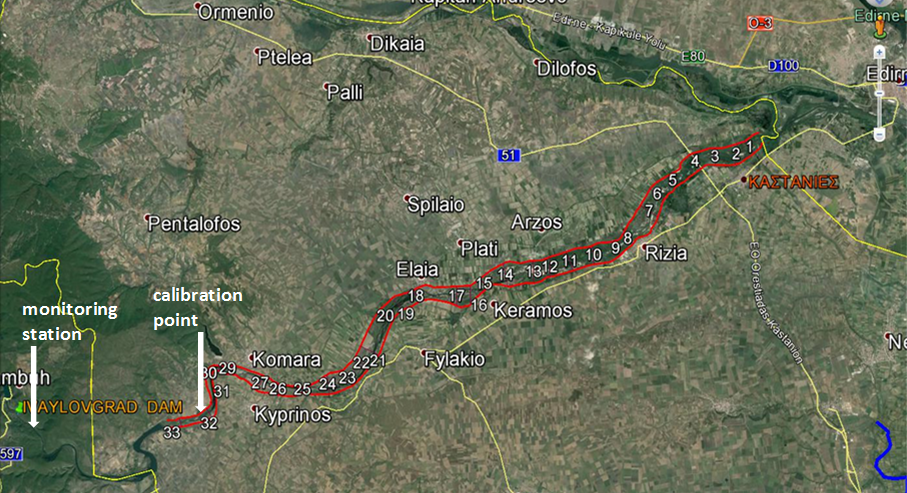
2.1. Study Area

The Arda river has a length of 290 km and it originates from Bulgaria (Figure 1). The catchment has a total area of 5600 km2, the greatest part of which (5255 km2) is located in Bulgaria, while the rest of the area (345 km2) belongs to the Greek territory. The Arda river is a tributary of the Evros (or Maritsa or Meric) river and it flows eastward, entering the Greek territory and crossing the prefecture of Evros at a length of approximately 33 km before its confluence with the Evros river near the Turkish town of Edirne (Figure 1). Three large dams (Kardzali, St. Kladenets, and Ivaylovgrad) have been constructed at the Bulgarian part of the river, having a total volume capacity of 1085 × 106 m3. There is also a fourth very small dam (Therapio dam) at the beginning of the Greek part of the river (Figure 1) for irrigation purposes with a limited volume capacity of 3.2 × 10⁶ m3.
The mountainous character of most of the hydrologic basin, in addition to the climatic conditions in the region, cause large flood discharges with extensive financial, social and environmental damages for the downstream Greek regions. Within the basin of the Arda river, dangerous flash floods have occurred many times in the past due to heavy rains and sudden snowmelt, which is a result of the compound Continental–Mediterranean climate of the territory [12,13]. The existing historical records of the last 50 years confirm that the floods generally occur at the end of winter, but flood episodes occur quite often in summer and also in other seasons [14]. Despite the presence of three large reservoirs in the Bulgarian territory mainly for hydroelectric energy production [15], serious flood episodes often take place inside the Greek territory at the downstream part of the river.

2.2. HEC-RAS Model Setup

For the Greek part of the transboundary Arda river, which is vulnerable to flooding, flood hydrographs are routed between the levees, located on either side of the river. Simulations of the physical phenomenon are made for various design discharges in order to study the hydraulic behavior of the river (depths, water levels, flow rates, velocities, and travel times, etc.), the positions and the volumes of the overflow, and the inundation areas with higher precision.
The HEC-RAS modeling software has been used for the hydraulic simulation of the Arda’s river response in various unsteady flows. The HEC-RAS was developed by the Hydrologic Engineering Center (HEC) of the United States of America and is suitable for steady and unsteady flow analysis, sediment transport calculations, and water quality analysis. To model unsteady flow, the software solves the one-dimensional equations proposed by Saint-Venant, which are obtained from the continuity and momentum equations, using an implicit method suitable for natural channels [16]. In steady flow modeling, HEC-RAS solves the energy equation to compute water depths from subsequent cross sections using an iterative process called the standard step.
Figure 2 illustrates a horizontal alignment of the Greek part of the Arda river (source: Google Earth), having a length of 32,244 m. It is the downstream part of the river, which flows outside the mountain watershed through agricultural plane land with very mild slope, close to a few small agricultural villages. In Figure 2, the locations of 33 sections are shown, which have been obtained with in situ measurements. For the present simulation five storage areas have been used on both sides of the river. These storage areas, depending on the flow conditions, can possibly flood, due to the levees overflow, which act as lateral spillways.
A frequency analysis of floods is needed in order to estimate flood hydrographs for various return periods. The construction of three large dams in this hydrologic basin altered the natural flow dramatically and the hydrological-hydraulic regime may not be natural anymore. Therefore, an interesting question that arises is whether the statistical analysis of the annual peak discharges is or is not meaningful, because the discharge is identified by the dams’ management. Some floods, due to relatively small peak discharges, which happened in the past, have now disappeared, because of the existence of the dams. Some other floods, due to larger peak discharges, may happen or not, depending on the management of the dams. So, the management of the dams is a key factor for floods of medium magnitude [10,17]. But, when the reservoirs are almost full of water and a huge inflow is coming from the hydrologic basin, because of snowmelt or a sudden rain, the role of the dams’ management is restricted. In these cases, the statistical analysis of the annual peak discharges is meaningful, since the “modified” nature will produce peak discharges for which the probability theory is valid on the condition that the dam management is always carried out following fixed rules.
For that reason, a frequency analysis of the flood discharges has been achieved, based on existing daily discharge measurements at a section after the dam of Ivaylovgrad; i.e., just before the Greek-Bulgarian border. Thus, peak daily discharges have been identified for 12 return periods corresponding to 2–10,000 years, as shown in Table 1. The hydrograph of Figure 3a (recorded hourly discharges) has been used as a hydrograph generator for various peak discharges Qi. To produce a hydrograph with peak discharge Qi, the time base has been kept the same and the hourly discharges have been multiplied by the Qi/Qp ratio, where Qp is the maximum discharge (1013.9 m3/s) of the recorded hydrograph of Figure 3a. For each flood hydrograph corresponding to one of the above mentioned 12 return periods an unsteady flow analysis has been performed for the downstream Greek part of the Arda river; i.e., for a length of about 33 km before its confluence with the Evros river (Figure 2).
All hydraulic simulations have been run by considering as upstream boundary condition the identified flood hydrographs but without the lateral contribution of local streams. This has been done for the following reasons: (a) the discharges of the local streams are usually one order of magnitude smaller than the discharges entering from the upper part of the hydrologic basin, because of smaller precipitations and much less sub-basins’ area; (b) the concentration time of the local streams’ runoff is only a few hours against some days of the upstream incoming runoff so that for a certain rainfall events the local runoff is preceded of the upstream runoff; (c) the local streams’ discharges cannot enter into the main Arda’s river bed when the water elevation is high during the flood routing and for that reason inundate the adjacent areas.

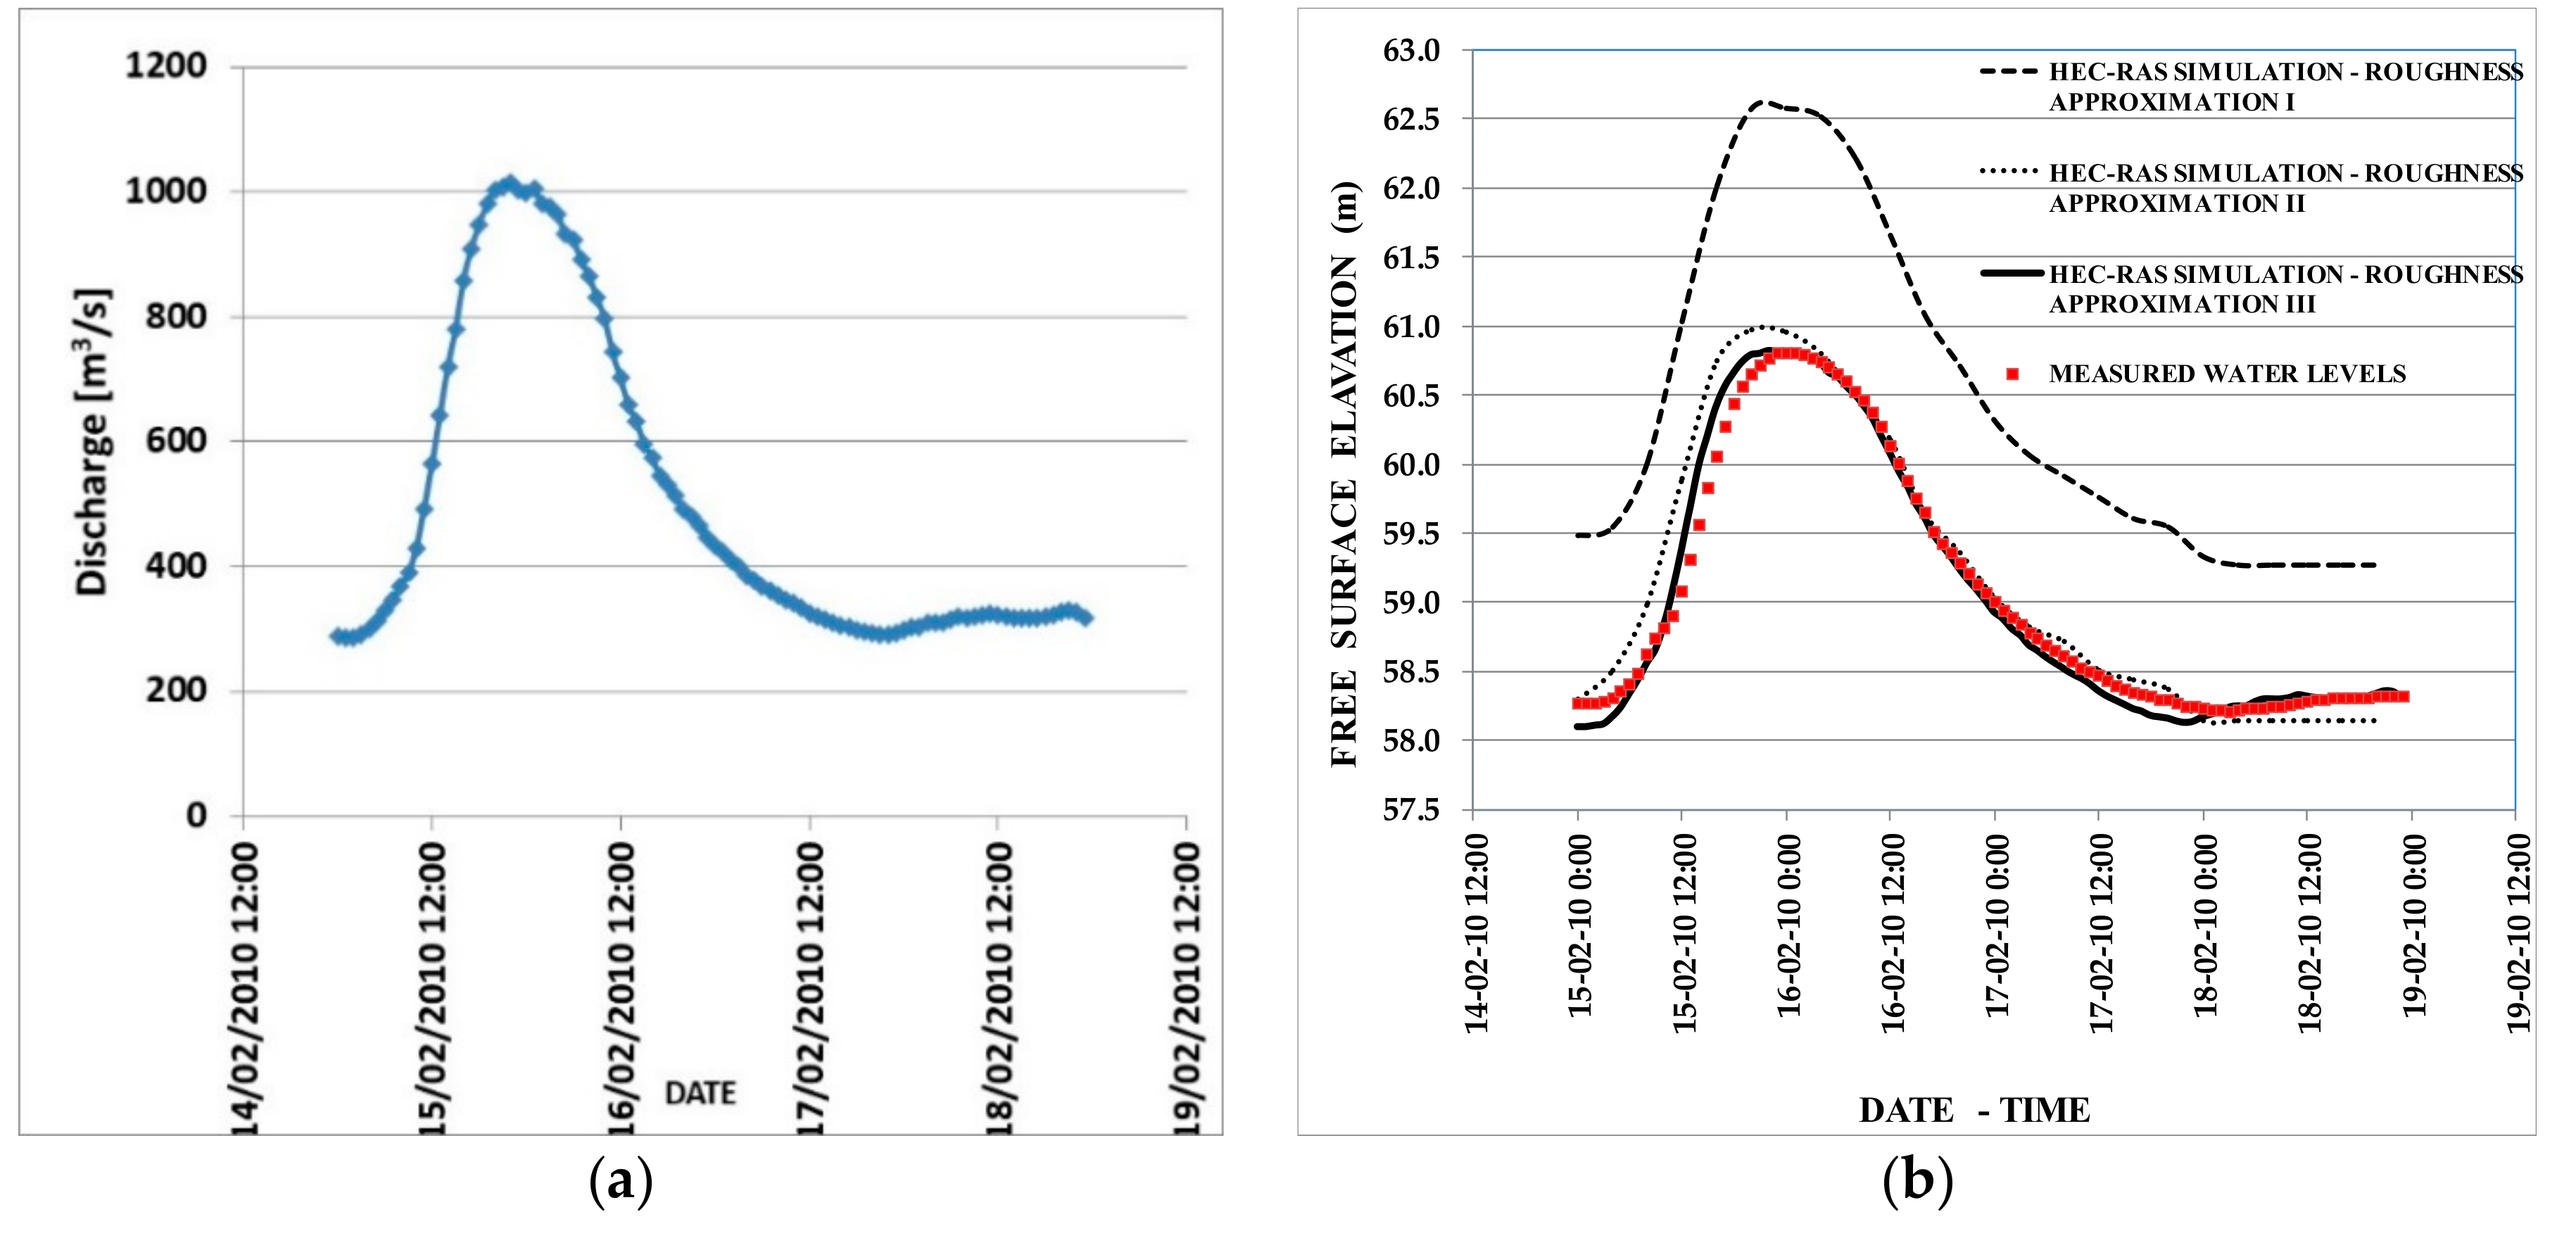
2.3. Model Calibration

An important parameter in determining the rating curve between the water level and discharge in the rivers is the effect of the vegetation in the total energy loss along the flow, ultimately expressed by the roughness coefficient. The under study part of the Arda river has a very gentle slope. During significant discharges (e.g., >1500 m3/s) the flow is directed mainly to the secondary bed, which is formed by levees having a distance in some cross-sections of up to 800 m. The vegetation at these areas is quite dense, leading to an increase of the flow resistance. In such a broad section, the Manning coefficient value is altered across the river, depending on the vegetation and ground irregularity. In the Arda river, the Populus or Poplar trees (deciduous) and the Salix or Willow trees (evergreen) dominate, while there is a large percentage of shrub with heights greater than 1 m, and therefore, the Manning coefficients, vary seasonally.
Although much research has been done to determine the roughness coefficient in the open channels [18], less research has been done on the effect of vegetation on the river flow through the valleys. The Manning coefficient in channels without vegetation can be selected from tables or can be calculated from a specific equation [19]. River irregularities due to the channel section, the alignment, the narrows, the vegetation, and the meander increase the channel roughness and thus the Manning roughness coefficient. In this case, there are several methods for the synthesis of the effect of the above river specificities in the Manning coefficient, as summarized by Chow [20].
Based on site visits and satellite images, three approximations of the Manning coefficients in 33 sections of the Arda river have been achieved. Then the flow has been simulated by the HEC-RAS model with all three approximations of the Manning coefficients, so that the simulated flow depths are compared with measured flow depths at various positions. Recorded hydrographs of the discharges can be found since 2006, but free water surface elevation measurements are available only in one position of the river, in Komara (Figure 2), where a hydrometric station was installed in 2008. The drawback of this position is that it is located near the Greek upstream end section (named 33) of the Arda river, since it is at a distance of just 916 m. However, given that the flow in the Arda river is subcritical, its behavior in Komara depends cumulatively on the hydraulic conditions and mainly on the roughness of all downstream sections; therefore it constitutes an appropriate calibration mode.
For the above reasons, the unsteady flow produced of the discharge hydrograph of February 2010 (Figure 3a) was selected to be numerically simulated, considering the three different approximations of the Manning coefficients determined above. The discharge hydrograph was recorded at the monitoring station, which was installed in 2005 after the dam of Ivaylovgrad (Figure 2) and just before the Greek-Bulgarian border. The numerical simulation gives the variation of the free water surface elevation as a function of time in all sections including the control section in Komara (see calibration point in Figure 2), wherein measurement data are available. As revealed by Figure 3b, the third approximation of the Manning roughness coefficients can be considered as the optimal calibration option for the winter, where larger floods occur. The identified Manning coefficient values varied from 0.03 to 0.07 m−1/3s for the bottom of the main channel and for the left and right secondary bed.

3. Results and Discussion

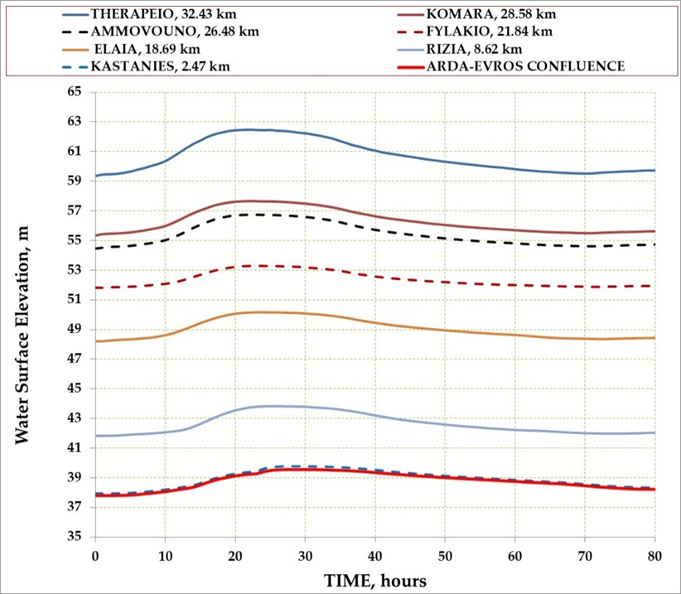
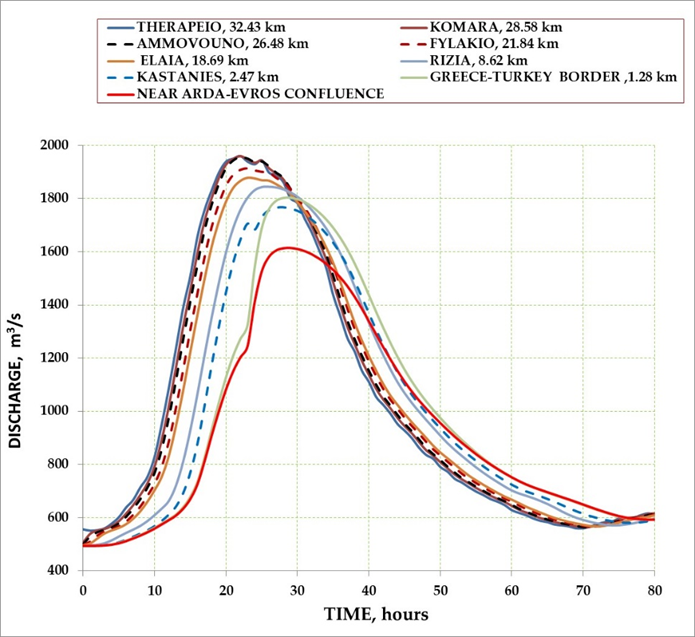
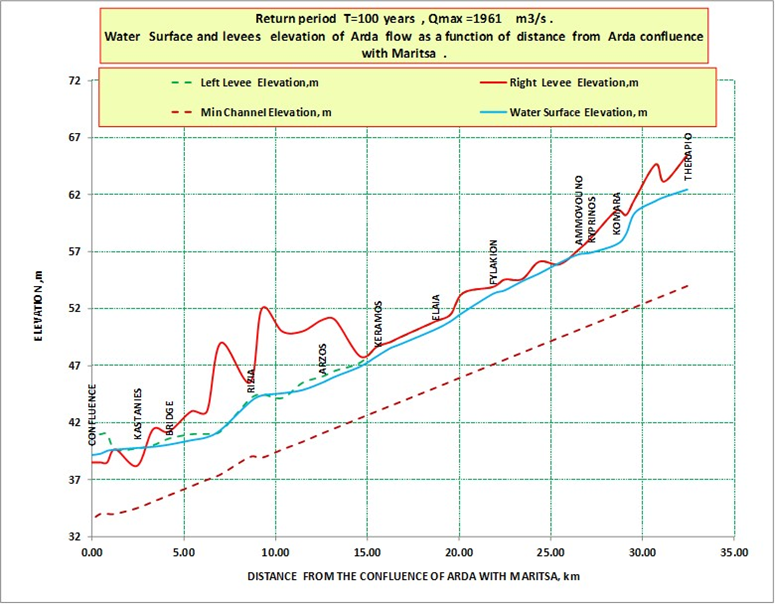
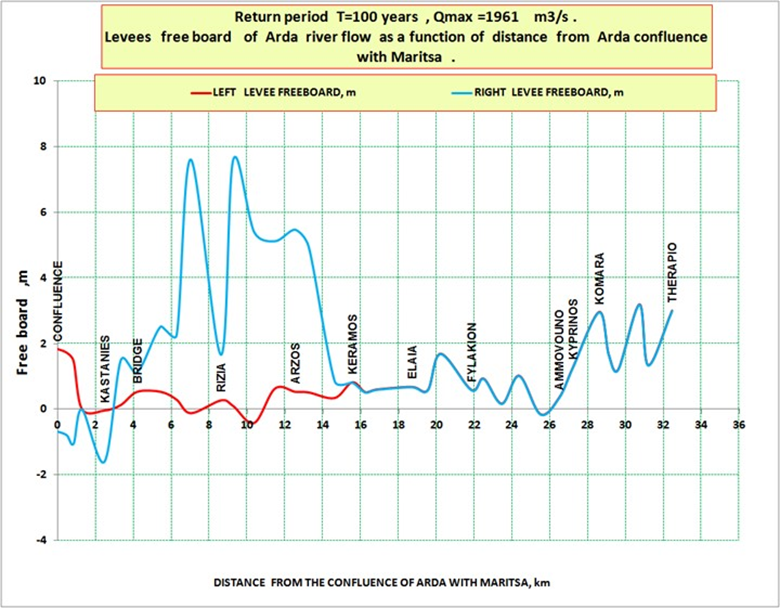
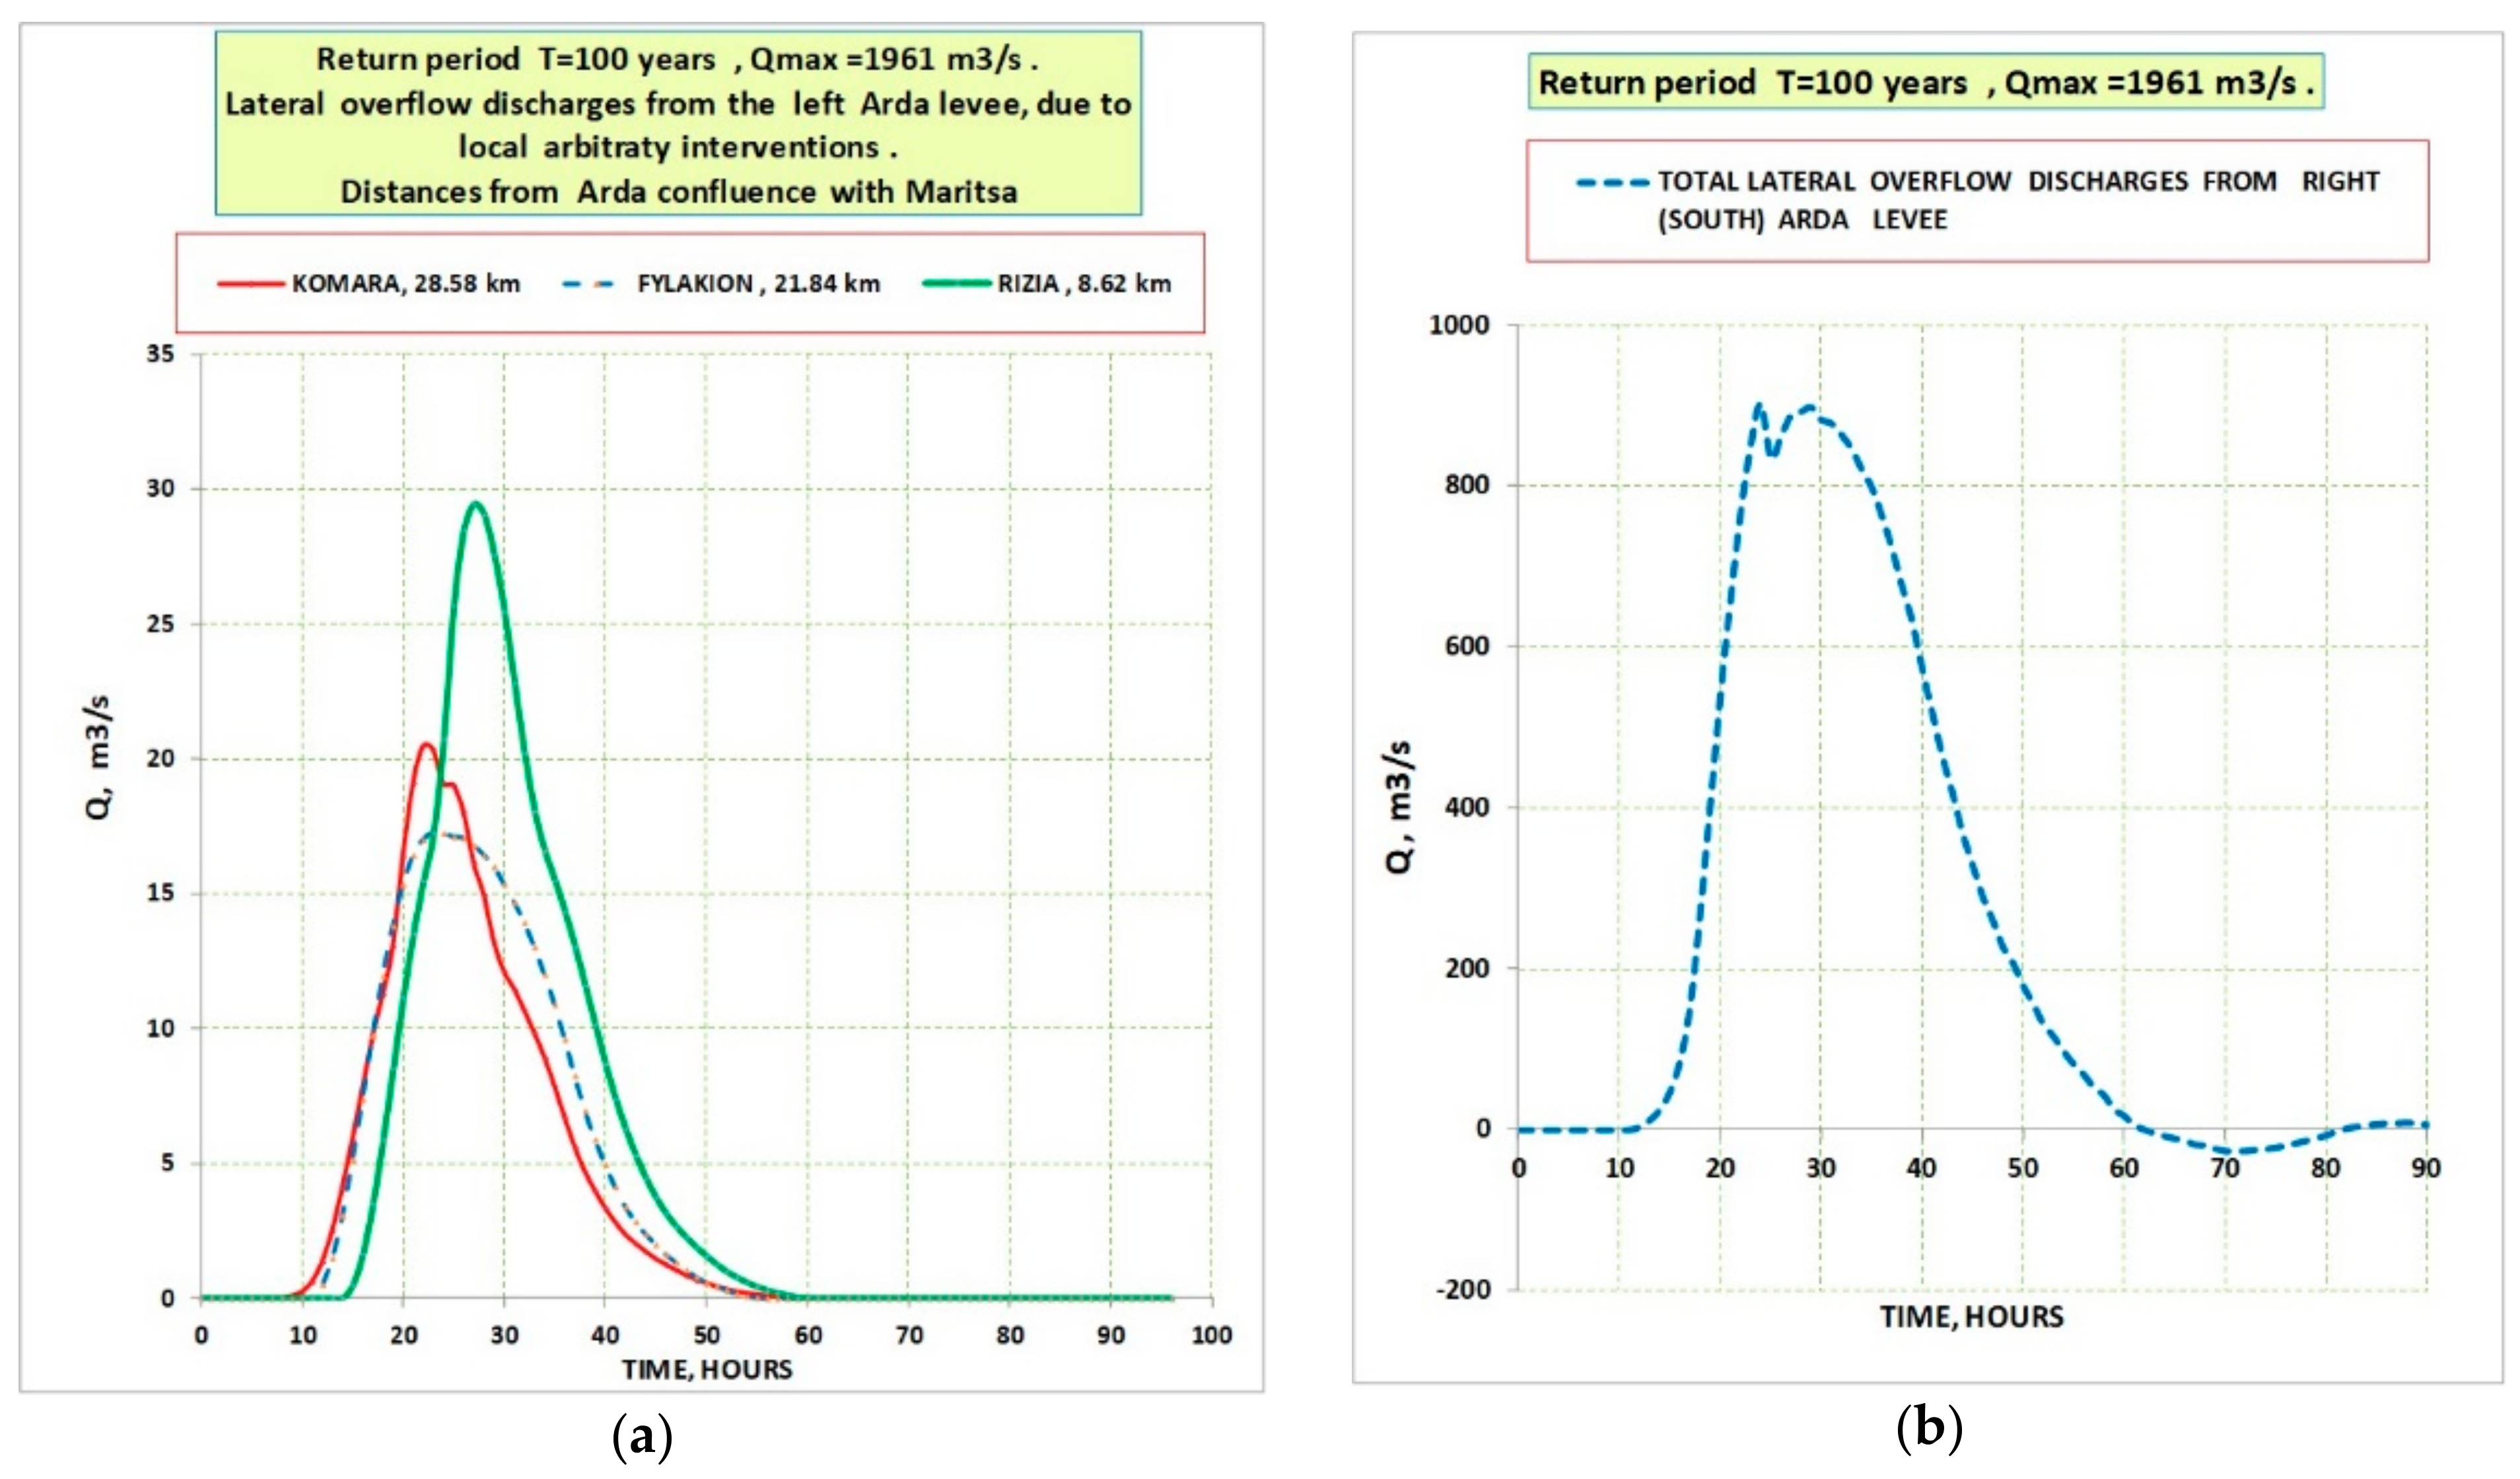
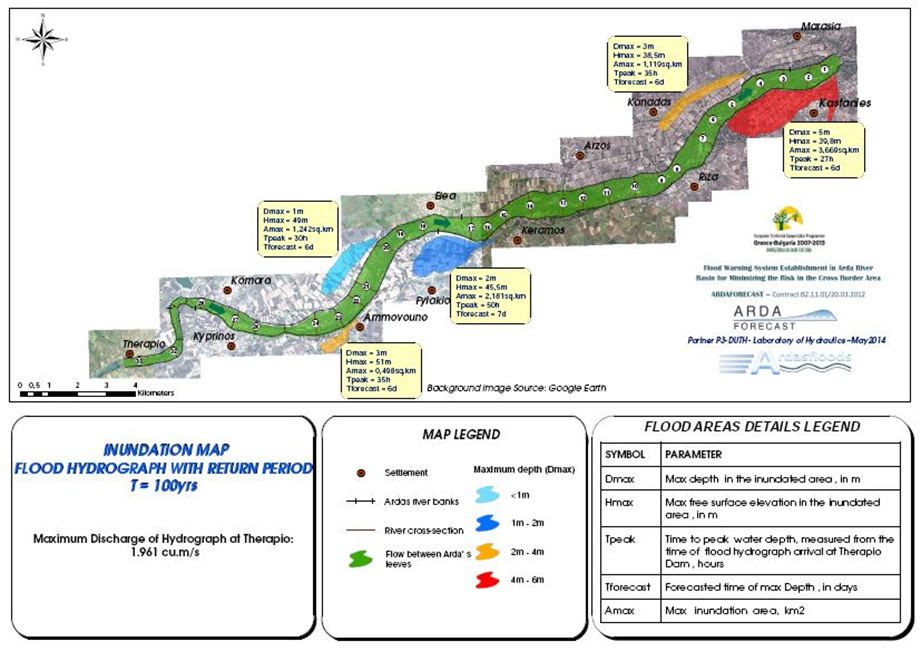
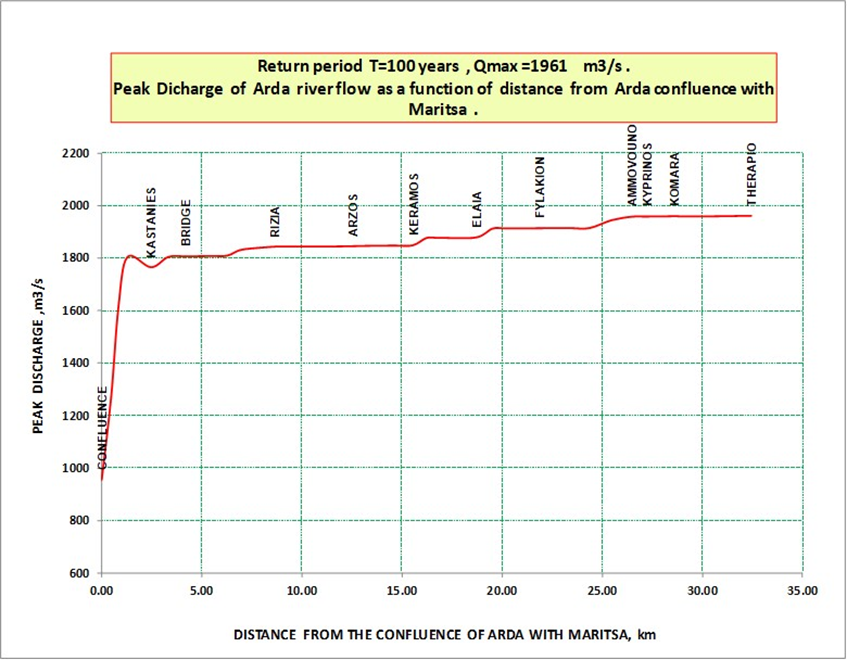
3.1. Hydraulic Characteristics–Inundation Maps–Travel Times

Simulations for various flood hydrographs with peak discharges, as shown in Table 1, have been performed in order to thoroughly study the hydraulic behavior of the Arda river in the Greek part, where the terrain is flat and larger floods usually occur. It the flow within levees was simulated, as well as their overflow and their further spreading. Because of space limits, the results of the flood routing for only one return period of T = 100 years with a peak discharge of 1961 m3/s are presented (Figure 4, Figure 5, Figure 6, Figure 7, Figure 8, Figure 9 and Figure 10). The choice to present the results for this peak discharge were made because discharges of a similar order of magnitude appeared during the last years, as for example in 2006 (1507 m3/s) and in 2015 (2467 m3/s). For each input hydrograph, the change in level of the free water surface over time has been calculated for all 33 sections, as indicatively shown in Figure 4 for some characteristic cross-sections.
The passing discharges from various cross-sections of the river as a function of time are given in Figure 5. The maximum peak discharge of 1961 m3/s appears in Therapio, where an input hydrograph has been imposed as an upstream boundary condition. The peak discharge near the confluence of the Arda river with the Evros river is about 1600 m3/s. This attenuation is mainly due to the overflows over the levees.
The river bed elevation, the free water level at each position compared to the elevation of the levees (left and right) are shown in Figure 6, in relation to the distance from the junction of the Arda and Evros rivers. The positions of overflowing can be seen in this figure, as for example in Kastanies place.
The positions of overflowing are better visualized in Figure 7, when the free board is given, i.e., the vertical distance of the water elevation from the left and right levee, in relation to the distance from the junction of the Arda and Evros rivers. When the water level rises above the level of the levees, as for example in Kastanies in Figure 7, then obviously an overflowing occurs, since the levees serve as side spillways.
In such cases, the outflow hydrographs from the river have been calculated on both sides, the left (north) and the right (south) as indicatively shown in Figure 8a. These outflows are stored in predefined storage areas, and when the water elevation inside the river becomes less than the one of a storage area, then a part of the flow returns to the river, as presented in Figure 8b for times greater to 60 h.
Accumulated overflow volume from the right (south) Arda levee is also given in Figure 9a as a function of time. The decrease of accumulated volume after the time of 60 h indicates the back flow from storage areas to the main Arda river, due to the Arda water free surface lowering. Also, the widths of the levees, which overflows, are calculated in all cases, as indicatively shown in Figure 9b.
As mentioned above, the simulation of the Arda river was performed in unsteady flow conditions for 12 different input discharge hydrographs, having the peak values of Table 1. An equal number of flood inundation maps has been carefully prepared, as indicatively presented in Figure 10. The flow between the river levees and the flooded areas—colored differently in relation to water depth—also appear in the map. For each flooded area a legend is provided, which contains the following critical technical characteristics: the maximum depth in the inundation area in meters, the maximum free surface water elevation in meters, the time to peak water depth in hours measured from the time of flood arrival at the Bulgarian-Greek border, and the maximum inundation area in square kilometers. This information helps for the preparation of an emergency action plan during flood episodes and can be used to evacuate people from the expected flooded regions.
The flood inundation maps, which have been produced in this study, have been confirmed by various recorded data such as areas of flooded regions, water levels, and water depths at characteristic points (buildings, churches, schools, etc.), drawn from the two flood events that occurred in 2006 and 2015 with peak discharges of 1507 and 2467 m3/s, respectively. This is an important validation of the reliability of the hydraulic simulation of the present work.
This downstream part of the Arda river, which has been simulated in this study, has a very mild slope, and the river flows close to a few small agricultural villages. To protect these villages and the surrounding agricultural area from floods, levees were constructed about 40 years ago to keep flood discharges up to 2000 m3/s between them. In this study, in situ geodetic measurements of the elevation of the levees have been carried out, in addition to 33 river cross-sections obtained through field measurements. However, applying these data in river response simulations using HEC-RAS, we have found that the discharge capacity of the river between the levees at various sites is much lower, such as in Kastanies, where it is about 750 m3/s. The main reasons for this situation are the various interventions to the levees, such as: (a) the construction of Irish bridges along the river simultaneously lowers the elevation of the levees to lower the slope of the entrance to the bridges; (b) arbitrary interventions to lower the elevation of the levees in order to enter the very wide section of Arda river and take sediments; (c) undetermined interventions and mistakes either in the design or in the construction of the levees.
In the present study, the overflowing locations of the levees with insufficient elevation and their basic characteristics have been estimated. For a return period of 100 years, which corresponds to a peak discharge value of 1961 m3/s, the lengths along the levees of weir outflow have been determined, which total about 1975 m. The restoration of the levees due to minor local interventions is relatively easy, since typically the local lowering of the levee is a couple of meters and the length of the is about 10 to 20 m. The total volume of earthworks, which is needed for the restoration of the left (north) and the right (south) levee is approximately 148,000 m3. Therefore, the governing authorities can examine the levees restoration or improvement with a relatively small cost, but with a considerable increase of the discharge capacity of the river from 750 to 1961 m3/s.

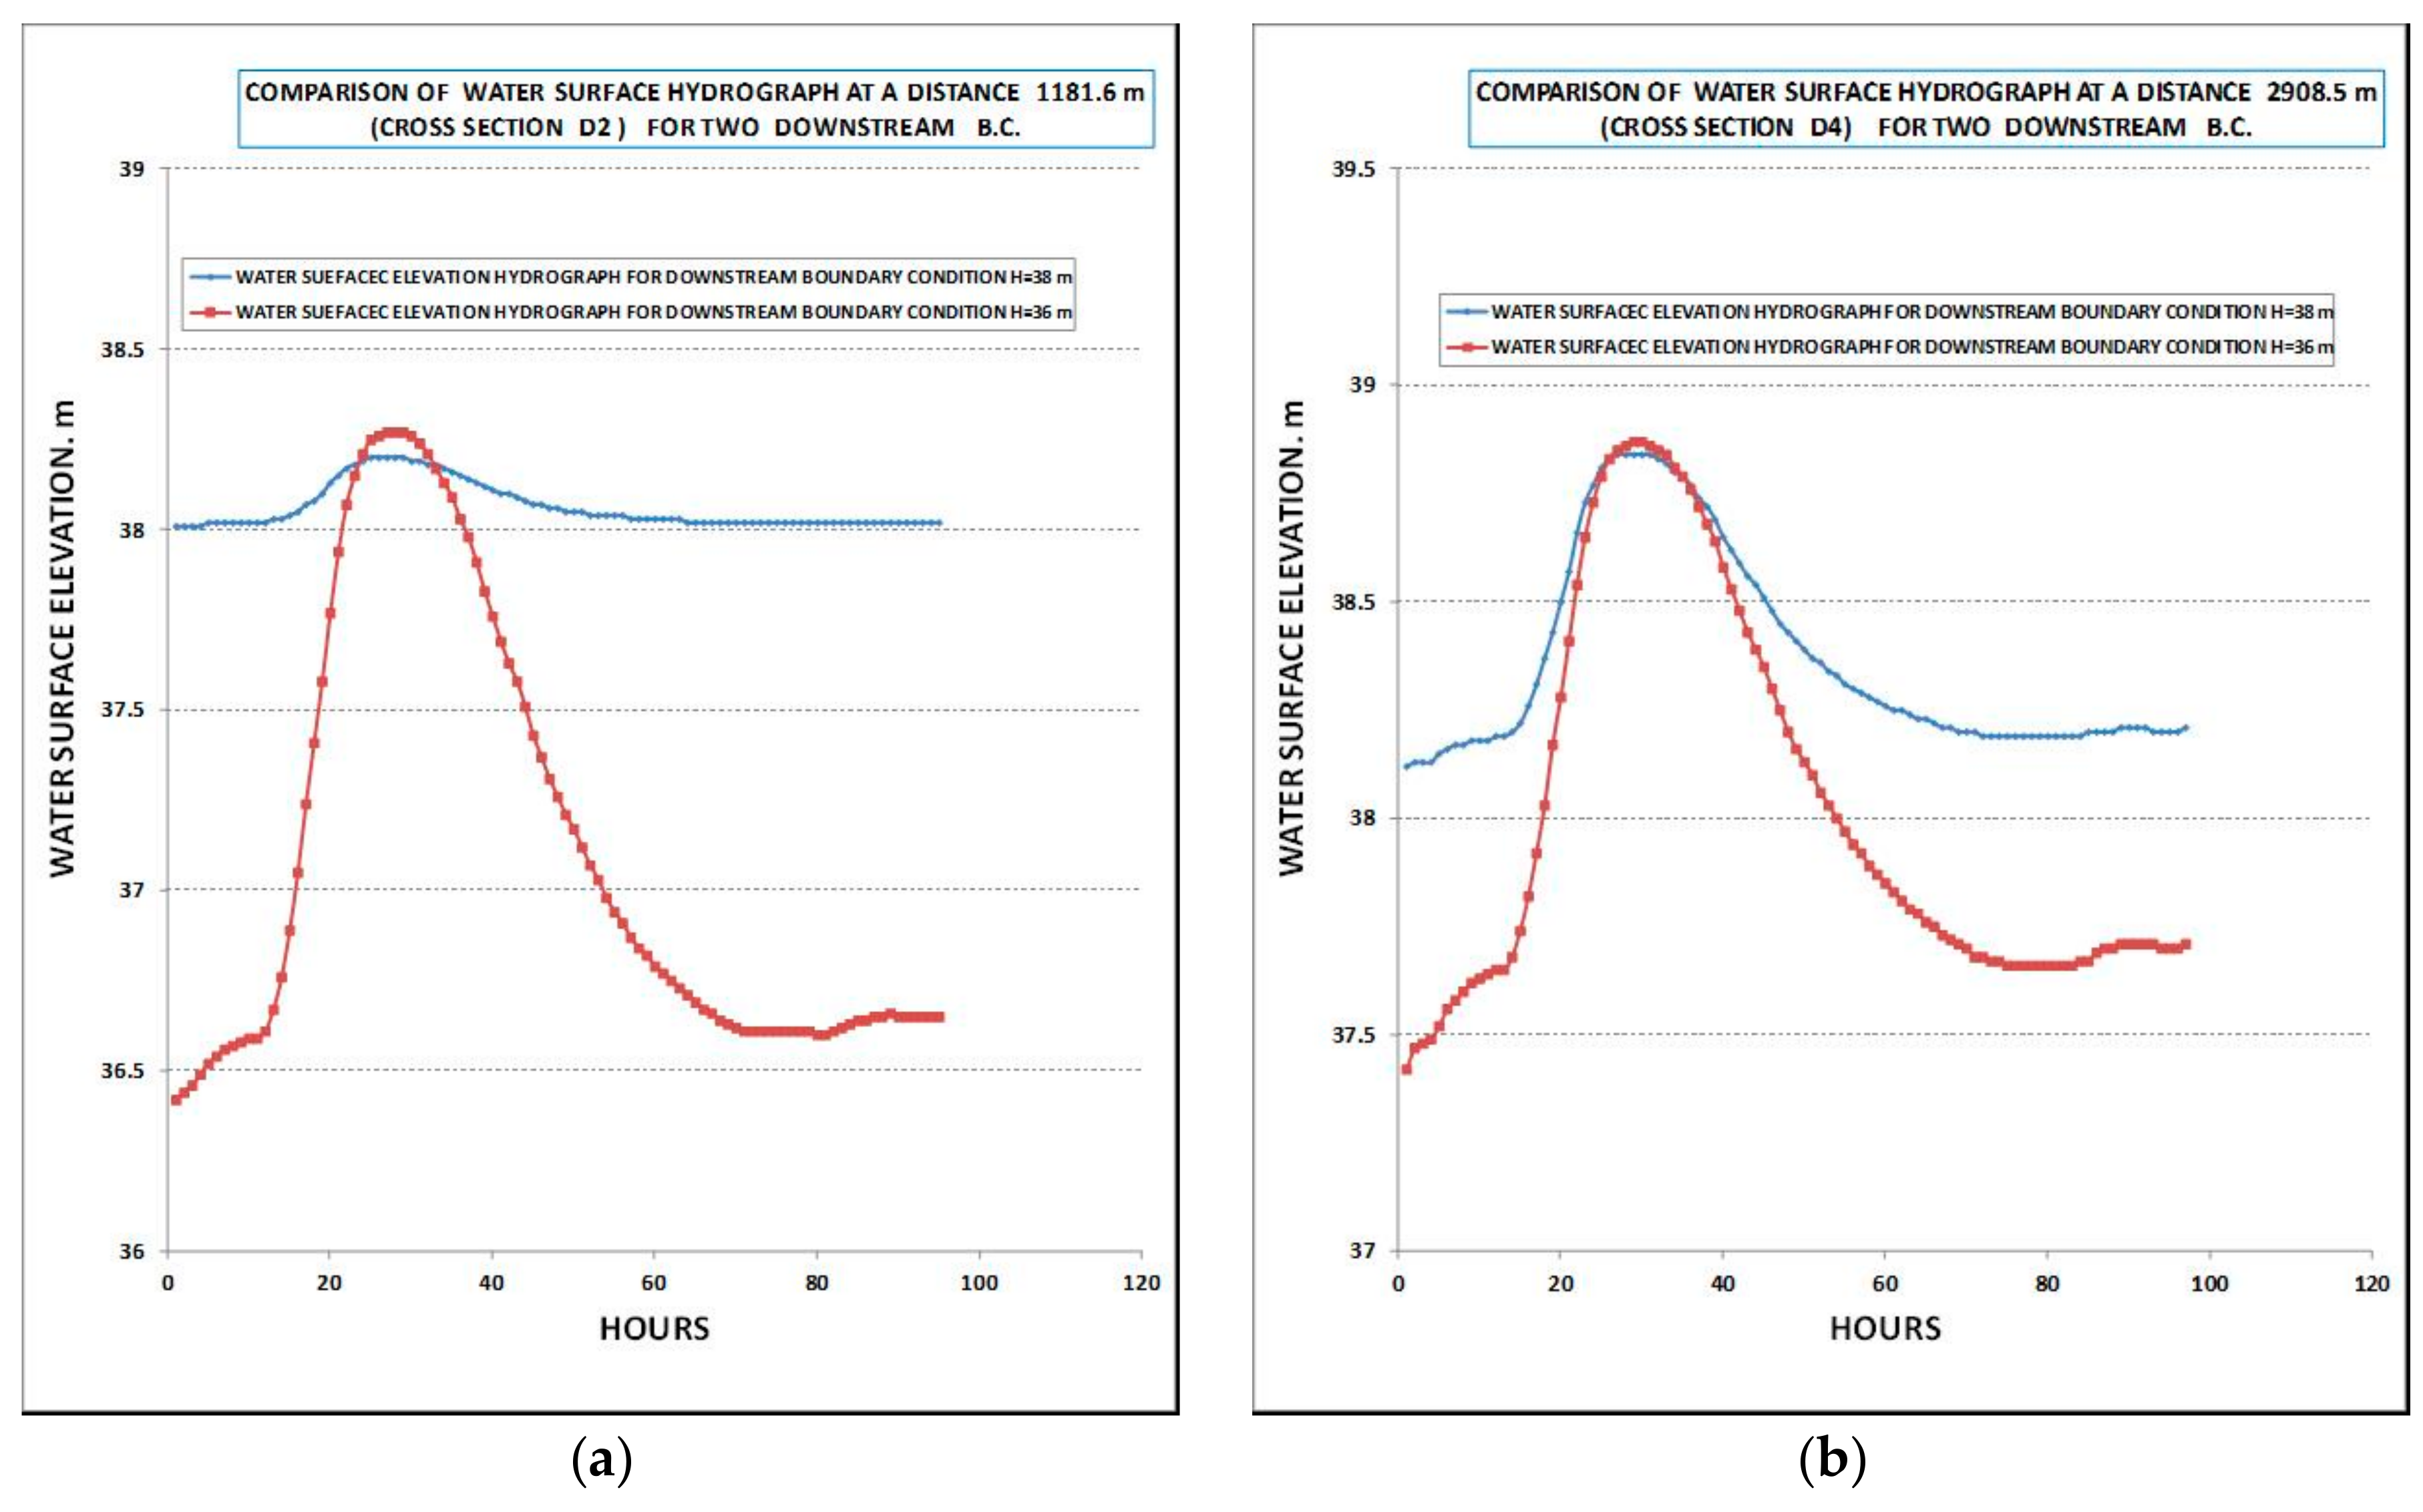
3.2. The Effect of the Downstream Boundary Condition—Upper Limit of Discharge Flowing into Evros River

The flow in the Arda river is subcritical, as found from the numerical simulations of the 12 input hydrographs having both small and big peak discharges. Therefore, the downstream boundary condition, that is the elevation of the water surface at the confluence of the Arda and Evros rivers, is of critical importance. This water surface elevation depends on both the flow rate of the Evros river and of the Tundja river, which discharges into the Evros river about 6 km after the Arda–Evros junction. There are no water level measurements at the Arda–Evros junction. The water level is recorded at two points of the Evros river at distances of about 5 km and 10 km downstream from the Arda–Evros junction.
From the data processing of the historical flood records, we have concluded that when the discharge of the Evros river varies from 1600 to 3000 m3/s, then the water elevation at the Arda–Evros junction changes from 36 to 38 m, respectively. In order to investigate the effect of the downstream boundary condition, flood routing simulations have been performed with an input hydrograph with a peak value of 1000 m3/s and for two different downstream water stages; i.e., H = 36 m and H = 38 m.
We have found that the effect of the downstream boundary condition on the water surface profile in the Arda river can be expanded approximately at a distance of 9 km from the Arda–Evros junction. A significant raise of the free water surface profile has been observed when the water elevation at the confluence increases. This raise decreases going upstream from the confluence of the rivers and tends to zero at a distance of 9 km. This ascension of the water surface profile is the reason for the magnification of the levee overflows in this area. In Figure 11a,b, the comparison of the water stage hydrographs are given at distances of 1181 and 2908 m from the confluence for the two mentioned above boundary conditions; i.e., for H = 36 m and H = 38 m. As we can see, the effect of the water level elevation at the Arda–Evros confluence is very important for floods occurring up to a distance of about 9 km upstream.
The maximum discharge between the levees in relation to the distance from the junction of the Arda and Evros rivers is given in Figure 12, as a result of a flood hydrograph routing with an initial peak value of 1961 m3/s. Similar simulations have been performed for various input hydrographs with peak values, which are given in Table 1. An interesting outcome from these simulations is the reduction of the peak discharges of the hydrographs at various sections of the river, because of the lateral overflows. Another significant finding is that, even for a large input flood hydrograph at the Bulgarian-Greece border, the peak discharge entering the Evros (Maritsa) river at its junction with the Arda river is only 1000 m3/s. This is an important discovery of the present paper and it is critical for the management of the flood flows of the Evros river, which is a major river with big tributaries.

4. Conclusions

To reduce the negative effects of a flood hazard, an early warning system must be installed. In this study, an extensive hydraulic analysis has been conducted, aiming to produce all necessary parameters to develop a flood warning system for the Arda river basin outside its mountain watershed. Using the one-dimensional software HEC-RAS, a simulation of flood hydrograph routing between levees for floods with return periods from 2 to 10,000 years has been performed. Flood inundation maps have been carefully prepared containing all essential information (travel times of flood waves, water levels, water depths, and maximum inundation areas) for 12 flood input hydrographs.
The overflowing locations of levees, because of local interventions, have been determined. The total volume of earthworks needed for their improvement has been calculated and their restoration has been proposed in order to considerably increase the discharge capacity of the river from 750 m3/s to 1961 m3/s, with a relatively small cost.
The great importance of the water level at the confluence of the Arda and Evros rivers (downstream boundary condition) has been highlighted. A significant raise of the free water surface profile is caused when the water elevation at the confluence increases, producing extra floods in adjacent regions because of the subcritical type of flow. The existence of an upper limit (even for large input flood hydrographs) of the discharge entering from the Arda to the Evros river has been discovered. This finding is very important to cope with the floods of the downstream part of the Evros river, which is a much larger river with big tributaries.

Author Contributions

P.A. contribute to hydraulic simulations and wrote the paper. F.M. and K.K. surveyed the river cross sections on field and collected hydraulic roughness parameters. A.V. edited geodetic data and contribute to hydraulic simulations. N.K. developed and configured the hydraulic HEC-RAS model, prepared graphs and supervised all the research.

Funding

The paper is based on the research funded by the European Territorial Cooperation Programme Greece-Bulgaria 2007–2013. The financing was made by 85% from the European Regional Development Fund (ERDF) and by 15% from national resources (Greece).

Conflicts of Interest

The authors declare no conflict of interest.

References

  1. Jongman, B.; Hochrainer-Stigler, S.; Feyen, L.; Aerts, J.C.J.H.; Mechler, R.; Botzen, W.J.W.; Bouwer, L.M.; Pflug, G.; Rojas, R.; Ward, P.J. Increasing stress on disaster-risk finance due to large floods. Nat. Clim. Chang. 2014, 4, 264–268. [Google Scholar] [CrossRef]
  2. Tschakert, P.; Sagoe, R.; Ofori-Darko, G.; Codjoe, S.N. Floods in the Sahel: An analysis of anomalies, memory, and anticipatory learning. Clim. Chang. 2010, 103, 471–502. [Google Scholar] [CrossRef]
  3. Guha-Sapir, D.; Vos, F.; Below, R.; Ponserre, S. Annual Disaster Statistical Review 2010: The Numbers and Trends; CRED: Brussels, Belgium, 2011. [Google Scholar]
  4. Fernandez Bou, A.S.; Ventura De Sa, R.; Cataldi, M. Flood forecasting in the upper Uruguay river basin. Nat. Hazards 2015, 79, 1239–1256. [Google Scholar] [CrossRef]
  5. Nieland, C.; Mushtaq, S. The effectiveness and need for flash flood warning systems in a regional inland city in Australia. Nat. Hazards 2016, 80, 153–171. [Google Scholar] [CrossRef]
  6. Krzysztofowicz, R.; Karen, S.K.; Long, D. Reliability of flood warning systems. J. Water Resour. Plan. Manag. 1994, 120, 906–926. [Google Scholar] [CrossRef]
  7. Merz, B.; Thieken, A.H.; Gocht, M. Flood Risk Mapping at the Local Scale: Concepts and Challenges; Flood Risk Management in Europe; Springer: Dordrecht, The Netherlands, 2007; pp. 231–251. [Google Scholar]
  8. Leedal, D.; Neal, J.C.; Beven, K.; Young, P.C. Visualization approaches for communicating real-time flood forecasting level and inundation information. J. Flood Risk Manag. 2010, 3, 140–150. [Google Scholar] [CrossRef]
  9. Holtzclaw, E.; Leite, B.; Myrick, R. Floodplain Modeling Applications for Emergency Management and Stakeholder Involvement a Case Study: New Braunfels, Texas; Georgia Institute of Technology: Atlanta, GA, USA, 2005. [Google Scholar]
  10. Angelidis, P.; Kotsikas, M.; Kopasakis, K.; Maris, F.; Kotsovinos, N. Flood routing simulation and management in hydrologic basins with artificial reservoirs—The case of Arda river. Comput. Water Energy Environ. Eng. 2018, 7, 51–68. [Google Scholar] [CrossRef]
  11. Lamichhane, N.; Sharma, S. Development of flood warning system and flood inundation mapping using field survey and LiDAR data for the Grand river near the city of Painesville, Ohio. Hydrology 2017, 4, 24. [Google Scholar] [CrossRef]
  12. Paparrizos, S.; Maris, F.; Matzarakis, A. Integrated analysis and mapping of present and future responses of precipitation over selected Greek areas with different climate conditions. Atmos. Res. 2016, 169, 199–208. [Google Scholar] [CrossRef]
  13. Paparrizos, S.; Maris, F.; Matzarakis, A. Sensitivity analysis and comparison of various potential evapotranspiration formulae for selected Greek areas with different climate conditions. Theor. Appl. Climatol. 2016, 128, 745–759. [Google Scholar] [CrossRef]
  14. Tuncok, I.K. Transboundary river basin flood forecasting and early warning system experience in Maritza river basin between Bulgaria and Turkey. Nat. Hazards 2014, 75, 191–214. [Google Scholar] [CrossRef]
  15. Akkaya, U.; Doğan, E. Generation of 2D flood inundation maps of Meriç and Tunca rivers passing through Edirne city center. Geofizika 2016, 33, 15–34. [Google Scholar] [CrossRef]
  16. Brunner, G.W. HEC-RAS River Analysis System: User’s Manual. US Army Corps of Engineers; Institute for Water Resources, Hydrologic Engineering Center: Davis, CA, USA, 2002. [Google Scholar]
  17. Angelidis, P.; Kotsikas, M.; Kotsovinos, N. Management of upstream dams and flood protection of the transboundary river Evros/Maritza. Water Resour. Manag. 2010, 24, 2467–2484. [Google Scholar] [CrossRef]
  18. Carter, R.W.; Einstein, H.A.; Hinds, J.; Powell, R.W.; Silberman, E. Friction factors in open channels, progress report of the task force on friction factors in open channels of the Committee on Hydro-mechanics of the Hydraulics Division: Proceedings, American Society of Civil Engineers. J. Hydraul. Div. 1963, 89, 97–143. [Google Scholar]
  19. Limerinos, J.T. Determination of the Manning Coefficient from Measured Bed Roughness in Natural Channels; Water-Supply Paper 1898-B; U.S. Geological Survey: Washington, DC, USA, 1970; 47p.
  20. Chow, V.T. Open-Channel Hydraulics; McGraw-Hill: New York, NY, USA, 1959. [Google Scholar]
Figure 1. The Arda river catchment area that is sheared between Bulgaria and Greece. The downstream Greek part of the basin is most vulnerable to flooding.
Hydrology 05 00031 g001
Figure 2. Horizontal alignment of the Greek part of the Arda river (source: Google Earth). The border lines at east and west are indicated with yellow lines, while the river levees are shown with red lines. The positions of the monitoring station (after the dam of Ivaylovgrad) and of the calibration point (near the village Komara) are also indicated.
Hydrology 05 00031 g002
Figure 3. (a) Inflow hydrograph (hourly discharges) as an upstream boundary condition at the simulated Greek part of the Arda river on February 2010; (b) Free water surface elevation at the control section of Komara, from measurements and from numerical simulation (February 2010) considering three different approximations of the Manning coefficients.
Hydrology 05 00031 g003
Figure 4. Free water surface elevation between levees as a function of time at various characteristic cross-sections along the river.
Hydrology 05 00031 g004
Figure 5. Discharge hydrographs between levees as a function of time at various cross-sections along the river.
Hydrology 05 00031 g005
Figure 6. Bed of the river, free water surface, and left and right levees’ elevations in relation to the distance from the junction of the Arda and Evros rivers. The elevations of the left and right levees are almost the same from chainage 16 km to chainage 33 km.
Hydrology 05 00031 g006
Figure 7. Free board (distance of levees to water elevation) in relation to the distance from the junction of Arda and Evros rivers. The elevations of the left and right levees are the almost same from chainage 16 km to chainage 33 km.
Hydrology 05 00031 g007
Figure 8. (a) Side overflows from the left (north) levee at three places; (b) Total side overflow from the right (south) levee of the Arda river.
Hydrology 05 00031 g008
Figure 9. (a) Accumulated lateral overflow volume (to storage areas or out of the main Arda) from right (south) Arda levee; (b) Width of lateral overflows from the right (south) Arda levee. Distances are measured from the Arda–Evros confluence.
Hydrology 05 00031 g009
Figure 10. Flood inundation map for the study area for a maximum input discharge of 1961 m3/s.
Hydrology 05 00031 g010
Figure 11. Water stage hydrographs for a maximum input discharge of 1000 m3/s, for two different downstream boundary conditions with water elevation of H = 36 m and H = 38 m: (a) At a section of a distance 1181 m; (b) At a section of a distance 2908 m. Distances are measured from the Arda–Evros confluence.
Hydrology 05 00031 g011
Figure 12. Maximum discharge between the levees in relation to the distance from the junction of Arda and Evros rivers. There is an upper limit of about 1000 m3/s for the peak discharge of Arda river entering into the Evros river.
Hydrology 05 00031 g012
Table 1. Arda river maximum daily discharges as a function of return periods at the Greek-Bulgarian border.
Return Period T (years)25102030501002005001000500010,000
Maximum Daily Discharge of Year Q (m3/s)5929581201143415681735196121862483270732283452

