Article

Quantifying Thermal Characteristics of Stormwater through Low Impact Development Systems

1
Program of Landscape Architecture, Auburn University, Auburn, AL 36849, USA
2
Department of Biosystems Engineering, Auburn University, Auburn, AL 36849, USA
3
McWhorter School of Building Science, Auburn University, Auburn, AL 36849, USA
4
College of Agriculture, Auburn University, Auburn, AL 36849, USA
*
Author to whom correspondence should be addressed.
Hydrology 2019, 6(1), 16; https://doi.org/10.3390/hydrology6010016
Submission received: 28 December 2018 / Revised: 28 January 2019 / Accepted: 30 January 2019 / Published: 5 February 2019

Abstract

:
Urbanization causes alteration of the thermal regime (surface, air, and water) of the environment. Heated stormwater runoff flows into lakes, streams, bays, and estuaries, which potentially increases the base temperature of the surface water. The amount of heat transferred, and the degree of thermal pollution is of great importance to the ecological integrity of receiving waters. This research reports on a controlled laboratory scale test to assess low impact development (LID) stormwater control measure impacts on the thermal characteristics of stormwater runoff. We hypothesize that LID stormwater control measures (SCMs) such as pervious surfaces and rain gardens/bioretention can be used to mitigate the ground level thermal loads from stormwater runoff. Laboratory methods in this study captured and infiltrated simulated stormwater runoff from four infrared heated substrate microcosms (pervious concrete, impervious concrete, permeable concrete pavers, and turf grass), and routed the stormwater through rain garden microcosms. A data logging system with thermistors located on, within, and at exits of the microcosms, recorded resulting stormwater temperature flux. Researchers compared steady state temperatures of the laboratory to previously collected field data and achieved between 30% to 60% higher steady state surface temperatures with indoor than outdoor test sites. This research helps establish baseline data to study heat removal effectiveness of pervious materials when used alone or in combination as a treatment train with other stormwater control measures such as rain gardens/bioretention.

1. Introduction

Urbanization is the conversion of rural land to a higher population and building density uses that typically have less vegetated and impervious surface than rural land. Numerous early authors including Wheater et al., Laenen, Booth and Reinelt, Schueler and Arnold, and Gibbons [1,2,3,4,5] quantified the hydrologic effects of urbanization. As early as 1968, Brater and Sangal [6] reported the adverse effects of urbanized peak runoff flows on flooding, property damage, and loss of life. Numerous other researchers including Omernik [7], Jordan et al. [8], Haith and Shoemaker [9], Osborne and Wiley [10], Kronvang [11], and Correll et al. [12] documented the impact of storm events and land use practices on stream contaminant loads such as sediments and nutrients. Other authors in the 1990s recognized and proposed impervious surface coverage as an indicator of urban stream health [13]. According to Schueler [4,14], changes in urban stream water quality occur at the 10% mean imperviousness level, which became a threshold of compromise for stream water quality in urbanized areas. Despite expanding awareness of aquatic ecology and related biological and engineering disciplines throughout the 1990s, measurements of stream temperature and thermal loads were not studied in earnest in most urban stream studies until the 21st century.
In recent decades, individual states were mandated by the United States Environmental Protection Agency (US EPA) to identify and apply specific water quality criteria to public waters of their state in order to identify impaired segments. Typical stream and water body impairments that limit use of a body of water for an intended use include bacteriological contamination (a pathogen impairment leading to human health risk), sediment loading (a benthic impairment leading to loss of aquatic habitat), excess nitrogen or phosphorus loads (a nutrient impairment leading to eutrophication), and numerous other contaminants and associated risks. A listed impaired stream or water body is required by the US EPA following part 303(d) of the Clean Water Act to quantify pollutant loads contributing to the impairment. Section 303(d) of the Clean Water Act authorizes EPA to assist states, territories, and authorized tribes in listing impaired waters and developing Total Maximum Daily Loads (TMDLs) for these waterbodies. A TMDL establishes the maximum amount of a pollutant allowed in a waterbody and serves as the starting point or planning tool for restoring water quality. The resulting total maximum daily load (TMDL) is the quantifiable capacity used to develop a stakeholder-approved public watershed management plan. The goal is mitigation of the water body impairment and removal from the 303(d) list [15].
Urbanization increases the temperature of surface runoff during storm events, and increases the temperature of receiving waters downstream [16,17,18]. Urbanization changes the hydrological cycle due to stormwater runoff heated by hard surfaces in the summer affecting aquatic life in receiving waters [1,2,3,4,5]. Streams exhibiting temperature pollution are identified as thermally impaired and also designated as 303(d) impaired waters. Wisconsin, Louisiana, and Georgia are among states that early on incorporated temperature TMDLs [19]. The Clean Water Act’s 303(d) TMDL program includes over 39,000 designated streams across the US, which makes this program the primary means to address impaired and threatened waters of the US [20], including those identified as thermally impaired.
Water temperature delineates many characteristics of a stream’s ecological health [21]. The thermal regime of a stream includes the magnitude, frequency, duration, timing, and the rate of change in water temperature at different spatial and temporal scales [22,23]. Temperature regimes affect the life cycle of many aquatic species including processes such as reproduction, feeding, and other basic life processes [24]. For example, in 2012, Ingleton and McMinn [25] reported the sensitivity of benthic diatoms to thermal plumes at stormwater outfalls had an ecological response at depths deeper than previously identified. The temperature was identified as one of the key pollutants of the plume. In addition, Kieser et al. [19] reported a decrease in ecological integrity due to equivalent temperature values 40 °F higher than the average air temperature recorded in the study from a 79-acre site in Portage, Michigan during July. Mean July temperatures are a commonly chosen metric to describe the health of the stream during periods of low streamflow and high water use [26].
Little has been published on the mitigation of thermal pollution using Low Impact Development (LID) stormwater control measures. The LID approach to thermal mitigation creates a hydrologically functional landscape since that is an alternative to traditional stormwater design. Common LID practices include green roofs, rain gardens, grassed swales, and pervious pavements [27]. Low impact development is the driving force behind the use of bio-retention in many parts of the country [28]. Xie and James [29] confirmed that thermal enrichment is a critical stressor of aquatic habitats and ecology downstream of urban areas, and that cooling runoff temperatures is a promising approach for urban streams. The University of New Hampshire Stormwater Center [22] reported that stormwater control measures that incorporate filtration appear to be extremely beneficial for mitigation of temperature. Furthermore, the deeper the stormwater control system, the better the capability to buffer temperatures. Such systems can buffer temperature extremes and yield an effluent temperature near the average groundwater temperature.
Previous research studies have documented the impact of intense storm events and urban land use practices on nonpoint source pollutant fluxes [7,8,9,10,11,12,30]. As a consequence, pervious pavements have been increasingly promoted as an urban stormwater management practice [31] and have been recognized by US EPA as a Best Management Practice for treating storm water runoff [32]. Thermal impacts of impervious pavements on the urban environment are acknowledged but have been less intensely studied than related hydrologic effects. An urban heat island effect was described but not named as such in Luke Howard’s nineteenth century climatological observations of London [33]. Nearly two centuries later, Abu Eusuf and Asaeda [34] confirmed that surface temperatures of porous and nonporous pavements were 17 °C higher than the air temperature. They used numerical modeling to reveal that pore size is essential for the transport of water vapor in the pavement. Stempihar et al. [35] used diurnal temperature observations in Arizona to complete one-dimensional pavement temperature modeling that included pervious and impervious surfaces. They found that, in general, porous asphalt exhibited higher daytime surface temperatures than comparable impervious asphalt because of reduced thermal energy transfer from the surface to the subsurface. Porous asphalt also showed lower nighttime temperatures in the summer months compared to impervious asphalt related to its high air void content and unique insulating properties [35]. In 2010, Barbis and Welker [36] reported the effect of 12 storms on the temperature of water in infiltration beds beneath porous pavements as a form of temperature mitigation through the conduction of warm stormwater. They found that the subsurface infiltration bed served as a sink transferring heat energy from the surface. A 2009 study by Kevern, Haselbach, and Schafer [37] focused on temperature readings from embedded sensors at the mid-level for both pervious and impervious pavements using traditional concrete. Results of the study found that the temperature at mid-level of pervious concrete averaged 5 °C (9 °F) higher than impervious concrete during the hottest time of day.
The US EPA [32] has defined the “heat island” as built up (urban) areas that are hotter than nearby rural areas, both on the surface, and in the atmosphere. US EPA recommends several strategies to mitigate the heat island effect, including tree and vegetative cover, green roofs, reflective roofs, and cool pavements. Cool pavements according to US EPA [32] are designed to reflect more solar energy, enhance water evaporation, or are otherwise modified to remain cooler than conventional pavements. Currently, there is no standard or labeling program to identify or rate cool paving materials. The Transportation Research Board formed a subcommittee on Paving Materials and the Urban Climate to address design, testing, standards development, and policy considerations related to the urban heat island [38]. In 2013, the Transportation Research Board cited numerous health, environmental, and economic justifications to curb the urban heat island (UHI) effect in major cities. Their report documents that urban centers are typically made up of a 30% to 45% paved surface [39].
Hein et al. [40] completed a study at Auburn University (AU), in Auburn, AL, USA, including students of Biosystems Engineering, Architecture, Building Science, collaborating with AU Facilities and Donald E. Davis Arboretum personnel to design and construct a pervious concrete slab system to replace worn pavement in the on-campus Arboretum parking lot. New pavement consisted of eight new parking spaces including one handicapped space. Results from the eight-month collection period after initial installation of pavement indicated a consistent reduction in leachate contaminants from stormwater through the newly cast pervious concrete system compared to runoff from the adjacent impervious pavement section. A reduction of measured contaminants ranged from 20% to 85%. No difference in temperature was observed between the pervious and impervious pavements. However, continuous monitoring of the temperature was not conducted. Due to the significance and concern with localized heat island effects, continuous temperature monitoring was recommended for a future study.
Rahn et al. [41] conducted a study at a dedicated on-campus outdoor pavement lab at AU consisting of eight 1.2 m × 2.4 m (4 ft × 8 ft) pervious and impervious pavement slab systems that included grass and gravel surfaces for comparison. Measurable results of slabs exposed to summer sun indicated a range of pavement surface temperatures based on the color and porosity. Runoff from simulated rainfall applied to all pavements resulted in a thermal spike in stormwater temperature within the first five minutes after water application. Researchers concluded that impervious pavements are likely to increase thermal pollution of water bodies and to contribute to the Urban Heat Island while pervious pavements, though storing more heat, are less likely to contribute thermal pollution to receiving bodies of water [41].
There are few paired studies showing laboratory and field test correlation of pervious and impervious concrete data. Gogula et al. [42] compared the permeability of several pavement mixes in the lab and the field. The results showed that there was a significant difference between laboratory-measured and field-measured permeability values. The field permeability values were consistently higher than the laboratory permeability values, which makes predictability of permeability impossible.
Rain garden studies of various types have become more widespread in recent years. Rain gardens are attractive additions to landscapes that facilitate stormwater management and infiltration. A rain garden is a shallow depression that collects stormwater runoff from a roof, parking lot, or another impervious surface [43,44]. Rain gardens are bioretention areas in the landscape designed to catch stormwater runoff and facilitate infiltration and treatment [45,46]. Rain gardens and bioretention areas have become an accepted landscape practice in commercial and residential developments used to remediate stormwater runoff [46]. Native plants adapted to low wetland areas are desirable for rain gardens because they are low maintenance, not invasive, and relatively pest-free [47,48]. Native plants are adapted to local environmental conditions [44,49], and are usually able to persist during fluctuations in rainfall, temperature, or drought. This makes them desirable for rain gardens. Dunnett and Claydon, Toran, and Dylewski et al. [44,48,50,51] reported that container grown taxa (Ilex glabra ‘Shamrock’, Itea virginica ‘Henry’s Garnet’, Itea virginica, and Viburnum nudum ‘Winterthur’) had sustained growth throughout a simulated flooded rain garden experiment and maintained good visual quality.
In the present laboratory study, simulated stormwater runoff was used to evaluate four substrate microcosms (impervious concrete, pervious concrete, permeable concrete pavers, and turf grass). Runoff from simulated rainfall onto thermally loaded substrates was directed into rain garden microcosms. The objectives of this study were to: (1) evaluate the temperature response of the four substrates during simulated thermal loading, (2) quantify the temperature impact of the four substrates to simulated rainfall applied to the substrate, (3) compare temperature changes between substrates, and (4) establish a baseline measurement of the temperature for each substrate compared to selected field-based temperature measurements.

2. Materials and Methods

2.1. Laboratory Research Methods

Laboratory research was conducted in the Green Infrastructure Laboratory at the Mike Hubbard Center for Advanced Science, Innovation and Commerce (CASIC) Building at Auburn University (AU), Auburn, Alabama. The laboratory provides limited environmental control and is designed for both wet and dry research. All faculty researchers are members of the AU Green Infrastructure Lab Team. Four surface (substrate) microcosms (impervious concrete, pervious concrete, permeable concrete pavers, and turf grass) were constructed within a laboratory environment to allow for controlled thermal exposure followed by simulated rainfall events.

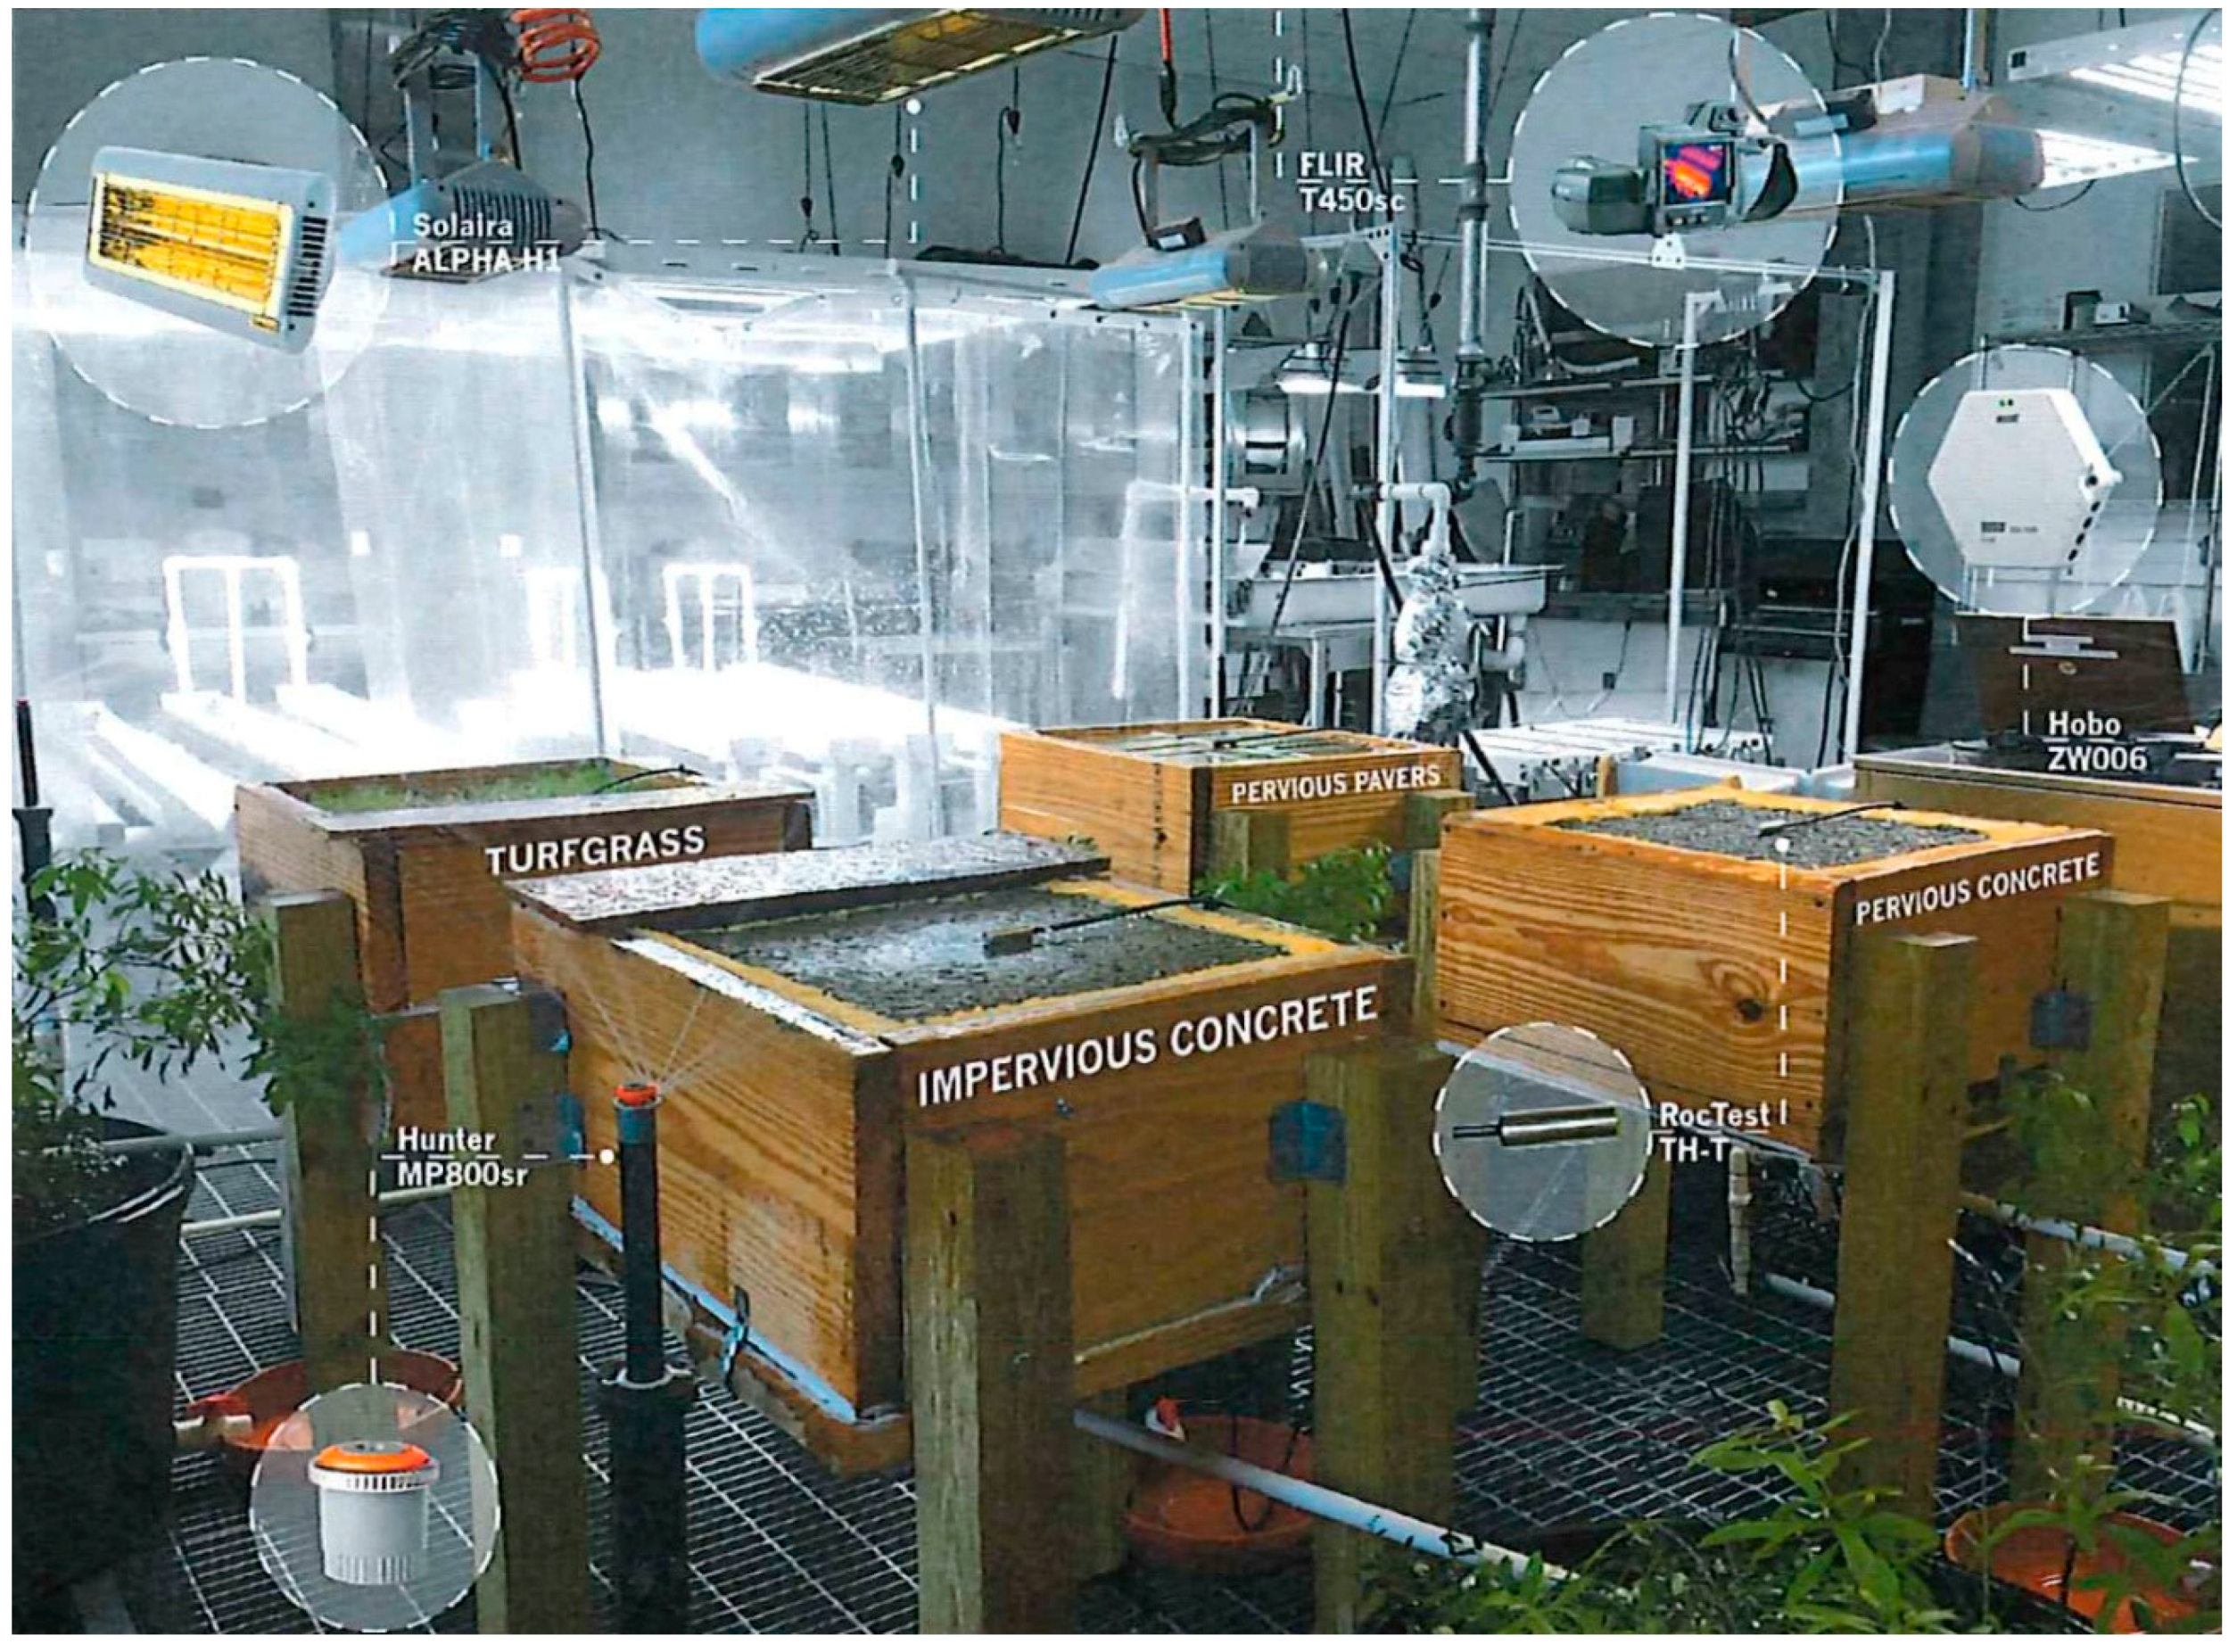
2.1.1. Surface (Substrate) Microcosm Layout

The layout of the Green Infrastructure Lab consists of four surface microcosms positioned in a grid pattern to allow for uniform coverage of the simulated rainfall system and ensure that all samples are included within the image frame of a single thermal camera positioned above (Figure 1). Five RocTest® TH-T temperature thermistors are placed within selected depths of each surface sample to measure a continuous temperature change of the substrate. All of the thermistors connect to a RocTest® RT-MUX 16/32 Signal Multiplexer (RocTest Ltd., Saint-Lambert, QC, Canada). Real-time data graphs are tracked and viewed through a CR3000 Micrologger (RocTest Ltd., Saint-Lambert, QC, Canada) with LoggerNet datalogger support software from Campbell Scientific® (Campbell Scientific, Inc, Logan, UT, USA). Thermal loads placed on the test substrate are supplied by four 120V:1500W Solaira™ Alpha H1 Weatherproof Infrared Heat Lamps, one positioned 76 cm (30 in) above the surface of each substrate sample. One FLIR® T450sc ThermaCAM digital camera (FLIR Systems, Wilsonville, OR, USA) is positioned in the center of the test area approximately 140 cm (55 in) above the test sample surface. The camera is high enough above the heat lamps to avoid interference, while the FLIR® T197312 Wide-Angle lens allows for the four samples to be included within the same image frame.

2.1.2. Hydrologic Component Location

Uniform coverage for simulated rainfall events was achieved through an elevated irrigation system made up of four Rainbird® model 1806 spray bodies on risers, each fitted with Hunter MP Rotator® MP800 Series nozzles, made and manufactured in the USA, operating at approximately 207 kPa (30 psi). Each irrigation head was located at a testing corner at a height of 78.7 cm (31 in), 94 cm (37 in) when operating, to produce a uniformly overlapping pattern of precipitation onto each of the four test surfaces. Two HOBO® ZW-006-4 analog data nodes connected to 600CB Trerice® pressure gauges were used to monitor the flow rate, temperature, and pressure of the water moving through the rainfall simulation system before and after contact with test material surfaces. The HOBO® temperature data were recorded and viewed real-time through HOBOware® Pro Software. Four accompanying rain garden microcosms, containing common rain garden plants (described below), were positioned adjacent and below each of the four surface substrate microcosms to capture stormwater effluent as it exited the test samples.
Rainfall simulation distribution uniformity (DU) and the precipitation rate (PR) were evaluated and reported by Davis [53]. Rainfall simulation DU and PR was measured using four 15.2 cm × 15.2 cm (6 in × 6 in) plastic containers per test sample to capture rainfall from the test system (Figure 2). The water pressure applied to each sprinkler head was recorded and established as a baseline calibration to assure consistent, future testing. The resulting precipitation rate of 2.0 cm/h (0.79 in/h) approximates rainfall from a 2-yr, 2-h storm in most parts of Alabama.

2.1.3. Surface (Substrate) Microcosm Design

Substrate microcosms (stands built of lumber) were designed and built by the green infrastructure (GI) Lab team. Each microcosm was constructed using 5 cm × 30.5 cm (nominal 2 in × 12 in) pressure-treated boards for the base and walls with 10.2 cm × 10.2 cm (nominal 4 in × 4 in) posts for the legs, and a plastic collection dome underneath to catch leachate and surface runoff. The turf, permeable concrete paver (hereafter called pavers), and pervious concrete stands had drain holes drilled into the baseboards to allow stormwater leachate from permeable samples to pass into the collection pan. The impervious concrete microcosm had a side channel attached to the stand, which allows sheet runoff to flow into the collection pan. Substrate samples were constructed and maintained for multiple test cycles at a nominal surface grade of 1% (0.32 cm/30.5 m, 1/8 in/ft). The subgrade material for three of the four surface substrates including turf, impervious concrete, and pervious concrete was made up of 28 cm (11 in) of AASHTO #57 stone providing approximately 40% porosity and unlimited drainage. The paver subgrade consisted of 10.2 cm (4 in) of AASHTO #89 stone on top of 18 cm (7 in) of AASHTO #57 stone. Thermistors were located within and on top of each media sample (Figure 3).
Rain garden microcosms consisted of 114 liter (30 gal) nursery pots. The rain garden microcosm was planted with one each of the following plant species: Ilex vomitoria ‘Stokes Dwarf’, Morella cerifera, and Ilex glabra ‘Shamrock’. The simulated stormwater runoff and leachate from each substrate (surface) microcosm was funneled into the rain garden microcosms using a 2.5 cm (1 in) PVC pipe (Figure 4).

2.1.4. Data Tracking--RocTest Thermal Tracking & HOBO® Data Nodes

The RocTest thermal data was collected through RocTest TH-T 3k ohm thermistors with an accuracy of +/− 0.5% from −50 to +150 °C, manufactured in Quebec, Canada, within each test sample unit. The four substrate samples included one temperature node on the surface, one node embedded within the sample layer, and one node within the stormwater collection basin below to track a continuous temperature change as simulated stormwater (or leachate) moved through the system. In addition, each of the surface samples contained a temperature node located in an effluent capture pan to capture stormwater runoff exiting the simulated rain garden microcosm. Turf data was captured through thermistors labeled 1–5, paver data through thermistors 6–10, impervious concrete data through thermistors 11–15, and pervious concrete data through thermistors 16–20 (Figure 3). Thermal data from the temperature thermistors were recorded continuously throughout the testing period and graphically displayed within the LoggerNet datalogger software. The RocTest data was collected and exported as a spreadsheet containing all temperature readings at one-second intervals for each node throughout each test duration. The two HOBO® ZW-006-4 analog data nodes connected to 600CB Trerice pressure gauges monitored flow rate, temperature, and pressure before, during, and after water discharge through sprinkler heads.

2.1.5. Indoor Laboratory Testing Procedure

Thermal load testing consisted of two five-week testing periods with two four-hour test runs performed each week for a total of 20 tests. A three-day resting period between the two testing and data collection runs allowed stormwater runoff or leachate to drain and pass completely into each rain garden microcosm. Each four-hour testing run was comprised of simulated ‘insolation’ (incoming solar radiation) exposure for the first three hours, which was followed by a half hour (30 min) simulated rainfall event and concluded with a half-hour (30 min) cool down period. The four-hour testing duration was selected to approximate a typical four-hour Alabama summer storm sequence, i.e., concentrated solar radiation (3 h) followed by a brief rain shower (30 min) with short-term continued cloud cover. This testing methodology was implemented with equipment designed and installed in the Green Infrastructure Lab. Testing began on January 30 and continued approximately twice weekly for 20 test dates through 26 May, 2018.
The following standardized procedure was used through the quantitative and qualitative phases of testing. The procedure for thermal load testing was shown below.
  • Stormwater catchment basins were emptied of previous test effluent.
  • RocTest sensor leads were connected to the laptop and a new data log was started in the LoggerNet Datalogger Program.
  • HOBO® ZW-006-4 analog data nodes were connected to the laptop, synched to one another, and a new data log was started in the HOBOware® Pro Program.
  • The FLIR® T450sc thermal camera was set up and calibrated.
  • Time-lapse recording was started at the same time the Solaira™ Alpha H1 heat lamps were plugged in.
  • Heat lamps were unplugged after 3 h, at which time the simulated rain event started.
  • The simulated rain event was stopped after 30 min.
  • A 30-min cool down period was recorded.
  • Test data from RocTest, HOBOware® Pro, and FLIR® camera equipment was stored for future analysis.
  • Test completed with breakdown and storage of all secured GI Lab equipment until the next test.

2.2. Outdoor Field Research Methods

In 2012, faculty members and students of Auburn University Building Science, Architecture, and Biosystems Engineering collaborated with facilities’ workers at Auburn University on the design and construction of a field lab for comparative outdoor testing of selected pavement systems. The first experiment, which shaped the initial lab design, compared the outdoor surface temperatures of six different pavement surfaces (× 2 replications) with corresponding stormwater effluent from each under natural heating in summer conditions. Heating by natural insolation was followed by 60 min of simulated sprinkler rainfall using an underground sprinkler system similar in design to that described previously in the GI Laboratory and depicted below (Figure 5). Results of that study (previously unpublished) demonstrated the utility of replicated test plots for the evaluation of thermal pollution from urban surfaces. In 2013, six additional pavement cells were installed to include duplicated dark-colored and light-colored pavers sections as well as one gravel and one Bermuda grass test section. Extensive rainfall simulation testing was conducted during the summer of 2013, including data collection using thermal probes with accompanying thermal images to record surface and water temperatures.
The completed field lab layout was made up of 18 1.2 m × 2.4 m (4 ft × 8 ft) test sections consisting of the following pavement surfaces: conventional and pervious concrete, conventional and pervious asphalt, conventional and pervious photocatalytic concrete (a white-colored, self-cleaning concrete), dark and light pavers, and control surfaces of gravel and asphalt. This field lab study was the first outdoor laboratory on campus designed to monitor pavement surface temperatures under full sun and simulated rainfall conditions. The field lab, therefore, preceded development and testing conducted at the indoor laboratory, which was limited to four microcosm surface treatments as described in previous sections. Each surface test section in the field lab was cast within a 1.2 m × 2.4 m (4 ft × 8 ft) wood frame of treated dimensional lumber insulated on the inside with an exterior grade silicone. The 15.2 cm (6 in) surfaces of varying materials were cast at a nominal 2% slope over a 15.2 cm (6 in) thick subbase of drainable #57 graded limestone. The gravel beds were designed to provide a uniform subbase, unlimited drainage, and a stormwater reservoir typical of urban porous pavement systems. Field lab sections were equipped with uniform rainfall simulation using an installed underground irrigation system including spray bodies and MP Rotator sprinkler nozzles similar to the laboratory study. CU and PR values were not inconsistent with those achieved in the GI lab using the same standard procedures.

2.2.1. Thermal Image Recording and Capture

Thermal imaging was utilized at the field site to record and evaluate test plot surface temperatures during hot, summer days before and after simulated rainfall events. Preliminary field tests were run in 2012 using the initial 12 test plots. The following year, a definitive set of field tests was run using all 18 test plots on 15 separate days from 28 May, 2013 through 2 August, 2013. During these tests, a thermal imaging camera was used to complement discrete surface temperature sensor data. Thermal imaging was used to provide average surface temperatures at two specific temporal milestones (maximum and minimum surface temperature before and after simulated rainfall, respectively).

2.2.2. Temperature Logging and Analysis

Individual battery-powered thermal probes each with their own data logger were used for continuous, discrete surface temperature measurements. Resulting continuous temperature data was used for graphical analysis to compare temporal changes in the temperature between surfaces. Incoming potable water temperature was also monitored and recorded continuously throughout the outdoor field test using separate thermocouples. Weather data was captured for each of the test dates using a digital weather station installed at the field lab. Temperature, humidity, and wind conditions were recorded between 15 min prior and 15 min after each test. Average ambient temperatures during testing ranged from 28.3 °C to 33.3 °C (83 °F to 92 °F) with an average of 31.4 °C (88.6 °F). Relative humidity ranged from 40% to 64% with an average of 55%. Wind speeds during afternoon testing ranged between 0 and 1.78 m/s (0 to 4 mph) with an average of 0.54 m/s (1.2 mph). Runoff, leachate, and surface temperature readings from duplicated pavement sections were recorded with the exception of single grass and gravel plots, which were equipped with one surface and one collection gutter thermocouple. Each test produced 36 sets of continuous temperature data, including 18 pavement surface temperature values and 18 gutter temperature values. Gutters served as collection devices for impervious surface runoff and permeable surface leachate. Two thermal images per test plot were analyzed and recorded as pre-rainfall and post-rainfall average plot temperatures. Replicated data from the 2013 field study were averaged by treatment, pavement, and color with preliminary results published in 2015 [41].

3. Results

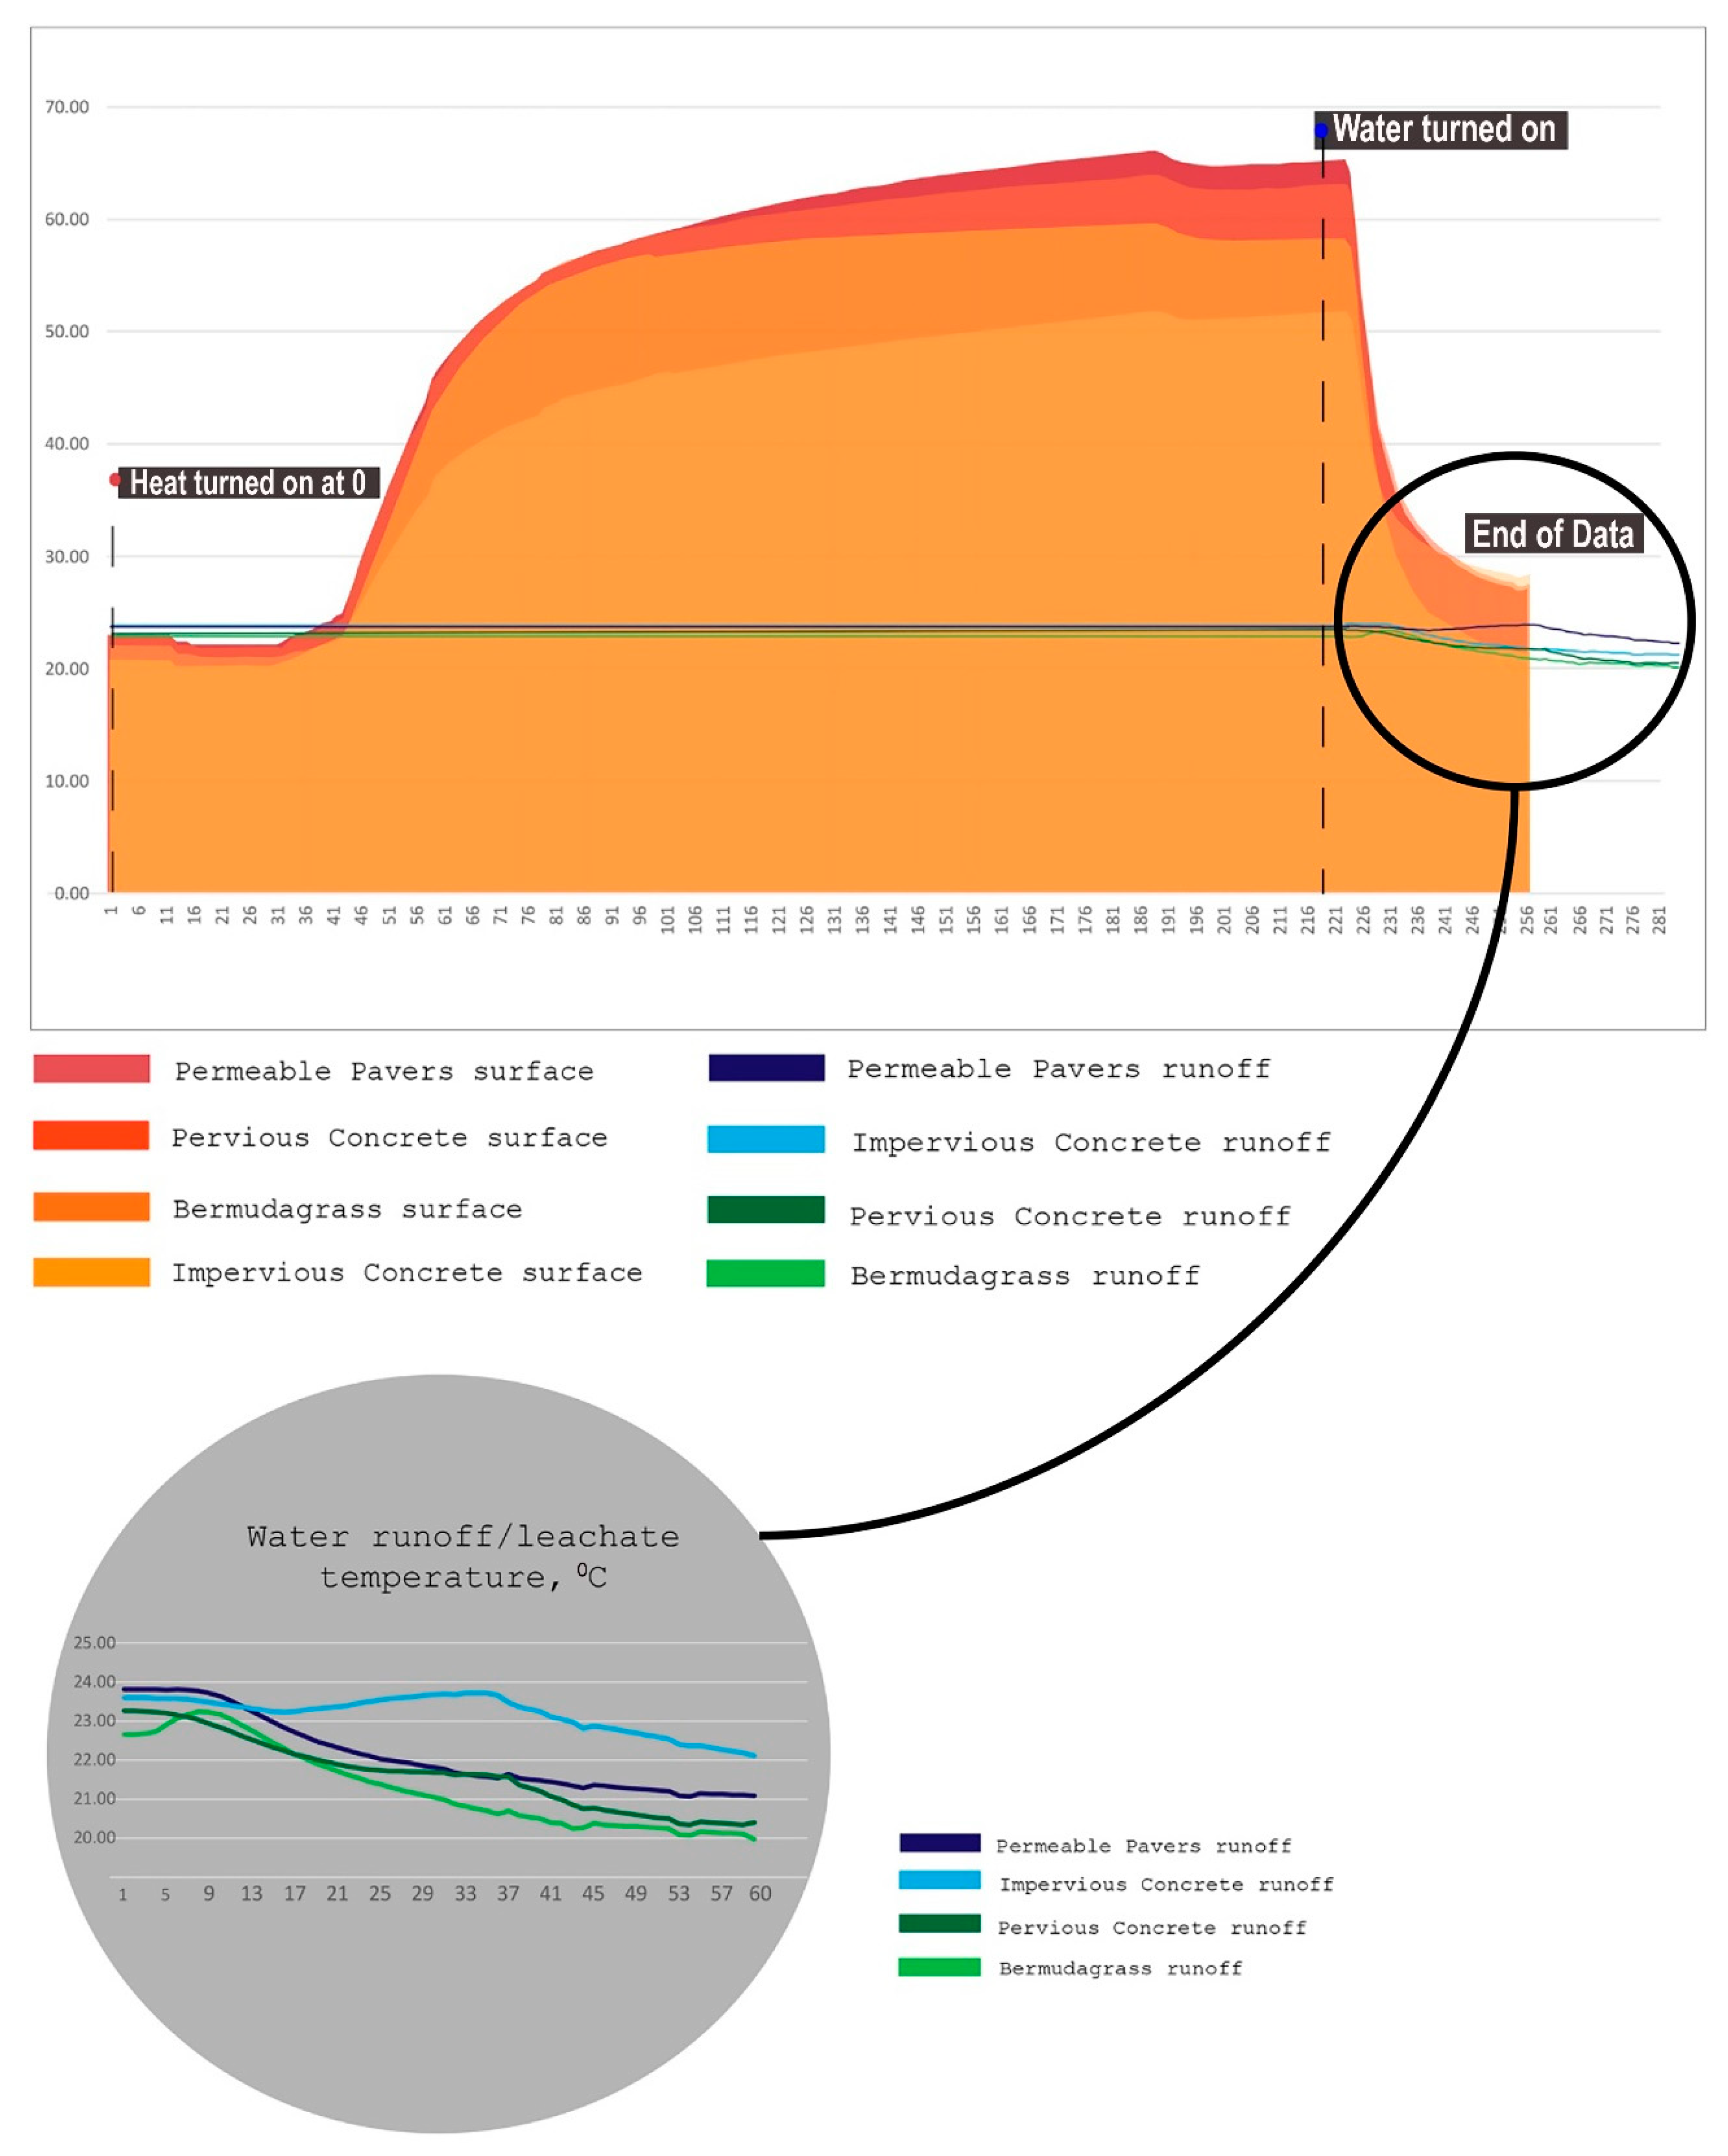
3.1. Laboratory Results
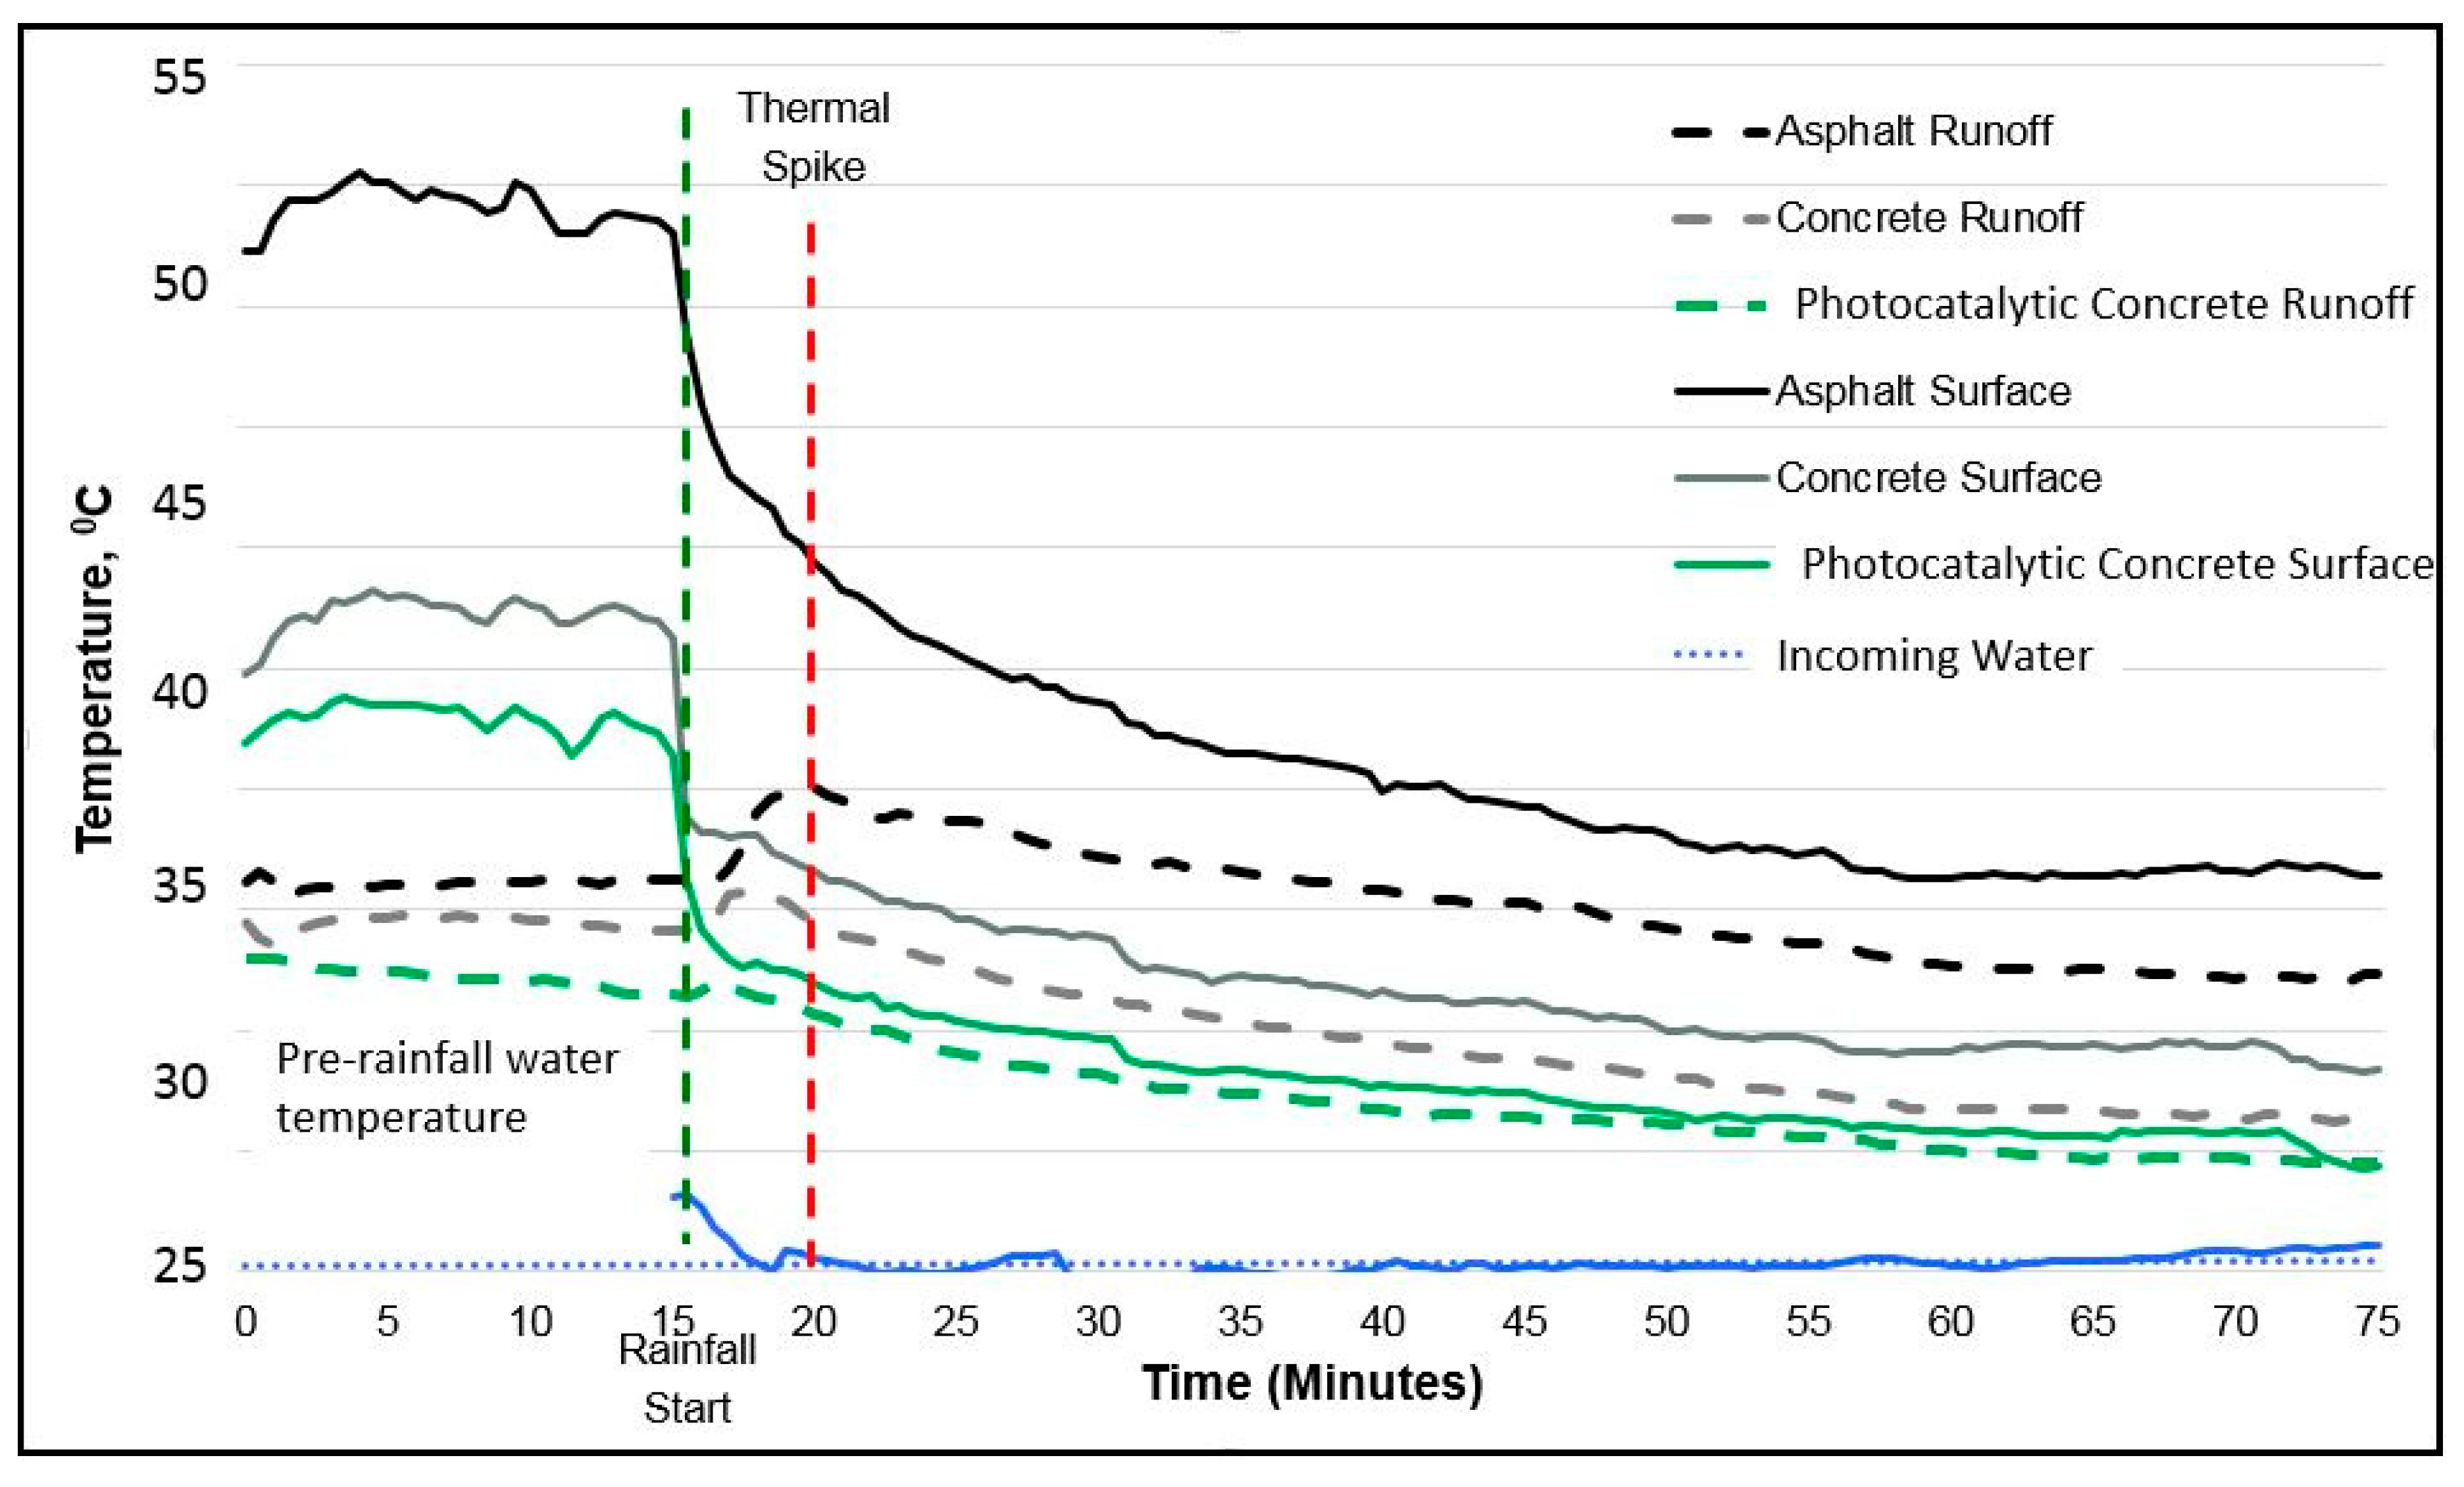
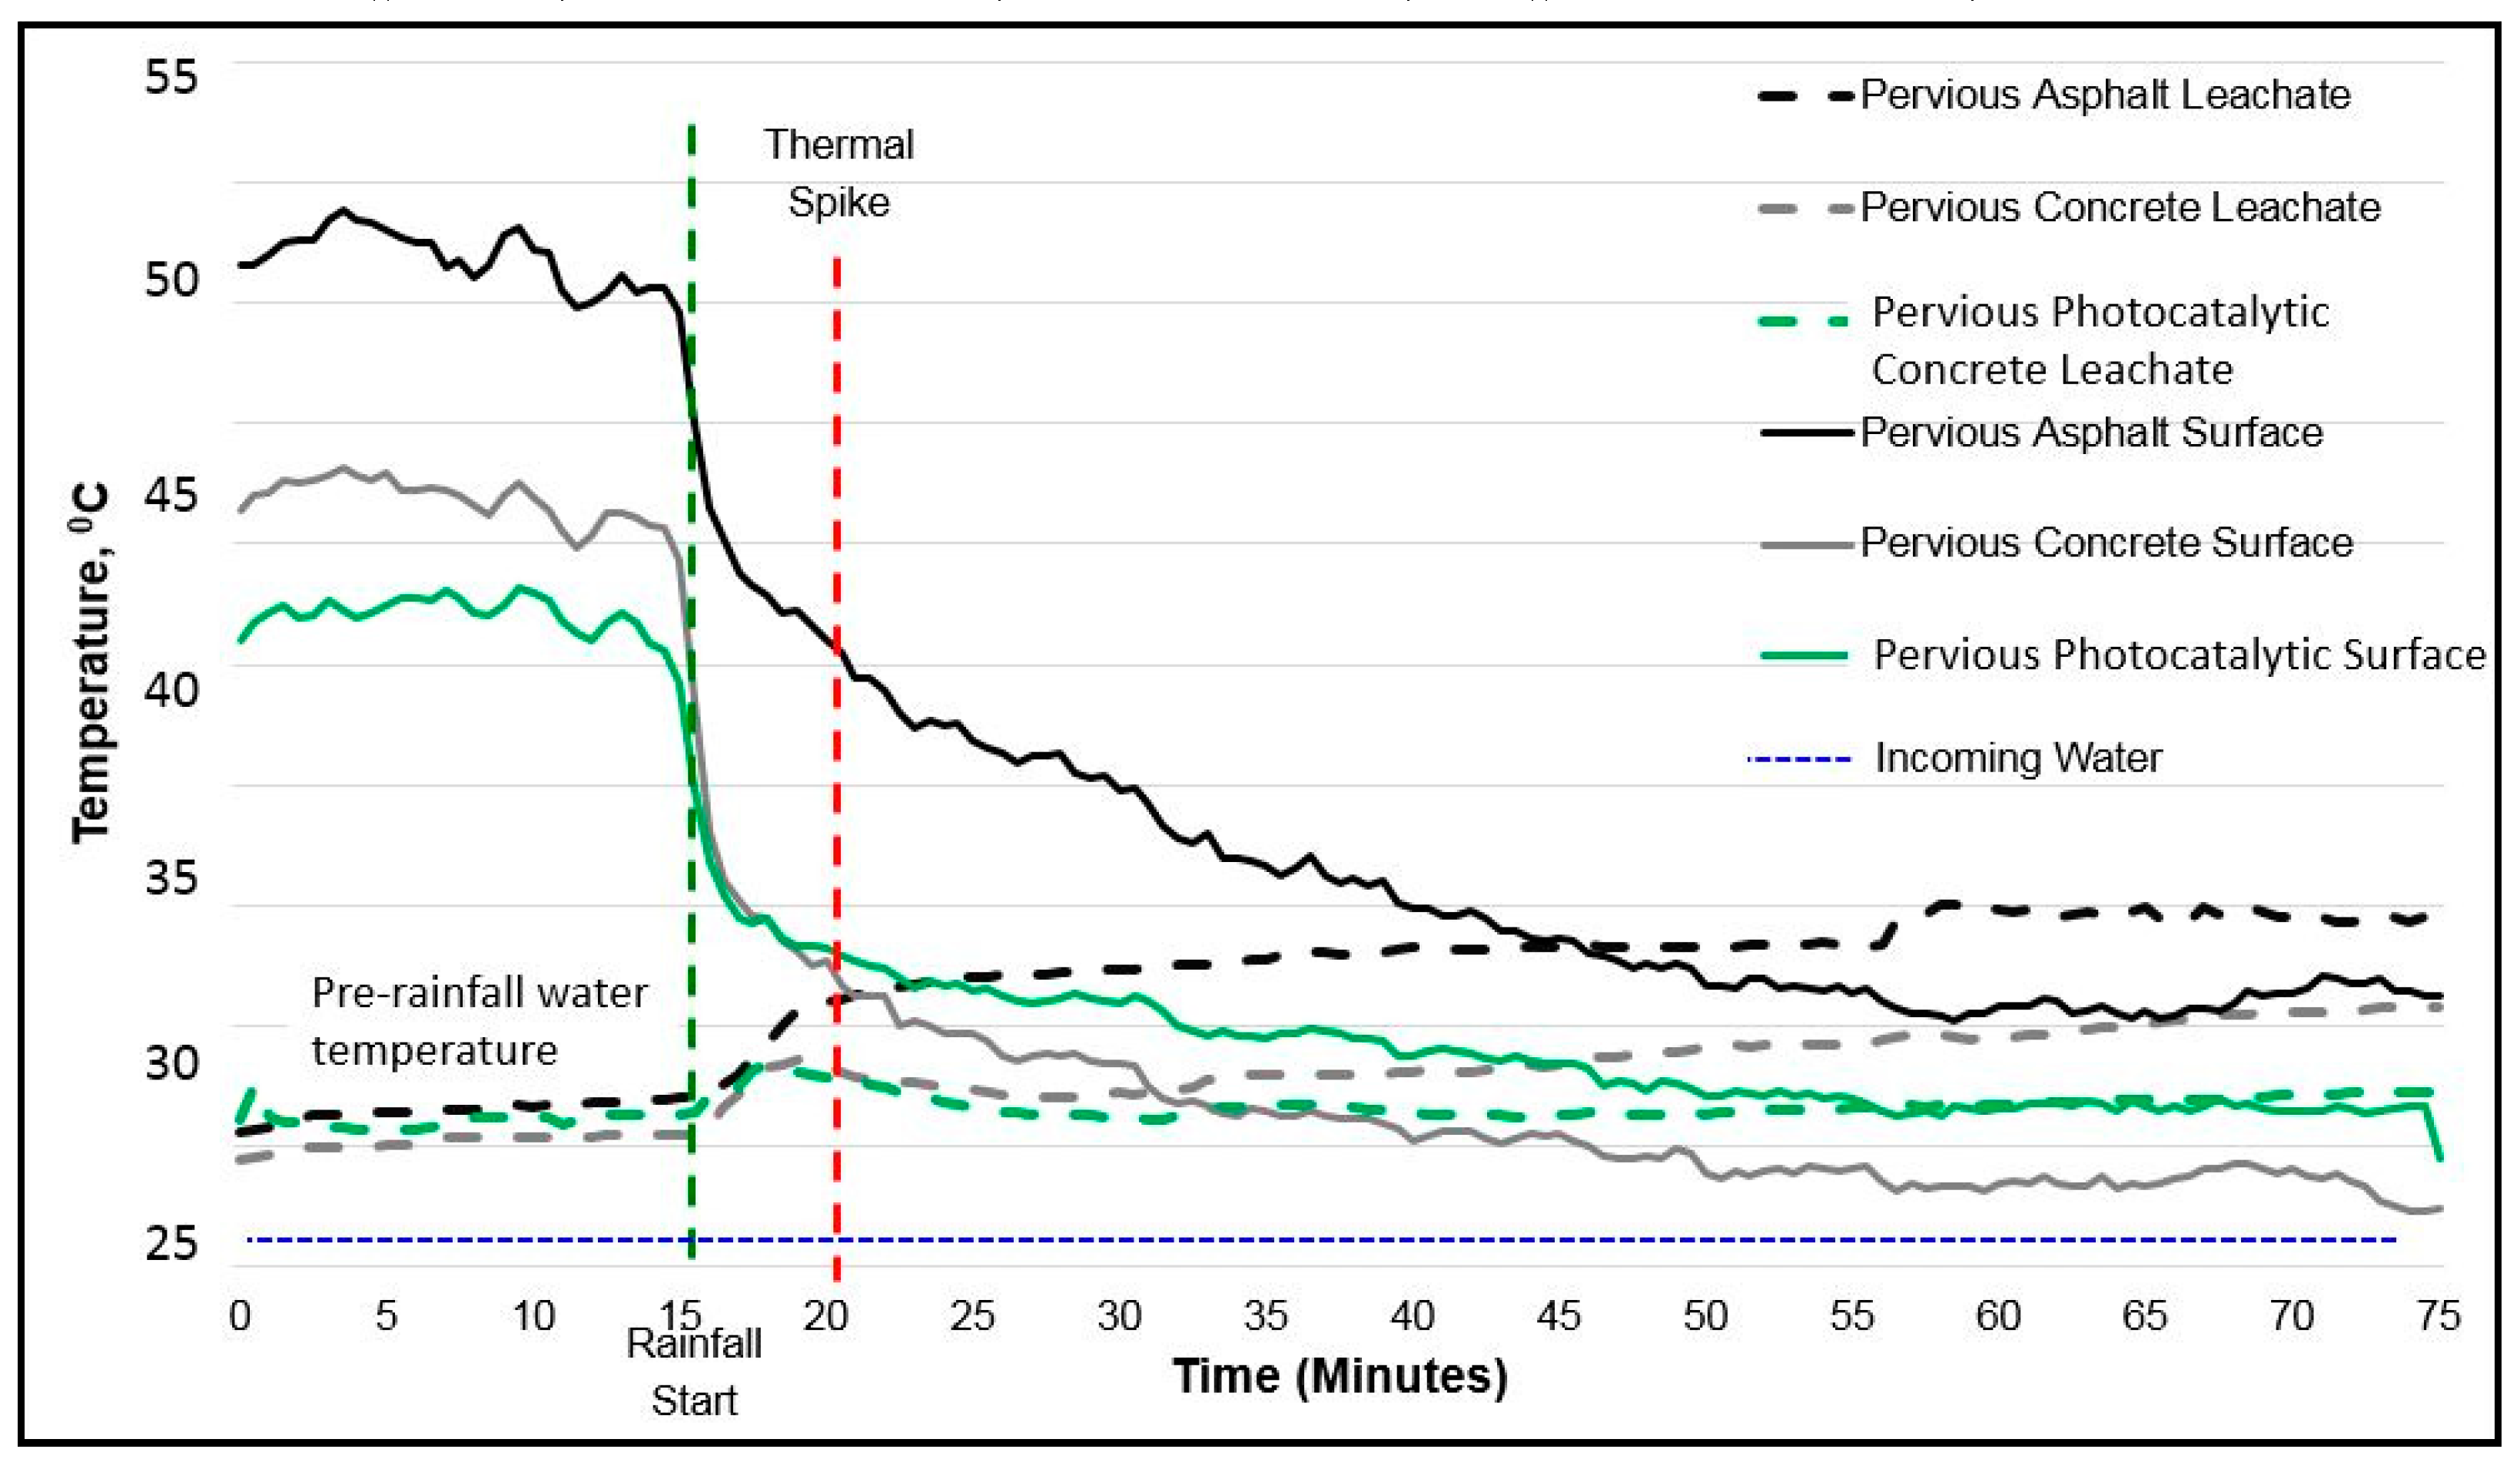
The 20-week laboratory testing period consisted of, on average, one test per week, which resulted in 20 tests from 30 January, 2018 to 26 May, 2018. On one of the test dates, there was a control/heating sensor malfunction, which resulted in exclusion of one test date and resulted in 19 test dates (n = 19). The 20 HOBO® Data Node temperature thermistors utilized throughout the five-month testing period performed as specified, as did RocTest software used to produce continuous temperature graphs for subsequent visual analysis. Consequently, complete data from 19 of the 20 test dates were used to compare steady-state surface and runoff/leachate temperatures between the four surface microcosms tested.
Temperature thermistors collected increasing surface temperatures during the application of heat lamp radiation followed by rapidly decreasing surface temperatures during the application of simulated rainfall for the typical four-hour duration of each test. The continuous change in temperature was collected on top of each surface as well as in the interior, subgrade, collection, and leachate basins exiting each rain garden microcosm. During the three-hour heating period, the pavers recorded the highest average surface temperature of 67.3 °C (153.2 °F), while the impervious concrete recorded the lowest average surface temperature of 53.0 °C (127.5 °F) (Table 1). Pervious concrete along with the pavers were the two hottest surfaces observed under equivalent thermal radiation, which is similar to results reported by Kevern, Haselbach, and Schafer [37].
Steady-state temperatures after rainfall simulation and 30-min cool down period (Table 1) indicate that impervious concrete had the highest resulting average surface temperature of 29.0 °C (84.2 °F). Bermuda grass recorded the lowest temperature at 22.4 °C (72.4 °F) at the end of the simulated rainfall and cool down phase. Even though the average steady-state surface temperature of the cooled and rained-on pervious concrete was only 0.8 °C lower than the cooled impervious concrete, the average leachate temperature from the pervious sample was cooler than impervious pavement surface runoff (21.1 °C vs. 23.1 °C). Water temperature and mass flow rate impacts thermal load of a stormwater effluent, even before being passed to a rain garden or other downstream treatment. In this study, effluent temperatures of leachate from pavers and pervious concrete are most similar at the steady state, with the lowest runoff/leachate temperatures observed from the Bermuda grass microcosm, as expected (Table 1). In addition, the impervious concrete microcosm produced the highest runoff temperatures of all four surfaces tested under the short-term, but identical thermal conditions of this study.
It was noted during data collection that water temperatures within the exposed rainfall simulation system experienced a gradual rise throughout the three-hour heating phase. This slight source of error was not anticipated and will be corrected using pipe insulation during future testing. Fortunately, once the irrigation system was turned on and water was flowing during rainfall simulations, the continuous flow of water quickly expelled the preheated water and a rapid return to normal water system temperatures was seen (Figure 6). At the start of the heating cycle, the water system temperature ranged between 22 to 23 °C, which was increased by ambient heating by no more than 1 °C. Simulated rainfall onto heated surface microcosms had a much more pronounced effect on water runoff and leachate temperatures, as detailed below and depicted graphically in Figure 6.
Figure 6 indicates the clear temperature impact of thermal energy on heated surfaces over time, which provides a visual curve of how steady-state or equilibrium surface temperatures are achieved. In addition, the graph shows the immediate and drastic impact of rainfall on a heated surface, with temperature drops of approximately 30 °C (86 °F) observed in the laboratory study. Figure 6 also shows the resulting temperature impact on runoff and leachate from each of the surfaces studied. The magnified graphic shows continuous water temperature (runoff or leachate) after initiation of simulated rainfall, which indicates that impervious concrete runoff has the highest average runoff temperature, both immediately after rainfall runoff events and up to one hour after initiation of the rainfall event. Unfortunately, the present study did not include temperature monitoring of surfaces or rainfall beyond four hours in total, which limited the conclusions that can be drawn concerning the resulting steady-state runoff and leachate temperatures. In spite of this limitation, which will be corrected in future testing, all discharged water is generally observed to cool after heat lamps are shut off with the exception of a slight temperature rise within 10 min, which is most prominent in Bermuda grass. That appears to be a delay caused by a thermal gain that we have previously described as a “thermal flush”or “thermal spike,” which is similar to the contaminant or nutrient flush observed after the first moments of a typical stormwater runoff event [41]. Other authors, notably Deletic [55], monitored the temperature of urban surface runoff in Australia, and reported no first flush effect for the temperature. In a follow-up study, Bach et al. [56] noted the importance of selecting suitable runoff increments for statistical sampling in order to accurately identify the initial background concentrations and recommended further research to fully develop a more accurate assessment of the first flush phenomenon. Earlier authors [19] demonstrated the usefulness of a flow-weighted temperature average called temperature equivalent (TE) to quantify reasonable estimates of thermal loads via heat budget calculations.

3.2. Field Results

Average steady-state temperature of pavements in the full summer sun during the nine-week field study in 2013 (Table 2) indicate that, in general, pervious pavements attained higher daytime temperatures, which is reinforced by the steeper temperature gain in the laboratory, than comparable impervious pavements (concrete, photocatylitic concrete, and asphalt) including gravel and permeable pavers. This observation confirms previously reported research regarding higher daytime temperatures of pervious materials due to higher comparative surface roughness and heat capture within moist pore space compared to impervious pavements. Consequently, certain qualifications may be needed in use of the term “cool pavement” to describe the ambient temperature above porous concrete and asphalt in hot urban centers during full sun conditions. Conversely, turf and other grassed or lighter surfaces such as photocatylitic concrete clearly provide cooler full sun temperatures, even though they may not be the typical first choice for a high-traffic urban surface.
Gravel surfaces, the most porous of all material surfaces evaluated in the 2013 field study, had the highest observed infiltration rate (not reported in this paper), and was among the surfaces with the highest steady-state surface temperature at 50 °C (122 °F). Athough pervious materials regardless of color and material type had similarly higher full sun surface temperatures than comparable impervious surfaces, differences among porous pavements such as porous asphalt and pervious concrete and photocatalytic concrete became mainly a function of color, with the darkest and most porous material (pervious asphalt 56.4 °C, 133.5 °F) having the highest steady-state, full sun surface temperature, as expected. Pervious photocatalytic concrete, which has the lightest color, also had the lowest steady-state temperature of the pervious pavement hardscapes at 42.0 °C (107.6 °F). Light and dark pavers in the field study were considered a “hybrid” pavement in that they have both pervious and impervious properties. The pavers were found on average 48.6 °C (119.5 °F) to be cooler than porous asphalt and pervious concrete (average 53.2 °C, 127.8 °F) and hotter than conventional impervious asphalt and concrete (average 47.7 °C, 117 °F). All surfaces were exposed to full summer Alabama sun and were observed to be hotter than grass 37.7 °C (99.9 °F), which, as expected, captures the textbook expectation of a “cool surface.”
During the field study, average thermal camera temperature values were compared by correlation with corresponding discrete surface thermocouple temperatures to validate thermal image temperature estimates. Correlation of all recorded surface thermocouple temperatures with corresponding average thermal image temperatures was high (r = 0.83). Authors concluded that this high correlation (Figure 7) validated the thermal imaging temperature estimates reported in this study.
Continuous temperatures obtained from thermal probes taped to each slab surface and in runoff/leachate collection gutters for each outdoor field test slab provided a graphic of real-time temperature change. Figure 8 plots average slab surface temperatures (solid lines) and water runoff temperatures (dashed lines) from impervious test slabs. All lines show a gradual cooling of surfaces over the 60-min simulated rainfall after an initial thermal spike is noted. The rapid temperature increase (thermal spike) in runoff temperatures is noted in these outdoor tests within the first five minutes after initiating a simulated rain event. As discussed in the following section, thermal spikes did not appear to be as prominent in leachate temperatures from pervious surfaces, which indicates that ‘thermal flushing’ is more prominent from impervious surfaces.
In addition, timing of thermal spikes appears somewhat delayed, possibly because of the rougher surface in pervious pavements with differences appearing most pronounced in hotter pavements, such as asphalt, which are darker in color (black).
As Figure 8 (the impervious surface graph) shows, impervious surface runoff temperatures tend to more closely track corresponding surface temperatures in the same graph. In other words, impervious surface runoff temperatures cooled consistently with the surface, which is similar to the example given of a frying pan that has cold running water applied to its surface. Although a subtle thermal spike was observed in leachate temperatures from the replicated pervious pavement plots, these ‘spikes’ are followed by a flatter slope, which occurr within five minutes that surprisingly begins to rise to a higher temperature than pervious pavement counterparts during continued rainfall input. The observation that pervious pavement leachate temperatures continue to increase indications that heat exchanged within the porous pavement from continued insolation (incoming solar radiation) to the water persistently adds heat to released leachate (Figure 9). This result highlights the critical importance of adequate detention storage to match the expected volume of heated leachate, especially those draining into thermally impaired receiving waters.
Figure 9 plots average slab surface temperatures (solid lines) and water runoff temperatures (dashed lines) from all pervious test slabs, not including gravel. All lines show a gradual cooling of surfaces over the 60-min simulated rainfall, similar to impervious surfaces. As seen in Figure 8, a temperature increase (thermal spike) in runoff temperatures is also noted in pervious test slabs within the first five minutes after a simulated rain event. However, the spike is less pronounced and the resulting leachate temperatures take on a different slope, which actually rises in temperatures with continued rainfall simulation. In fact, all field-observed leachate temperatures cross over and rise above corresponding pervious surface temperatures on the same graph before reaching equilibrium temperature, as opposed to impervious surface runoff temperatures.

4. Discussion

The data produced in the laboratory study suggests that porous paving systems tend to reduce thermal loading of stormwater runoff, as it passes through the porous system. The permeable pavers and pervious concrete recorded 11.9 °C and 14.3 °C, respectively, higher surface temperature than impervious concrete, which is similar to other studies. The water temperature data collected throughout the rainfall and short cooling period after thermal loading indicated short-term leachate temperatures from impervious concrete higher than pervious concrete (23.1 °C vs. average 21.2 °C). Although effluent temperatures from the Bermuda grass microcosm track lower than the other surfaces evaluated (20.4 °C), grass surfaces may have limited application in high traffic areas. Further laboratory studies with controlled rain garden (or bioretention) microcosms can test which types of pavement treatment systems are most effective in reducing thermal loads from stormwater runoff.
Due to an increase in environmental concern regarding the urban heat island effect, the field study was designed to examine and compare the surface, runoff, and leachate temperatures of various pervious and impervious pavement surfaces to grass and gravel under comparable outdoor and simulated rainfall conditions. Pervious pavements in the field study appear to be effective long-term heat exchangers compared to impervious surfaces of the same or similar material. This thermodynamic feature of porous materials is typically considered an advantage as heated surface water from a summer rain, which is more quickly dissipated underground through the pervious surface rather than discharged directly to surface water. The increased potential for immediate, underground stormwater detention provided by porous pavements is widely appreciated. A comparison of steady-state leachate versus runoff temperatures in this study from pervious and impervious surfaces, respectively (Table 2, Figure 8 and Figure 9) indicate that longer term temperature monitoring during rainfall events may provide more detailed steady-state predictions of thermal loads from stormwater.
In the meantime, the recognized detention capability offered by properly designed and installed pervious pavement systems should be considered in tandem with their observed ability to transfer incoming heat from the surface downward with the water. As a consequence, the downward movement of water in a pervious system, in conjunction with its proven facility as a heat exchanger, may provide a better likelihood of cooling underground before thermally impaired stormwater reaches sensitive urban receiving waters.
Research has shown that as much as 93% of stormwater captured by pervious pavements is infiltrated into subgrade soils and, therefore, will not reach any receiving waters [57]. Based on results of this and other studies, impervious pavements in full sun do not, in general, attain surface temperatures as high as porous surfaces and their runoff tends to reach a temperature equilibrium that tracks their corresponding surface temperature more closely than pervious pavements. Implications of the dynamic heat exchange mechanisms of conduction and insolation during daytime and nighttime were not investigated further in this study, but provide opportunities to quantify thermal properties of urban pavements across both day and nighttime conditions. Clearly, both impervious and pervious surfaces sustain a large initial temperature rise (shock) due to the conduction of rainfall hitting the heated surface. To better quantify heat transfer to stormwater in an urban setting, comparative thermal storage monitoring of both temperature and flow within pervious pavement systems during day and night conditions is required.
Pervious pavements observed in the field study appear to provide better conduction and transfer of heat from surfaces exposed to solar radiation. The lighter color of a pavement surface has a reflective effect that reduces temperature for both pervious and impervious surfaces. Lighter colors have a greater impact on reducing impervious surface temperatures due to their irregular surfaces, while pervious surface leachate temperatures are observed to rise steadily throughout the experiment to temperatures that may or may not in the long-term be higher than impervious surface runoff, but, in most cases, are greatly reduced in volume. The thermal result implied from this field study is that pervious pavements under full summer sunlight have a higher capacity to transfer sustained solar heat gains than impervious surfaces, when all other conditions are equal. Impervious surface runoff temperatures, although initially high under full insolation, cool more progressively than pervious surfaces even though they are generally starting at a higher temperature and approaching a steady-state water temperature that cools as does its corresponding impervious surface. This result makes sense in terms of water on a hot pan conducting heat away from the surface. What that means for the effect on downstream water quality will require further study under more controlled conditions than were available in the current study.

Comparison of Laboratory and Field Results

As Table 3 indicates, steady-state surface temperatures generated in the laboratory were higher than those recorded for outdoor field data by as much as 59% in the case of Bermuda grass and 27% greater in the case of impervious concrete. While not a statistical comparison between locations, results indicate that thermal heat lamps used in the laboratory study were more than sufficient to create heat loads that simulate natural insolation during a full sun, Alabama summer. As a result, in future testing, heat lamps can be repositioned at a higher distance or for shorter duration to reduce intensity and to produce a range of surface temperatures and data.
The relationships between surface, runoff, and leachate temperatures that were observed in the laboratory tests were not inconsistent from those observed in the outdoor field studies, and results from both locations suggest somewhat higher initial runoff temperatures from impervious surfaces than from pervious pavement leachate, even though the statistical significance of those differences was not investigated.

5. Conclusions

The multi-disciplinary approach used for these studies has provided new information that may be used as baseline information to effectively mitigate stormwater thermal loads using LID SCMs.
The laboratory research was focused on the first three of the four objectives. Twenty weeks of testing the thermal load of stormwater through impervious concrete, pervious concrete, permeable pavers, and Bermuda grass suggest that average short-term leachate temperatures from pervious concrete and permeable paver system are lower than temperatures from impervious concrete systems when all other conditions are similar. Findings support the hypothesis that pervious paving systems can help reduce the thermal load of stormwater runoff more than an impervious paving system due to increased retention and ground cooling provided all other conditions are equal. The laboratory study also shows that the implementation of a rain garden (or bioretention) in a treatment train with either pervious or impervious concrete or other paving system can be studied in a replicated research setting. Although the thermal load reductions from rain garden microcosms were not reported in this paper, TMDL studies and environmental actions have shown that because even minimal thermal influx can be detrimental to freshwater species and habitats. Any reduction in the thermal load of stormwater to a downstream aquatic habitat proves beneficial.
The field research project addressed the second, third, and fourth objectives and compared the summer daytime surface temperatures of nine different pavement surfaces and a Bermuda grass cover over 15 dates in the hottest part of an Alabama summer in 2013. Results indicated that darker pavements were hotter, while lighter pavements were cooler. Pervious pavements in full sun were observed to be hotter than impervious pavements of the same material with hybrid paver system pavements somewhere in between. The grass was the coolest of all surfaces tested, which suggests that grass surfaces provide a reference by which to compare other surfaces claiming to be “cool pavements.” The research also compared continuous temperature changes in summer daytime runoff, leachate, and pavement surface of different pavement surfaces and a grass cover during and after simulated rainfall in full sun, summer conditions. The impervious pavements provided a more rapid short-term temperature response (increase) to rainfall than pervious surfaces. Stormwater runoff temperatures from impervious surfaces along with impervious pavement surface temperatures steadily decreased during continuous rainfall over the 60-min test simulation. While impervious pavement surfaces were cooled by rainfall, stormwater leachate temperatures from pervious surfaces gradually increased over the course of the test, which indicates accumulating and/or sustained transfer of heat from the porous pavement to the leachate likely due to (1) deeper penetration of solar heating within the pervious pavement pores and (2) greater heated surface contact area available to the leachate trickling through pervious slabs.
A thermal spike was identified in all impervious pavement stormwater runoff datasets. This temperature spike occurred within the first 5 min of exposure to rainfall. It is this spike that could be the most threatening to nearby bodies of water and the aquatic life they support. In spite of higher full sun surface temperatures in porous vs. nonporous pavement, the stormwater thermal pollution impacts of using pervious surfaces appears to be a net positive effect due to increased detention and retention of stormwater captured by and within these pavements. Ideally, all stormwater in a properly designed, installed, and maintained pervious pavement systems is detained or retained within the system and rarely has an opportunity to come in contact with water bodies [57]. If this is the case, the heat exchanging capacity of porous pavement systems documented in this study provides the additional benefit of decreasing the transfer of heat units from the surface and speeding the exchange of thermal energy downward into natural ground cooling. One surprising and beneficial finding of this study is the apparent higher capacity of pervious pavements to capture and exchange heat compared with impervious pavements. The implications for the impact pervious systems may have on Heat Islands in urban watersheds are important and should be studied further [58,59]. The effects of landscaping and vegetative cover provided by complementary natural systems promise to play an increasingly important role in cooling, hot urban environments.

Author Contributions

R.B., R.W. and J.A.O. conducted this research. C.L., M.D., K.R., and A.W. were advisors. Conceptualization, C.L., M.D., K.R., and A.W. Methodology, C.L., M.D., K.R., and A.W. Data Curation, M.D., K.R., and R.B. Formal Analysis, M.D., K.R., R.B., A.W., K.B., and C.L. Investigation, C.L., M.D., K.R., and A.W. Resources, C.L., M.D., K.R., K.B., and A.W. Writing-Original Draft Preparation, C.L. Writing-Review & Editing, C.L., M.D., K.R., and A.W. Visualization, R.B., R.W., and K.B. Supervision, C.L., M.D., K.R., and A.W. Project Administration, C.L., M.D., K.R., and A.W. Funding Acquisition, C.L., M.D., K.R., and A.W.

Funding

This research was funded by the College of Architecture, Design and Construction, Auburn University, AL, USA Seed Grant Program, the Center for Construction Innovation and Collaboration at Auburn University, AL, USA, and the Auburn University Intramural Grant Program, and the Alabama Agricultural Experiment Station Equipment Supply Grant Program.

Acknowledgments

We would like to thank Britton Garrett, Landscape Architecture (2017), Graduate Research Assistant, for his contributions to this study, and the students in the Auburn University Building Science, Architecture, and Biosystems Engineering programs who collaborated with Auburn University facilities on the design and construction of a field lab.

Conflicts of Interest

The authors declare no conflict of interest. The funders had no role in the design of the study, in the collection, analyses, or interpretation of data, in the writing of the manuscript, or in the decision to publish the results.

References

  1. Wheater, H.S.; Shaw, T.L.; Rutherford, J.C. Storm Runoff from Small Lowland Catchments in Southwest England. Hydrology 1982, 55, 321–337. [Google Scholar] [CrossRef]
  2. Laenen, A. Storm Runoff as Related to Urbanization Based on Data Collected in Salem and Portland and Generalized for the Willamette Valley, Oregon; Report 83-4143; Water-Resources Investigations USGS: Portland, OR, USA, 1983; p. 94. [Google Scholar]
  3. Booth, D.; Reinelt, L. Consequences of Urbanization on Aquatic Systems-Measured Effects, Degradation Thresholds, and Corrective Strategies. In Watershed ’93, Proceedings of the National Conference on Watershed Management, Alexandria, VA, USA, March 21–24 1993; U.S. Environmental Protection Agency: Alexandria, VA, USA, 1993; pp. 545–550. [Google Scholar]
  4. Schueler, T.R. The Importance of Imperviousness. Watershed Prot. Tech. 1994, 1, 100–111. [Google Scholar]
  5. Arnold, C.L.; Gibbons, C.J. Impervious Surface Coverage: The Emergence of a Key Environmental Indicator. J. Am. Plan. Assoc. 1996, 62, 243–258. [Google Scholar] [CrossRef]
  6. Brater, E.F.; Sangal, S. Effects of Urbanization on Peak Flows. In Effects of Watershed Changes on Streamflow; Moore, W.L., Morgan, C.W., Eds.; University of Texas Press: Austin, TX, USA, 1969; pp. 201–214. ISBN 978-0-2927-0012-3. [Google Scholar]
  7. Omernik, J.M. Influence of Land Use on Stream Nutrient Levels; Ecological Research Series; EPA-600/3-76-014; U.S. EPA Environmental Research Laboratory: Corvallis, OR, USA, 1976; p. 116.
  8. Jordan, T.E.; Pierce, J.W.; Correll, D.L. Flux of Particulate Matter in the Tidal Marshes and Subtidal Shallows of the Rhode River Estuary. Estuaries 1986, 9, 310–319. [Google Scholar] [CrossRef]
  9. Haith, D.A.; Shoenaker, L.L. Generalized Watershed Loading Functions for Stream Flow Nutrients. J. Am. Water Resour. Assoc. 1987, 23, 471–478. [Google Scholar] [CrossRef]
  10. Osborne, L.L.; Wiley, M.J. Empirical Relationships Between Land Use/Cover and Stream Water Quality in an Agricultural Watershed. J. Environ. Manag. 1988, 26, 9–27. [Google Scholar]
  11. Kronvang, B. The Export of Particulate Matter, Particulate Phosphorus and Dissolved Phosphorus from Two Agricultural River Basins: Implications on Estimating the Non-Point Phosphorus Load. Water Res. 1992, 26, 1347–1358. [Google Scholar] [CrossRef]
  12. Correll, D.L.; Jordan, T.E.; Weller, D.E. Precipitation Effects on Sediment and Associated Nutrient Discharges from Rhode River Watersheds. J. Environ. Qual. 1999, 28, 1897–1907. [Google Scholar] [CrossRef]
  13. Randolph, J. Environmental Land Use Planning and Management; Island Press: Washington, DC, USA, 2004; p. 664. ISBN 978-15-5963-948-4. [Google Scholar]
  14. Schueler, T.R. Mitigating the Impacts of Urbanization. In Implementation of Water Pollution Control Measures in Urban Stormwater Runoff; Snodgrass, W.J., P’Ng, J.C., Eds.; Univ. Toronto Press: Toronto, ON, Canada, 1992. [Google Scholar]
  15. U.S. EPA Clean Water Act Section 303(d): Impaired Waters and Total Maximum Daily Loads (TMDLs). Impaired Waters and TMDLs. Available online: https://www.epa.gov/tmdl/overview-identifying-and-restoring-impaired-waters-under-section-303d-cwa (accessed on 20 December 2018).
  16. James, W.; Verspagen, B. Thermal Enrichment of Stormwater by Urban Pavement. J. Water Manag. Model. 1997, 5, 155–177. [Google Scholar] [CrossRef]
  17. Galli, J. Thermal Impacts Associated with Urbanization and Stormwater Management Best Management Practices; Publication 91701; Metropolitan Washington Council of Governments: Washington, DC, USA, 1990; 172p.
  18. Pluhowski, E.J. Urbanization and Its Effect on the Temperature of the Streams on Long Island, New York; USGS Numbered Series; Professional Paper 627-D; US Government Printing Office: Washington DC, USA, 1970; p. 116. [Google Scholar] [CrossRef]
  19. Kieser, M.S.; Fang, A.F.; Spoelstra, J.A. Role of Urban Stormwater Best Management Practices in Temperature TDMLS. In Proceedings of the Water Environment Federation, National TMDL Science and Policy 2003, Chicago, IL, USA, 28 September–2 October 2002; pp. 1716–1739. [Google Scholar] [CrossRef]
  20. US EPA. National Section 303(d) List Fact Sheet. 2009. Available online: http://iaspub.epa.gov/waters10/attains_nation_cy.control?p_report_type=T (accessed on 20 December 2018).
  21. Wehrly, K.E.; Wiley, M.J.; Seelbach, P.W. Classifying Regional Variation in Thermal Regime Based on Stream Fish Community Patterns. Trans. Am. Fish. Soc. 2003, 132, 18–38. [Google Scholar] [CrossRef]
  22. UNH Stormwater Center. Thermal Impacts, Stormwater Management and Surface Waters. 2011. Available online: https://www.unh.edu/unhsc/thermal-impacts (accessed on 10 December 2018).
  23. Olden, J.D.; Naiman, R.J. Incorporating Thermal Regimes into Environmental Flows Assessments: Modifying Dam Operations to Restore Freshwater Ecosystem Integrity. Freshw. Biol. 2010, 55, 86–107. [Google Scholar] [CrossRef]
  24. Vannote, R.L.; Sweeney, B.W. Geographic Analysis of Thermal Equilibria: A Conceptual Model for Evaluating the Effect of Natural and Modified Thermal Regimes on Aquatic Insect Communities. Am. Nat. 1980, 115, 667–695. [Google Scholar] [CrossRef]
  25. Ingleton, T.; McMinn, A. Thermal Plume Effects: A Multi-Disciplinary Approach for Assessing Effects of Thermal Pollution on Estuaries Using Benthic Diatoms and Satellite Imagery. Estuar. Coast. Shelf Sci. 2012, 99, 132–144. [Google Scholar] [CrossRef]
  26. Zorn, T.G.; Seelbach, P.W.; Rutherford, E.S.; Wills, T.C.; Cheng, S.-T.; Wiley, M.J. A Regional-Scale Habitat Suitability Model to Assess the Effects of Flow Reduction on Fish Assemblages in Michigan Streams. J. Am. Water Resour. Assoc. 2012, 48, 871–895. [Google Scholar] [CrossRef]
  27. Dietz, M.E. Low Impact Development Practices: A Review of Current Research and Recommendations for Future Directions. Water Air Soil Pollut. 2007, 186, 351–363. [Google Scholar] [CrossRef] [Green Version]
  28. Davis, A.P.; Hunt, W.F.; Traver, R.G.; Clar, M. Bioretention Technology: An Overview of Current Practice and Future Needs. J. Environ. Eng. 2009, 135, 109–117. [Google Scholar] [CrossRef]
  29. Xie, D.M.; James, W. Modelling Solar Thermal Enrichment of Urban Stormwater. J. Water Manag. Model. 1994. [Google Scholar] [CrossRef] [Green Version]
  30. Dougherty, M.; Dymond, R.L.; Grizzard, T.J.; Godrej, A.N.; Zipper, C.E.; Randolph, J. Quantifying Long-Term NPS Pollutant Flux in an Urbanizing Watershed. J. Environ. Eng. 2006, 132, 547–554. [Google Scholar] [CrossRef]
  31. Burton, G.A.; Pitt, R. Stormwater Effects Handbook: A Toolbox for Watershed Managers, Scientists, and Engineers; CRC Press: Boca Raton, FL, USA, 2001; p. 928. ISBN 978-08-7371-924-7. [Google Scholar]
  32. US EPA. Heat Island Effect. 2013. Available online: https://www.epa.gov/heat-islands (accessed on 20 December 2018).
  33. Howard, L. The Climate of London, Vol ii; Hutchinson: London, UK; p. 285.
  34. Abu Eusuf, M.; Aseada, T. Heating effects of pavement on urban thermal environment. J. Civ. Eng. Inst. Eng. Bangladesh. 1996, 26, 99–124. [Google Scholar]
  35. Stempihar, J.J.; Pourshams-Manzouri, T.; Kaloush, K.E.; Rodezno, M.C. Porous Asphalt Pavement Temperature Effects for Urban Heat Island Analysis. Transp. Res. Rec. J. Transp. Res. Board 2012, 2293, 123–130. [Google Scholar] [CrossRef]
  36. Barbis, J.; Welker, A.L. Stormwater Temperature Mitigation Beneath Porous Pavements. In World Environmental and Water Resources Congress; American Society of Civil Engineers: Providence, RI, USA, 2010; pp. 3971–3979. [Google Scholar] [CrossRef]
  37. Kevern, J.T.; Haselbach, L.; Schaefer, V.R. Hot Weather Comparative Heat Balances in Pervious Concrete and Impervious Concrete Pavement Systems. J. Heat Isl. Inst. Int. 2012, 7, 231–237. [Google Scholar]
  38. Transportation Research Board (TRB). Paving Materials and the Urban Climate; TR News, Issue Number: 253; Transportation Research Board: Washington, DC, USA, 2009; ISSN 0738-6826. [Google Scholar]
  39. Transportation Research Board (TRB). Research Needs Statements. Pavement Materials and the Urban Heat Island Effect. 2013. Available online: http://rns.trb.org/dproject.asp?n=33714 (accessed on 20 December 2018).
  40. Hein, M.; Dougherty, M.P.; LeBleu, C. Evaluation of Stormwater Quality Improvement through Pervious Concrete Pavement; Final Grant Report; AL Water Resource Research Initiative; Auburn University: Auburn, AL, USA, 2010. [Google Scholar]
  41. Rahn, K.; Hein, M.; Dougherty, M.P.; Gandy, J. The Contribution of Pavements to Urban Heat Islands. In Proceedings of the 51st ASC Annual International Conference, Associated Schools of Construction, Texas A&M University, College Station, TX, USA, 22–25 April 2015. [Google Scholar]
  42. Gogula, A.; Hossain, M.; Romanoschi, S. Correlation between the Laboratory and Field Permeability Values for the Superpave Pavements. In Proceedings of the 2003 Mid-Continent Transportation Research Symposium, Iowa State University, Ames, IA, USA, 22–23 August 2003. [Google Scholar]
  43. Dussaillant, A.R.; Cuevas, A.; Potter, K.W. Raingardens for Stormwater Infiltration and Focused Groundwater Recharge: Simulations for Different World Climates. Water Sci. Technol. Water Supply 2005, 5, 173–179. [Google Scholar] [CrossRef]
  44. Dylewski, K.L.; Wright, A.N.; Tilt, K.M.; LeBleu, C. Effect of Previous Flood Exposure on Flood Tolerance and Growth of Three Landscape Shrub Taxa Subjected to Repeated Short-Term Flooding. J. Environ. Hortic. 2012, 30, 58–64. [Google Scholar]
  45. Hunt, W.F. Designing Rain Gardens (Bio-Retention Areas); North Carolina Cooperative Extension System: Raleigh, NC, USA, 2001; Available online: http://www.raingardensforthebays.org/wp-content/uploads/2013/04/DesigningRainGardens2001.pdf (accessed on 20 December 2018).
  46. Christian, K.J.; Wright, A.N.; Sibley, J.L.; Brantley, E.F.; Howe, J.A.; Dougherty, M.P.; LeBleu, C.M. Effect of phosphorus concentration on growth of Muhlenbergia capillaris in flooded and non-flooded conditions. J. Environ. Hortic. 2012, 30, 219–222. [Google Scholar]
  47. North Carolina Division of Water Quality. Stormwater Best Management Practices Design Manual. 2009. Available online: https://deq.nc.gov/sw-bmp-manual (accessed on 20 December 2018).
  48. Dylewski, K.L.; Wright, A.N.; Tilt, K.M.; LeBleu, C. Effects of Short Interval Cyclic Flooding on Growth and Survival of Three Native Shrubs. HortTechnology 2011, 21, 461–465. [Google Scholar] [CrossRef]
  49. Isaacs, R.; Tuell, J.; Fiedler, A.; Gardiner, M.; Landis, D. Maximizing Arthropod-Mediated Ecosystem Services in Agricultural Landscapes: The Role of Native Plants. Front. Ecol. Environ. 2009, 7, 196–203. [Google Scholar] [CrossRef]
  50. Dunnett, N.; Clayden, A. Rain Gardens: Managing Water Sustainably in the Garden and Designed Landscape; Timber Press, Inc.: Portland, OR, USA, 2007; p. 188. ISBN 978-08-8192-826-6. [Google Scholar]
  51. Toran, L. Storm Water Control Management & Monitoring; PA DOT: Harrisburg, PA, USA, 2017. Available online: https://rosap.ntl.bts.gov/view/dot/35094 (accessed on 25 January 2019).
  52. Bowen, R. Quantifying the Benefits of Pervious Paving Systems for their Increased Implementation. Master’s Thesis, Auburn University, Auburn, AL, USA, 2018. [Google Scholar]
  53. Davis, B. The Thermal Environmental Effects of Pervious Paving. Master’s Thesis, Auburn University, Auburn, AL, USA, 2016. [Google Scholar]
  54. Wang, R.; LeBleu, C.M. Experience with Collaborative Research on Thermal Characteristics of Low Impact Development Strategies. Landsc. Res. Rec. 2018, 122–132. Available online: http://thecela.org/wp-content/uploads/361F-EXPERIENCE-WITH-COLLABORATIVE.pdf (accessed on 22 December 2018).
  55. Deletic, A. The First Flush of Urabn Surface Runoff. Water Res. 1998, 32, 2462–2470. [Google Scholar] [CrossRef]
  56. Bach, P.M.; McCarthy, D.T.; Deletic, A. Redefining the Stormwater First Flush Phenomenon. Water Res. 2010, 44, 2487–2498. [Google Scholar] [CrossRef]
  57. Estes, C.J. Storm Water Infiltration in Clay Soils: A Case Study of Storm Water Retention and Infiltration Techniques in the North Carolina Piedmont. In Low Impact Development; American Society of Civil Engineers: Wilmington, NC, USA, 2008; pp. 159–170. [Google Scholar] [CrossRef]
  58. Todeschini, S. Hydrologic and Environmental Impacts of Imperviousness in an Industrial Catchment of Northern Italy. J. Hydrol. Eng. 2016, 21, 05016013. [Google Scholar] [CrossRef]
  59. Tu, M.-C.; Smith, P. Modeling Pollutant Buildup and Washoff Parameters for SWMM Based on Land Use in a Semiarid Urban Watershed. Water Air Soil Pollut. 2018, 229, 121. [Google Scholar] [CrossRef]
Figure 1. Layout of the Green Infrastructure Laboratory at the Mike Hubbard Center for Advanced Science, Innovation and Commerce (CASIC) Building at Auburn University, Auburn, AL, USA [52].
Hydrology 06 00016 g001
Figure 2. Graphical representation of distribution uniformity and the precipitation rate test results on the laboratory of substrate microcosms in laboratory rainfall simulations [52].
Hydrology 06 00016 g002
Figure 3. Surface microcosm sections showing subgrade material and thermistors [54].
Hydrology 06 00016 g003
Figure 4. Substrate runoff/leachate funneled into adjacent rain garden microcosms [54].
Hydrology 06 00016 g004
Figure 5. Field laboratory layout, Auburn University, Auburn, Alabama, 2013 [41].
Hydrology 06 00016 g005
Figure 6. Change in surface temperature °C for selected surfaces in a laboratory study. Bottom bubble highlights the impact on the water temperature immediately after simulated rainfall.
Hydrology 06 00016 g006
Figure 7. Surface thermocouple temperature correlation (all surface materials) versus thermal camera temperatures at outdoor field study site, Auburn University, Auburn, Alabama, 2013.
Hydrology 06 00016 g007
Figure 8. Average impervious surface and water temperatures by the thermal probe at the outdoor field study site, Auburn University, Auburn, Alabama, 2013.
Hydrology 06 00016 g008
Figure 9. Pervious surface and water temperatures by thermal probe at the outdoor field study site, Auburn University, Auburn, Alabama [41].
Hydrology 06 00016 g009
Table 1. Average steady-state temperatures, °C, in the laboratory study using indoor heat lamps and simulated rainfall, Auburn University, Auburn, Alabama, 2018 (n = 19 events).
Surface MaterialHeated Surface 1Cooled Surface 2Runoff/Leachate 3Laboratory Ambient 4
Pervious Concrete64.9 ± 1.6328.2 ± 1.7921.1 ± 1.0527.5 ± 1.4
Impervious Concrete53.0 ± 4.9629.0 ± 1.7823.1 ± 1.3527.5 ± 1.4
Permeable Pavers67.3 ± 1.4827.4 ± 1.8321.3 ± 0.6727.5 ± 1.4
Bermuda grass60.1 ± 2.7522.4 ± 1.4120.4 ± 0.7527.6 ± 1.4
1 Steady-state surface temperature at the end of the three-hour heating period (n = 19) ± 1SD (standard deviation). 2 Steady-state surface temperature at the end of 30-min surface cool down phase (n = 19) ± 1SD. 3 Steady-state runoff temperature from impervious surfaces and leachate from pervious materials ± 1SD. 4 Mean ambient temperature of laboratory in vicinity of test surface during study ± 1SD.
Table 2. Average steady-state surface temperatures of selected materials (from thermal imaging camera) °C at the outdoor field study site, Auburn University, Auburn, Alabama, 2013 (n = 15 events).
Surface MaterialFull Sun 1After Simulated Rainfall 2Decrease after Simulated Rainfall
Porous Asphalt56.4 ± 0.6939.2 ± 0.74−30.5%
Asphalt53.5 ± 0.7240.9 ± 0.53−23.6%
Gravel50.0 ± 1.3832.6 ± 0.86−34.8%
Pervious Concrete49.9 ± 0.5335.3 ± 0.77−29.3%
Impervious Concrete41.8 ± 0.5135.8 ± 0.48−14.4%
Pervious Photo-Catalytic Concrete42.0 ± 0.8333.6 ± 0.74−20.0%
Photocatalytic Concrete38.4 ± 0.8333.3 ± 0.44−13.3%
Dark Permeable Pavers52.2 ± 0.81 36.6 ± 0.81−29.9%
Light Permeable Pavers45.0 ± 0.6633.4 ± 0.70−25.8%
Bermuda Grass37.7 ± 1.5332.2 ± 0.96−14.6%
1 Steady-state surface temperature ± 1SD (standard deviation) at the end of full sun, outdoor conditions (n = 15). 2 Steady-state surface temperature ± 1SD at the end of 30-min simulated rainfall applied during full sun, outdoor conditions (n = 15).
Table 3. Comparison of steady-state surface temperature data for selected materials, outdoor field lab vs. laboratory thermal input, °C, Auburn, Alabama.
Surface MaterialOutdoor Full SunLaboratory Heat LampIncrease in Laboratory over Field Test
Pervious Concrete49.9 ± 0.5364.9 ± 1.6330.1%
Impervious Concrete41.8 ± 0.5153.0 ± 4.9626.8%
Permeable Pavers48.6 ± 0.74 167.3 ± 1.4838.5%
Bermuda Grass37.7 ± 1.5360.1 ± 2.759.4%
1 Average of light and dark permeable concrete pavers.

