Case Report

Improving Urban Runoff in Multi-Basin Hydrological Simulation by the HYPE Model Using EEA Urban Atlas: A Case Study in the Sege River Basin, Sweden

1
Department of Civil and Environmental Engineering, Tokyo Metropolitan University, Hachioji, Tokyo 192-0397, Japan
2
Research Department, Swedish Meteorological and Hydrological Institute, SE-601 76 Norrköping, Sweden
*
Author to whom correspondence should be addressed.
Hydrology 2019, 6(1), 28; https://doi.org/10.3390/hydrology6010028
Submission received: 6 February 2019 / Revised: 12 March 2019 / Accepted: 19 March 2019 / Published: 21 March 2019

Abstract

:
In this study, the high-resolution polygonal land cover data of EEA Urban Atlas was applied for land-use characterization in the dynamic multi-basin hydrological model, HYPE. The objective of the study was to compare this dedicated urban land cover data in semi-distributed hydrological modelling with the widely used but less detailed EEA CORINE. The model was set up for a basin including a small town named Svedala in southern Sweden. In order to verify the ability of the HYPE model to reproduce the observed flow rate, the simulated flow rate was evaluated based on river flow time series, statistical indicators and flow duration curves. Flow rate simulated by the model based on Urban Atlas generally agreed better with observations of summer storm events than the CORINE-based model, especially when the daily rainfall amount was 10 mm/day or more, or the flow exceedance probability was 0.02 to 0.5. It suggests that the added value of the Urban Atlas model is higher for heavy-to-medium storm events dominated by direct runoff. To conclude, the effectiveness of the proposed approach, which aims at improving the accuracy of hydrological simulations in urbanized basins, was supported.

1. Introduction

In the last two decades, several semi-distributed process-based hydrological models were developed to simulate basin runoff of water and nutrients. SWAT (Soil Water Assessment Tool) is one of the most frequently utilized models for runoff analysis from watersheds [1]. INCA (INtegrated CAtchment) is also widely used for simulating runoff of nutrients, driven by hydrological forcing from an external rainfall-runoff model [2,3]. PERSiST (Precipitation, Evapotranspiration and Runoff Simulator for Solute Transport) is a semi-distributed bucket-type rainfall-runoff model developed as an extension of INCA [4]. HBV-NP (Hydrologiska Byråns Vattenbalansavdelning—Nitrogen and Phosphorus) aims at estimating transport, retention and source allocation, and can additionally describe the leakage of water and nutrients through the underground drainage system [5,6]. HYPE (HYdrological Prediction for the Environment) computes integrated outflow of water and nutrients and has been applied up to a continental scale [7,8]. HYPE is highly flexible in the sense that any number and combination of land use types and soil types is supported, thus the model can utilize recent detailed land cover and soil information brought about by technological progress of a geospatial information system, without changing the basic structure of the model. Particularly, it is known that alteration of land use greatly impacts the outflow from river basins, and accurate representation of land use changes is thus important for reliable runoff analysis.
Urbanization is a common type of land use modifications in progress throughout the world, which greatly influences the drainage of water and nutrients [9,10]. Rivers frequently either pass through or close to cities and towns. The presence of these built-up areas may have a notable impact on the hydrograph by producing short-lived flow rate peaks after rainfall events, when storm water runoff is rapidly conveyed to the river. In addition, the impervious area in an urban settlement functions as a non-point source of nutrients, with pollutants deposited on the surface being discharged directly to a recipient without passing through the soils [11]. A proper description of this urban runoff contribution requires first of all an explicit treatment of the urban environment and impervious surfaces, which is accomplished to various degrees in today’s multi-basin models [12].
In order to perform runoff analysis taking the influence of the imperviousness into account, the land-use data should be detailed enough to represent the mosaic of areas with different imperviousness that a city or town comprises. Several previous studies have proposed automated impervious land cover mapping methods on global scale, and the construction of GIS databases including information on imperviousness in built-up areas has also advanced in recent years [13,14]. Development of both hydrological models and GIS data have enabled to better represent the impact of imperviousness on integrated water and nutrients analysis of multiple basins. This simultaneous progress has, to our knowledge, not yet been combined but large-scale land-use data sets with only a broad classification of urban surfaces are typically used, e.g., EEA (European Environment Agency) CORINE [8,15,16,17].
The main objective of this study is to demonstrate the potential gain of using a high-resolution land-use data base specifically designed for urban areas—the EEA Urban Atlas [18]—for simulating the urban runoff response in multi-basin modelling. The multi-basin model used is S-HYPE which is a national set-up for Sweden of the HYPE model [8]. Some preliminary studies of S-HYPE applying Urban Atlas have been conducted [19,20], but these focused only on introduction of the method of imperviousness estimation from Urban Atlas and basic verification of hydrographs. In order to quantitatively demonstrate the adequacy of representing the imperviousness in semi-distributed multi-basin models, evaluations based on synthetic experiments including several meteorological scenarios and numerical indicators were implemented in this paper. Note that analysis and verification of nutrient transport, which is one of the main objectives of the HYPE model, has not been conducted in this study.

2. Materials and Methods

2.1. Study Basin and Hydrological Model

The study basin is the upstream part of the river Sege River in southern Sweden (Figure 1a). Sege River is 40 km long in total and the river mouth is located north of Malmö city. The upstream part considered here has an area of 52 km2 out of which around 56% consists of agricultural land and 27% of forest. In addition, lakes account for 11% of the area and 6% is urbanized. Storm water from the central parts of Svedala town is discharged into Sege River just upstream of a flow rate station named Svedala located in the southern part of town, which has an area of 500 ha and a population of 11,000.
The HYPE model is a dynamic, semi-distributed, process-based, integrated basin-scale model developed by the Swedish Meteorological and Hydrological Institute (SMHI) [7,8,21,22]. In HYPE, the full model domain is divided into sub-basins and each sub-basin is further divided into so-called Soil and Land-use Classes (SLCs) according to soil types and land cover classifications; the SLC is the most fundamental spatial unit of the HYPE model. Each SLC has parameters which characterize hydrological properties such as infiltration, evapotranspiration, and water retention on the surface and in soil. Each SLC can have three soil layers with different thicknesses. For more details, see References [7,23].
In this study, S-HYPE version 2012_2.0.0 was used as a reference model. S-HYPE is a Swedish national set-up of the HYPE model [8]. In S-HYPE, the area of Sweden (~450,000 km2) is divided into almost 38,000 sub-basins; with a median sub-basin size of ~7 km2 which is a very high spatial resolution for a multi-basin model. The sub-basin delineation is obtained from the Swedish Water Archive and the SLCs in each sub-basin are determined as multiple combinations of 13 land-use classes obtained from CORINE and nine soil types obtained from the Soils Database from the Geological Survey of Sweden (SGU). The model is run on a daily time step with gridded meteorological forcing (precipitation and temperature) provided from the PTHBV (Precipitation and Temperature for the HBV model) data base [24]. Model calibration is described in Reference [7].

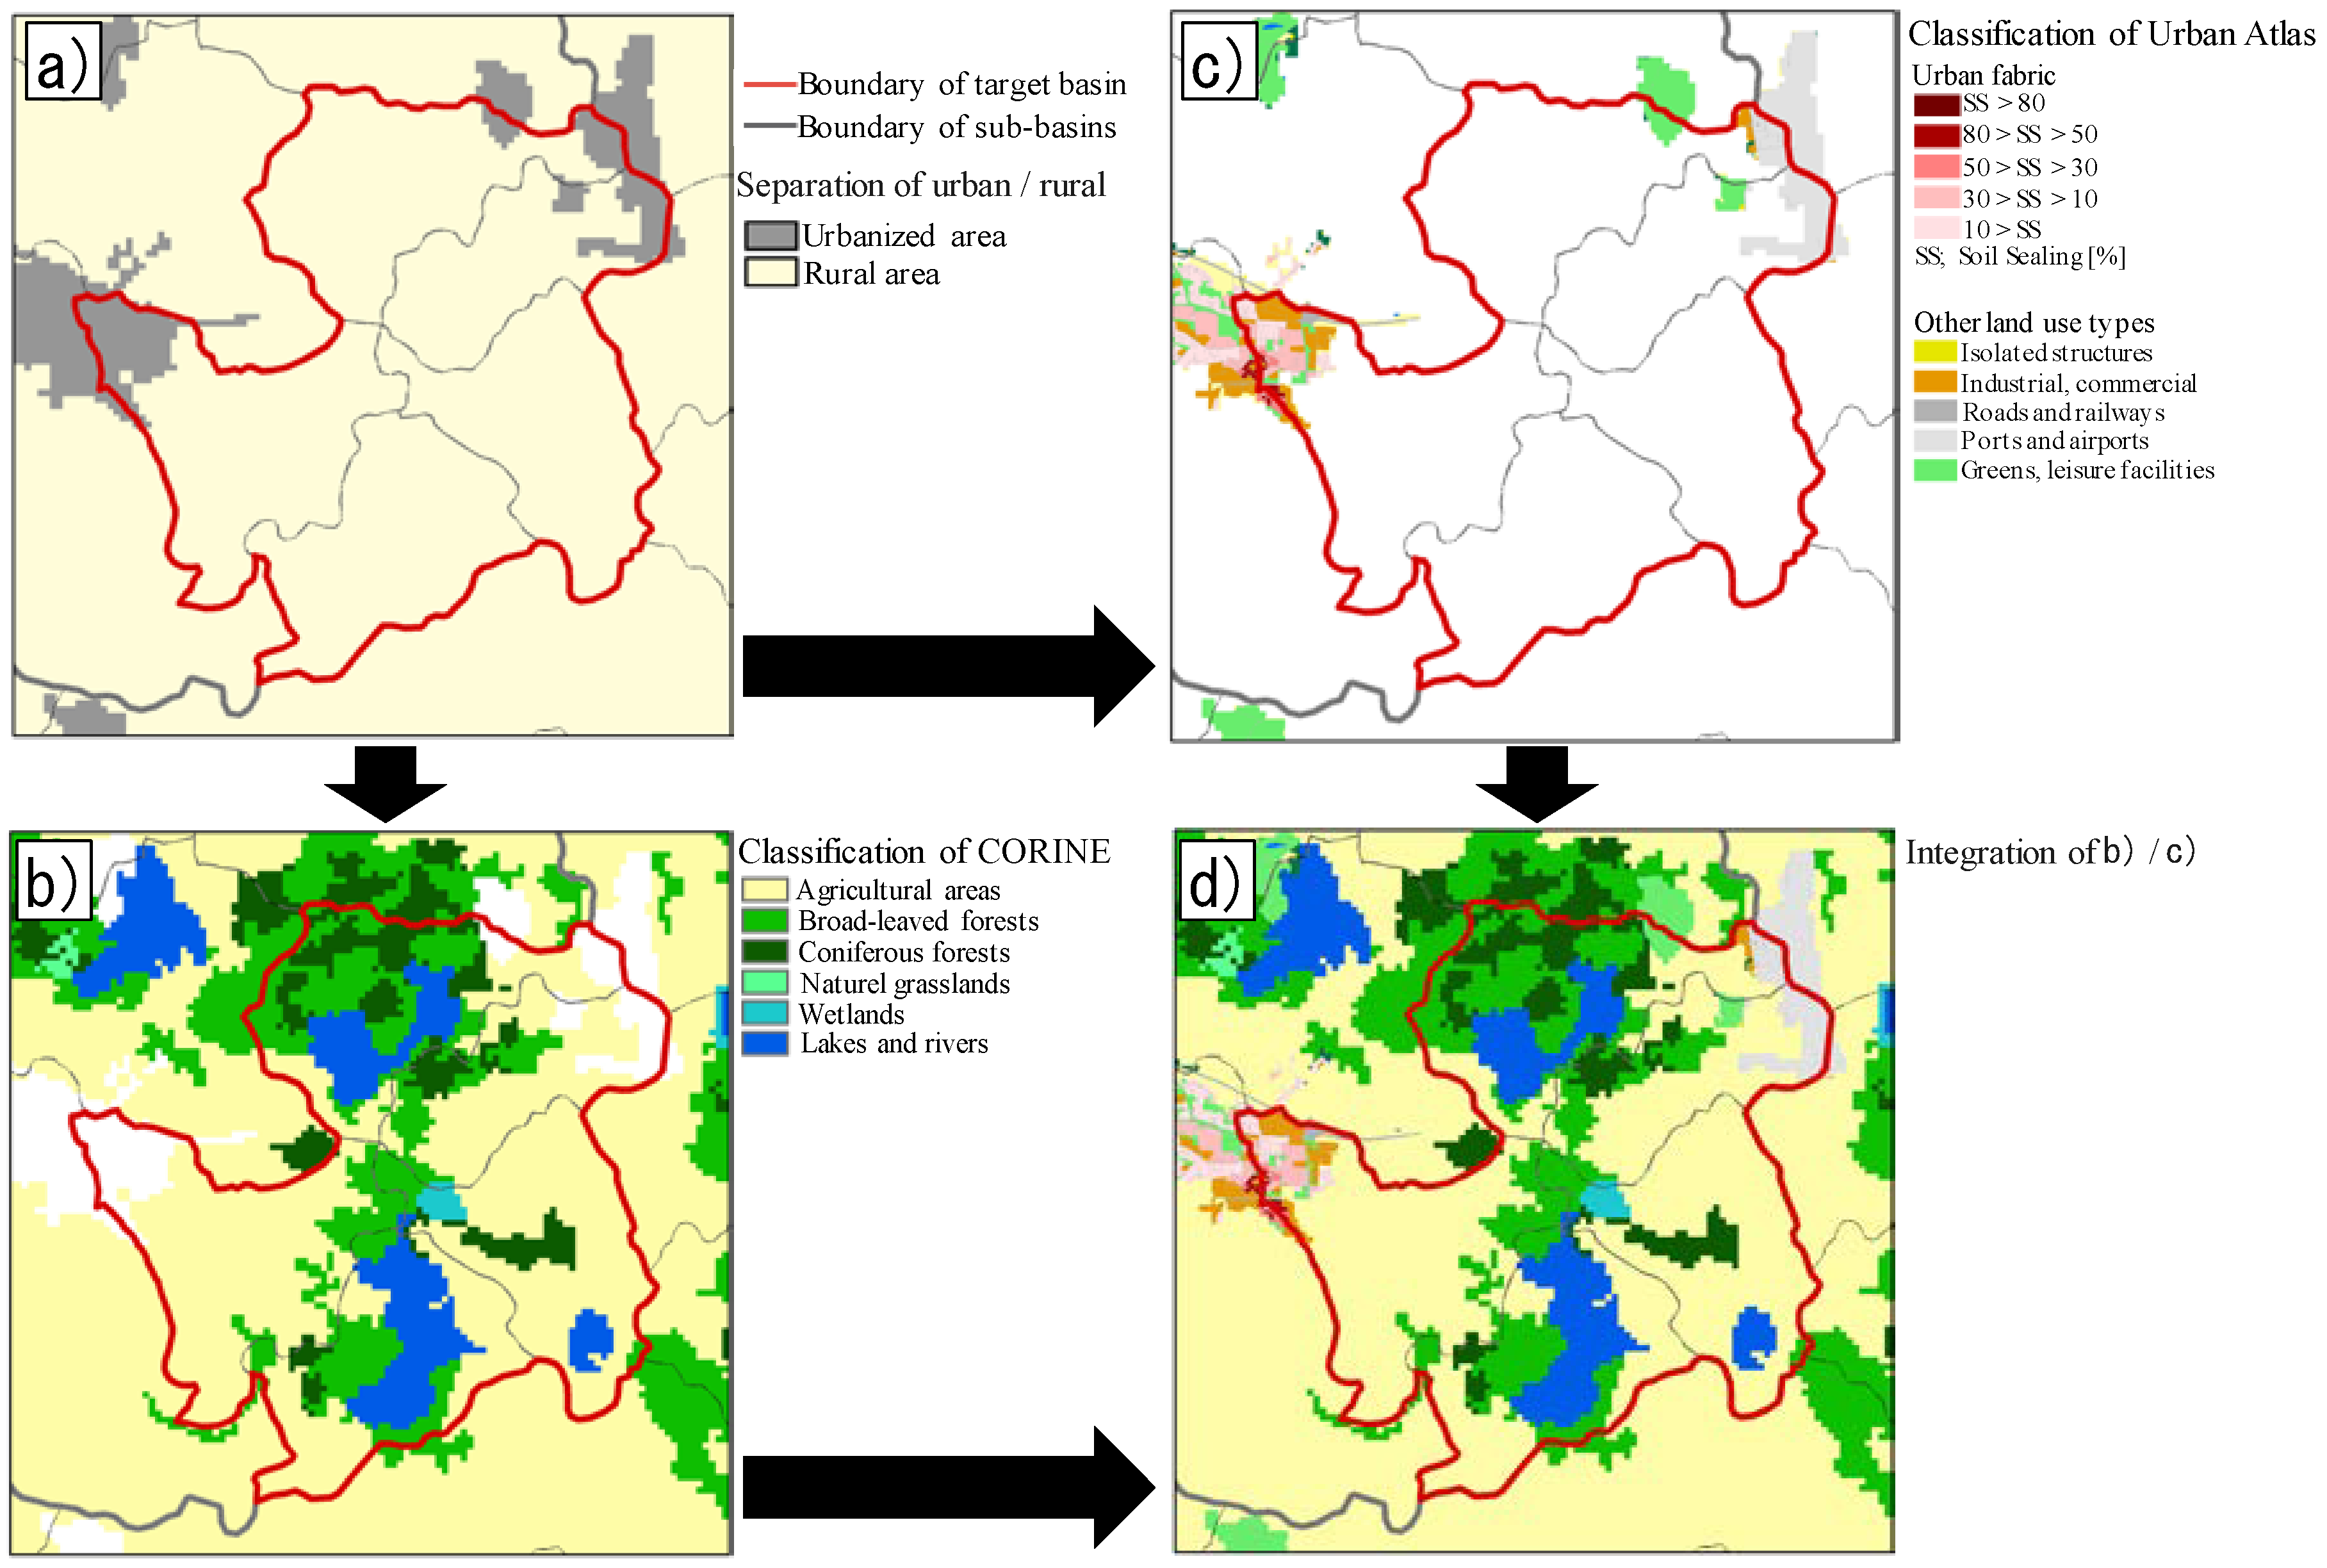
2.2. GIS Process and SLC Set-Up

A widely used land-use data set in multi-basin hydrological modelling is EEA CORINE (e.g., [16,17]). Figure 1a shows the land cover map of the study basin as described by CORINE. CORINE is grid-based with 100 × 100 m2 resolution; the smallest unit mapped is 250,000 m2, which obviously limits the possibility to characterize urban environments. For instance, road networks and residential blocks are fundamental elements of an urbanized area, but they are not represented in CORINE due to its insufficient resolution. In addition, CORINE has only two land-use types representing impervious areas; “continuous urban fabric” and “discontinuous urban fabric”. For example, the entire Svedala town is classified as “discontinuous urban fabric” (Figure 1a) and, therefore, the structure and detailed land use of Svedala town is not described. The range of the impervious area ratio (IAR) of “discontinuous urban fabric” is between 50% to 80%, and there is no representation of areas with IAR below 50%. Because of these properties, CORINE is insufficient for accurately expressing urban imperviousness.
Another land-use data set, specifically designed for urban environments, is the EEA Urban Atlas (UA) [18]. Figure 1b shows UA around the centre of Svedala. UA covers 305 regions with over 100,000 inhabitants in Europe. Land-use elements are described by polygons; the smallest unit mapped is 2500 m2 (i.e., 100 times more spatially detailed than the CORINE data). In UA, residential districts (“Urban Fabric”) have IAR provided by EEA Fast Track Sealing Layer (EEA FTS), and IAR of EEA FTS is calculated based on calibrated Normalized Difference Vegetation Index (NDVI) [25]. This makes it possible to assign a specific percentage of imperviousness to each land-use element by assuming averages of soil sealing (SS) as IAR (e.g., IAR of elements with 50% < SS < 80% was 65%), which should be highly significant for estimating runoff response. Figure 1b shows how Svedala town in UA comprises a wide range of land-uses with various degree of imperviousness.
One shortcoming of UA is that it is only available in urbanized regions and Figure 2 shows the areas in Europe covered by UA. The main objective for developing UA is to promote environmental studies in urbanized regions; therefore, rural and wild regions outside cities are not mapped in UA (e.g., the majority of the area of Sweden is outside the coverage of UA). One approach to improve the description of land-use information, including imperviousness, in multi-basin hydrological modelling, is to model urbanized regions and rural/wild areas separately by UA and CORINE, respectively. This requires a method to combine UA and CORINE, and the approach we propose in this study is described in the following.
Figure 3 illustrates the workflow of land-cover data processing used in this study. As a first step, UA and CORINE data covering the study basin were prepared as GIS layers. Then urbanized areas and rural areas in the study basin were separated by using CORINE (Figure 3a). Concretely, areas classified as continuous urban fabric, discontinuous urban fabric, industrial and commercial, roads and railways, and ports and airports in CORINE were categorized as urbanized, and the others as rural. The rural area was classified into six types of land cover by using CORINE (Figure 3b), and the urbanized area was classified into four types of land cover by using UA (Figure 3c). Finally, CORINE data in the rural area and UA data in the urbanized area were combined (Figure 3d), and the appropriate IAR of each land cover was set as a property of the combined GIS data. For instance, all land-use types in the rural area classified by CORINE as wetlands (Figure 1a) and all land-use types in the urbanized area classified by UA as isolated structure, vacant lots, greens and leisure facilities (Figure 1b) were given IAR = 0%, whereas industrial, commercial, roads and railways, and ports and airports were given IAR = 100%. Finally, the IAR in each classification of urban fabric was assigned the median value of the SS in this study.
Hydrological characteristics of soil are also essential for hydrological modelling. Figure 4 shows a schematic of the hydrological characteristics of pervious and impervious land surfaces. In impervious areas, the pavement can be considered to have a small porosity, low evapotranspiration and little soil layer interflow; these characteristics are substantially different from the properties of natural, pervious surfaces. However, existing applications of HYPE around the world have ignored the effect of imperviousness on runoff characteristics because of a lack of impervious distribution information (e.g., Reference [7,8,21,22]). Therefore, an “impervious” soil type was introduced in this study and used only for impervious land-cover elements. Soil types for pervious land-cover elements were set based on the SGU soil database as in S-HYPE (Section 2.2).
Table 1 shows the IAR values of each SLC calculated by the proposed method in the Sege River basin. Here, the IAR of the study basin was estimated from UA by summing up all impervious areas. It is shown that the urbanized area ratio was 5.7% and the IAR 2.6%, reflecting that the study basin is predominantly rural (Section 2.1).
The upstream part of Sege River is composed of five sub-basins in S-HYPE (Figure 1a). As land-use in this model set-up is defined only by CORINE (Section 2.1), we denote this sub-model HYPECOR. Although the hydrological characteristics of urbanized areas are strongly influenced by imperviousness, the reference S-HYPE based on CORINE does not include any impervious SLC due to the lack of detailed imperviousness information in CORINE. In an alternative sub-model, the CORINE land-use in Svedala town (Figure 1a) was replaced by UA (Figure 1b) and the HYPE SLCs changed accordingly. This model is hereafter denoted HYPEUA.
Note that land-use and soil information used in the HYPE model set-up in this study are exactly the same as in the reference set-up [8]. Any difference in simulated flow rate between HYPEUA and HYPECOR is thus caused by the difference in hydrological characteristics in the small urbanized area.

2.3. Experimental Set-Up and Evaluation

In order to evaluate the performance of HYPEUA and its difference from HYPECOR under controlled conditions, runoff analysis using synthetic rainfall events was firstly carried out. In this evaluation, six types of synthetic rainfall events were used as inputs of HYPEUA and HYPECOR. Each synthetic rainfall included a leading 1.5 years as a spin-up period, during which daily precipitation from the PTHBV data base during 1 January 2000 to 31 May 2001 in each sub-basin was utilized as a precipitation input. After the spin-up period, different versions of a synthetic 30-day rainfall hyetograph were constructed consisting of 5 rainy days surrounded by dry periods. An initial 10-day dry period was used in order to reduce the influence of the weather in the spin-up period. After a rainy 5-day period, 15 dry days were included. Concerning the central rainy 5-day sequence, in events 1 and 2, the rainfall peak occurs on the first day, followed by a gradually decreasing rainfall intensity. In events 3 and 4, the peak occurs on the central rainy day. In events 5 and 6, the peak occurs on the final rainy day. The amount of rainfall on the peak day was 50 mm/day in events 1, 3 and 5, which is about the same amount as the annual maximum daily precipitation in the study basin (these hyetographs were included in Figure 5). In events 2, 4 and 6, the storm was less intense, with peak rainfalls of 20 mm/day. The temperature in all experiments was the one provided by PTHBV from 1 January 2000 to 30 June 2006 in each sub-basin.
Following the synthetic experiments, simulations with actual weather in a real-world experiment were conducted. Simulations with both sub-models were performed over the period 1 January 2000 to 31 December 2013, where the first year was used for model spin-up and the last 13 years were used for performance evaluation. The meteorological forcing was obtained from the PTHBV data base (Section 2.2). Model performance was evaluated in terms of two common metrics: relative bias in mean flow rate PBIAS and Nash-Sutcliffe Efficiency NSE [26]:
P B I A S = 100   ( ( Q s i m ¯ Q o b s ¯ ) Q o b s ¯ )
N S E = 1 t = 1 T ( Q o b s t Q s i m t ) 2 t = 1 T ( Q o b s t Q o b s ¯ ) 2
where t denotes the time step, T the total number of time steps, and Qobs and Qsim observed and simulated flow rate, respectively (overbar denotes mean value over the T time steps).
In several previous studies, flow duration curves (FDC) have been suggested as an alternative to time series analysis (e.g., References [27,28]). In this approach, multiple hydrological signature measures related to high, medium and low flow rates are used to quantify model performance. Here we adopt three signature measures; FDC midsegment slope in log scale (FMS), FDC high-segment volume (FHV) and a log scale index of FDC low-segment volume (FLV):
F M S = log ( Q m 1 ) log ( Q m 2 )
F H V h 0 , H = h = h 0 H Q h
F L V = 1 × l = 1 L [ log ( Q l ) log ( Q L ) ]
where m1 and m2 in Equation (3) are the smallest and largest exceedance probabilities within the midsegment of the FDC (0.2 and 0.7 in this research), and Qm1 and Qm2 are the corresponding flow rates. Parameters h0 and H in Equation (4) are the limits of the probability range used in the high-segment analysis. In previous studies, h0 = 0.0 and H = 0.02 have been suggested [27,28]. Here we use several h0/H combinations in order to evaluate not only the largest flow rate but also medium-to-high flow rates caused by minor storm events. The specific h0/H combinations in this study are 0.0/0.02, 0.02/0.1, 0.1/0.2, 0.2/0.3, 0.3/0.4, and 0.4/0.5. L in Equation (5) denotes the index of the smallest flow rate in the study period, and l = 1, 2, …, L in Equation (5) are the flow indices located within the low-flow segment (0.7–1.0 flow exceedance probabilities). Note that FLV indicates the tendency of the flow rate to decrease with an increase in exceedance probability rather than indicating an absolute low flow rate because the minimum flow rate is substracted in Equation (5).

3. Results

3.1. The Impervious SLC

In order to make optimal use of the UA data, an impervious SLC which was a soil-landuse classification expressing impervious land cover properties was developed, and the relevant HYPE parameters were identified by trial and error. The final impervious SLC was characterized by a thin (0.1 m) impervious upper soil layer and adjusted values of 10 HYPE parameters (Table 2). Effectively, the modifications resulted in a hydrological response that is characteristic of urban areas as compared with rural land, such as less evapotranspiration, higher surface runoff, zero macropore flow, less percolation and lower water holding capacity of the upper soil layer (e.g., References [9,10,29,30]).

3.2. Synthetic Experiments

Figure 5 shows each synthetic rainfall (SR) hyetograph and the corresponding hydrographs obtained from HYPECOR and HYPEUA simulations. Under high-intensity conditions (events 1, 3 and 5), although the peak flow rate level is similar for HYPEUA and HYPECOR, respectively, the response is much faster in HYPEUA, with flow rate increasing right after the start of the rainfall. Flow rate calculated by HYPECOR, on the other hand, rises much more slowly than HYPEUA in each case. This reflects that the discharge from an urbanized basin is generally faster than the one from a rural basin because of larger surface runoff (Figure 4). It may therefore be inferred that HYPEUA is able to describe the hydrological characteristics of an urbanized basin more realistically than HYPECOR. The same conclusion could be obtained by comparing the results for the low-intensity events (events 2, 4 and 6). The flow rate in HYPEUA clearly increased even when the amount of rainfall was small; this tendency was not apparent in HYPECOR. Urbanization often leads to an increase in impervious areas, lowering the ability to penetrate soil, causing a decrease in water retention in the basin [10]. Due to the lack of water-retaining capacity of an urbanized basin, it is expected that storm runoff generates some flow rate peak even if the scale of the storm is small. Overall, it is indicated that HYPEUA is able to describe storm runoff in a more realistic way than HYPECOR, regardless of scale or type of storm. It should, however, be noted that these results were obtained by using SRs. In the next section, verification by comparing simulations of various actual storm events and observed flow rate is performed in order to further evaluate the performance of the suggested approach.

3.3. Real-World Simulations

Observed and simulated flow rate in the Svedala station are shown in Figure 6. In order to clearly visualize the seasonal and monthly variability of flow rate, only 4 years (1 January 2010 to–31 December 2013) are shown in Figure 6a. On the annual scale, a rather distinct cycle may be seen in the observations, with extended high-flow periods during winter and lower flows in summer (Figure 6a). Also in summer, extended high-flow periods may occur after long periods with rain (e.g., 2011), however, in comparatively dry summers, only very minor flow rate peaks are formed (e.g., 2012). At this multi-annual scale, the results from HYPECOR and HYPEUA are visibly very similar and both well represent the overall variations. If zooming in on the summer season, however, distinct differences between the models emerge (Figure 6b). In 2013, three rainfall events generated sudden peaks which are conceivably highly influenced by storm runoff from Svedala town. In HYPECOR, these peaks are only weakly indicated in the hydrograph and the observed peak levels are greatly underestimated. HYPEUA, however, attains a substantially better reproduction of the peaks, which clearly illustrates the importance of detailed land-use data for estimating the urban runoff contribution.
The numerical evaluation is shown in Table 3. The overall good performance of the models over the full period indicated in Figure 6a is evidenced by an NSE of ~0.84 in both models. The advantage of HYPEUA, however, emerges when considering only days with significant rainfall. For this purpose, the evaluation metrics were calculated using only days when the rainfall amount R was in a specific interval (days with precipitation in the form of snow were excluded in this analysis). The results show that HYPECOR substantially underestimates the flow rate for these days, to an increasing degree with increasing rainfall amounts (Table 3). HYPEUA, on the other hand, generally overestimates the flow rate but to a much smaller degree. If averaging over all R-intervals in Table 3 except R = 0 mm (dry days), PBIAS becomes -25% for HYPECOR and +10% for HYPEUA; in absolute terms, the “rainy day bias” is thus reduced by ~60% in HYPEUA. In terms of NSE, no significant differences between HYPEUA and HYPECOR were indicated for low-intensity events (daily precipitation < 10 mm). However, NSE of HYPEUA were clearly higher than that of HYPECOR for high-intensity events (daily precipitation >10 mm), and this tendency becomes stronger with increasing amounts of daily precipitation. These results showed that HYPEUA reduces the tendency of HYPECOR to underestimate the flow rate. The results are also consistent with the general characteristics that as the impervious area increases, the peak flow rate increases.

3.4. Model Verification using Flow Duration Curves

Figure 7 shows the flow duration curves calculated from observations and from the HYPECOR and HYPEUA simulations, and Table 4 shows the corresponding FMS, FHV and FLV values. Although the FDC of HYPEUA is overall similar to the FDC of HYPECOR (Figure 7), HYPEUA tends to systematically overestimate low-to-medium flow rate (0.6-1.0 flow exceedance probabilities). Because of this overestimation, the FMS of HYPEUA was smaller than the observed FMS and the negative bias is more than two times that of HYPECOR.
Concerning high flows, the FVH values of HYPECOR are consistently smaller than the observed FHVs, indicating an underestimated flow rate. Also, HYPEUA tends to underestimate the highest flows (h0/H between 0.00/0.02 and 0.20/0.30), but to a lesser degree. For h0/H 0.30/0.40 and 0.40/0.50, HYPEUA marginally overestimates the observed FHV. This suggests a better perfomance of HYPEUA than HYPECOR for high-to-medium flow rates caused by minor storm events. These results are overall consistent with the results from the synthetic rainfall experiments (Section 3.2), e.g., that absolute values of peak flows driven by heavy rainfall were nearly identical for HYPEUA and HYPECOR (Figure 5). The reason why the difference in land use does not greatly affect the high flows is conceivably that under these circumstances, permeability will decline regardless of land use due to saturation. On the contrary, with moderate rainfall there is a stronger influence of soil permeability, and the difference in pervious characteristics of the ground surface has a larger influence on the resulting flow rate.
Finally, we compare the FLV values in order to evaluate model performances during low-flow conditions. The bias of FLV calculated by HYPEUA is −11%, which is five percentage points smaller than the bias of HYPECOR. The flow rate of HYPECOR during low flows, especially for exceedance probabilities above 0.85 (Figure 7), tends to be smaller than the observation. In HYPEUA, the evapotranspiration from urban soil is reduced by the impervious land use; therefore, the decrease in flow rate with increasing exceedance probability becomes moderate. It is consequently inferred that the value of FLV in HYPEUA agrees better with the observated FLV. On one hand, this result is in some conflict with several studies indicating that an increase of impervious area due to urbanization leads to a reduced flow rate during drought e.g., Reference [31]. On the other hand, some other studies have found that urbanization does not result in a decline of base flow [32]. It is thus difficult to judge the validity of HYPEUA during low-flow and drought conditions only by this case study, and further evaluation in other urbanized basins is needed.

4. Concluding Remarks

In summary, we have demonstrated how the EEA Urban Atlas can be applied for runoff simulation in urban areas. Firstly, we introduced a method of multi-basin modelling combining the Urban Atlas with the EEA CORINE Land Cover in order to overcome the fact that the Urban Atlas is available only in urban areas. Then the impacts of imperviousness in urbanized areas in multi-basin modelling was assessed using the HYPE model as an example. We conducted four runoff response analyses involving both synthetic and actual rainfall input, and compared results from including Urban Atlas with results based only on CORINE. The results indicated that the Urban Atlas model estimated flow rate more accurately than the CORINE model during high-to-medium flow conditions. These results generally confirmed the significance of accurately describing imperviousness in semi-distributed hydrological modelling by detailed GIS data and, in particular, highlighted the critical importance of capturing the response to heavy-to-moderate rainfall events. Further, a better description of urban runoff contributions is likely even more significant in other more populated parts of the world, with larger and often denser cities.
Finally, we stress the limitations of this research and discuss some remaining future issues. It should be emphasized that this was a limited case study of assessing the impact of imperviousness on the accuracy of runoff prediction, using one of the very few flow rate stations in Sweden with a clear urban signal. This is a clear limitation for the development of better descriptions of the urban hydrology in a multi-basin context, and installing more stations in urban or semi-urban environments is an important future task. In addition, in order to more substantially demonstrate the added value of detailed land cover data including impervious information such as the Urban Atlas, it is necessary to perform more similar experiments in multiple river basins including urbanized areas. A possible limitation of the proposed approach based on the Urban Atlas was indicated during low-flow conditions, when the observed flow was overestimated. Further work is needed to investigate whether this is a systematic issue and, if so, how the approach can be improved in this respect. A final remark concerns the modelling time step. The added value of accurate land-use data will likely be even higher when using shorter time steps than the daily that was used in this study, and this assessment is an important future task.

Author Contributions

Conceptualization, A.K., H.A., J.O. and G.L.; methodology, all authors; software, G.L. and J.O.; validation, H.T. and J.O.; formal analysis, investigation, data curation and resources, H.T.; writing—original draft preparation, H.T and J.O..; writing—review and editing, H.T and J.O.; visualization, H.T.; supervision, A.K., H.A. and G.L.

Funding

We gratefully acknowledge financial support from Tokyo Metropolitan University, that allowed the first author to spend a period as guest researcher at SMHI, as well as from the Swedish Research Council Formas through the EC Water JPI programme (MUFFIN project).

Acknowledgments

Two reviewers provided helpful comments on the original manuscript.

Conflicts of Interest

The authors declare no conflict of interest.

References

  1. Arnold, J.G.; Srinivasin, R.; Muttiah, R.S.; Williams, J.R. Large area hydrologic modeling and assessment: Part I. Model development. JAWRA 1998, 34, 73–89. [Google Scholar] [CrossRef]
  2. Whitehead, P.G.; Wilson, E.J.; Butterfield, D. A semi-distributed integrated nitrogen model for multiple source assessment in catchments (INCA): Part I - Model structure and process equations. Sci. Total Environ. 1998, 210, 547–558. [Google Scholar] [CrossRef]
  3. Wade, A.J.; Durand, P.; Beaujouan, V.; Wessel, W.W.; Raat, K.J.; Whitehead, P.G.; Butterfield, D.; Rankinen, K.; Lepistö, A. A nitrogen model for European catchments: INCA, new model structure and equations. Hydrol. Earth Syst. Sci. 2002, 6, 559–582. [Google Scholar] [CrossRef] [Green Version]
  4. Futter, N.M.; Erlandsson, M.A.; Butterfield, D.; Whitehead, P.G.; Oni, S.K.; Wade, A.J. PERSiST: A flexible rainfall-runoff modelling toolkit for use with the INCA family of models. Hydrol. Earth Syst. Sci. 2014, 18, 855–873. [Google Scholar] [CrossRef]
  5. Bergström, S. The HBV model. In Computer Models of Watershed Hydrology; Singh, V., Ed.; Water Resources Publications: Highlands Ranch, CO, USA, 1995; pp. 443–476. [Google Scholar]
  6. Andersson, L.; Rosberg, J.; Pers, C.B.; Olsson, J.; Arheimer, B. Estimating catchment nutrient flow with the HBV-NP Model: Sensitivity to input data, AMBIO. J. Hum. Environ. 2005, 34, 521–532. [Google Scholar] [CrossRef]
  7. Lindström, G.; Pers, C.; Rosberg, J.; Strömqvist, J.; Arheimer, B. Development and test of the HYPE (Hydrological Predictions for the Environment) model—A water quality model for different spatial scales. Hydrol. Res. 2010, 41, 295–319. [Google Scholar] [CrossRef]
  8. Strömqvist, J.; Arheimer, B.; Dahné, J.; Donnelly, C.; Lindström, G. Water and nutrient predictions in ungauged basins: Set-up and evaluation of a model at the national scale. Hydrol. Sci. J. 2012, 57, 229–247. [Google Scholar] [CrossRef]
  9. Leopold, L.B. Hydrology for Urban Land Planning—A Guidebook on the Hydrologic Effects of Urban Land Use. Geol. Surv. Circular 1968, 554, 1–18. [Google Scholar]
  10. Zelenáková, M.; Diaconub, D.C.; Haarstadc, K. Urban water retention measures, structural and physical aspects of construction engineering. Procedia Eng. 2017, 190, 419–426. [Google Scholar] [CrossRef]
  11. Jartun, M.; Ottesen, R.T.; Steinnes, E.; Volden, T. Runoff of particle bound pollutants from urban impervious surfaces studied by analysis of sediments from stormwater traps. Sci. Total Environ. 2008, 396, 147–163. [Google Scholar] [CrossRef]
  12. Van der Knijff, J.M.; Younis, J.; De Roo, A.P.J. LISFLOOD: A GIS-based distributed model for river basin scale water balance and flood simulation. Int. J. Geogr. Inf. Sci. 2008, 24, 1–24. [Google Scholar] [CrossRef]
  13. Elvidge, C.D.; Tuttle, B.T.; Sutton, P.C.; Baugh, K.E.; Howard, A.T.; Milesi, C.; Bhaduri, B.L.; Nemani, R. Global distribution and density of constructed impervious surfaces. Sensors 2007, 7, 1962–1979. [Google Scholar] [CrossRef]
  14. Chen, J.; Chen, J.; Liao, A.; Cao, X.; Chen, L.; Chen, X.; He, C.; Han, G.; Peng, S.; Lu, M.; et al. Global land cover mapping at 30 m resolution: A POK-based operational approach. ISPRS J. Photogramm. Remote Sens. 2017, 103, 7–27. [Google Scholar] [CrossRef]
  15. European Environment Agency (EEA). CORINE Land Cover. 2014. Available online: http://www.eea.europa.eu/publications/COR0-landcover/ (accessed on 11 July 2016).
  16. Grillakis, M.G.; Tsanis, I.K.; Koutroulis, A.G. Application of the HBV hydrological model in a flash flood case in Slovenia. Nat. Hazards Earth Syst. Sci. 2010, 10, 2713–2725. [Google Scholar] [CrossRef] [Green Version]
  17. Panagopoulosa, Y.; Makropoulosa, C.; Baltasb, E.; Mimikoua, M. SWAT parameterization for the identification of critical diffuse pollution source areas under data limitations. Ecol. Model. 2011, 222, 3500–3512. [Google Scholar] [CrossRef]
  18. European Environment Agency (EEA). Urban Atlas. 2010. Available online: http://www.eea.europa.eu/data-and-maps/data/urban-atlas/ (accessed on 11 July 2016).
  19. Tanouchi, H.; Kawamura, A.; Amaguchi, H.; Olsson, J. Study on a precision improvement of runoff prediction by hype model using polygonal impervious area ratio data in an urbanized area. Ann. J. Hydraul. Eng. JSCE 2016, 72, I_427–I_432. (In Japanese) [Google Scholar]
  20. Tanouchi, H.; Kawamura, A.; Amaguchi, H.; Olsson, J. A study on hype model application considering impervious surface in urbanized watershed. J. Jpn. Soc. Civil Eng. Ser. G (Environ. Res.) 2016, 72, I_21–I_26. (In Japanese) [Google Scholar]
  21. Pechlivanidis, I.G.; Arheimer, B. Large-scale hydrological modelling by using modified PUB recommendations: the India-HYPE case. Hydrol. Earth Syst. Sci. 2015, 19, 4559–4579. [Google Scholar] [CrossRef] [Green Version]
  22. Hundecha, Y.; Arheimer, B.; Donnelly, C.; Pechlivanidis, I. A regional parameter estimation scheme for a pan-European multi-basin model. J. Hydrol. Reg. Stud. 2016, 6, 90–111. [Google Scholar] [CrossRef] [Green Version]
  23. Swedish Meteorological and Hydrological Institute (SMHI). HYPE Wiki. 2016. Available online: http://www.smhi.net/hype/wiki/doku.php (accessed on 11 July 2016).
  24. Johansson, B. Estimation of Areal Precipitation for Hydrological Modeling in Sweden. Ph.D. Thesis, Earth Science Center, Department of Physical Geography, Göteborg University, Göteborg, Sweden, 2002. [Google Scholar]
  25. European Environment Agency (EEA). EEA Fast Track Service Precursor on Land Monitoring—Degree of soil sealing. 2019. Available online: https://www.eea.europa.eu/data-and-maps/data/eea-fast-track-service-precursor-on-land-monitoring-degree-of-soil-sealing-100m (accessed on 19 March 2019).
  26. Nash, J.E.; Sutcliffe, J.V. River flow forecasting through conceptual models Part I—A discussion of principles. J. Hydrol. 1970, 10, 282–290. [Google Scholar] [CrossRef]
  27. Yilmaz, K.K.; Gupta, H.V.; Wagener, T. A process-based diagnostic approach to model evaluation: Application to the NWS distributed hydrologic model. Water Resour. Res. 2008, 44, W09417. [Google Scholar] [CrossRef]
  28. Shafii, M.; Tolson, B.A. Optimizing hydrological consistency by incorporating hydrological signatures into model calibration objectives. Water Resour. Res. 2015, 5, 3796–3814. [Google Scholar] [CrossRef]
  29. Shuster, D.W.; Bonta, J.; Thurston, H.; Warnemuende, E.; Smith, R.D. Impacts of impervious surface on watershed hydrology: A review. Urban Water J. 2005, 2, 263–275. [Google Scholar] [CrossRef]
  30. Cuo, L.; Lettenmaier, D.P.; Mattheussen, B.V.; Storck, P.; Wiley, M. Hydrologic prediction for urban watersheds with the Distributed Hydrology-Soil-Vegetation Model. Hydrol. Process. 2008, 22, 4205–4213. [Google Scholar] [CrossRef]
  31. Zhou, F.; Xu, Y.; Chen, Y.L.; Xu, C.Y.; Gao, Y.; Du, J. Hydrological response to urbanization at different spatio-temporal scales simulated by coupling of CLUE-S and the SWAT model in the Yangtze River Delta region. J. Hydrol. 2013, 485, 113–125. [Google Scholar] [CrossRef]
  32. Brandes, D.; Cavallo, G.J.; Nilson, M.L. Base flow trends in urbanizing watersheds of the delaware river basin. JAWRA 2007, 44, 1377–1391. [Google Scholar] [CrossRef]
Figure 1. (a) The upstream part of Sege Å river basin (red line) and location of the discharge station outside Svedala town (green dot). The land-use is from EEA CORINE. (b) A blow-up of Svedala town with land-use from EEA Urban Atlas. *Lakes and rivers were obtained from the Swedish Water Archive (SVAR).
Hydrology 06 00028 g001
Figure 2. Coverages of EEA Urban Atlas in Europe. Red masked area shows the coverages of EEA Urban Atlas 2006 [18].
Hydrology 06 00028 g002
Figure 3. Procedure of land use data set-up by using EEA CORINE and EEA Urban Atlas. (a) Firstly, urban and rural areas in the study basin were separated. Here, the urban related land use classifications (continuous urban fabric, discontinuous urban fabric, Industrial, commercial, Green, leisure facilities, roads, railways, ports, and airports) in CORINE are merged into urbanized area, and the other land use classifications are integrated as rural area. (b) Rural area was classified by CORINE land use classifications. (c) Internal urbanized area was classified by Urban atlas. (d) Finally, Land surface data for HYPE modelling was constructed by integration of (b) and (c).
Hydrology 06 00028 g003
Figure 4. Hydrological characteristics of pervious and impervious surfaces, respectively.
Hydrology 06 00028 g004
Figure 5. Daily synthetic rainfall (PCase1~PCase6) and calculated discharges simulated by HYPECOR and HYPEUA by using each SR (HYPECOR1~HYPECOR6, HYPEUA1~HYPEUA6). Details of SRs were described in Section 2.3.
Hydrology 06 00028 g005
Figure 6. Time series of observed precipitation (Pobs), discharge (Qobs) and discharge simulated by models HYPECOR and HYPEUA during periods 2010–2013 (a) and July–September 2013 (b).
Hydrology 06 00028 g006
Figure 7. Flow duration curves calculated from observed flow rate, HYPECOR flow rate and HYPEUA flow rate.
Hydrology 06 00028 g007
Table 1. Area ratios of each SLC calculated by using UA in Sege River basin [%].
Soil typesTotal
ClaySandyCoarsePeatMoraineImperviousWater
Land use typesRural AreaLake0.00.00.00.00.00.011.011.094.3
Marsh0.00.00.00.00.00.00.60.6
Wetland0.00.00.00.00.00.00.00.0
Broadleaf forest2.80.00.43.99.80.00.017.5
Conifer forest0.40.00.03.25.10.00.09.0
Farmland15.10.73.96.129.60.00.056.2
Urbanized areaImpervious area0.00.00.00.00.02.60.02.65.7
Pervious area0.30.00.00.12.50.00.02.9
Green land0.00.00.00.00.10.00.00.1
Grass/parks0.10.00.00.00.00.00.00.1
Total19.40.74.814.449.72.610.9100.0
Table 2. HYPE parameters that were adjusted in the impervious land use characteristic (impervious SLC). New parameters for impervious SLC (HYPEUA) and existing parameters for urbanized SLC(HYPECOR) are shown for comparison. * Parameters for the uppermost soil layer.
ParameterDependenceUnitImpervious SLC in HYPEUAUrbanized SLC in HYPECORDescription
cevpland usemm/degree/h0.002080.00728Evapotranspiration parameter
rrcs1soil/h0.0004170.025Recession coefficient *
srratesoil-0.90.01Fraction surface runoff of rainfall above infiltration threshold
macratesoil-00.3Fraction macro-pore flow of rainfall above infiltration threshold
mactrinfsoilmm/h0.250.83Infiltration threshold for macro-pore flow and surface flow
mactrsmsoil-00.8Threshold fraction of soil water for macro-pore flow and surface runoff
mperc1soilmm/h0.02084.17Maximum percolation capacity from soil layer 1 to soil layer 2
mperc2soilmm/h0.2084.17Maximum percolation capacity from soil layer 2 to soil layer 3
wcep1soil-0.0050.03Effective porosity as a fraction *
wcfc1soil-0.020.08Fraction of soil water available for evapotranspiration but not for runoff *
Table 3. Model performance calculated for the period from 1 January 2001 to 31 December 2013.
The Number of Time Steps IncludedPBIAS (%)NSE (-)
HYPECORHYPEUAHYPECORHYPEUA
Full period4127−10.8−3.70.840.84
R = 0 mm1630−4.8−1.60.860.86
0 < R < 5 mm1837−11.5−7.10.840.83
5 < R < 10 mm362−15.1−2.80.850.85
10 < R < 15 mm185−19.21.60.800.84
15 < R < 20 mm64−24.96.10.760.82
20 < R < 25 mm23−29.516.50.720.77
25 < R < 30 mm11−26.633.4−0.200.74
R > 30 mm15−45.421.40.470.73
Table 4. Indices related to low, medium and high flow exceedance probability in the FDC.
IndicesValueBias[%]
QobsHYPECORHYPEUAHYPECORHYPEUA
FMS0.7730.7110.618−8.1−20.0
FHV192.1166.9166.8−13.1−13.2
FHV466.1411.4417.3−11.7−10.5
FHV384.1350.2357.3−8.8−7.0
FHV266.9254.2262.5−4.8−1.7
FHV195.4188.9198.7−3.31.7
FHV144.7134.0147.6−7.42.0
FLV−803.6−929.7−891.615.710.9

