Determination of the Probabilities of Landslide Events—A Case Study of Bhutan


Abstract
1. Introduction
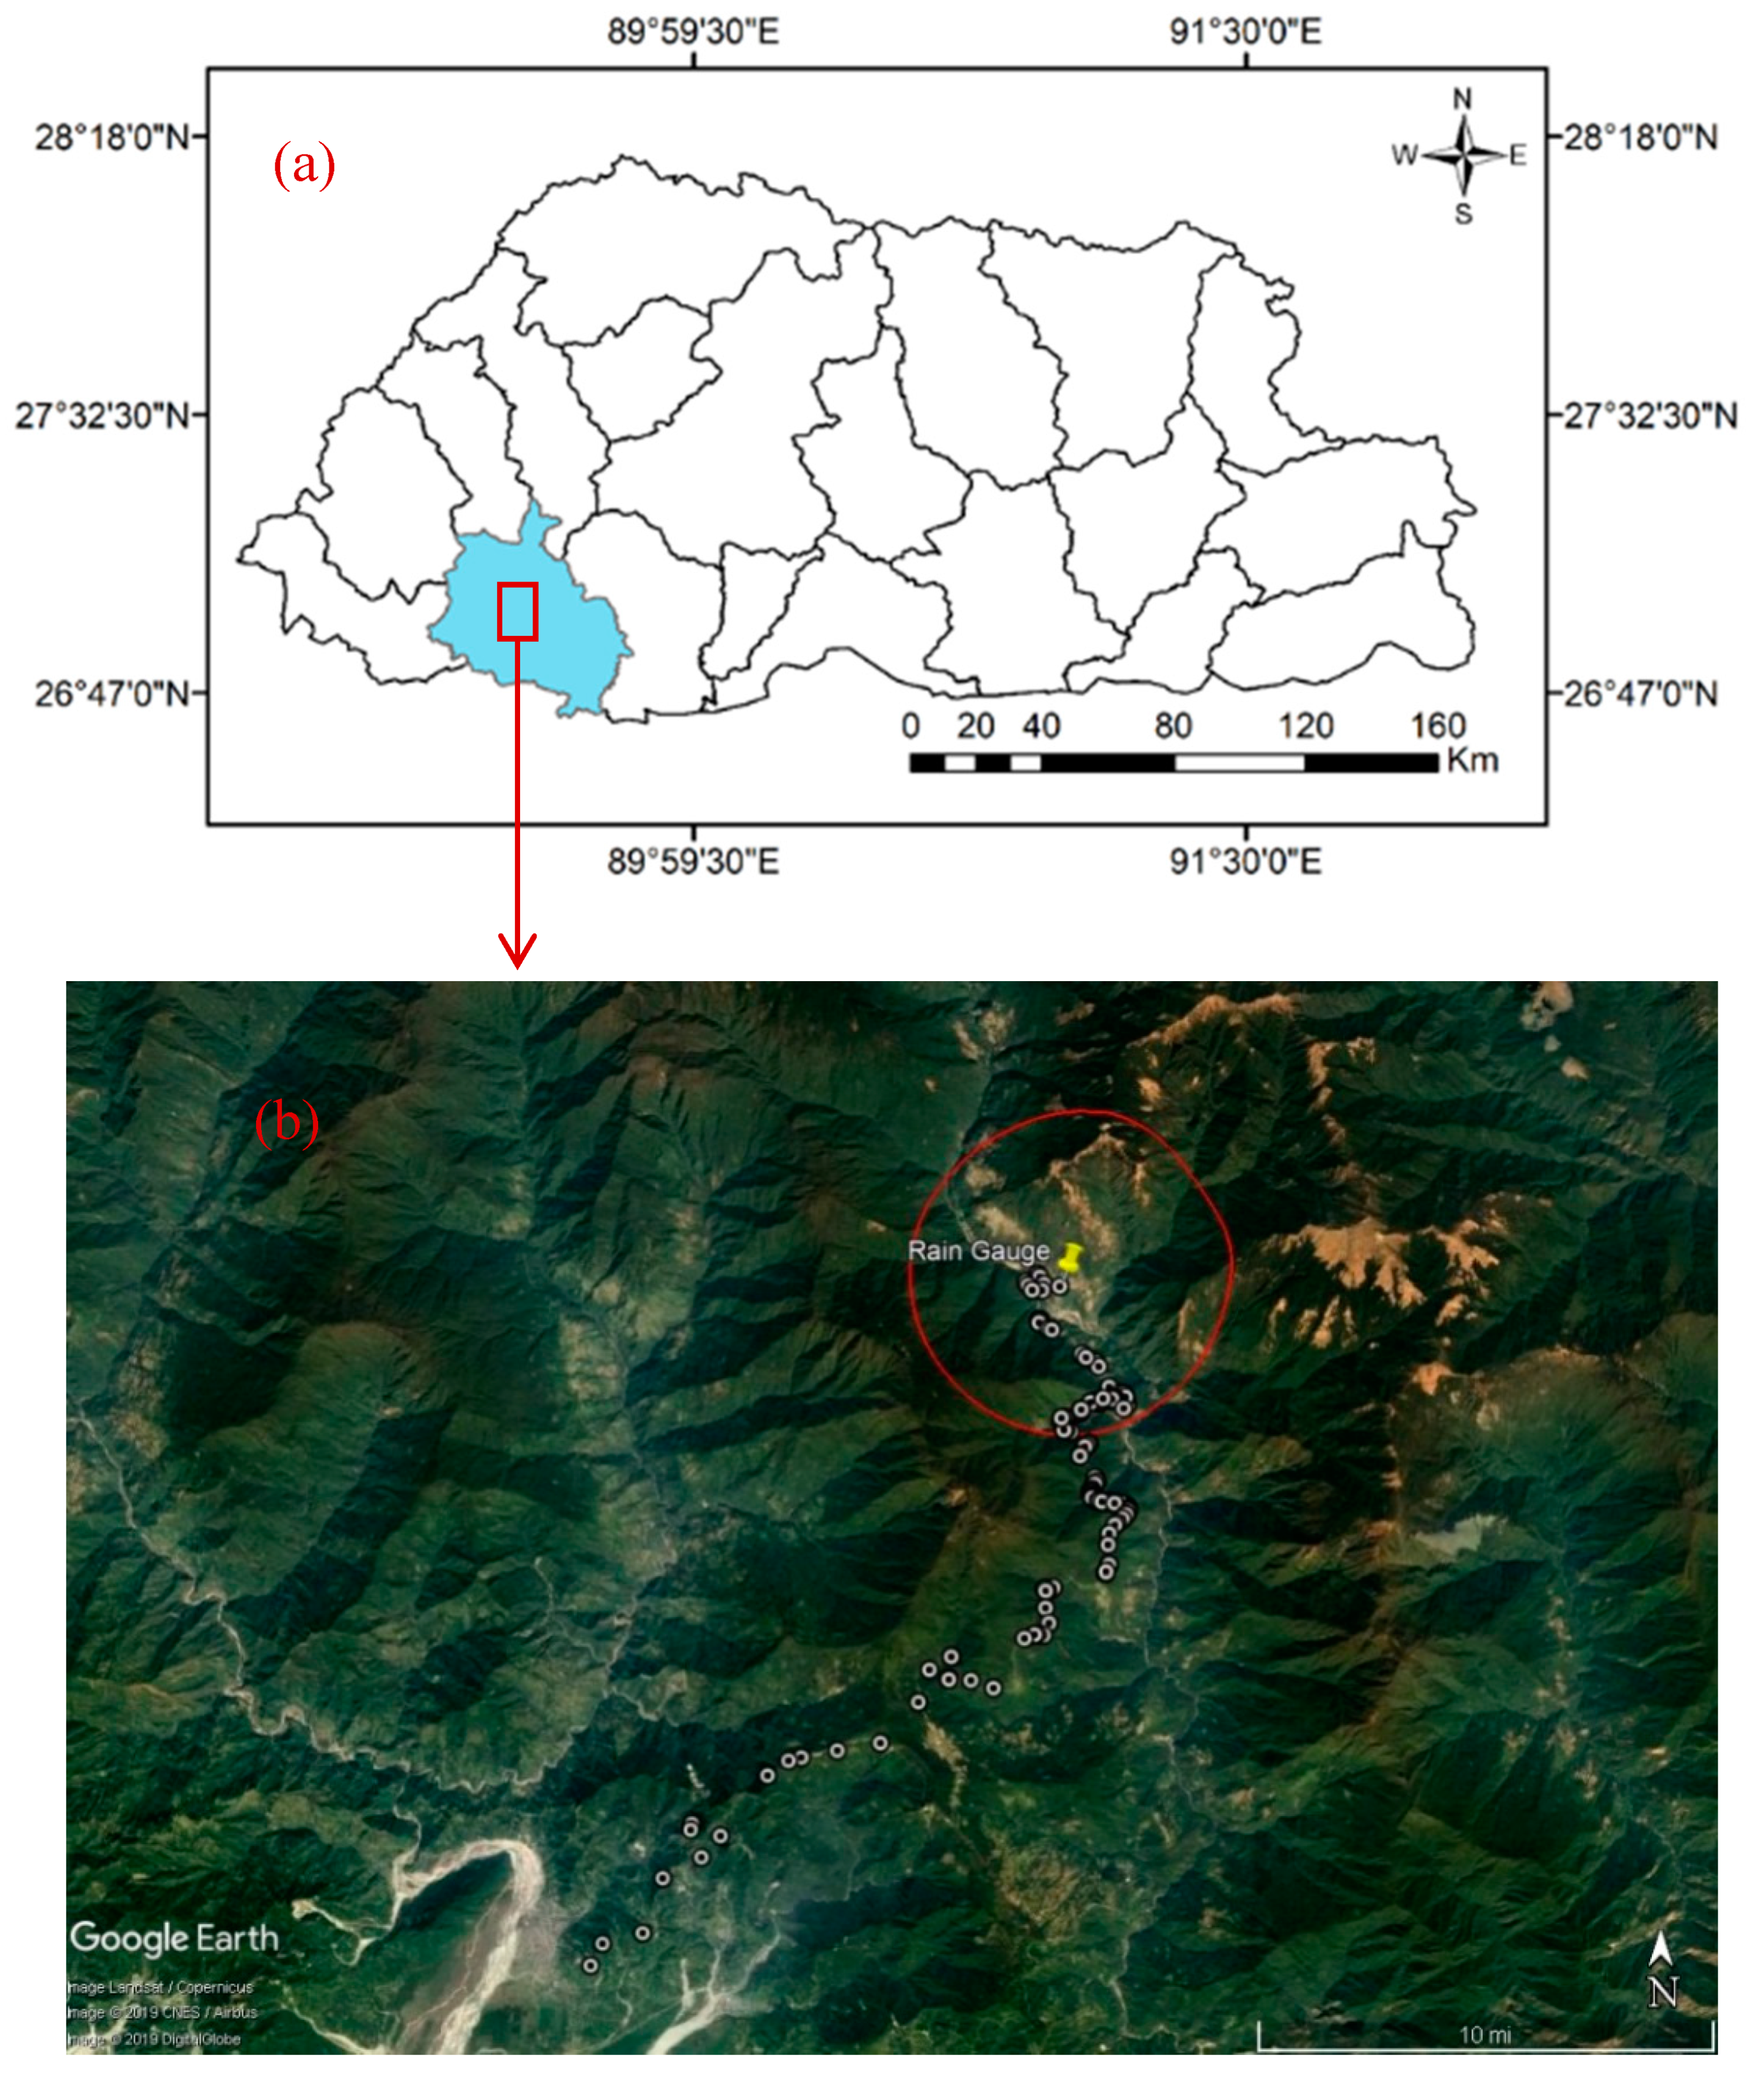
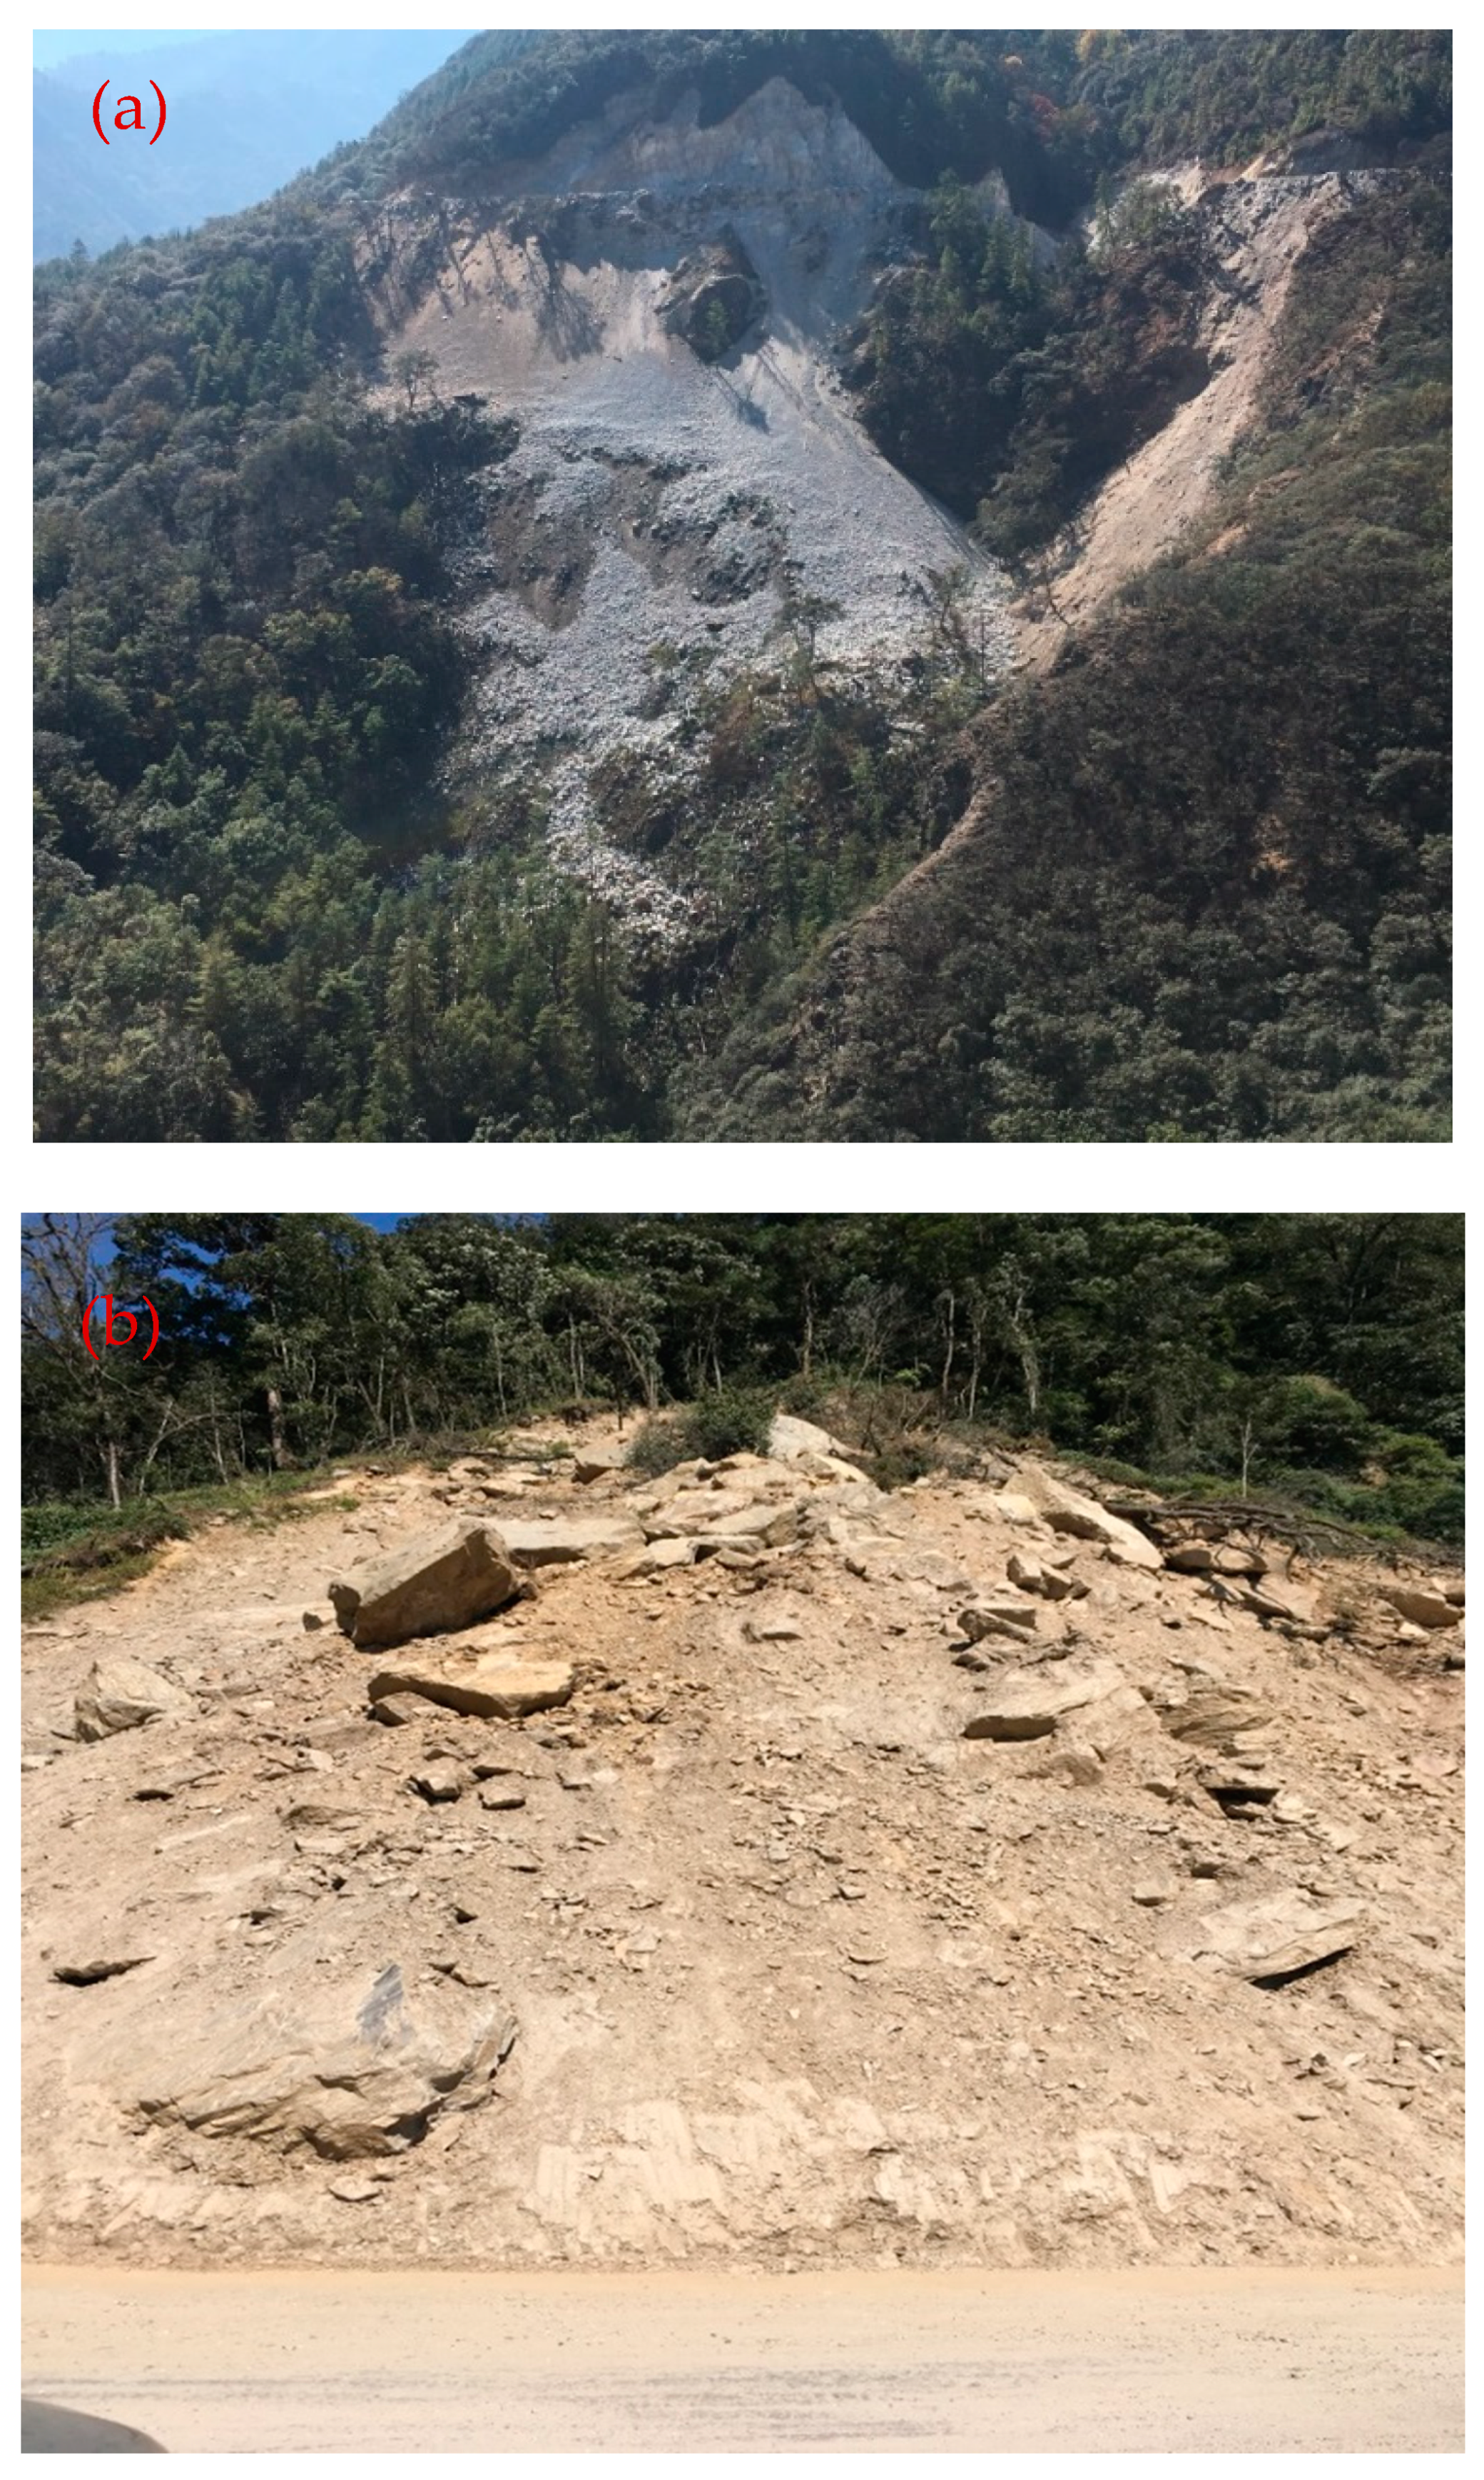
2. Study Area
3. Methodology
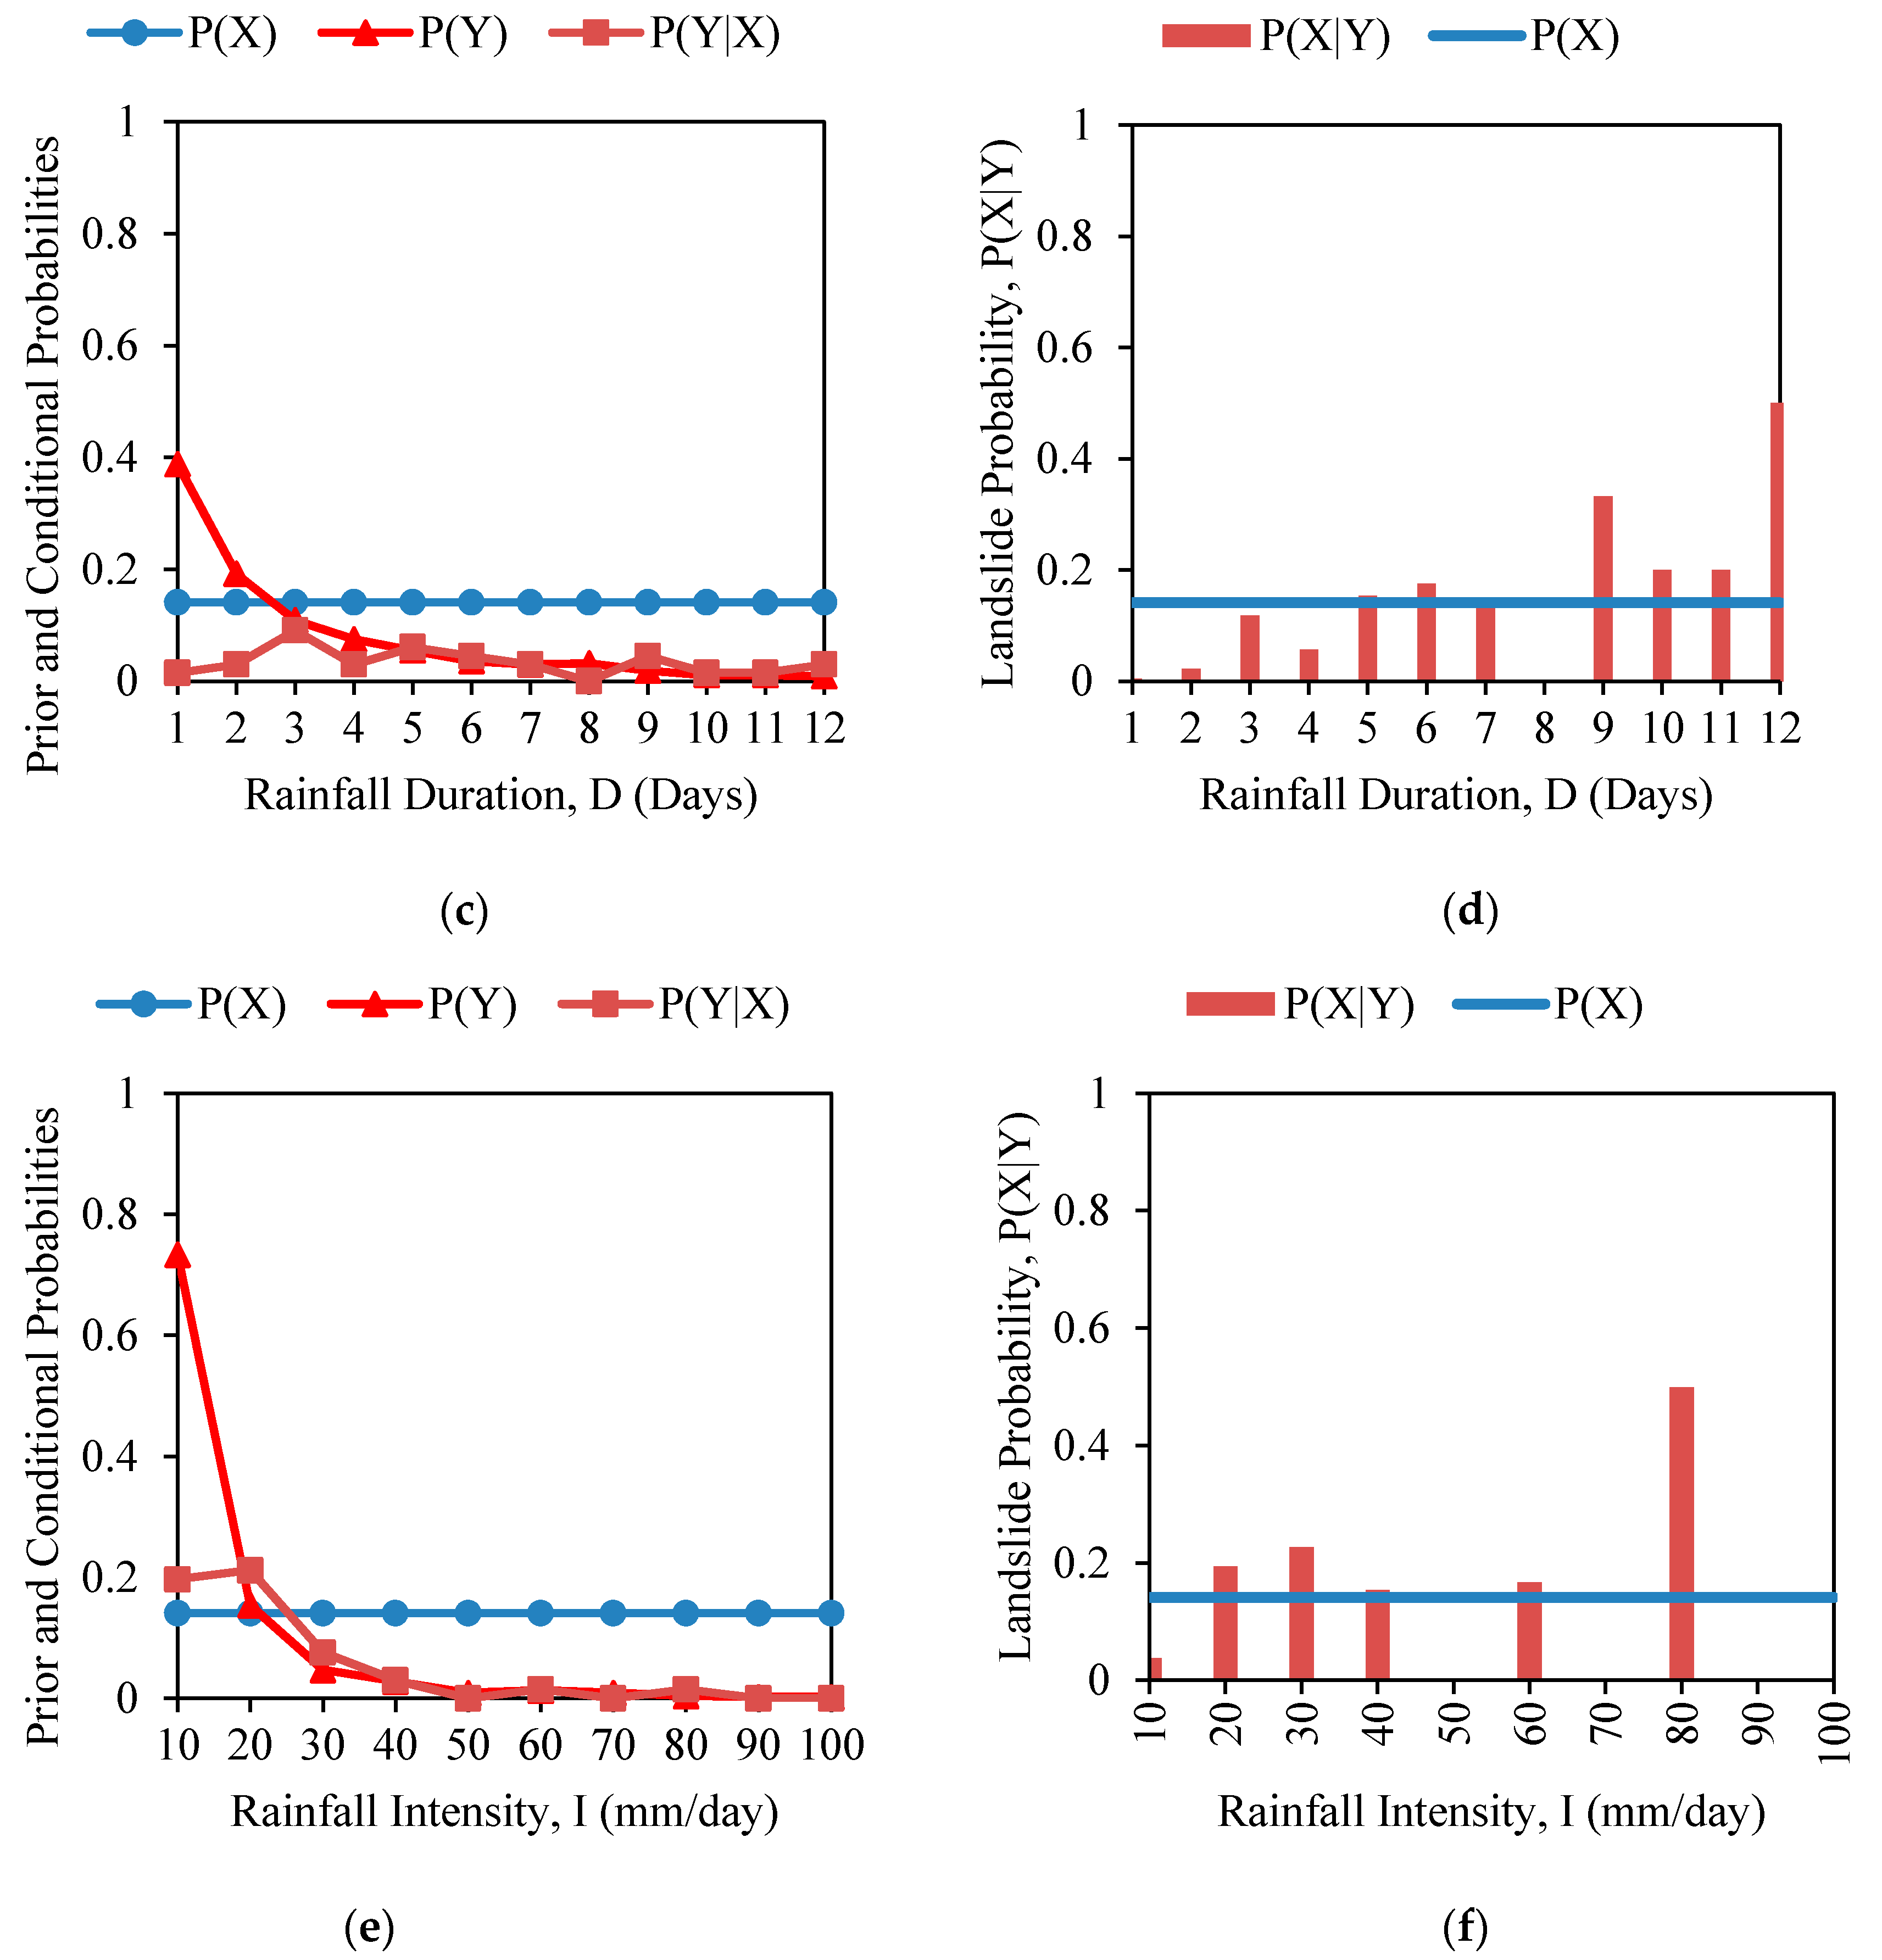
3.1. One-Dimensional Bayesian Probability
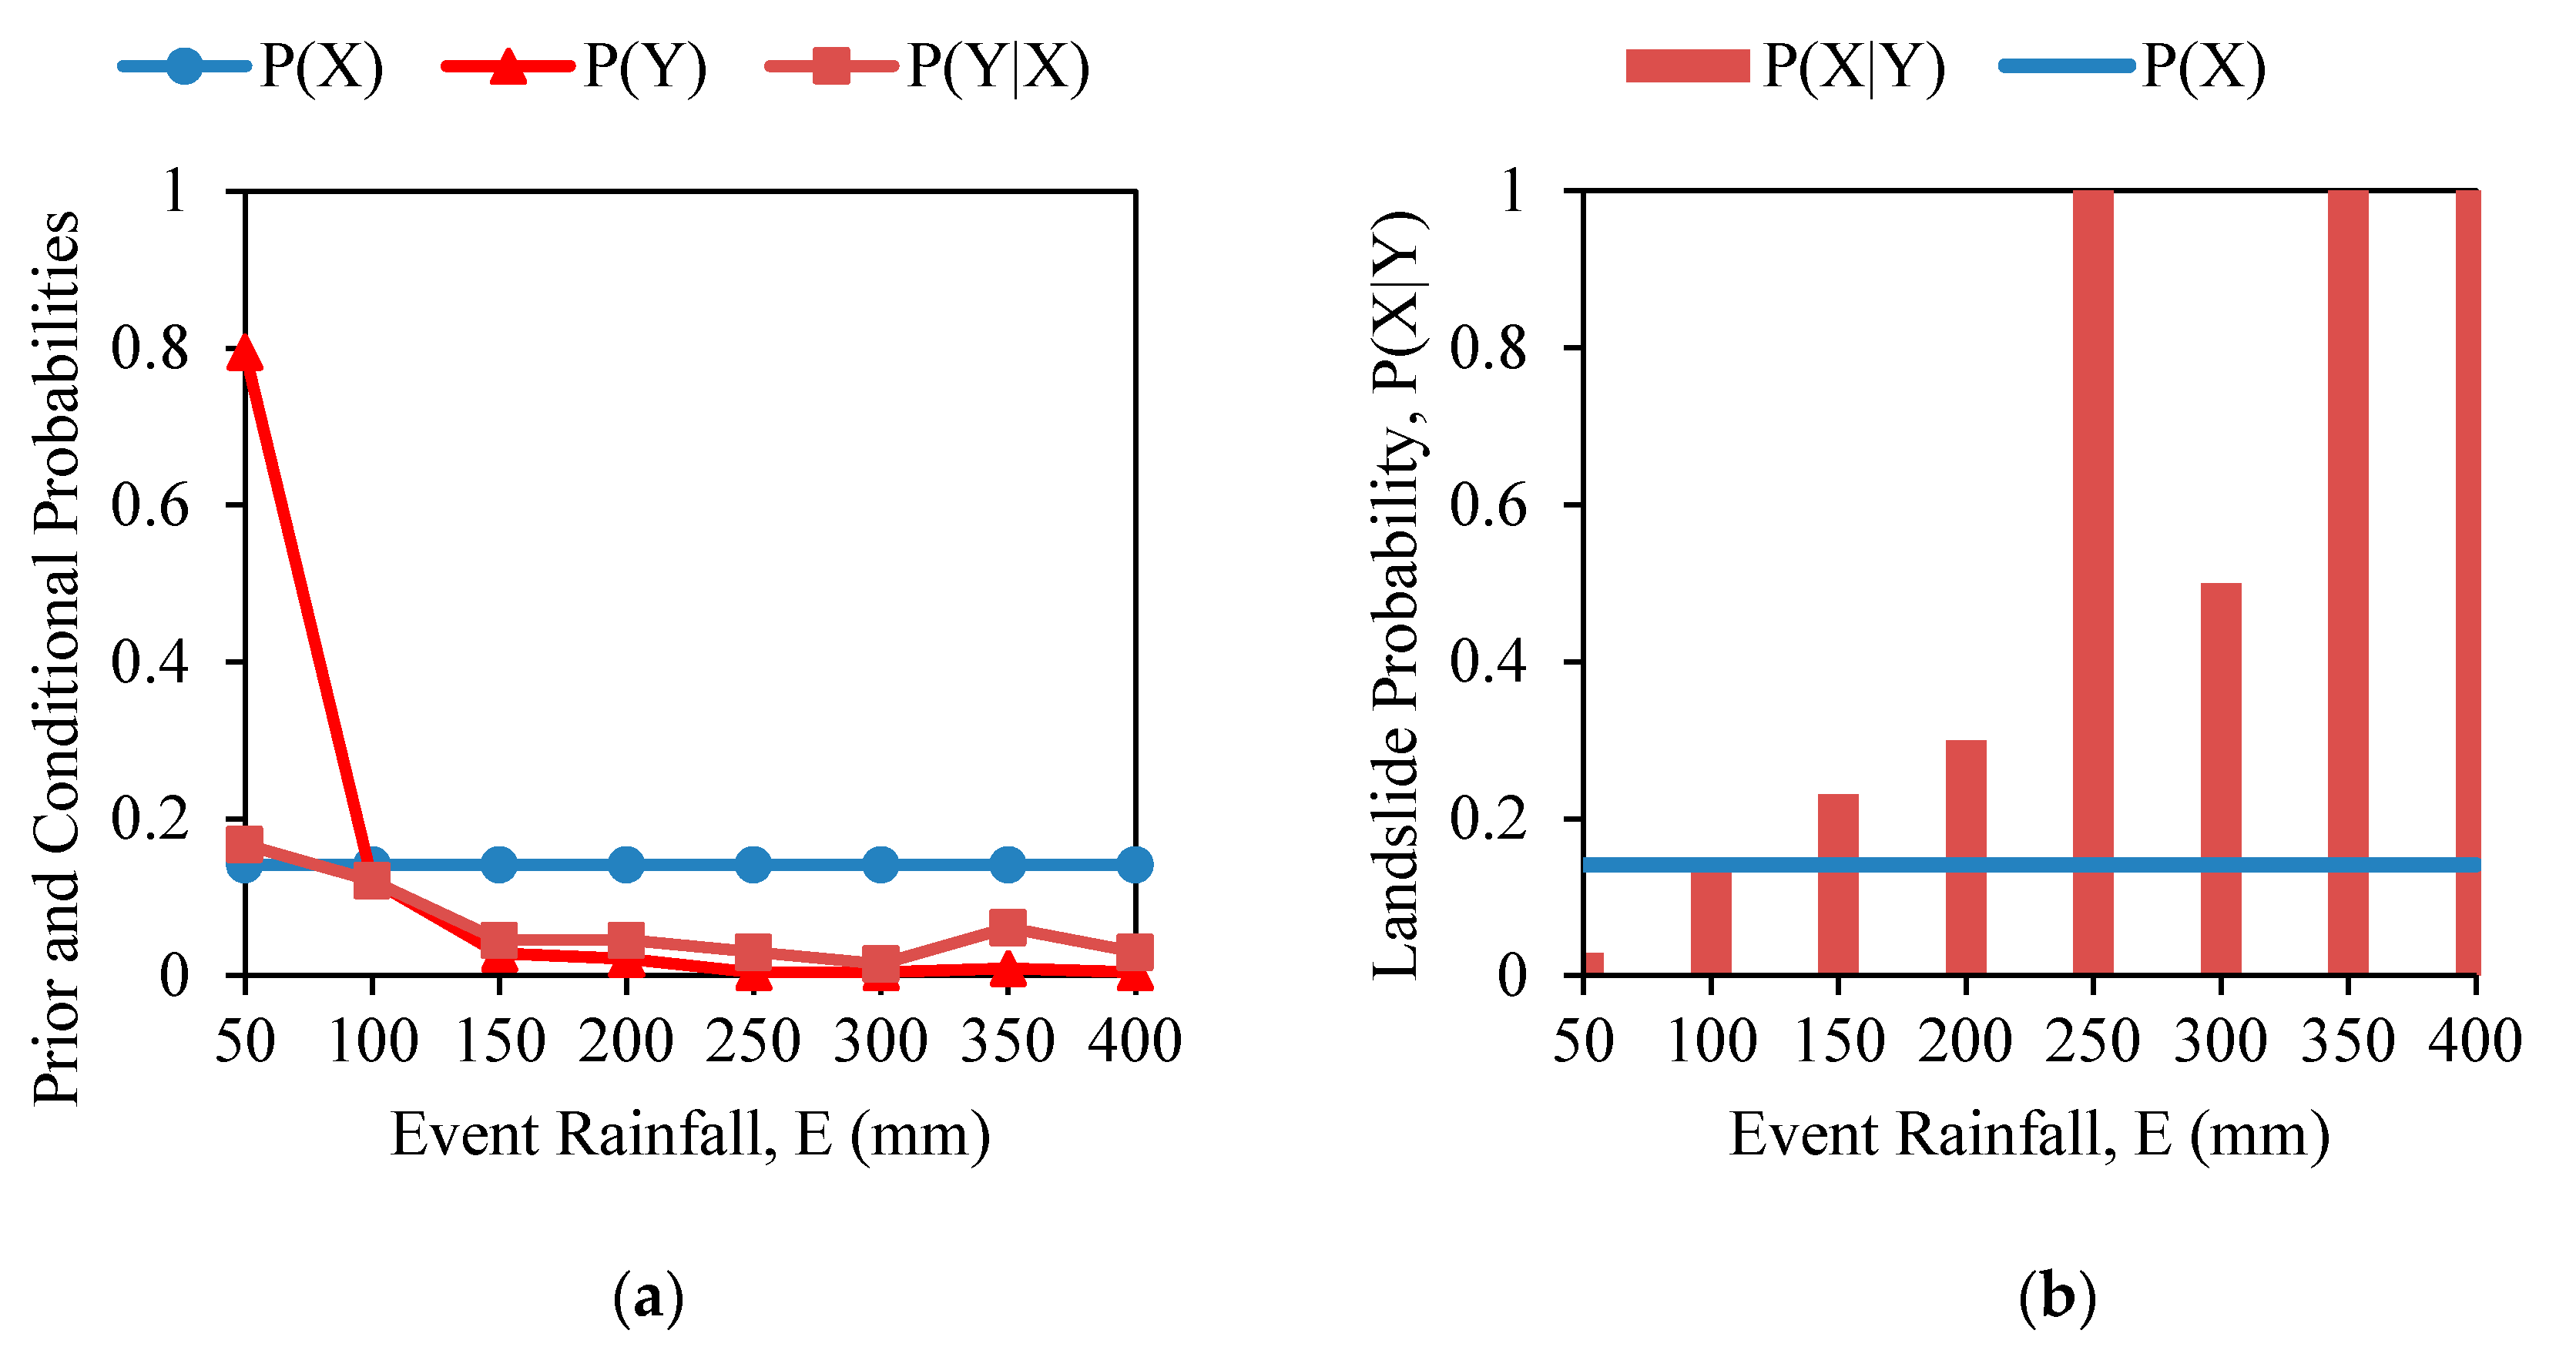
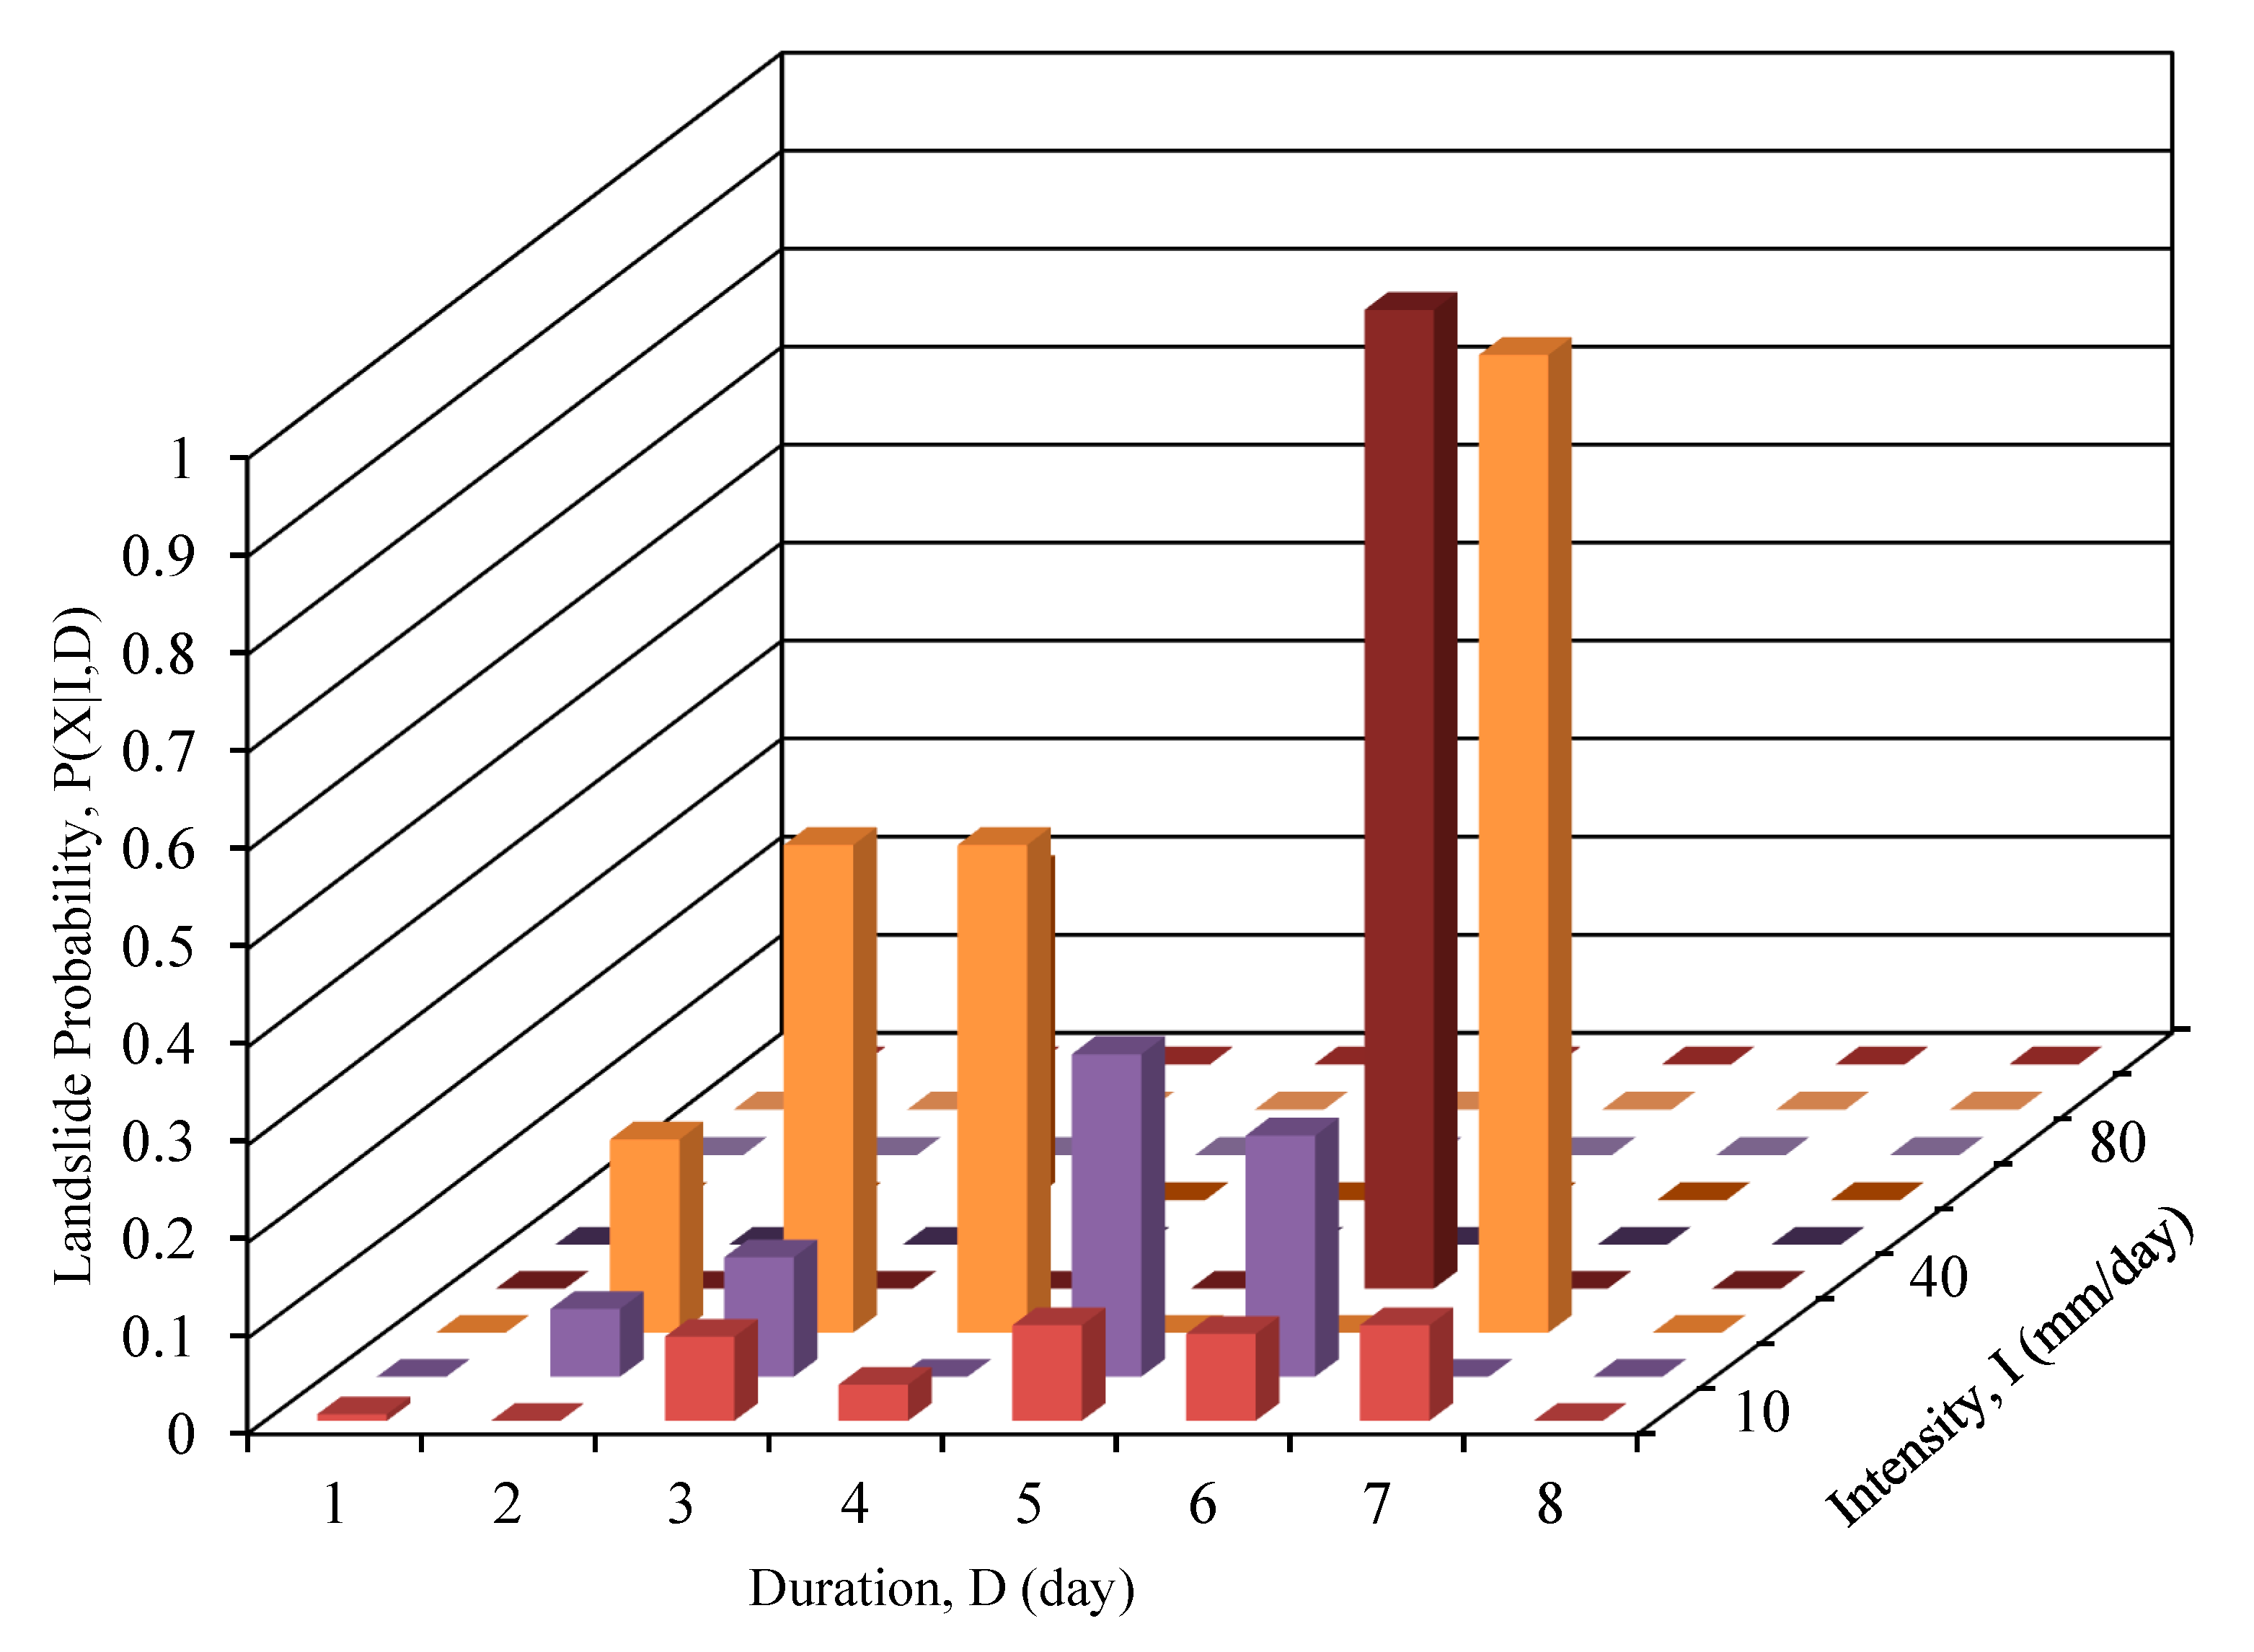
3.2. Two-Dimensional Bayesian Probability
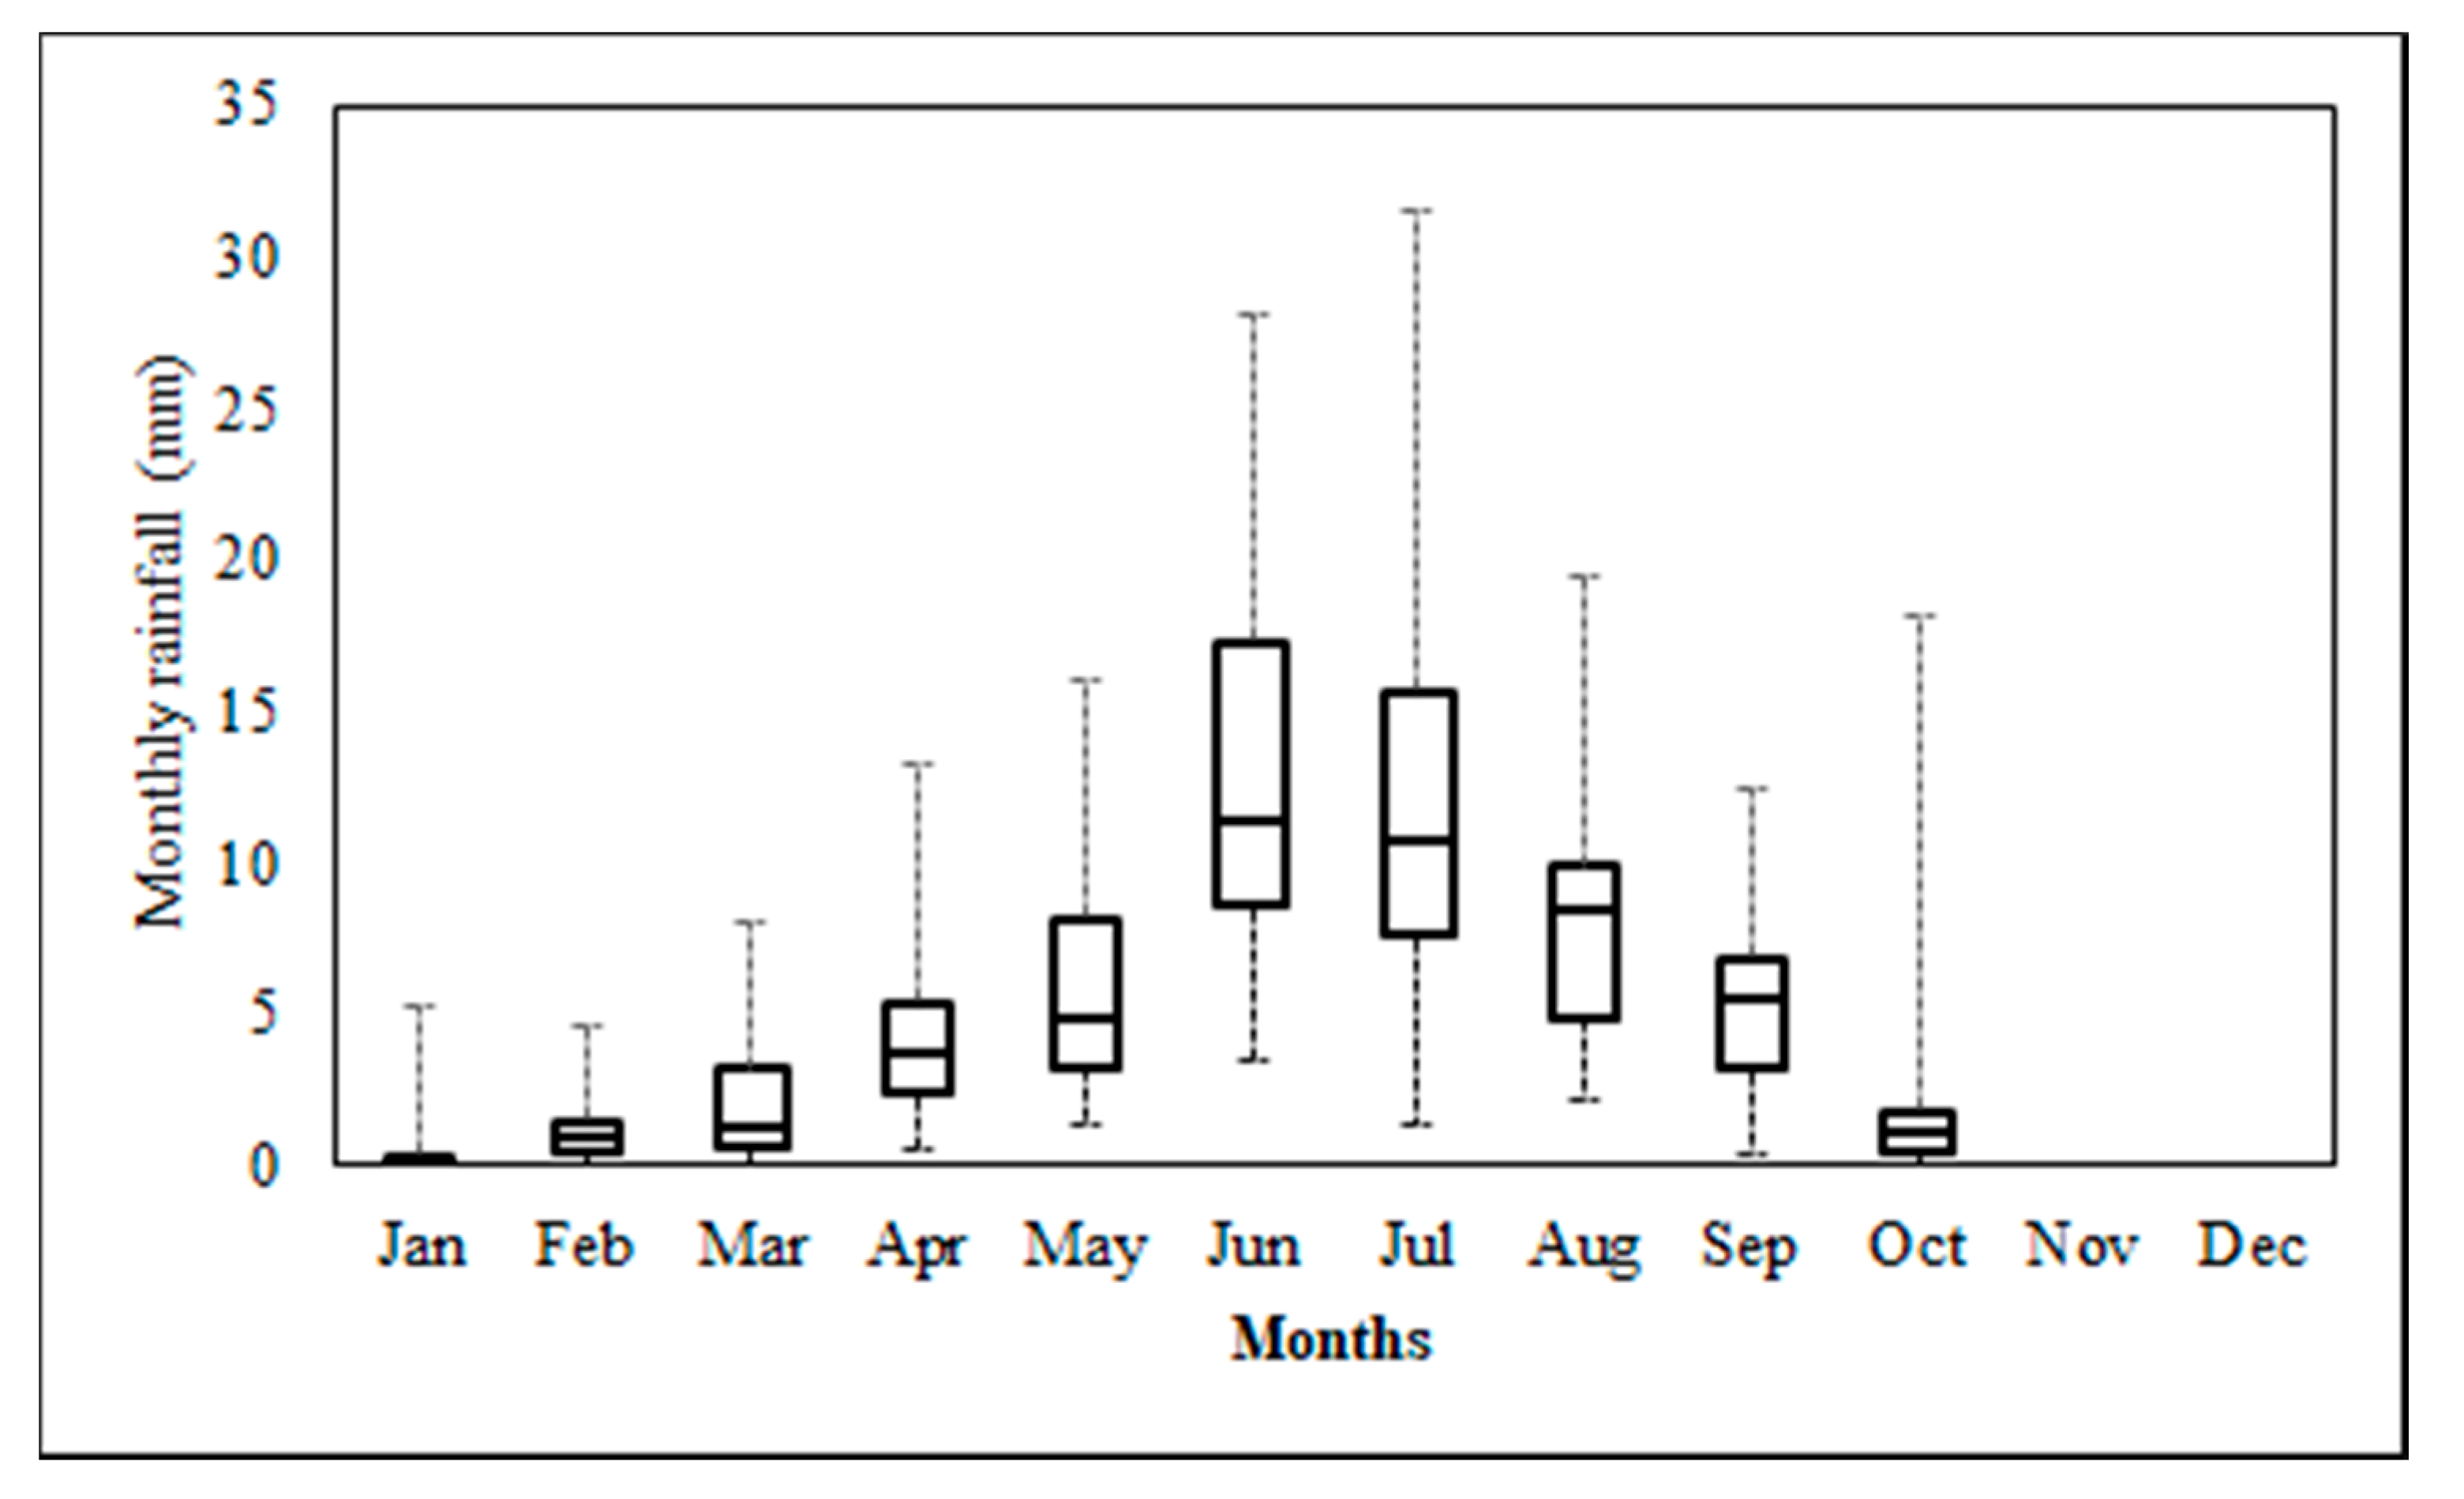
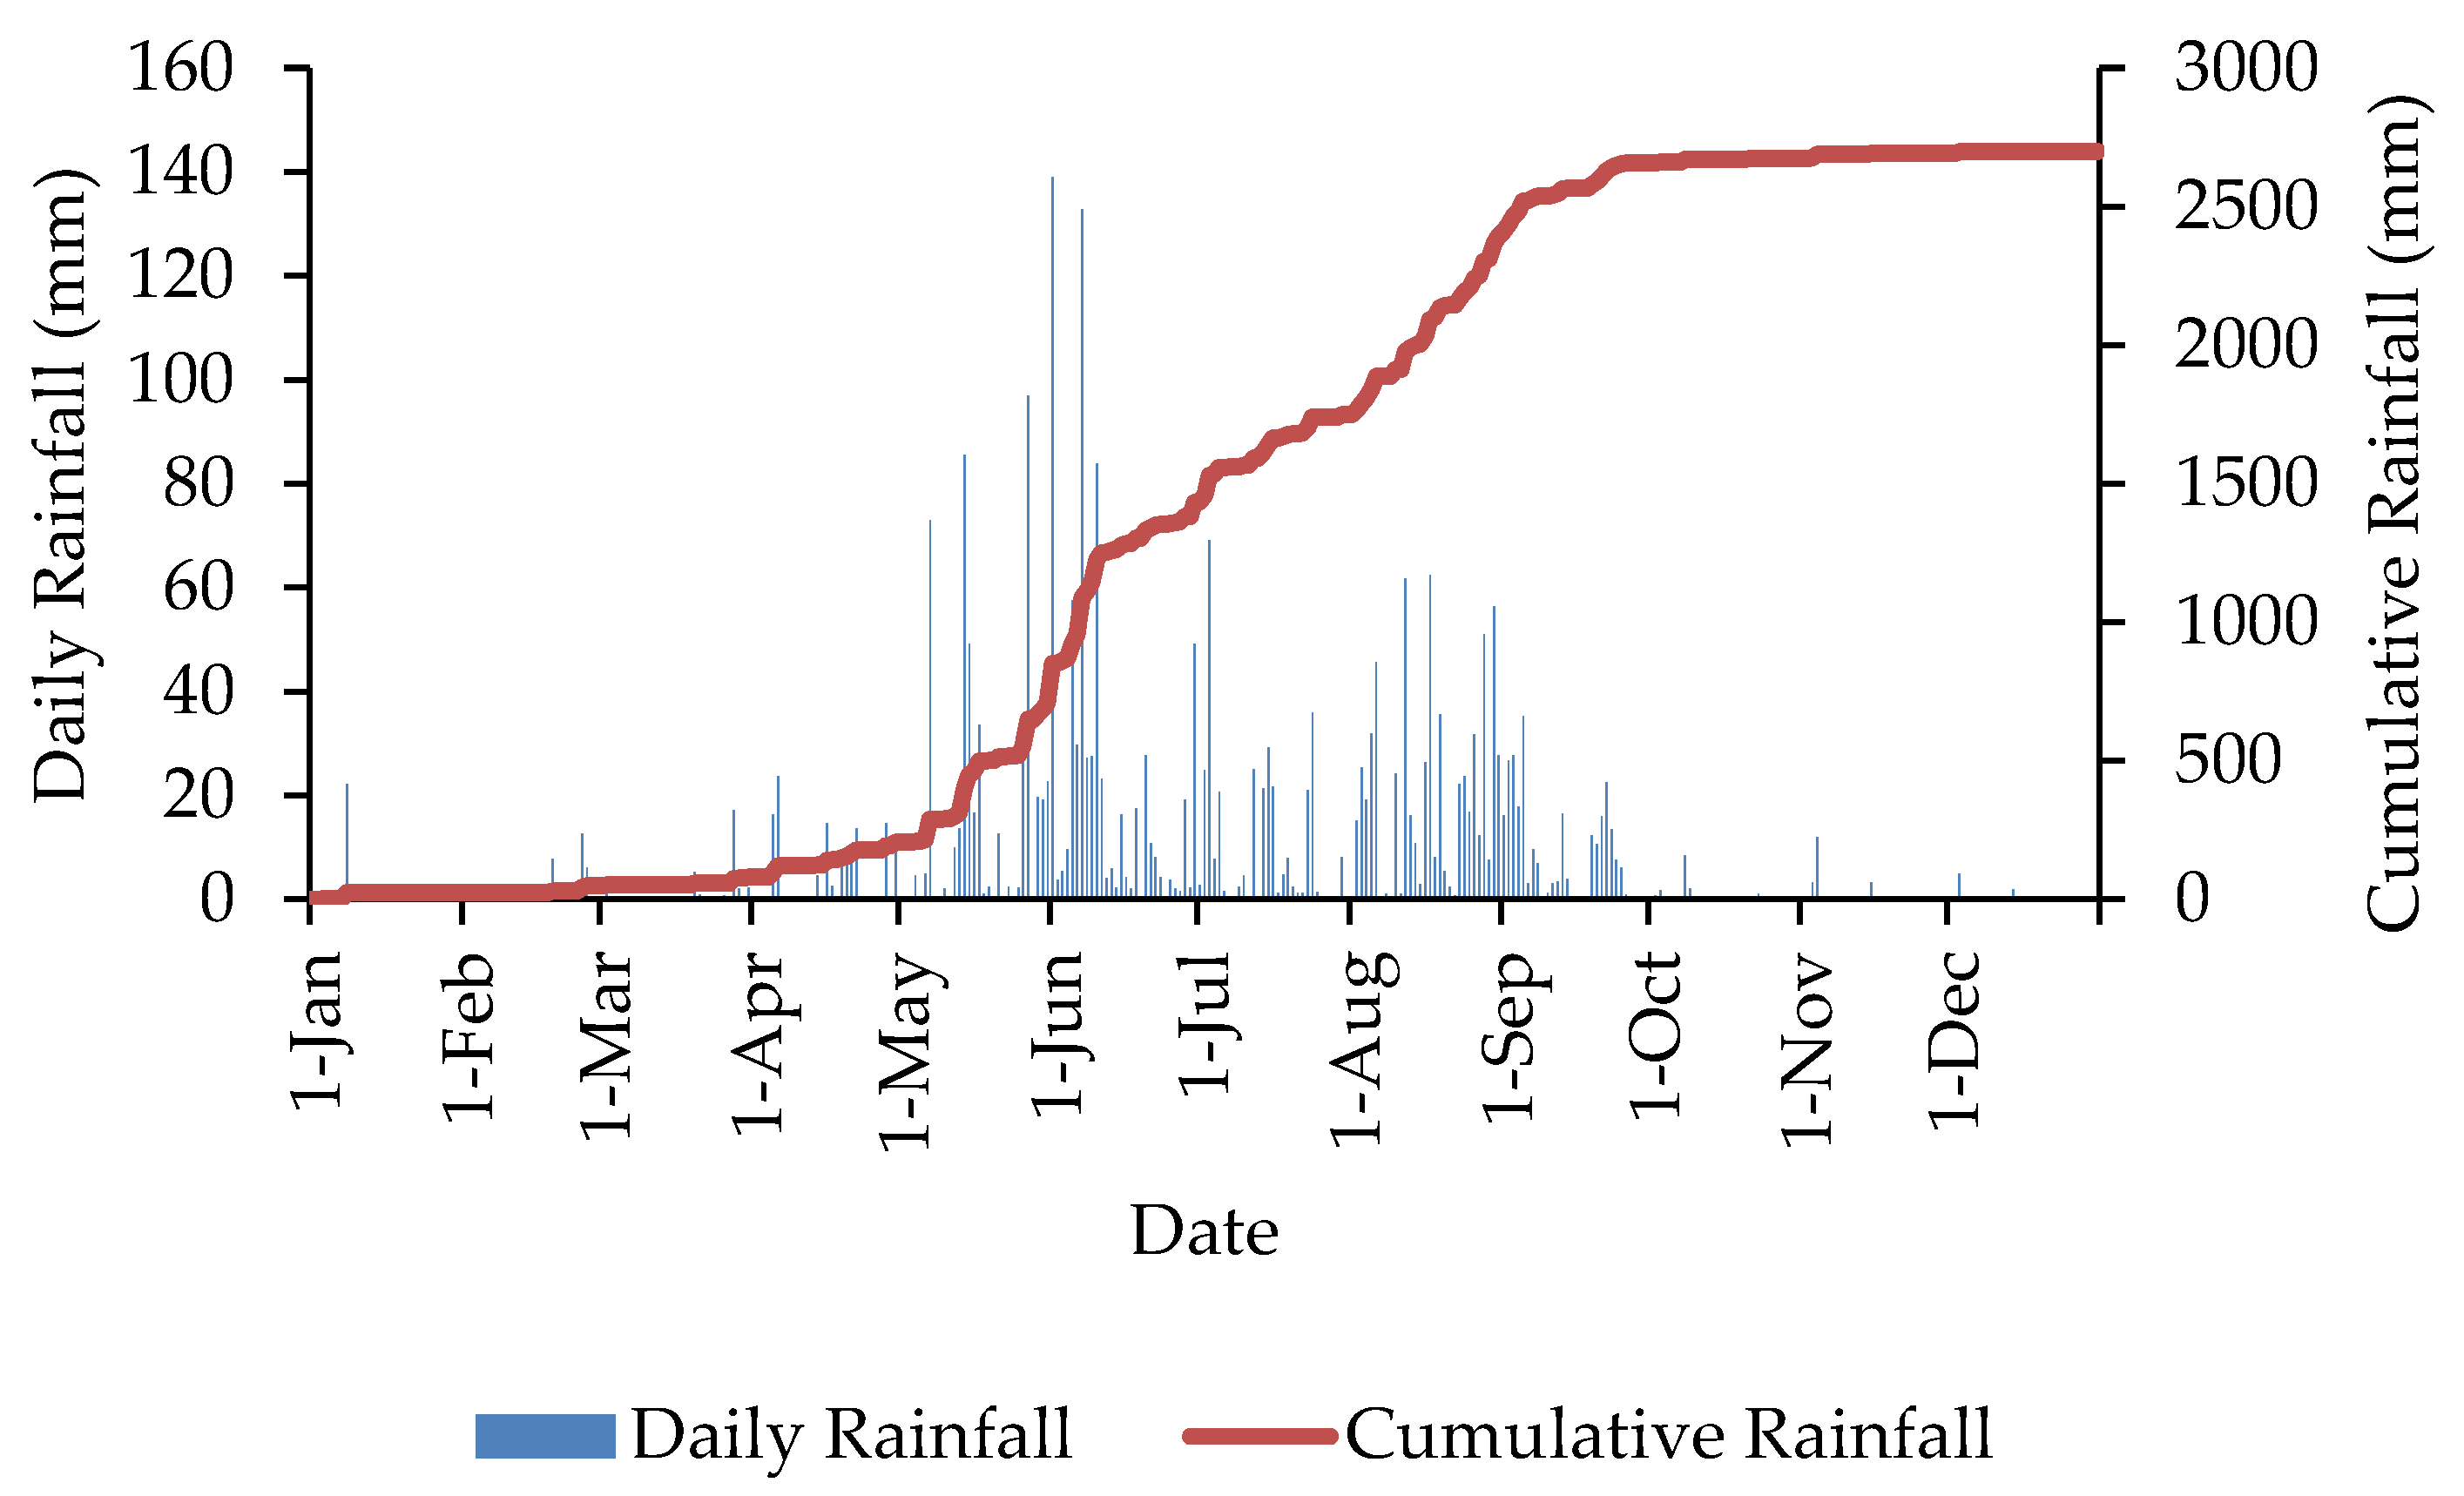
4. Data
5. Results
6. Conclusions
- The use of a probabilistic approach can be a better approach than empirical thresholds as the latter provides a single value of a specific rainfall parameter for landslide incidences.
- The use of two-dimensional probability for determining probabilities for landslide events is better as compared to one-dimensional as the latter depicts that a single rainfall parameter may not be a significant factor to trigger landslides.
- The validation of the thresholds for event rainfall parameter depicts that the model has an accuracy of 57%. However, with the addition of more landslide records and temporal rainfall data, the accuracy will improve. The use of such technique would help in setting up an operational early warning system and help in landslide mitigation.
Author Contributions
Funding
Acknowledgments
Conflicts of Interest
References
- Froude, M.J.; Petley, D.N. Global fatal landslide occurrence from 2004 to 2016. Nat. Hazards Earth Syst. Sci. 2018, 18, 2161–2181. [Google Scholar] [CrossRef]
- Wilson, R.C.; Wieczorek, G.F. Rainfall thresholds for the initiation of debris flows at La Honda, California, Environ. Environ. Eng. Geosci. 1995, 1, 11–12. [Google Scholar] [CrossRef]
- Peruccacci, S.; Brunetti, M.T. TXT-tool 4.039-1.1: Definition and Use of Empirical Rainfall Thresholds for Possible Landslide Occurrence. In Landslide Dynamics: ISDR-ICL Landslide Interactive Teaching Tools; Sassa, K., Tiwari, B., Liu, K.F., McSaveney, M., Strom, A., Setiawan, H., Eds.; Springer: Berlin, Germany, 2018. [Google Scholar]
- Guzzetti, F.; Peruccacci, S.; Rossi, M.; Stark, C.P. Rainfall thresholds for the initiation of landslides in central and southern Europe. Meteorol. Atmos. Phys. 2007, 98, 239–267. [Google Scholar] [CrossRef]
- Brunetti, M.T.; Peruccacci, S.; Rossi, M.; Luciani, S.; Valigi, D.; Guzzetti, F. Rainfall thresholds for the possible occurrence of landslides in Italy. Nat. Hazards Earth Syst. Sci. 2010, 10, 447–458. [Google Scholar] [CrossRef]
- Segoni, S.; Piciullo, L.; Gariano, S.L. A review of the recent literature on rainfall thresholds for landslide occurrence. Landslides 2018, 15, 1483–1501. [Google Scholar] [CrossRef]
- Melillo, M.; Brunetti, M.T.; Peruccacci, S.; Gariano, S.L.; Roccati, A.; Guzzetti, F. A tool for the automatic calculation of rainfall thresholds for landslide occurrence. Environ. Model. Softw. 2018, 105, 230–243. [Google Scholar] [CrossRef]
- Gariano, S.L.; Brunetti, M.T.; Iovine, G.; Melillo, M.; Peruccacci, S.; Terranova, O.; Vennari, C.; Guzzetti, F. Calibration and validation of rainfall thresholds for shallow landslide forecasting in Sicily, Southern Italy. Geomorphology 2015, 228, 653–665. [Google Scholar] [CrossRef]
- Nikolopoulos, E.I.; Crema, S.; Marchi, L.; Marra, F.; Guzzetti, F.; Borga, M. Impact of uncertainty in rainfall estimation on the identification of rainfall thresholds for debris flow occurrence. Geomorphology 2014, 221, 286–297. [Google Scholar] [CrossRef]
- Marra, F.; Destro, E.; Nikolopoulos, E.I.; Zoccatelli, D.; Creutin, J.D.; Guzzetti, F.; Borga, M. Impact of rainfall spatial aggregation on the identification of debris flow occurrence thresholds. Hydrol. Earth Syst. Sci. 2017, 21, 4525–4532. [Google Scholar] [CrossRef]
- Peres, D.J.; Cancelliere, A.; Greco, R.; Bogaard, T.A. Influence of uncertain identification of triggering rainfall on the assessment of landslide early warning thresholds. Nat. Hazards Earth Syst. Sci. Dis. 2017, 18, 633–646. [Google Scholar] [CrossRef]
- Staley, D.M.; Kean, J.W.; Cannon, S.H.; Schmidt, K.M.; Laber, J.L. Objective definition of rainfall intensity–duration thresholds for the initiation of post-fire debris flows in southern California. Landslides 2013, 10, 547–562. [Google Scholar] [CrossRef]
- Gariano, S.L.; Sarkar, R.; Dikshit, A.; Dorji, K.; Brunetti, M.T.; Peruccacci, S.; Melillo, M. Automatic calculation of rainfall thresholds for landslide occurrence in Chukha Dzongkhag, Bhutan. Bull. Eng. Geol. Environ. 2018. [Google Scholar] [CrossRef]
- Berti, M.; Martina, M.L.V.; Franceschini, S.; Pignone, S.; Simoni, A.; Pizziolo, M. Probabilistic rainfall thresholds for landslide occurrence using a Bayesian approach. J. Geophys. Res. 2012, 117, F04006. [Google Scholar] [CrossRef]
- Do, H.; Yin, K. Rainfall Threshold Analysis and Bayesian Probability Method for Landslide Initiation Based on Landslides and Rainfall Events in the Past. Open J. Geol. 2018, 8, 674–696. [Google Scholar] [CrossRef]
- González, A.; Caetano, E. Probabilistic rainfall thresholds for landslide episodes in the Sierra Norte De Puebla, Mexico. Nat. Res. 2017, 8, 254–267. [Google Scholar] [CrossRef]
- Dikshit, A.; Satyam, N. Rainfall Thresholds for Landslide Occurrence in Kalimpong Using Bayesian Approach. In Proceedings of the Indian Geotechnical Conference, Guwahati, India, 14–16 December 2017. [Google Scholar]
- Dikshit, A.; Sarkar, R.; Satyam, N. Probabilistic approach toward Darjeeling Himalayas landslides—A case study. Cogent Eng. 2018, 5, 1537539. [Google Scholar] [CrossRef]
- Dikshit, A.; Satyam, N. Probabilistic rainfall thresholds in Chibo, India: Estimation and validation using monitoring system. J. Mt. Sci. 2019, 16, 870–883. [Google Scholar] [CrossRef]
- Chang, K.T.; Chiang, S.H.; Lei, F. Analysing the relationship between Typhoon-triggered landslides and critical rainfall conditions. Earth Surf. Proc. Landf. 2008, 33, 1261–1271. [Google Scholar] [CrossRef]
- Marques, R.; Zêzere, J.; Trigo, R.; Gaspar, J.; Trigo, I. Rainfall patterns and critical values associated with landslides in Povoação County (São Miguel Island, Azores): Relationships with the North Atlantic Oscillation. Hydrol. Proc. 2008, 22, 478–494. [Google Scholar] [CrossRef]
- Lagomarsino, D.; Segoni, S.; Rosi, A.; Rossi, G.; Battistini, A.; Catani, F.; Casagli, N. Quantitative comparison between two different methodologies to define rainfall thresholds for landslide forecasting. Nat. Hazards Earth Syst. Sci. 2015, 15, 2413–2423. [Google Scholar] [CrossRef]
- Dunning, S.A.; Rosser, N.J.; Petley, D.N.; Massey, C.R. Formation and failure of the Tsatichhu landslide dam, Bhutan. Landslides 2006, 3, 107–113. [Google Scholar] [CrossRef]
- Gansser, A. Geology of the Bhutan Himalaya; Birkhaüser Verlag: Basel, Switzerland, 1983; p. 181. [Google Scholar]
- Corominas, J.; van Westen, C.; Frattini, P.; Cascini, L.; Malet, J.P.; Fotopoulou, S.; Catani, F.; Van Den Eeckhaut, M.; Mavrouli, O.; Agliardi, F.; et al. Recommendations for the quantitative analysis of landslide risk. Bull. Eng. Geol. Environ. 2014, 73, 209–263. [Google Scholar] [CrossRef]


© 2019 by the authors. Licensee MDPI, Basel, Switzerland. This article is an open access article distributed under the terms and conditions of the Creative Commons Attribution (CC BY) license (http://creativecommons.org/licenses/by/4.0/).
Share and Cite
Sarkar, R.; Dorji, K. Determination of the Probabilities of Landslide Events—A Case Study of Bhutan. Hydrology 2019, 6, 52. https://doi.org/10.3390/hydrology6020052
Sarkar R, Dorji K. Determination of the Probabilities of Landslide Events—A Case Study of Bhutan. Hydrology. 2019; 6(2):52. https://doi.org/10.3390/hydrology6020052
Chicago/Turabian StyleSarkar, Raju, and Kelzang Dorji. 2019. "Determination of the Probabilities of Landslide Events—A Case Study of Bhutan" Hydrology 6, no. 2: 52. https://doi.org/10.3390/hydrology6020052
APA StyleSarkar, R., & Dorji, K. (2019). Determination of the Probabilities of Landslide Events—A Case Study of Bhutan. Hydrology, 6(2), 52. https://doi.org/10.3390/hydrology6020052