Article

Characteristics of Rainfall Events Triggering Landslides in Two Climatologically Different Areas: Southern Ecuador and Southern Spain

by
José Antonio Palenzuela Baena
1,*,
John Soto Luzuriaga
2 and
Clemente Irigaray Fernández
1
1
Department of Civil Engineering, University of Granada, 18017 Granada, Spain
2
Department of Geology and Mining and Civil Engineering, Universidad Técnica Particular de Loja, San Cayetano Alto s/n, Loja 1101608, Ecuador
*
Author to whom correspondence should be addressed.
Hydrology 2020, 7(3), 45; https://doi.org/10.3390/hydrology7030045
Submission received: 22 June 2020 / Revised: 17 July 2020 / Accepted: 18 July 2020 / Published: 21 July 2020
(This article belongs to the Special Issue Rainfall-Induced Landslides Hazard)

Abstract

:
In the research field on landslide hazard assessment for natural risk prediction and mitigation, it is necessary to know the characteristics of the triggering factors, such as rainfall and earthquakes, as well as possible. This work aims to generate and compare the basic information on rainfall events triggering landslides in two areas with different climate and geological settings: the Loja Basin in southern Ecuador and the southern part of the province of Granada in Spain. In addition, this paper gives preliminary insights on the correlation between these rainfall events and major climate cycles affecting each of these study areas. To achieve these objectives, the information on previous studies on these areas was compiled and supplemented to obtain and compare Critical Rainfall Threshold (CRT). Additionally, a seven-month series of accumulated rainfall and mean climate indices were calculated from daily rainfall and monthly climate, respectively. This enabled the correlation between both rainfall and climate cycles. For both study areas, the CRT functions were fitted including the confidence and prediction bounds, and their statistical significance was also assessed. However, to overcome the major difficulties to characterize each landslide event, the rainfall events associated with every landslide are deduced from the spikes showing uncommon return periods cumulative rainfall. Thus, the method used, which has been developed by the authors in previous research, avoids the need to preselect specific rainfall durations for each type of landslide. The information extracted from the findings of this work show that for the wetter area of Ecuador, CRT presents a lower scale factor indicating that lower values of accumulated rainfall are needed to trigger a landslide in this area. This is most likely attributed to the high soil saturation. The separate analysis of the landslide types in the case of southern Granada show very low statistical significance for translational slides, as a low number of data could be identified. However, better fit was obtained for rock falls, complex slides, and the global fit considering all landslide types with R2 values close to one. In the case of the Loja Basin, the ENSO (El Niño Southern Oscillation) cycle shows a moderate positive correlation with accumulated rainfall in the wettest period, while for the case of the south of the province of Granada, a positive correlation was found between the NAO (North Atlantic Oscillation) and the WeMO (Western Mediterranean Oscillation) climate time series and the accumulated rainfall. This correlation is highlighted when the aggregation (NAO + WeMO) of both climate indices is considered, reaching a Pearson coefficient of –0.55, and exceeding the average of the negative values of this combined index with significant rates in the hydrological years showing a higher number of documented landslides.

1. Introduction

Landslides are considered to be one of the most serious hydrological hazards, producing isolated or catastrophic events that result in costly damage and high rates of causalities. Quantitative reviews on their effects at different territorial scales can be found in the literature (e.g., [1,2,3,4,5,6]). These studies show thousands of fatalities a year globally, while the costs caused reach thousands of millions of euros. This phenomenon appears in different types of landslides and under a variety of environmental and climatic scenarios, which make it crucial to understand the hydrological mechanisms that lead to the activation of such land processes with negative effects. In a hazard assessment, it is important to define the thresholds under which landslides develop and their expected frequency. Considering that a threshold is the limit of a quantity from which a process initiates or a state changes [7], a rainfall threshold triggering landslides is related to the limit of hydrological conditions such as soil moisture, rainfall intensity, or accumulated precipitation [8,9,10,11,12]. In the literature, there are numerous investigations on establishing the minimum amount of precipitation that leads to landslides at different locations and scales all over the world. A review of the different types of rainfall thresholds that trigger landslides and the results from different locations are addressed in a more in-depth manner in [10], with corresponding references. To define rainfall threshold, authors use two main types of approaches: physical ones (process-based, conceptual) or empirical ones (historical, statistical). The physical or process-based models incorporate the infiltration pattern into the slope instability analysis. These models are characterized by the difficulty of gathering all the necessary information on hydrological, lithological, morphological, and soil geomechanics parameters. This information gathering is costly and the method is better suited to shallow landslides. The method used in this paper is of the second type, where empirical rainfall thresholds are defined by exploring the rainfall events associated with the occurrence of landslides. Unlike physically-based models, the empirically-based methods for the acquisition phase of data are relatively inexpensive. In fact, the gathering of complementary data, such as piezometric monitoring data and horary rainfall depth, was not available, or the boreoarctic time to be collected for specific sites was too long in comparison with the scarce data that could be expected. Instead, daily rainfall data were provided short-term, and the date of occurrence of the landslides can be extracted from literary sources such as the press, libraries, published scientific papers, and books. The precision of these models depends heavily on the quantity of data available to characterize the hydrological scenarios producing landslides. However, in general, collecting the event dates and detailed rainfall records for long periods is not a simple activity. This is essentially due to the scarce amount of information available, which is neither systematic nor standardized. These data are recorded every time a landslide is witnessed or documented [13,14]. After collecting the necessary data, the empirically-based models are expressed by the correlation of precipitation measurements (accumulated rainfall, duration, and intensity) related to individual or multiple rainfall events leading (or not) to landsliding. When multiple rainfall events are considered, a curve representing the function of the correlation between rainfall measurements can be depicted to visually distinguish between the wet conditions that trigger landslides in an area and the rainfall conditions that do not. This is known as a Critical Rainfall Threshold (CRT) curve. In this paper, the CRTs have been obtained by combining the parameters of rainfall event duration and a measurement of cumulative rainfall. This simple approach, which consists of fitting the function that correlates cumulative precipitation and the duration of the rainfall events that trigger landslides, has been applied by different authors in different ways. Several pieces of research take into account the cumulative event rainfall (E) for shallow soil slips and landslides of a flow-like nature [15,16,17,18,19,20]. Conversely, deeper-seated landslides need more time for the layered geomaterials involved in the slipping mass to reach predisposing moisture conditions, so the antecedent rainfall (A) as the accumulated precipitation before the landslide event is accounted for [21,22]. Moreover, several analyses combine both cumulative event rainfall and antecedent rainfall [23,24,25,26]. Commonly, more than one duration is explored from periods ranging from a few days to several months. However, the selection of the duration interval/s is not so trivial if the information gathered is not precise and characterized by the uncertainty regarding the type, geometry, or depth of the failures being evaluated. This fact makes it difficult to apply a single rule to the landslide events being studied. In this research, the main issues hampering the main objectives coincides with those described in [14]. First, not all the public local organizations have implemented procedures to facilitate timely and affordable access to the necessary information and data, which delays or even prevents the most complete records on hazardous events. Similarly, some private companies are reluctant to provide data companies with their data for reasons of legal protection, data privacy, or other reasons of the company itself. Second, the supplied data and exploited information, such as the information from local newspapers, seldom includes the most relevant data to solve the basic problems involved in a landslide hazard analysis. That is basically the type of landslide, its geometry and dimensions, the description of the mobilized materials, and the hydrogeological or geomechanical parameters. This also applies to landslide or hydrogeological hazard catalogues or databases. Thus, given the incomplete and imprecise nature of the necessary information, some considerations were taken into account. Considering the above-mentioned lack of data and uncertainties about the landslide type, this research applies a method to extract the information on the duration and coupled cumulative rainfall regardless of landslide type, although a separation has been carried out where the information gathered provided the classification of the different landslides. In addition, this method evaluates a duration interval range from 1 to 90 days for each landslide event, with the selection of the most significant rainfall and its respective duration. The selection of the rainfall event is based on the joint visualization of the return periods of the different cumulative rainfalls, which help to distinguish those uncommon events that are more probably related to the triggering of the recorded landslides. Thereby, the selected rainfall events can include, or not include, the cumulative event rainfall related to the date of the landslide event or a few days previous to its initiation, as discussed in [13]. Although, in some cases, the type of landslide cannot be identified or was not correctly collected in the consulted sources, this method has the advantage of being independent of the type of landslide. In other words, the rainfall triggering each landslide is deduced from the spikes coinciding with uncommon return periods of rainfall events with specific accumulated rainfall and duration. This means that the duration of the rainfall events is not predefined by the expert, but is rather derived from each uncommon rainfall event detected from the return period spectrum after considering the wide range of rainfall durations (1–90 days). Accordingly, this method has been applied to both case studies as it can be used for a single type of landslide or for a mixed dataset with different types of mass movements.
In previous research [13,27], the proposed method has been applied by using different functions and rainfall parameters in both study areas. Conversely, this paper seeks to homogenize the CRT analysis by using the same functions for every case, providing a comparison between both scenarios. In addition to the information on triggering conditions, the present research deal with the correlation of these rainfall thresholds and the landslide occurrences with the main climatic cycles affecting the area under analysis. Both the weather models and CRTs (Critical Rainfall Threshold) provide valuable information for the prediction of landslides events, despite the changing patterns in the space and time of climatic cycles.
Considering the significance of this information as a contribution to upcoming research, this work aims to produce initial insights on the CRT functions extracted from the information gathered for two zones that are climatologically and environmentally different. The first zone is located at the Loja Basin in southern Ecuador, while the second one is sited in the south of the province of Granada (Spain). As a second objective, this work adds a graphical and quantitative analysis of the accumulated rainfall during the wettest period and the relevant climatic indices greatly affecting each study area.

2. Insights on the Association of Teleconnections with Floods and Landslides

The teleconnection indices represent the variability in the flows or circulations that favors the appearance of precipitation and controls the patterns of wet and drought periods.

2.1. ENSO (El Niño Southern Oscillation)

The ENSO [28] represents the “balance” of sea pressure in the tropical Pacific Ocean. This phenomenon develops in two phases. The warm phase “El Niño” [29] constitutes the oceanographic and atmospheric periodic anomalies along the Oriental Equatorial Pacific and the southern coastal zone of Ecuador and Peru. This phase causes sea surface temperature (SST) to increase in the Equatorial Pacific. At the same time, SST warming favors evaporation and troposphere heating, leading to atmospheric convection in its warm phase called El Niño. However, the cold phase, La Niña, can cause droughts in multiple areas of South America. A warm phase is declared when the average of the SST anomalies in the Niño 3–4 region (5N–5S, 170W–120W) are above the threshold of +0.5 °C for five consecutive 3-month periods. The intensity of this phenomenon is measured by the Oceanic Niño Index (ONI) as the deviation from this standard (greater than or equal to +0.5 °C). Reference [30] states that the Southwest Pacific (SWP) droughts, landslides, and coastal flooding are linked to ENSO and tropical cyclones. For example, during the moderate phases of El Niño in 2009 and La Niña in 2010, the above average landslide activity was detected peaking in November 2010 in Colombia and Venezuela [31,32]. Also, 54% of the landslides accounted for within the period 2004–2016 in Brazil occurred between 2009 and 2011, with peaks from December 2009 and April 2010 coinciding with a strong El Niño, and January 2011 with a strong La Niña [33]. Similarly, “The Callapa mega-landslide” was developed during the La Niña event of 2010–2011 in Bolivia [34].
In Colombia, La Niña events are associated with a high frequency of flooding, mass movements, and infrastructure damages [35] (and references therein). The review of the database DesInventar for the Antioquia (Colombian Andes) by [36] accounted for 3478 mass movements that caused 2065 deaths and 74654 damaged houses during the period 1900–2017. The study area showed a greater number of landslides during La Niña of almost equal distribution during the hydrological year.
In central-northern Chile, in the mid basin of Elqui River, at 40 km from the Pacific Ocean and an elevation range between 400 and 3900 m, [37] (and references therein) concluded that the ENSO and the number of landslides present a positive correlation.
Moreover, the more eastern countries (closer to the Atlantic Ocean) have been impacted by excessive rainfall during ENSO, causing documented disasters. In other parts of the continent, the ENSO effects do not show significant differences between the number of landslides linked to El Niño, La Niña, and neutral years, probably due to the topographic features and the complex interaction of the Pacific and Atlantic anticyclones [38]. This is well noted in northwestern Argentina to the south of the Cordillera Oriental in the Central Andes [39]. However, the increasing number of landslides have been also recorded in this area during the El Niño warm phases [38] (and references therein). This increasing was found during the extraordinary storms of 1982–1983, 1991–1992, and 2015–2016 when a high number of debris flows and rockfalls caused incalculable damage to the International Road to Chile and the Transandine International Railway on the margins of the Mendoza River [38,40].
When the SST rises due to ENSO events, the coastal northern Peru and southern Ecuador are those which are most directly impacted as the warm phase destabilizes the lower atmosphere [41].
In Peru, the natural hazards are more frequent in coastal areas and in the Cordillera Occidental and Cordillera Central, decreasing as one goes inland [42]. Despite the hyper-arid coastal climate of northern Peru, the authors of [43,44] concluded that the region around the city of Trujillo experiences some of the strongest ENSO signals associated with increases in rainfall, typically exceeding 40%. For example, [44] found regional correlations between 0.58 and 0.78, considering the stations in the cities of Trujillo, Chiclayo, and Piura. Similarly, a review of the homogeneous landslide database DesInventar for the area of the Ancash Department (Peru) showed a major correlation of landslides with El Niño episodes (41% of all the recorded catastrophes) between 1971 and 2009 [42]. More recently, multiple regions located on the coast of northern Peru were seriously affected by floods during the first three months of 2017 with the increasing SST yield in the El Niño of 2017 [45]. In that period, this area received 10 times its average rainfall.
The population and economic activity of the coastal zone of Ecuador are high. Thus, multiple investigations have contributed to the Ecuadorian rainfall prediction in relation to El Niño events that have caused floods and landslides, millions dollars’ worth of damage, and thousands of deaths [46] (and references therein). In this area, historical El Niño events identified in 1982–1983, 1987–1988, 1991–1992, and 1997–1998 favored rainfall anomalies with valuable damage to livelihoods, agriculture, and infrastructure.

2.2. NAO (North Atlantic Oscillation)

The NAO is one of the main sources of climate variability in the European region [47,48,49]. This is formed by the pressure difference between two opposite sign action centers located in the North Atlantic, one over the Azores and another over Iceland [50,51,52,53]. The NAO is correlated with temperature [54,55] and precipitation extremes [56]. Several authors have demonstrated that the negative NAO phase has favored anomalously high atmospheric instability over southern Europe, the Mediterranean Basin, northern Africa, and northwest Africa for the last four decades in winter [57] (and references therein).
The NAO climatological phenomenon has notable effects on the northern Iberian Peninsula, usually between December and February. Negative NAO and lower solar activity were primarily responsible for the high frequency of floods during the autumns and winters of the last 2000 years in western-central Europe. This information is derived from sedimentological studies on slackwater flood deposits [58]. The expansion of this phenomenon has also been interpreted to reach the Mediterranean moisture [59]. In the Mediterranean regions, significant storms and high levels of accumulated precipitation are detected due to the changes in the atmospheric winter flow that can last even four months (December–March) in extreme cases. The interaction of climatic influences and the understanding of their trends is complex. Nevertheless, efforts have been made to study the interval between prolonged and intense rainfall episodes resulting from the influence of the NAO. Portugal and Spain are two countries directly affected by the NAO. In Portugal, [60] found significant anti-correlation by applying the Pearson coefficient to the relationship between several precipitation indices and the NAO index, except for the CDD (cumulative dry days).
Using the global extension of teleconnections, the NAO has also had a significant influence on southern Spain, producing a decreasing trend in the annual rainfall in the western Mediterranean and a rising number and intensity of heavy storms of very short duration [61,62,63,64]. In the Tramuntana Range at the north-western part of the Majorca Island (central Mediterranean basin), [65] conducted a spectral analysis to determine the presence and statistical significance of climate cycles. Thus, the analysis of different long-term rainfall series permitted the identification of ENSO, NAO, Quasi-Biennial Oscillation (QBO), and Hale and Sun Spot cycles as other signals related to solar activity. Among these, the NAO cycles showed one of the most powerful signals (peaks) in the six-month frequency. In this area, the NAO and ENSO peaks were well-matched with numerous landslide events from a detailed inventory (174 events) dating back to 2005. That is the case of the period 2008–2010, when the island of Majorca experienced the coldest and wettest winters of the last 40 years. Coinciding with the high NAO and ENSO values of that period, 66 mass movements occurred in the Tramuntana range [65,66].

2.3. WeMO (Western Mediterranean Oscillation)
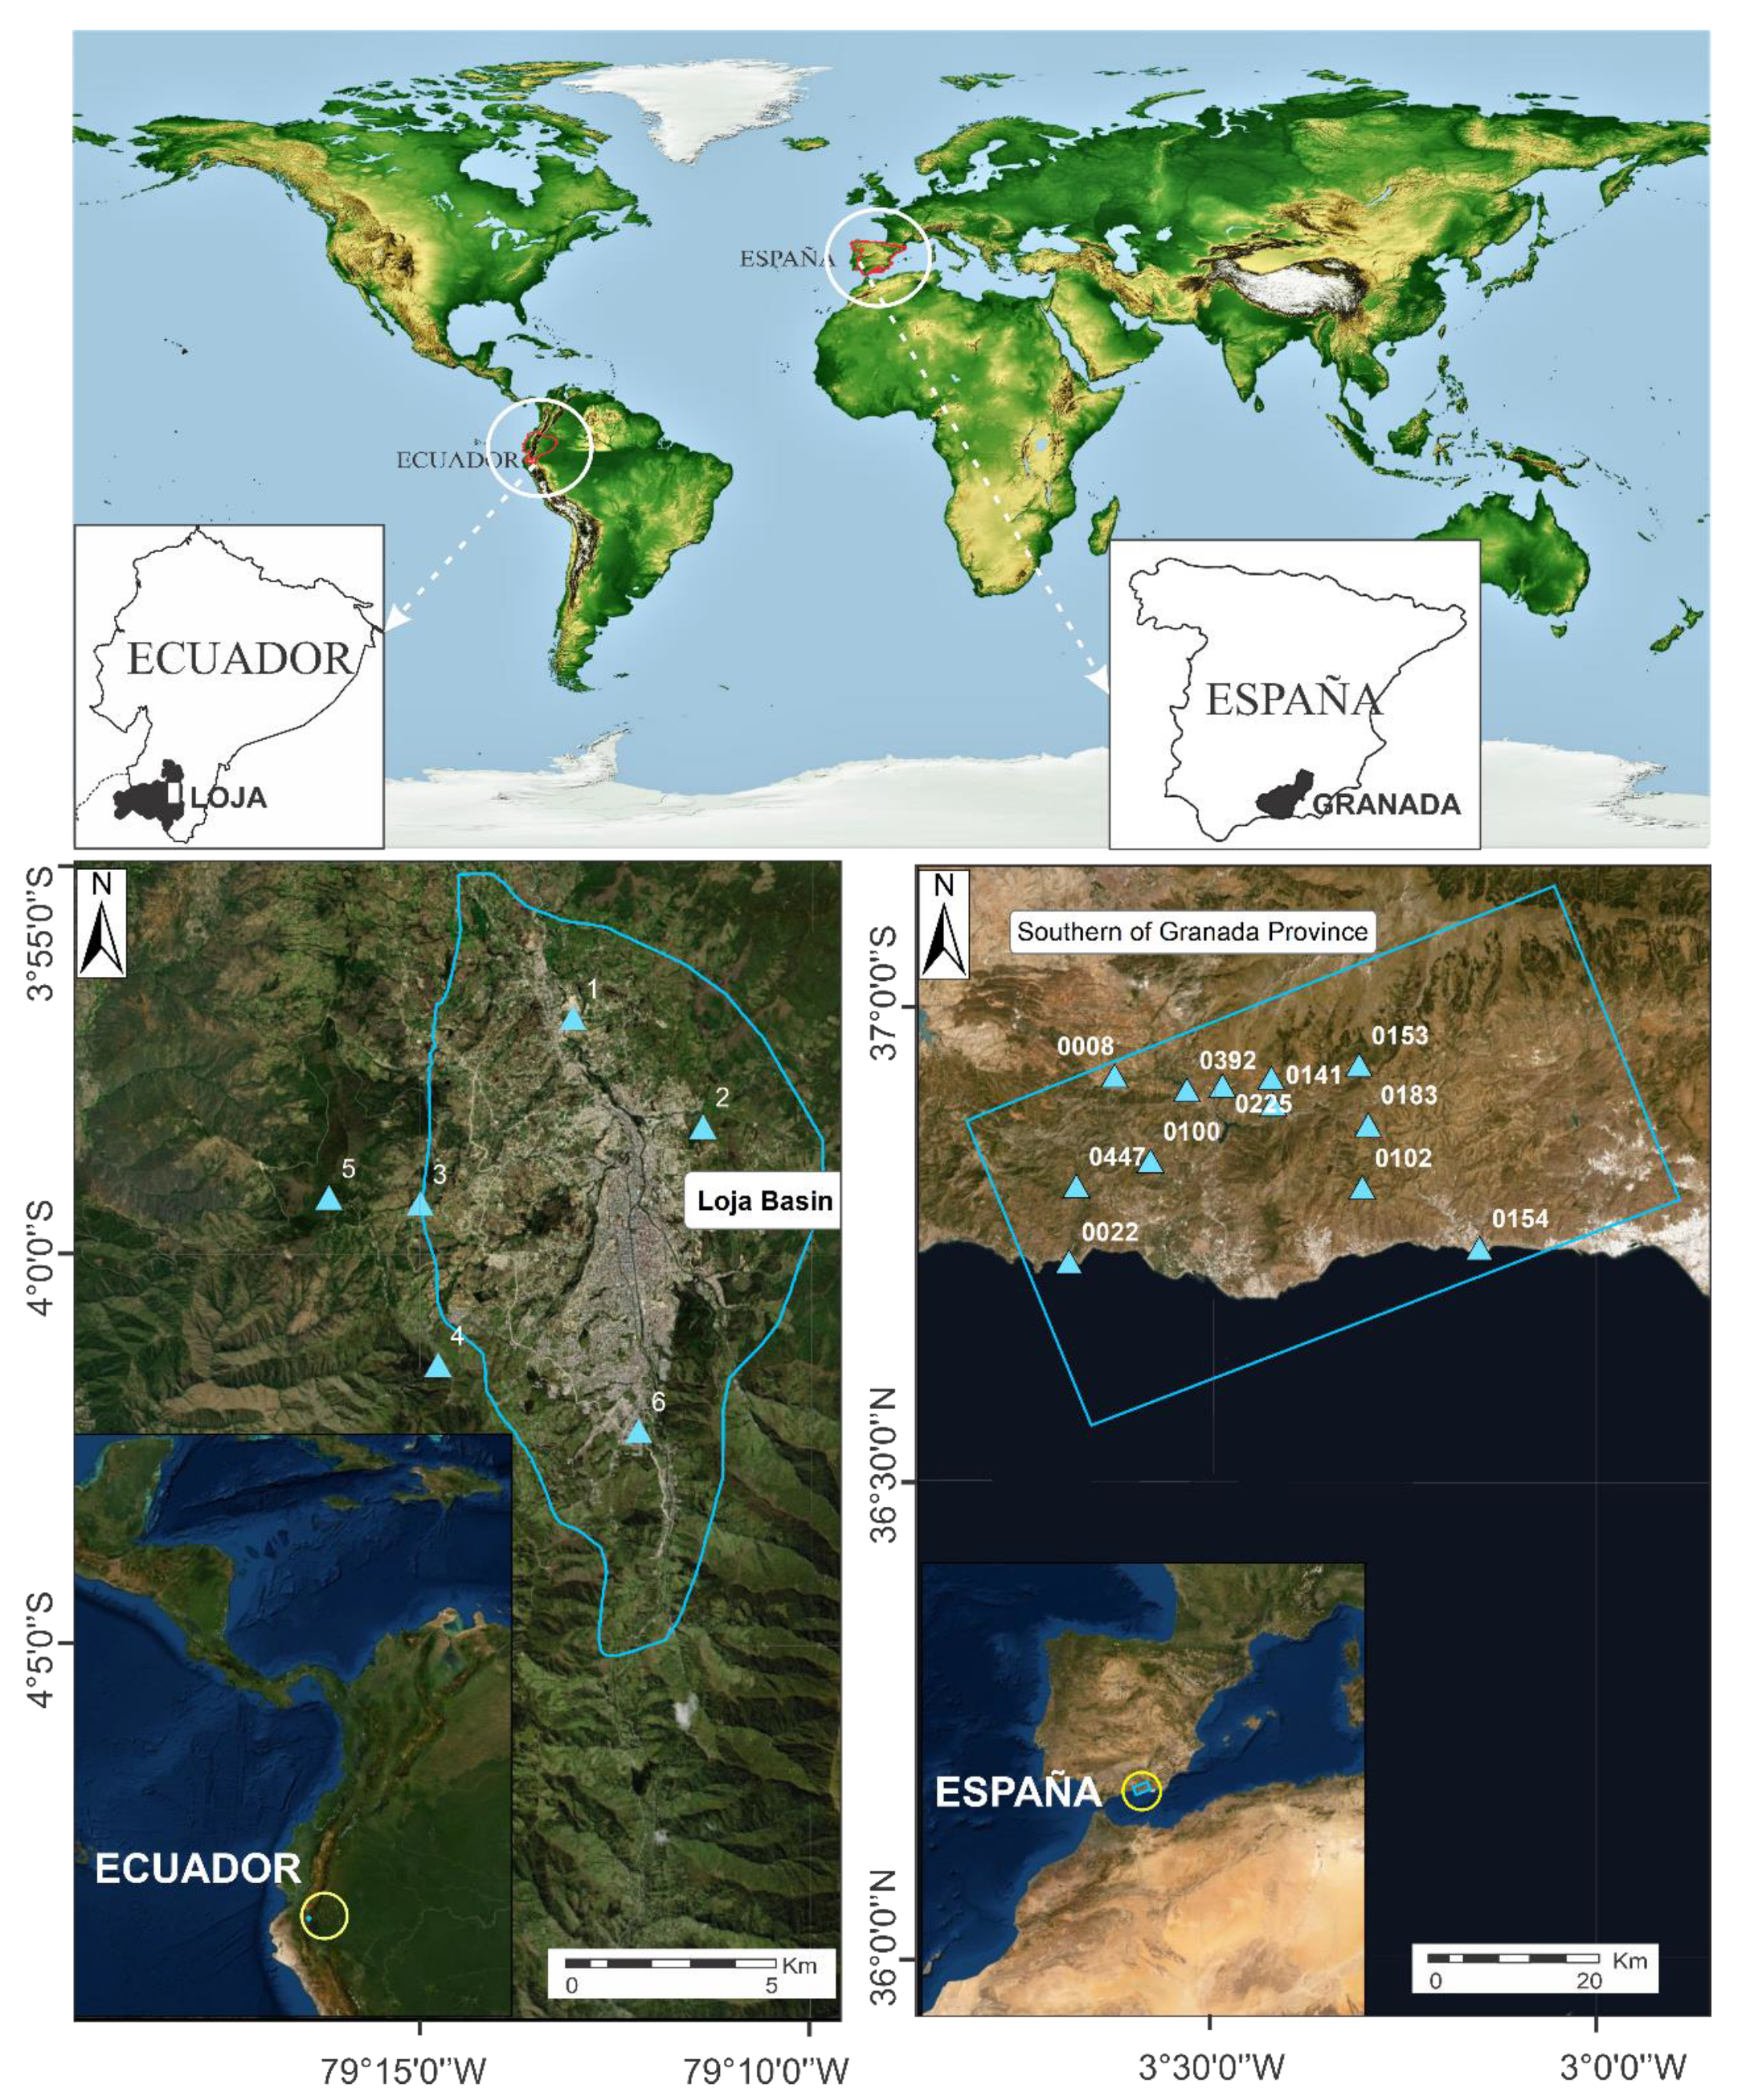
The WeMO index permits the study of rainfall patterns on the Iberian Peninsula, where NAO has a lesser effect [67,68,69]. The WeMO index (WeMOi) is calculated as the standardized pressure difference between Padua (northern Italy) and San Fernando (southeastern Spain) [67].
The literature on the influence of WeMO is very limited. Nevertheless, the research carried out by [69] analyzed the dependency of rainfall on the WeMO index (WeMOi) in Catalonia (northeastern Spain). They applied the Pearson correlation coefficient to the subperiods 1951–1981 and 1983–2014. The first subperiod showed a significant negative correlation between annual rainfall totals and WeMOi, while in the second interval, this significant correlation disappeared completely. It was also observed that the decrease in WeMO was followed by a decrease in the variability of several rainfall indices, such as the variation coefficient (VC) and the consecutive disparity index (S1), though not for the CI (daily concentration index). Thus, it was demonstrated that WeMO also has the potential to identify the degree of rainfall variability. The WeMO was more sensitive for rainfall series with greater VCs, but had almost null influence in the summer storms when the baric gradient was low [69].

3. Study Areas

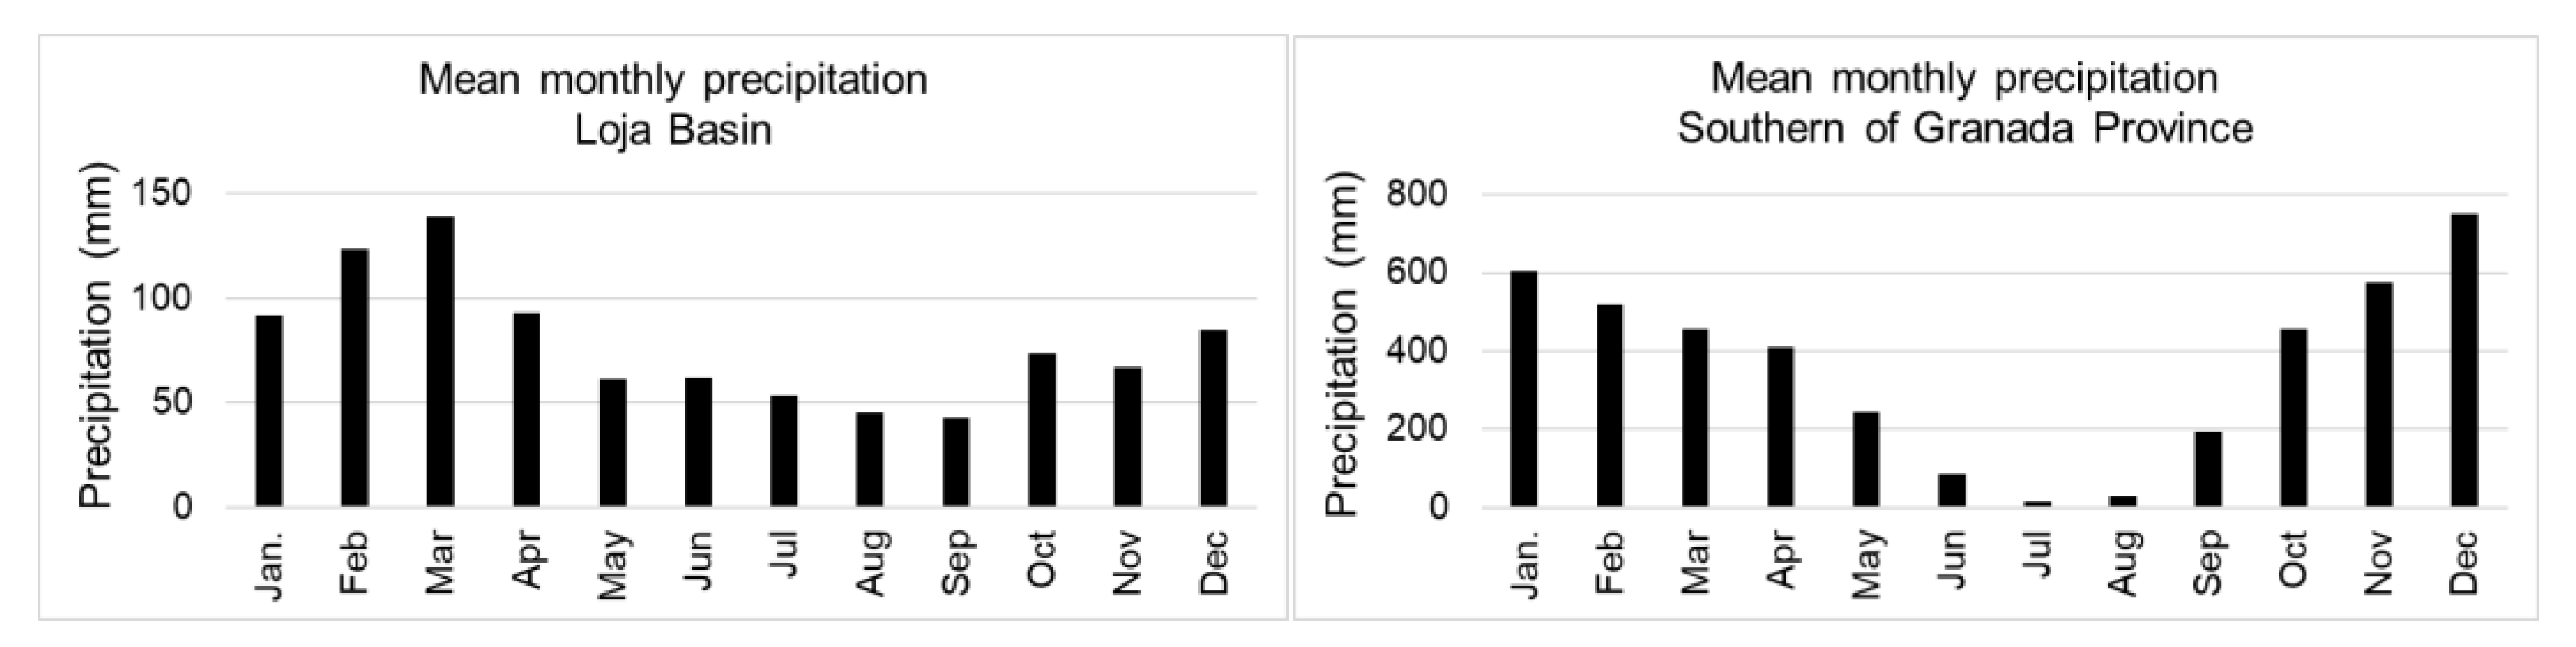
3.1. Loja Basin (Southern Ecuador)

The area of the Loja Basin is characterized by a climate classed as warm and fully humid with a warm summer (Cfb) [70] at an average elevation of 2100 m a.s.l., between the meridians 79°10′ and 79°15′, and between the parallels 3°55′ and 4°5′ (Figure 1). The low strength properties of the rocks forming the gentle slopes of the valley, including the city area, appear as a main conditioning factor. This particular geological setting, together with low but very continuous daily rainfall, is the main cause of the frequent occurrence of landslides in this area [27]. This valley presents an average monthly temperature of 16.2 °C, reaching minimums in the coldest month of July (14.9 °C), and its average annual rainfall is 917 mm [71]. The continuity of the rainfall is represented by 59% of the pluviometry records gathering quantities with a mean of 2.56 mm/24 h, and with the rainiest season concentrated from December to April. The histogram depicting the monthly rainfall for the record covering the years ranging from 1964 to 2015 shows maximum convexity during the October–April period (Figure 2). It is in this period when storms and longer precipitation periods trigger floods and mass movements. The weather in the southern part of Ecuador is mainly controlled by the global pressure systems of the subtropical highs over the Atlantic Ocean and the subtropical high over the southeastern Pacific. These systems contribute to the main westward wind streams arriving in southern Ecuador through the mid-level layers (~850 to ~400 hPa) [72].
The Loja Basin is one of several Neogene intramontane basins that have been described in southern Ecuador. Geologically, it is a sedimentary basin of lacustrine origin of the Miocene–Pliocene age, with lithologies such as coarse-grained sandstones with intercalated sediments and conglomerates, thick beds of massive limestone and layers of marl, and fine-grained sandstones and clays [73]. These sediments are layered on a metamorphic bedrock formed by impure fine to medium grain quartzites, black phyllites, slates, and schists (some graphitic) of the Paleozoic age, forming the lowest part of a mountain chain with elevations of approximately 2700 m a.s.l.
In the case of the Loja basin, the files of the Ecuadorian Secretary for Risk Management (SNGR) and the newspapers “La Hora” and “El Comercio” were reviewed to extract essential information on landslides caused by hydrological events. This review complemented previous research work [15] to extract essential information on landslides caused by hydrological events. Thereafter, it was possible to date up to 93 landslide events. The information reviewed did not contain specific data on the types and geometries of the catalogued landslides. However, from previous studies ([27] and references therein), it is known that the mass movements found in this area are commonly (85%) of the very slow or creep type, such as earth-slide or earth-flow, and the complex types of the Cruden and Varnes (1996) classification. They are very slow or creep landslides that accelerate gradually and become flows after high precipitation events. The analysis focused on these types of landslides because they are the most common and harmful in the study area. It also focused on applied superficial type landslides, whose fault planes reach up to approximately 30 m.
The most characteristic landslides in the Loja Valley have lengths ranging from 100 to 250 m and widths ranging from 60 to 150 m, which occur on slopes ranging from 10° to 40°. These are mainly associated with the clays, siltstones, and colluvial deposits of the Loja sedimentary basin (Figure 3). Mineralogical analyses show that the main factor causing landslides is the presence of active clay minerals in the geological formations involved [27].

3.2. Southern Granada (Southern Spain)

The area studied in the south of the province of Granada is located on the southern slopes of the Sierra Nevada in the Betic Cordillera with a general S–SW direction. The enclosed area, with an extension of about 2370 km2, covers heights from 5 to 1450 m and extends between the meridians 3°07′ and 3°29′W and between the parallels 36°41′ and 36°′56N (Figure 1). The climate changes from arid-steppe to cold-arid (BSk) at the base of the mountains, to an arid-steppe hot-arid (BSh) zone on the coastal plain [75]. In this zone, the rainy and wet season is also related to the monthly interval running from October to April (Figure 2), with an average temperature of 16 °C and minimums at higher elevations. The summer period is dry, and temperatures can exceed 40 °C. The mean annual precipitation reaches 650 mm, and the main system controlling the weather is the Azores anticyclone. In winter, the Azores anticyclone high-pressure band is located between 40° and 30°N, leaving the progression of the Polar Front and Iceland Low moving downwards, which generates the majority of convections in this region [76]. However, in the warm-dry season, stormy weather is caused by the movement of the Azores anticyclone to the area between the latitudes 35° and 55°N, when the Polar Front and the Subtropical Jet cloud systems enter the study area. Elevation plays an important role in this zone as an altitudinal gradient that generates cold temperatures and a rainfall gradient [13]. The south of the province of Granada is located in the Internal Zone of the Betic Cordillera, which is mainly characterized by metamorphic rocks belonging to the Nevado-Filabride complex, composed of Triassic calc-schists, marbles, phyllites, and quartzites [77], and the Alpujarride complex, with dark schists and feldspathic mica-schists. These materials form the southern flank of the antiform of the Sierra Nevada, which has steep slopes. The lower part of these mountains is covered by post-tectonic Neogene and Quaternary deposits, such as marls, silts, and conglomerates. This lithology, combined with the study area geomorphometry of high slopes and deep valleys, is associated with different types of landslides [78,79]. The great number of mass movements in this area is represented by rapid synchronic landslides like rock falls and debris flow affecting the regolith in the upper soil layers and alluvial deposits downslope. However, a common case in the area consists of deeper seated quiescent (or dormant) landsides with intermittent or diachronic activity and inactive landslides. In addition, few cases are related to permanent slides with very slow displacements. Specifically, on the southern border of the part of the Sierra Nevada, which belongs to the Internal Zone, the highest level of instability has been observed, which is related to the periods with the highest precipitation rates. Two major rainfall periods leading to multiple landslide occurrences were seen in the wet seasons of 1996–1997 [80] and 2009–2010 [81] when large amounts of damage affected the roads and villages located in this area. The predominant types catalogued coincided with rockfalls and translational and rotational slides affecting jointed rock mass such as marble, phyllite, and schist, but also coincided with debris flows and complex movements, such as a combination of small translational slides evolving into debris flow. These complex movements and, in general, flow-like landslides developed on regolith and alluvial deposits.
Research has recently been carried out in both study areas with the aim of making progress and generating essential information to better understand the cause-effect relationship between the variance of rainfall and the activation of different types of landslides. The authors of [13,27] determined CRTs relating to mean intensity and duration extracted from rainfall events were causing landslides in the study area south of the province of Granada. In the case of Loja Basin, the relationship between duration and the accumulated rainfall for the rainfall events leading to landslides has been studied [27]. Using this previous work as a starting point, this paper seeks to compare both CRTs by adding the homologous relationship (accumulated rainfall vs. duration) to the case of the southern part of the province of Granada. This relationship has been used conventionally, although alternative CRT functions can be derived by applying simple transformations. For example, ID (Intensity-Duration) threshold curves can be obtained by applying the definition of the mean intensity (accumulated rainfall/duration). The second objective of this research is to correlate the rainfall of the humid season with the indices of climate cycles that create atypical rainfall conditions in these areas. To generate this information, first, the seven-month series are calculated.
Then, the time-series for the mean indices of the climate cycles are also calculated over the same range of humid months, so the positive and negative phases of rainfall and climate cycles can be compared. The graphical results are reported in this document and then contrasted in the discussion. This work will add important information to be utilized for hazard assessment and the predictive models of mass movements in a comparative way for two cases with different climates.

4. Materials and Methods

4.1. Materials

The baseline data are taken from the daily rainfall records available from previous work. These records are formed by using daily rainfall data (mm/24 h) gathered from:
  • La Argelia rainfall gauge in the case of the Loja Basin, which presents the longest record for the area considered. These data were delivered by the INAMHI (Instituto Nacional de Meteorología e Hidrología). The time series collected runs from April 1965 to April 2015.
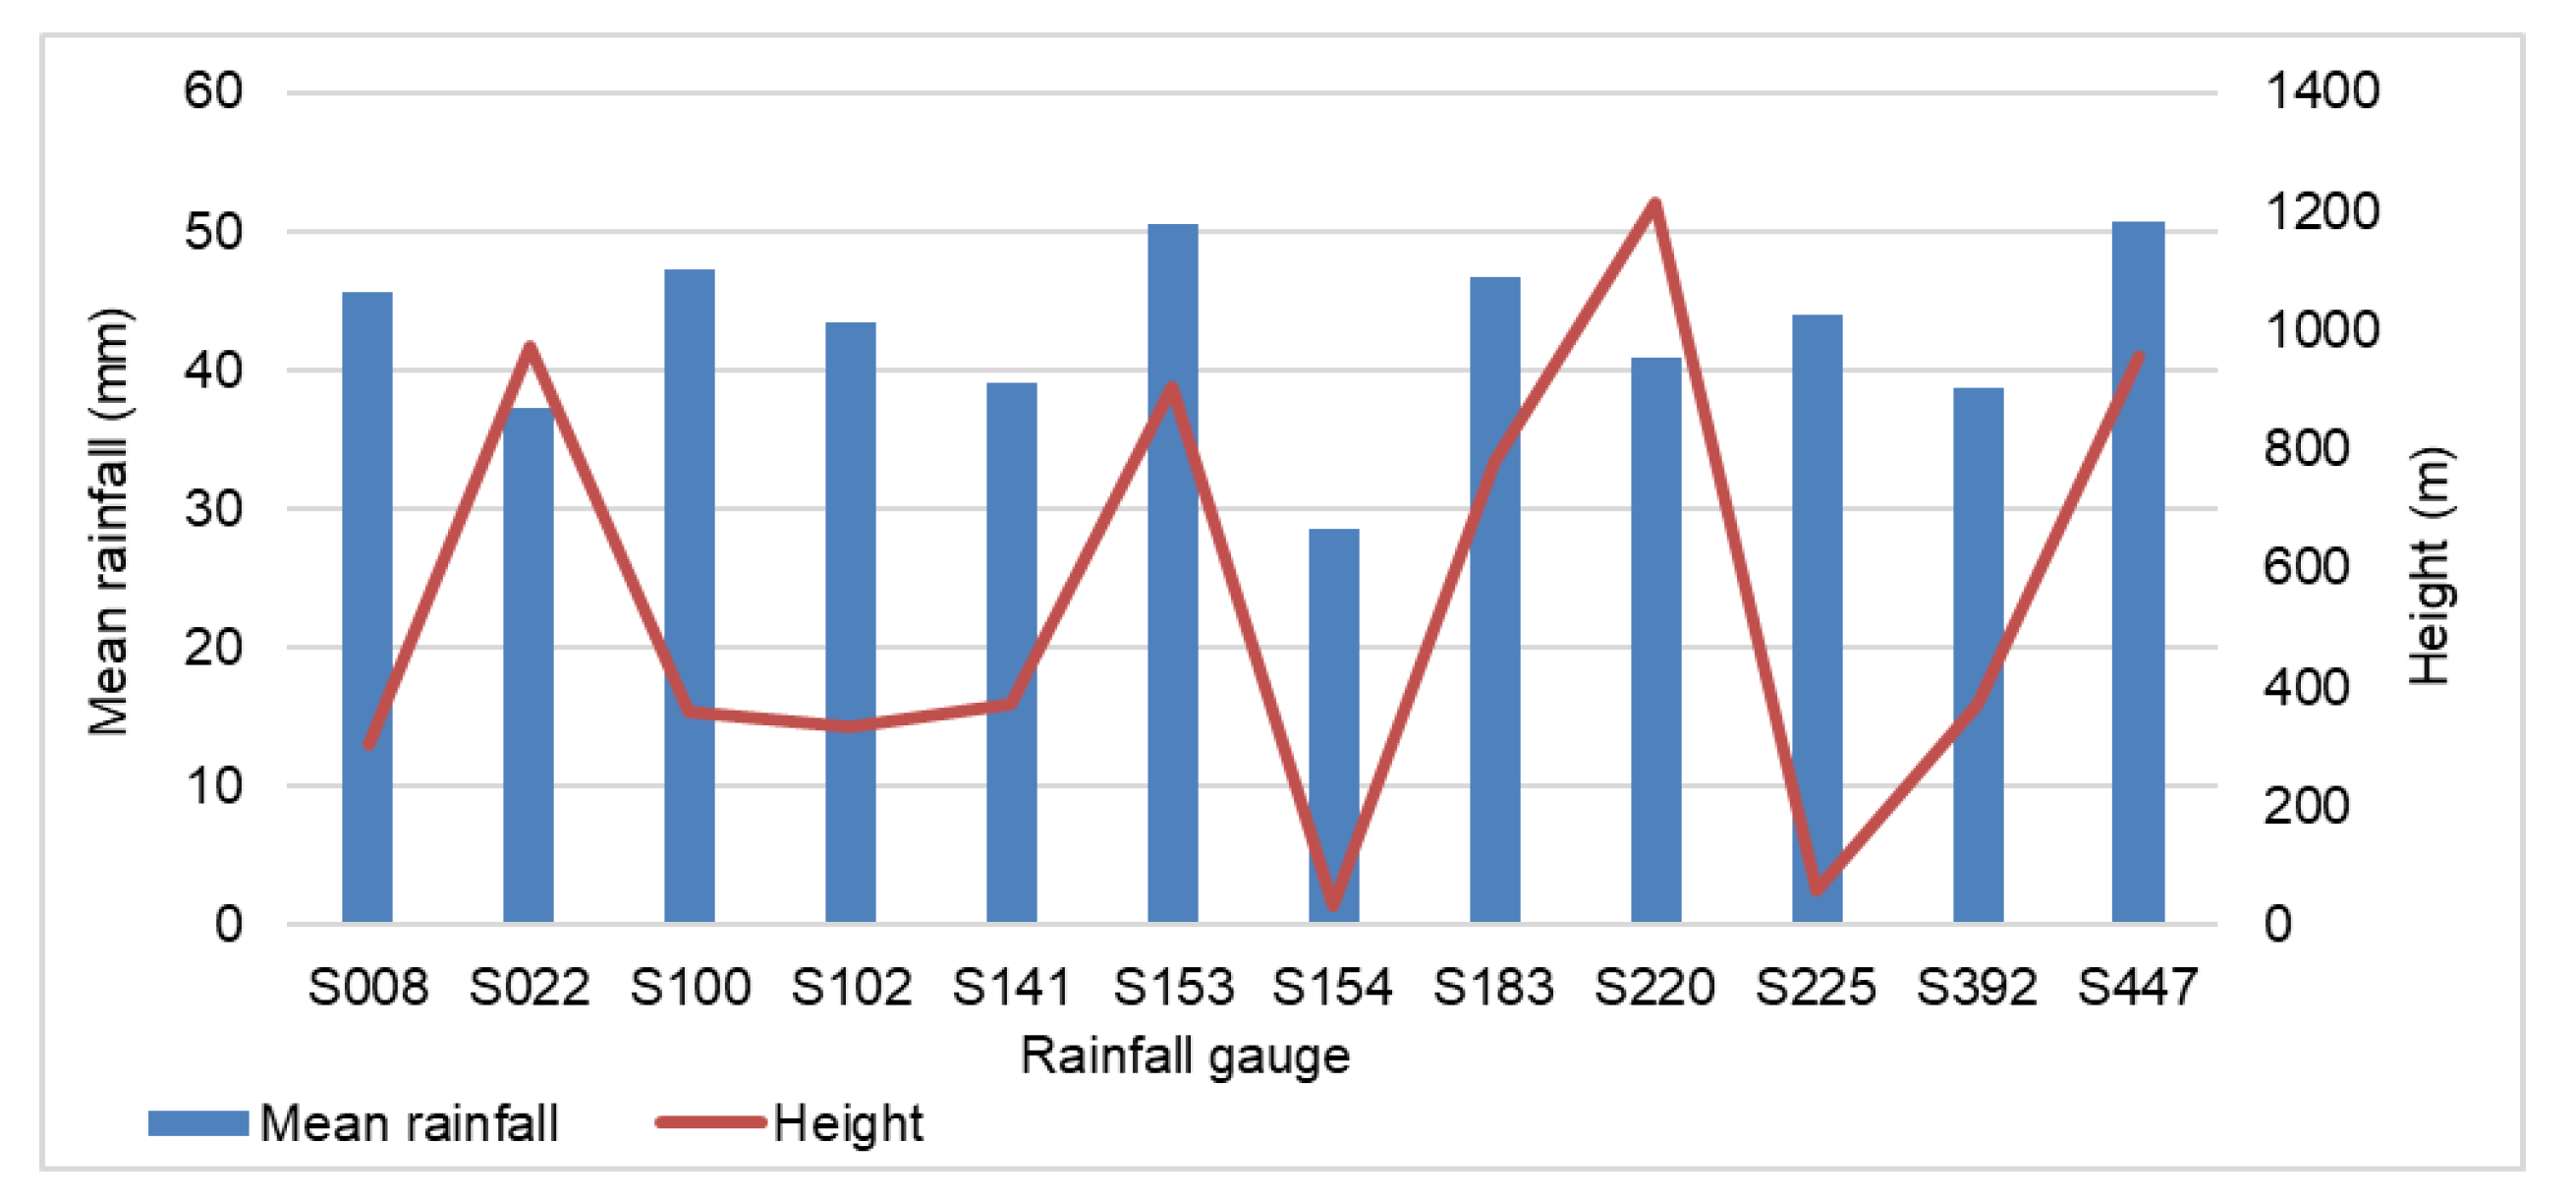
  • Twelve rainfall gauges distributed throughout the study area in the south of the province of Granada. These data were provided by the Regional Water Agency Environmental Information Network and the National Meteorological Institute (AEMET). The times series collected have lengths starting from 1945, except for the cases of the meteorological stations S022, S220, S225, S392, and S447, which started in the years 1947, 1963, 1984, and 2000, respectively. Moreover, in general, these records reach the year 2011, except for the cases of S102, S153, and S220 ending in the years 2004, 2008, and 2010, respectively.
Six rainfall gauges are available in the Loja Basin (Figure 1); however, the only gauge providing a long and continuous record was that of the “La Argelia” meteorological station, so this was selected to extract the accumulated rainfall associated with each landslide event. The 12 rainfall gauges available in the area of southern Granada range between 300 and 1200 m a.s.l (Figure 4), except the rainfall gauges S154 and S225, which are located close to the coastal zone at altitudes of 33 and 60 m. Considering that the formation and extension of the precipitation cells can be affected by this altitude variability and the long dimension of the study area from west to east, the authors of [13] selected the closest rainfall gauges and used the longest records for each catalogued landslide to obtain the CRTs. However, this area constitutes a continuous and nearly homogeneous climate throughout its west-east dimension, composed of the southern face of the Sierra Nevada and the northern slope of the Guadalfeo River valley. This area is nearly homogeneous in its exposition to humid Atlantic winds [82]. It constitutes the windward of the humid winds leading to the known Föhn effect, when the water vapor is forced to rise by the orogenic obstacle through the windward side. Thus, the humid winds reach a sufficient height, resulting in adiabatic cooling and condensation that produce orographic precipitation, while in the northern part of the Sierra Nevada (leeward side) descending winds are drier and warmer. This effect is generalized throughout this study area so the mean monthly rainfall does not change significantly from one measuring site to another. By visually analyzing the mean monthly values for all the stations (Figure 4), it can be deduced that, except for the geographically lower gauges (S154 and S225), there are no significant differences.
However, to verify this effect, the ANOVA (Analysis of the Variance) was applied (Table 1) to contrast the variability of the monthly record registered on every rainfall gauge. By performing this analysis, the hypothesis of similar averages for the distribution of the different rainfall gauges can be accepted (p-value = 0.86). This fact was considered when analyzing the correlation between rainfall and climatic cycles, so averaged monthly rainfall values was obtained by taking into account all the rainfall gauges with the aim of using representative values for the entire area.
The landslide catalogues were gathered as follows:
  • In the case of the Loja Basin, the files from the Ecuadorian Secretary for Risk Management (SNGR) and “La Hora” and “El Comercio” newspapers were reviewed to extract essential information about landslides triggered by hydrological events. For the SNGR database, the data referring to the period from 2010 to 2015 were revised, while for the newspapers, the information available from 2002 was examined. After this review, up to 93 landslide events could be dated.
  • In the case of southern Granada, the newspaper IDEAL provided the majority of the data related to landslides with its first issue from the 8 May 1932 [83]. This information was completed with the data recorded in earlier research work [80]. Given the inconveniences and limited information on landslides, only 20 landslides cases with the minimal information were found for this area.
In addition, the data series for climate indices were downloaded from the following sources:
  • The monthly ENSO (El Niño Southern Oscillation) index for the period 1870–2019 from the NOAA.ESRL [84].
  • The monthly NAO (North Atlantic Oscillation) index for the period 1950–2019 from NOAA.CPC [85].
  • The monthly WeMO (Western Mediterranean Oscillation) index for the period 1821–2018 from the Climatological Group of the Barcelona University [86].

4.2. Methods

The procedure for analyzing the major differences between the two study areas regarding landslide triggering begins by calculating the CRT curves. The detailed methodology to extract the threshold values is presented in Palenzuela et al. [13], which permits the extraction of measurements on accumulated rainfall that coincides with extreme return periods (T). The start and end of the rainfall event is marked by the appearance of one or more consecutive T spikes. These spikes can coincide with a short period of intense rainfall, including the date of the landslide activation or, on the other hand, the anomalous T values can be associated with accumulated rainfall from the days before the date of the landslide. In the latter case, the lagged date of landslide activation is probably due to the time needed for the precipitation to infiltrate and saturate the soil layers above the slip plane. After determining the accumulated precipitation (A) as the magnitude of the rainfall event, its duration (D) and intensity (I) are calculated, as well as the associated return period (T) as the inverse of the frequency. The same CRT connecting A and D is utilized in both study areas with the aim of contrasting the values of the hydrological variables and trends.
The second part of this analysis seeks to compare the relevant climate indices in each study area against the accumulated rainfall during the wettest seasons and the number of landslides collected. Considering the longer duration of the climate variability, which typically lasts about a year to several years [87,88], this interval has been selected to include the more humid period from October to April during which the greater number of landslides were also catalogued. Most of the landslide events collected are related to specific periods with anomalous rainfalls. In the Loja Basin, [27] identified a high number of landslides within the period 2014–2015 associated to 22 rainfall events with a greater return period (up to 3.5 years). Whereas, in the area of southern Granada, the landslides catalogued were concentrated between the wet seasons of 1996–1997 and 2009–2010 [13,80], some of them associated with accumulated rainfall values corresponding to a very low recurrence (up to 40 years). These considerations make it interesting to evaluate the degree of influence that the main climatic teleconnections affecting both study areas could have on the rainfall measured and, therefore, on the landsliding events. Accordingly, in this second part of the analysis, the accumulated rainfall of the wet seasons October to April for both study areas was assessed for the hydrological years of the entire time-series. These time-series were fitting them with linear functions representing central values that were subtracted to better show the variability (oscillation) of such variables. Thus, the greatest variations around 0 represent the positive (wettest periods) and negative spikes (drought periods). Regarding the climate indices, the mean values for the same period are calculated for the time-series of ENSO, NAO, and WeMO indices. After these time-series for the interval of October–April are prepared, their correlation with the accumulated rainfall is evaluated by using the Pearson coefficient.

5. Results

This section presents the main findings related to the characterization and contrasting of the rainfall events triggering landslides in both study areas, as well as the comparison between the variability of climate indices with the accumulated rainfall in the wettest rainy seasons. The outcomes are discussed in the Conclusion section.

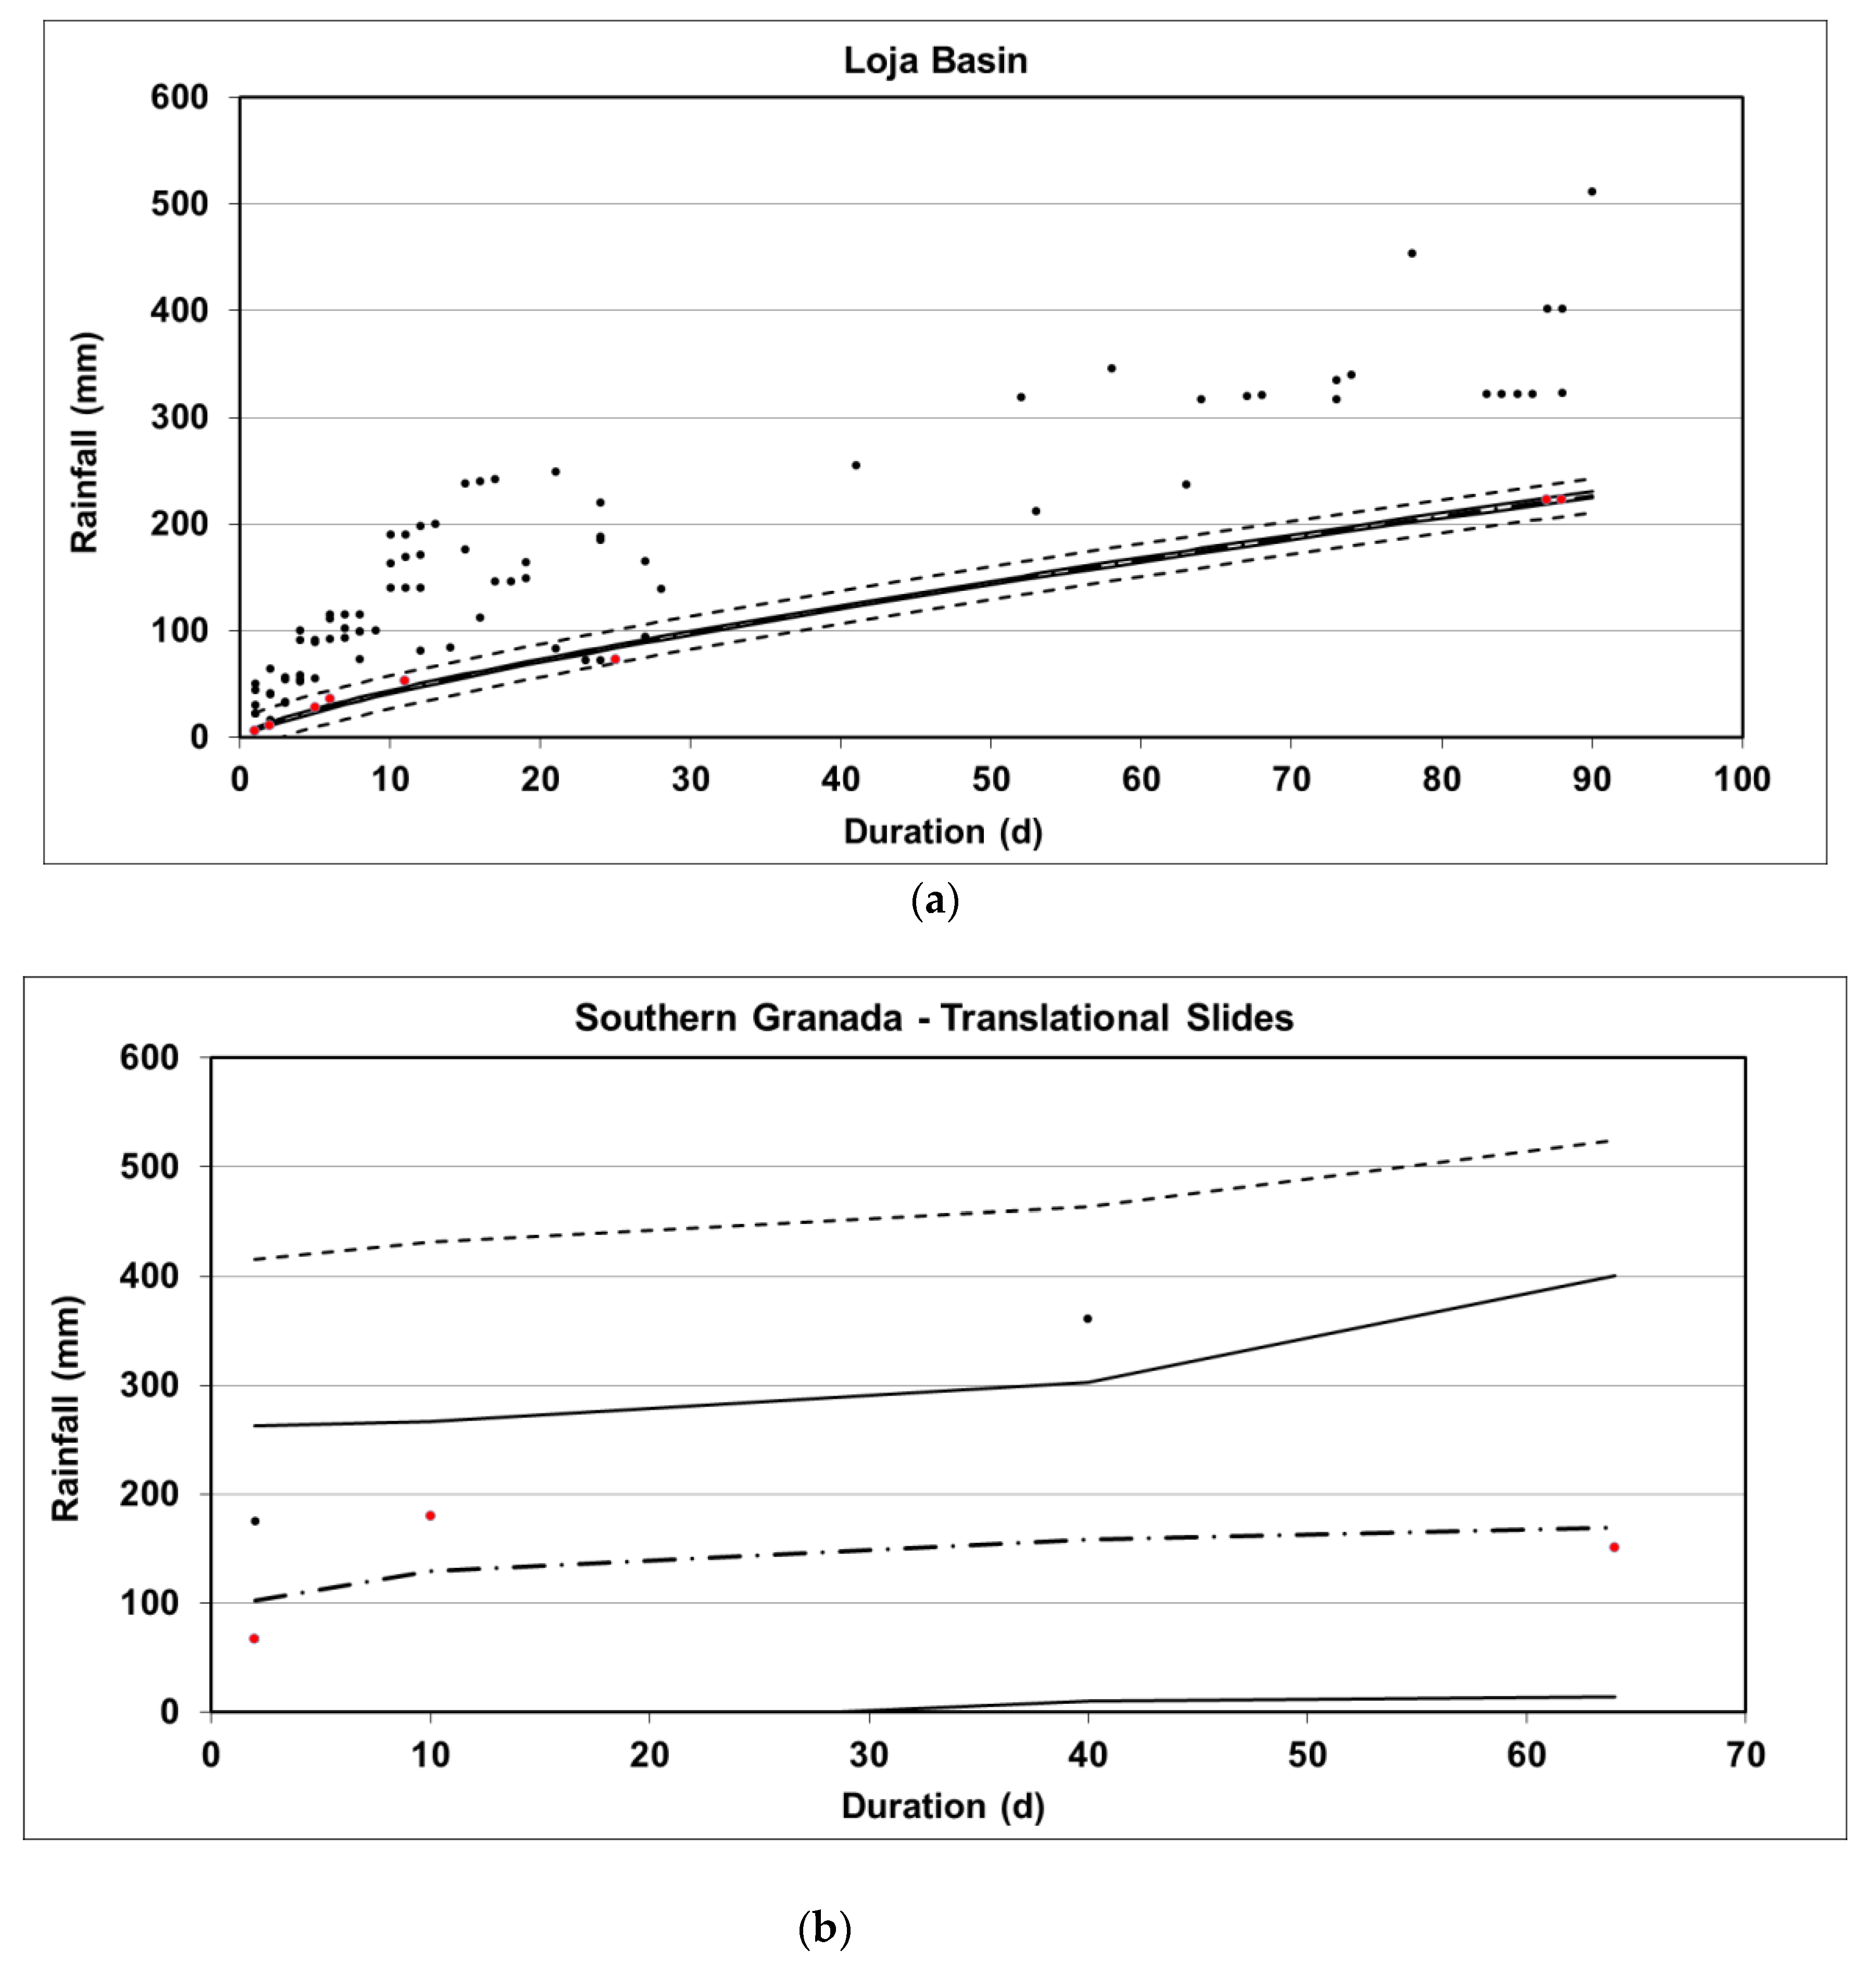
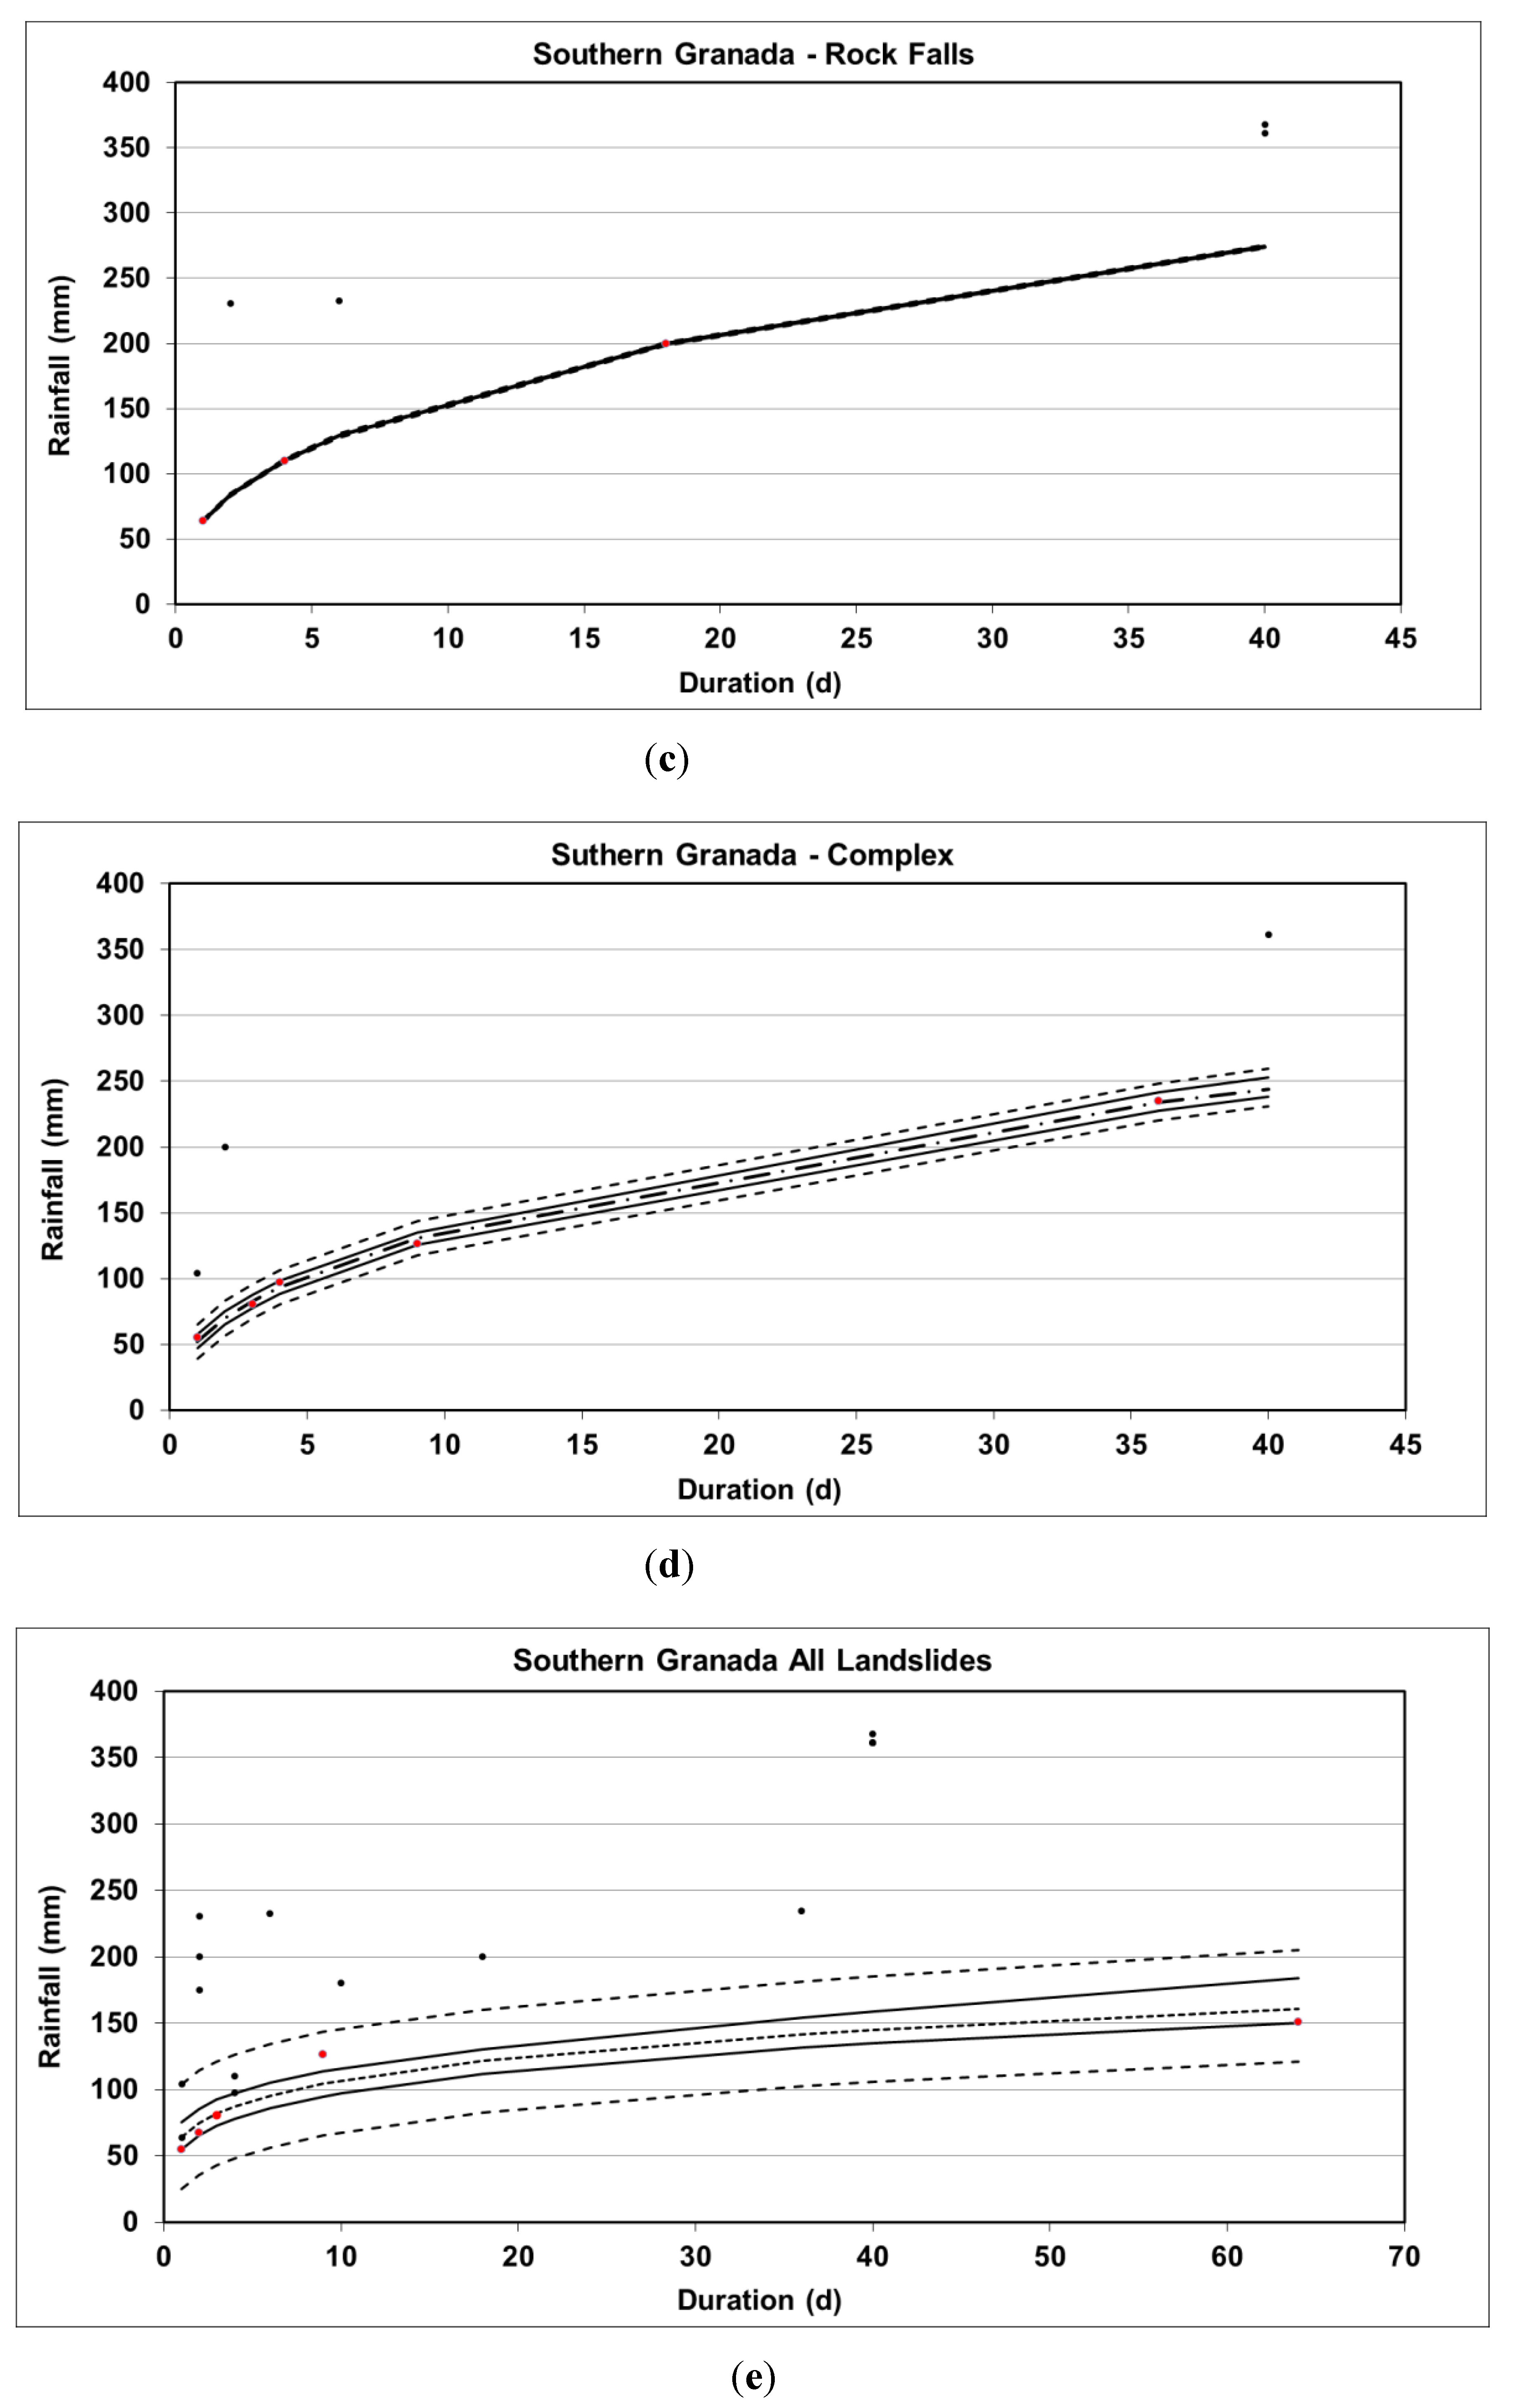
5.1. Critical Rainfall Thresholds

The daily rainfall values corresponding to the landslide dates and the 89 days previous to them were automatically extracted from the rainfall series and added for durations ranging from 1 to 90 days by using VBA (Visual Basic) macros. This operation permitted the calculation of the A, D, I, and T measurements, as explained in Section 4.2, and in-depth in [13]. For comparison, the mean and standard deviation of the rainfall variables for both study areas are summarized in Table 2.
The resulting values of accumulated rainfall and duration for each event generating landslides were represented in a scatter plot, a power-law curve was fitted (Table 3), and the confidence and prediction bounds were added to represent the CRTs for every case. The minimum values of the scatter plot were manually selected to adjust the threshold curve in every case. In addition, the statistical significance was determined by obtaining the determination coefficient R2. In the Loja Basin, a generalization was given for the landslide type as that of very slow mass movements that increased their displacement rates as a consequence of the rainfall events.
This led to a greater amount of data (Figure 5a) to apply to the curve-fitting process, which is shown by its determination coefficient R2 = 1. In the case of southern Granada, the information revised permitted the mass movements to be divided into three types: translational slides (5) (Figure 5b), rock falls (6) (Figure 5c), and complex landslides (8) (Figure 5d), although the mixed case was also considered (Figure 5e). In this case, the CRT function with the lowest statistical significance corresponded to the translational slides, as a very low number of cases were collected for this type with a high dispersion. On the contrary, rock falls and complex mass movements, as well as the mixed case, show high statistical significance. By comparing both study areas, the scaling factor α is lowest in the case of the Loja Basin while the shape factor β coincides with the highest value. This means that the lowest values are needed to activate or reactivate mass movements in this area, but with the increase in duration, the cumulative rainfall increases more quickly than in the case of southern Granada. The different landslide types of the southern Granada area show that translational slides are activated by the highest cumulative rainfall values, while and rock falls and complex slides shows similar activation patterns. As expected, the case involving all the mass movements in southern Granada results in a conservative curve with relative low values when compared with the CRT curves of separated types.

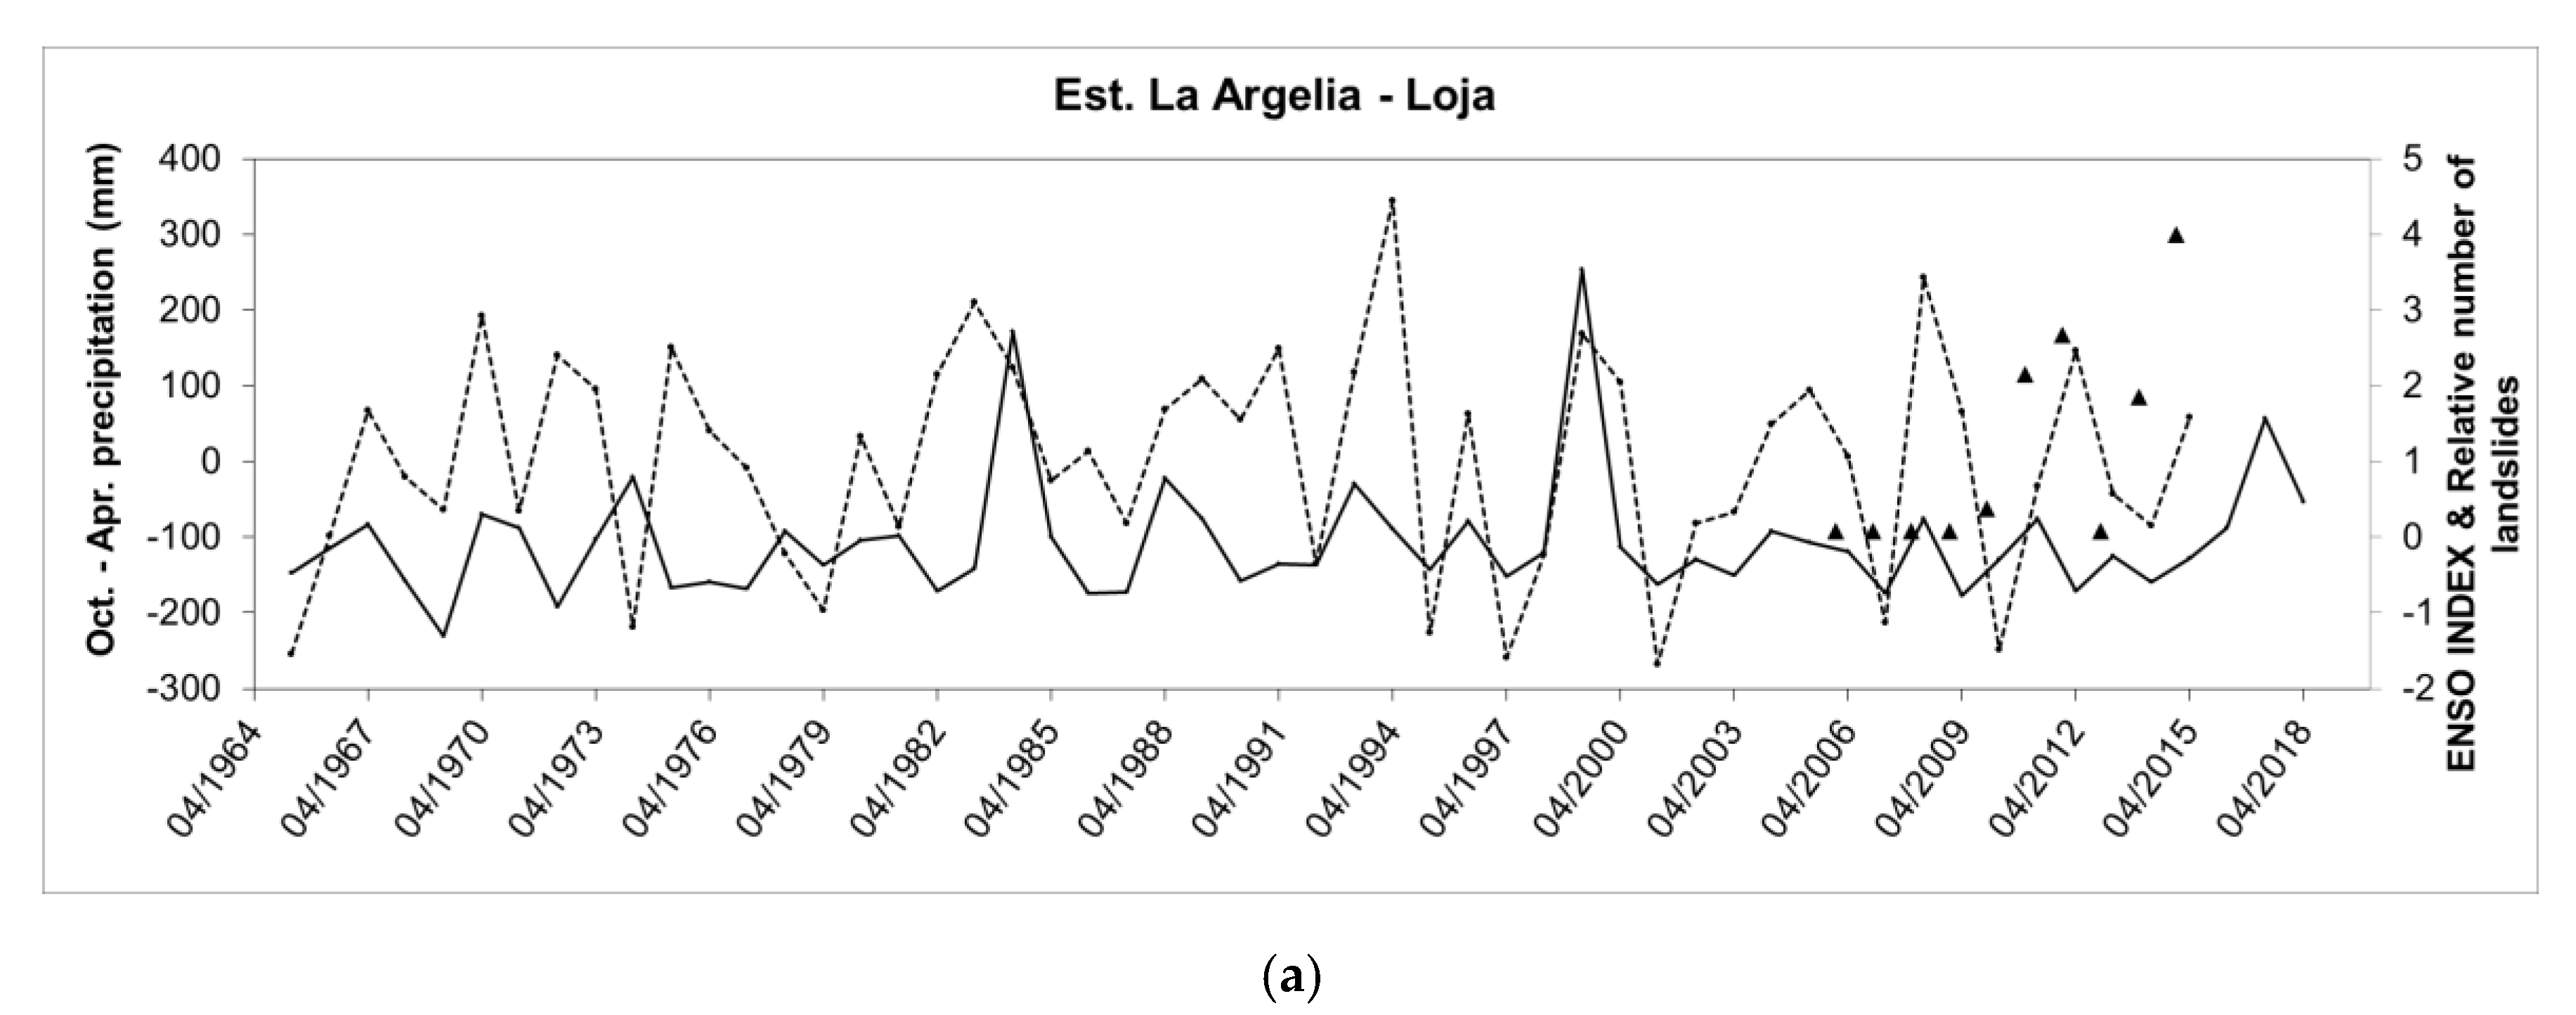
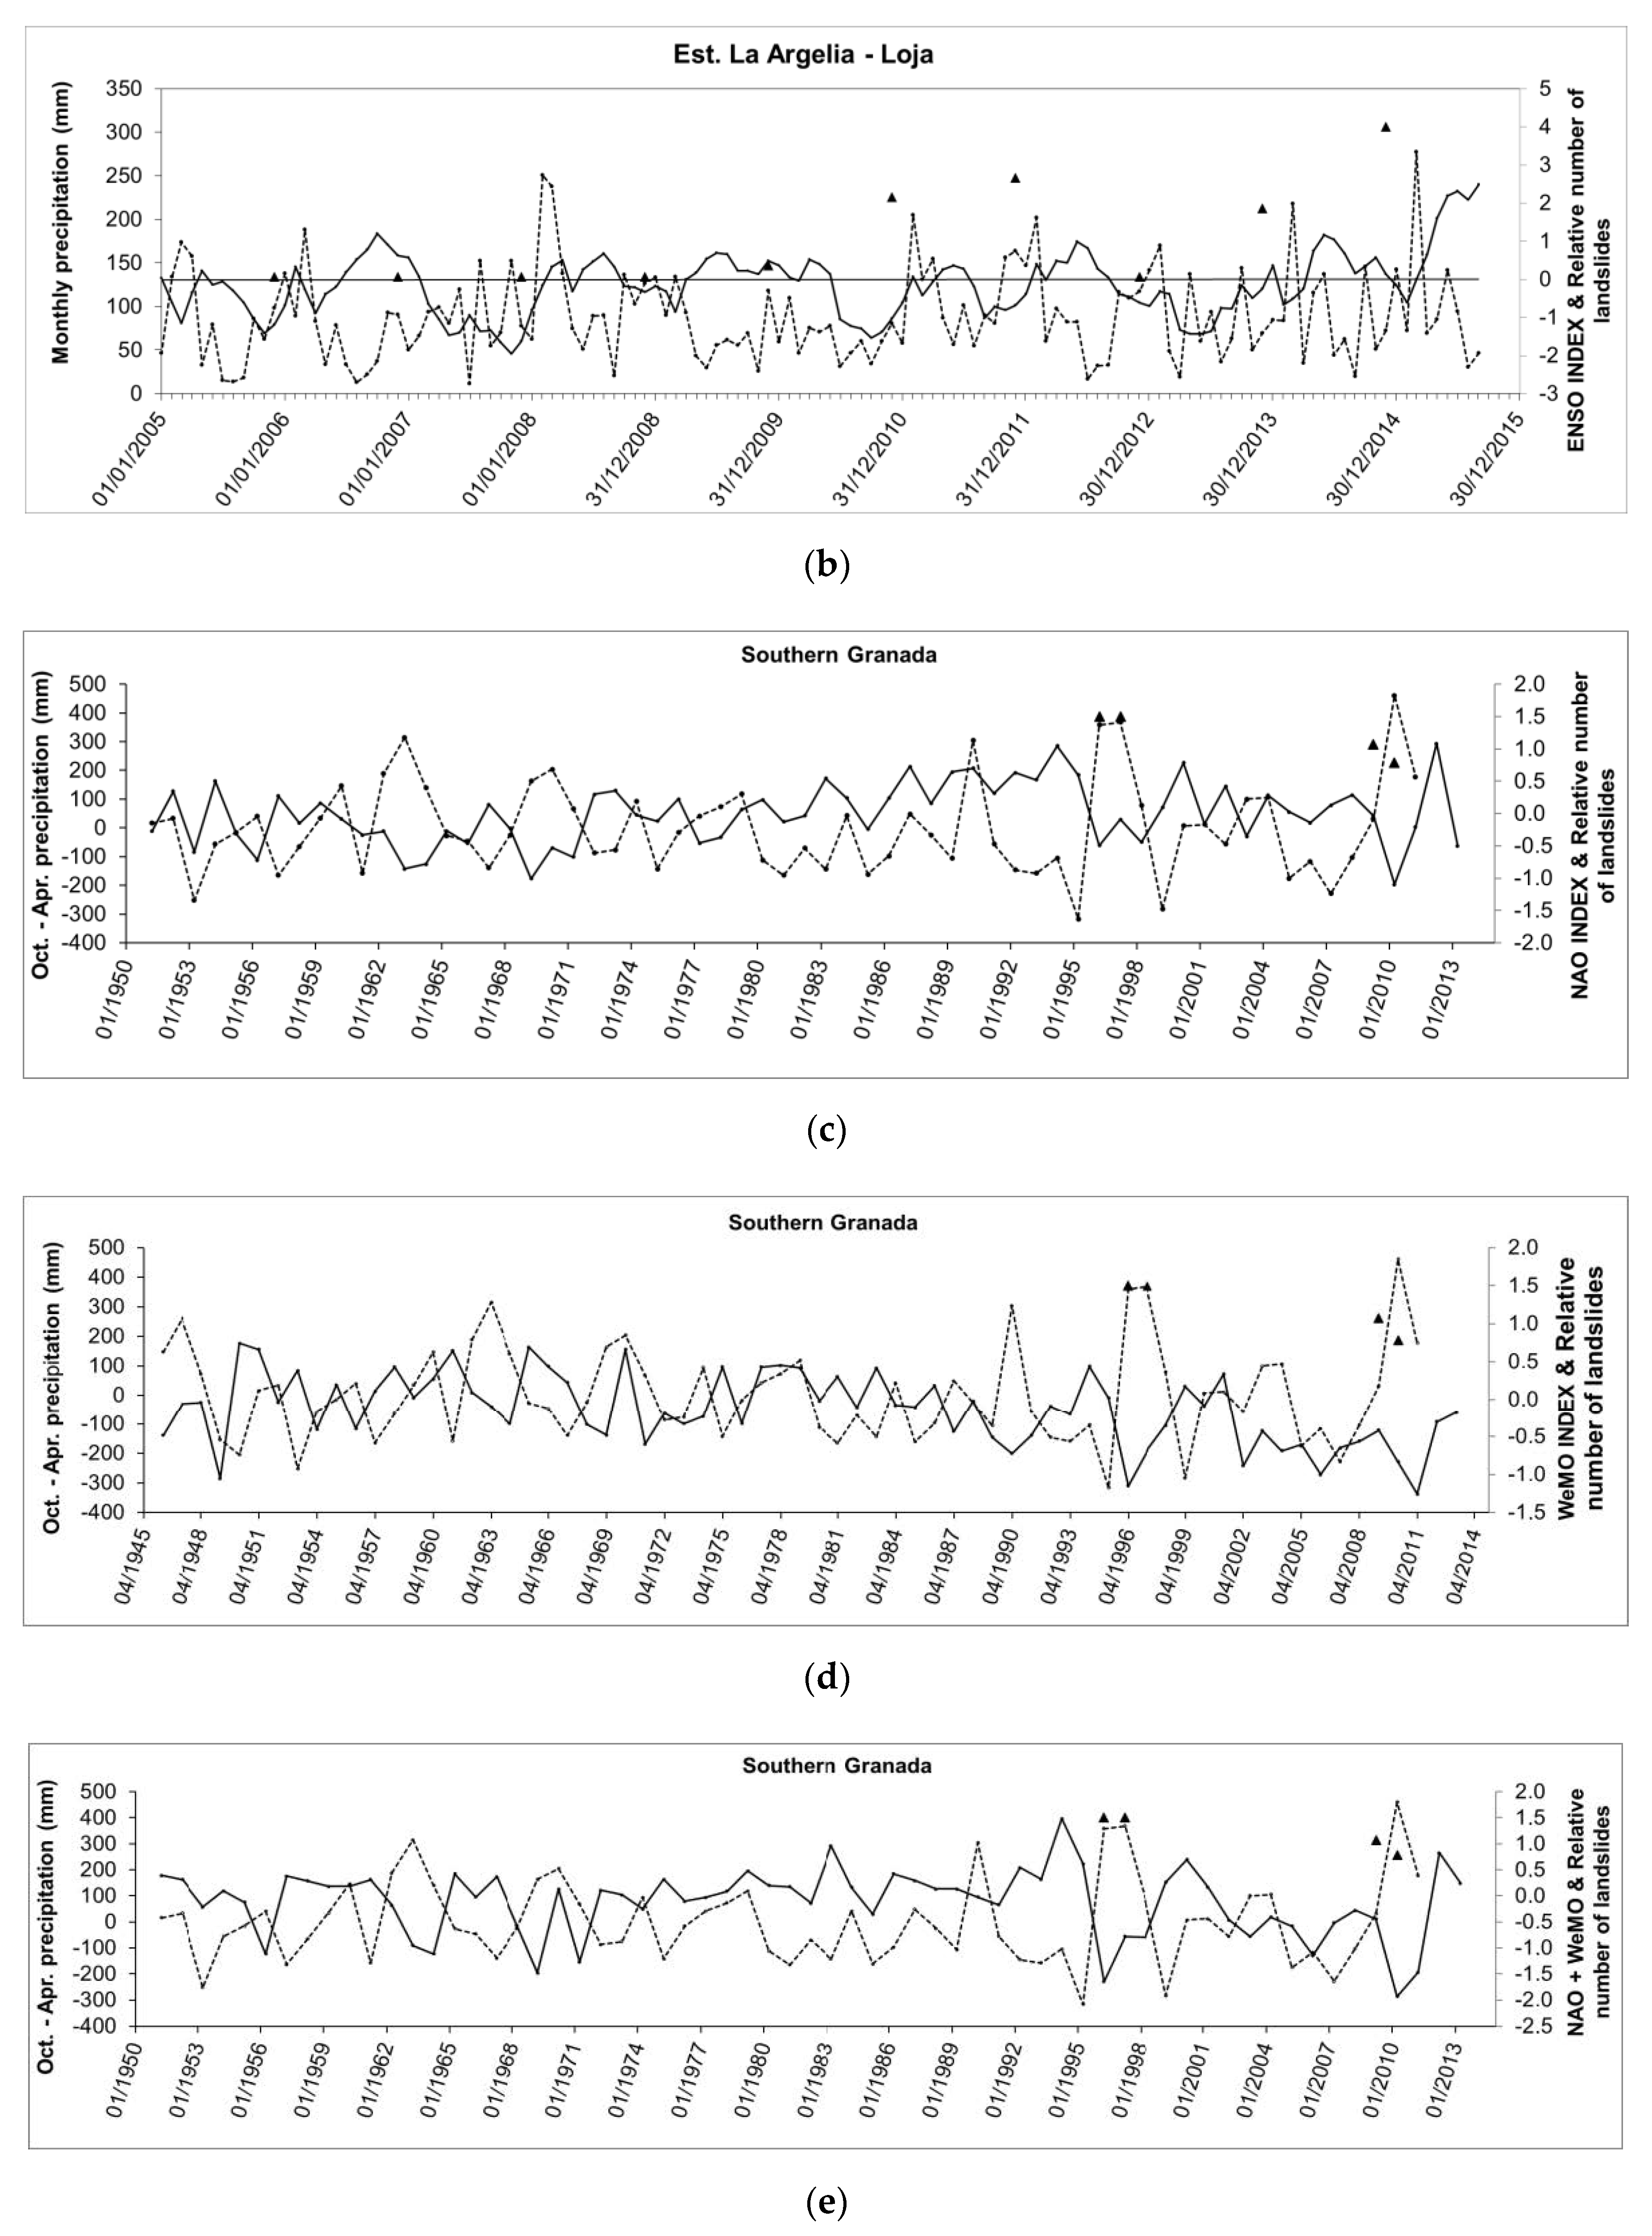
5.2. Correlation Between Teleconnections and Accumulated Rainfall

The accumulated rainfall observed for the wet season October–April was extracted from the time series and plotted together with the more significant short frequency climate indices in the study areas. The visual information shows that, in general, the correlation between the wet seasonal rainfall with the oscillation shown by the climatic-cycle indices is low (from 0.27 to 0.55, as absolute values). The rain gauge of the La Argelia meteorological station was used for the Loja Basin, while for southern Granada, the global average of all the rainfall gauges spatially distributed in the study area was calculated. In the case of the Loja Basin, the positive and negative phases of the accumulated rainfall show numerous coincidences (in phase peaks) with the ENSO index (Figure 6a), and this is confirmed by the positive correlation of 0.27 (Table 2). However, this pattern is not so clear at a monthly scale (Figure 6b). A strong matching can be observed in the periods 1982–1984 and 1999–2000 when the highest rainfall peaks were detected. With regard to the number of landslides, the highest spikes of this variable do not show a clear matching with either the peaks of the ENSO index or the accumulated rainfall. For example, the number of landslides (standardized from 0 to 4 in Figure 6a,b) registered from 2005 to 2010 are equally distributed, independent of the positive and negative peaks of the ENSO index, whereas the peak of the wet season 2007–2008 coincides with a relative maximum (high peak) of the climatic index. On the contrary, the high number of landslides of December 2012 is correlated with a relative minimum of the ENSO. Similarly, two peaks of the relative number of landslides catalogued in December 2012 and December 2014 coincide with two maximums of accumulated rainfall in the wet season. However, the high rainfall peak of 2007–2008, coinciding with a positive peak of the ENSO index, shows a low landslide count. In the case of southern Granada, the visual analysis shows many of the relative minimums and maximums of NAO coinciding with the opposite phases of the variation of rainfall (e.g., in yearly intervals from 1962–1964, 1968–1971, 1971–1973, 1991–1995, 1995–1997, and 2009–2011) (Figure 6c), but there are also numerous peaks with the same phase, which explains the low correlation coefficient (Table 4). The same relationship, although lower, is shown by the graphs with the WeMO (Figure 6d). However, when the two phases of NAO and WeMO are added together, the correlation with the accumulated rainfall reaches its highest value (Figure 6e), with a Pearson coefficient of –0.55.
Table 5 shows specific values for the hydrological years with well-documented landslides in the zone of Granada. In this case, the two periods with the maximum number of landslides generated during extremely humid seasons (1996–1997 and 2008–2009) fall within the amplitude of two significant minimums (negative spikes) of the NAO and NAO + WeMO indices.
Thus, in general, low correlations were identified and a well-defined cause-effect link cannot be determined. This fact can be attributed to one or both reasons: a) the limitation of the existing data, such as incomplete landslide datasets, and b) the complex and changing patterns of the climatic teleconnections.

6. Conclusions

Despite the difficulties hampering progress and accurate results, this work is in line with the main practices in landslide risk mitigation and reduction and provides a contribution to the knowledge generation on landslide hazards. Specifically, this paper analyzes the relationship between landslide development and the climate variability in two mountainous sites of southern Ecuador and southern Spain. As a result, the information derived from this experimental research serves as a reference base in the prevention of hydrological and climatological conditions that most likely lead to landslides of different typology. In addition, a result comparison is depicted from the two areas with different climate and geological settings.
In view of the comparative findings, it is clear that in the case of the humid climate of the Loja Basin with thick layers of residual soils and meteorized rock, landslides occur with lower cumulative rainfall. The average magnitude for the Loja case is in the order of 34% of the mean cumulative rainfall in southern Granada. Similarly, the mean duration of the rainfall events that include the antecedent rainfall until the date on which landslides are reported is slightly higher for Loja than the mean duration in the case of southern Granada. This causes the higher recurrence of landslide events in the Loja Basin, as reported in Soto et al. [27], and only 24% of the rainfall return periods exceeded 1 year. On the contrary, Palenzuela et al. [13] stated that the return period of the first quartile of the catalogued landslides did not exceeded 1.1 years. The extraction of the major rainfall characteristics (accumulated rainfall and duration) related to the activation of landslides was used to estimate the CRTs for both cases. After fitting the power law functions, it was revealed that for the Loja Basin, which has a predominance of very low mass movements, the lowest minimum values are expected to activate/reactivate these landslides when compared with those of southern Granada. This finding is probably related to the wetter climate and greater number of rainy days, which favors a high saturation degree acting as a predisposing factor. In the case of southern Granada, although a lower number of landslides was catalogued, two of the types analyzed—rock fall and complex mass movements—showed maximum statistical significance, while translational slides were weakly fitted due to the minimum number of catalogued events and their plotting dispersion. Under this relationship, the greater activation values of cumulative rainfall were obtained for the case of translational slides with a smooth trend corresponding with a low β value (β = 0.15). On the contrary, lower thresholds are attributed to rock fall, complex landslides, and the global case, including every type of mass movement. This is probably due to the shallower slip-planes and the low shear strength of the materials involved in rock falls and complex slides (mainly shallow slides evolving to debris flow). The curve parametrization also shows similar values in the cases of rock fall and complex landslides, although with higher α for the first type. In addition, the accumulated rainfall for the wettest period for both study cases (October–April) was calculated for all the hydrological years of the precipitation series. The general trend was then subtracted to the new time series from both study areas to highlight their variability. Then, the major climate indices were correlated with the remaining component. Although shorter or longer intervals could be tried, this interval has been selected with the aim of getting insights of the correlation within the more humid period from October to April, coinciding with the period when most of the landslides were catalogued. The findings show a generalized low correlation, although with some matching between the phases of the climatic oscillations and the accumulated rainfall, as well as with the number of landslides. After analyzing the results for the time series of the Loja Basin, low correlation was revealed. The ENSO index presents numerous hydrological years with in-phase coincidences between accumulated rainfall and the ENSO index, but a significant number of cases do not follow this pattern, which makes the degree of correlation decrease. More uncommonly, there are observations between high rainfall peaks and the number of landslides that show a lack of events, or a nearly constant number of them in years when the accumulated rainfall and/or the ENSO index are higher. For the series of southern Granada, the independent correlations between te accumulated rainfall and the indices of NAO and WeMO show negative coefficients. However, the strength of the correlation increases with the combined NAO and WeMO indices, giving a Pearson coefficient of –0.55. This preliminary information is important for hydrological risk management; however, there is low correlation between large scale teleconnections and extreme rainfall that triggered landslides. The low correlation between both variables is probably linked to the complex and non-persistent spatial-temporal patterns of all of the climatic phenomena [29], which makes difficult to understand their history and the causes for their recurrence and intensity. Thus, as stated in the literature [89,90,91] for the ENSO phenomenon, this fact can generate differences in the phases and intensities at the global and local scales. Moreover, terrain features make these patterns even more complex and less uniform in mountain ranges as rainfall cells strongly depend largely on altitude, topographic barriers, and slope expositions [40]. Similarly, the lack of landsliding events in the wet seasons when extreme rainfall was determined is probably due on the one hand to the information biased in space and time. On the other hand, precipitation series cover the dates of the landslide occurrences and antecedent periods and they are considerably long for calculating rainfall frequencies and return periods. However, a longer sampled period for landsliding events would be more suitable for the application of the statistical approach to evaluate this correlation [31], providing more responses of positive (associated with landslides) and negative rainfall events. Thus, the implementation of appropriate practices on landslide recording would improve drastically this type the reliability and accuracy of this type of correlations. Additionally, the measurement of the horary rainfall depth and the monitoring of the piezometric level are of significant importance as a part of alert systems or prediction models at the scale of study-site cases.
In conclusion, a minimal correlation can be determined between climatic phenomena affecting a significant part of global geography and the extreme rainfall-triggered landslides, but results have to be considered as preliminary insights as more detailed information is necessary to accurately define these patterns. The major inconvenience found in this research has been related to the scarce data on landsliding that can be indirectly obtained. In the case of the Loja Basin, the number of landslides dated was higher, but no detailed information could be gathered on the type, thickness, or volume and other characteristics. On the contrary, in the case of southern Granada, the number of landslides collected was lower, but some classes could be assigned to them. Thus, for the future advancements in landsliding hazard and prediction, systematic and appropriate practices to monitor both landslides and rainfall in the spatial and time dimensions is highly recommended in the study areas. This can be developed by implementing recently developed techniques like change detection analysis, or by exploiting the high number of daily satellite images that are currently being recorded and applying automatic and semi-automatic techniques. Nowadays, the integration of mobile and geospatial technologies and paradigms such as Citizen Science (CitSci) and VGI (Volunteered Geographical Information) with the automatic image processing through the implementation of AI (Artificial Intelligence) based models appears as a power instrument to collect new environmental data [92]. Admittedly, to gain statistical significance, an efficient plan for cataloguing and registering in situ data on the type, dimensions, and geotechnical parameters of envisaged landslides is needed, as it is of major importance to calibrate rainfall threshold curves. In addition, the application of time-series decomposition into trends and periodicities (or oscillations) is recommendable to make progress in the prediction of extreme rainfall recurrence. Currently, the modelling and prediction of time-series has been approached by using new advanced data-based models such as soft-computing models or chaotic based models providing the advantage for overcoming the problems of non-linear and non-stationary time-series [93,94]. Additionally, improvements on the accuracy of the prediction on rainfall patterns can be addressed by applying novel precipitation models. However, where landslides have a high recurrence, like in the case of the Loja Basin, forecast models integrating landslide thresholds with physical susceptibility models (i.e., the Hydrological-Geotechnical model) will have an even more important role in the mitigation of different type of landslides.

Author Contributions

Data curation, J.S.L.; Investigation, J.A.P.B.; Methodology, J.A.P.B.; Writing—original draft, J.A.P.B.; Writing—review & editing, J.S.L. and C.I.F. All authors have read and agreed to the published version of the manuscript.

Funding

This research received no external funding

Acknowledgments

This research was supported by the project CGL2008-04854 funded by the Ministry of Science and Education of Spain and by the Ministry of Higher Education, Science, Technology and Innovation (SENESCYT) under the scholarship program “Open Call 2012 Second Phase” of the government of Ecuador. Authors want to acknowledge the Ecuadorian National Meteorological and Hydrologic Institute (INAMHI) and the Ecuadorian Secretary for Risk Management (SNGR-Zone 7) for providing the rainfall records and part of the landslide inventory, respectively.

Conflicts of Interest

The authors declare no conflict of interest.

References

  1. UNESCO. Annual Summaries of Information on Natural Disasters, 1971–1975; UNESCO: Paris, France, 1979. [Google Scholar]
  2. Rib, H.T.; Liang, T. Recognition and identification. In Landslides Analysis and Control; Schuster, R.L., Krizek, R.J., Eds.; Washington Transportation Research Board, Special Report; National Academy of Sciences: Washington, DC, USA, 1978; Volume 176, pp. 34–80. [Google Scholar]
  3. Ayala, F.J.; Elizaga, E.; de González Vallejo, L.I. Impacto Económico y Social de los Riesgos Geológicos en España; ITGE: Madrid, Spain, 1987; p. 134. [Google Scholar]
  4. Suárez, R.R.; Regueiro, M. Guía Ciudadana de los Riesgos Geológicos; I.C.O.G: Madrid, Spain, 1997. [Google Scholar]
  5. Petley, D. Global patterns of loss of life from landslides. Geology 2012, 40, 927–930. [Google Scholar] [CrossRef]
  6. Spizzichino, D.; Margottini, C.; Trigila, A.; Iadanza, C. Landslide impacts in europe: Weaknesses and strengths of databases available at european and national scale. In Landslide Science and Practice; WLF 2011, Rome; Springer: Berlin/Heidelberg, Germany, 2013; pp. 73–80. [Google Scholar]
  7. White, I.D.; Mottershead, D.N.; Harrison, J.J. Environmental Systems, 2nd ed.; Chapman & Hall: London, UK, 1996; p. 616. [Google Scholar]
  8. Aleotti, P. A warning system for rainfall-induced shallow failures. Eng. Geol. 2004, 73, 247–265. [Google Scholar] [CrossRef]
  9. Wieczorek, G.; Glade, T. Climatic factors influencing occurrence of debris flows. In Debris-Flow Hazards and Related Phenomena; Springer: Berlin/Heidelberg, Germany, 2005; pp. 325–362. [Google Scholar] [CrossRef]
  10. Guzzetti, F.; Peruccacci, S.; Rossi, M.; Stark, C.P. Rainfall thresholds for the initiation of landslides in central and southern Europe. Meteorol. Atmos. Phys. 2007, 98, 239–267. [Google Scholar] [CrossRef]
  11. Guzzetti, F.; Peruccacci, S.; Rossi, M.; Stark, C. The rainfall intensity–duration control of shallow landslides and debris flows: An update. Landslides 2008, 5, 3–17. [Google Scholar] [CrossRef]
  12. Vennari, C.; Gariano, S.L.; Antronico, L.; Brunetti, M.T.; Iovine, G.; Peruccacci, S.; Terranova, O.; Guzzetti, F. Rainfall thresholds for shallow landslide occurrence in Calabria, southern Italy. Nat. Hazards Earth Syst. Sci. 2014, 14, 317–330. [Google Scholar] [CrossRef] [Green Version]
  13. Palenzuela, J.A.; Jiménez-Perálvarez, J.D.; Chacón, J.; Irigaray, C. Assessing critical rainfall thresholds for landslide triggering by generating additional information from a reduced database: An approach with examples from the Betic Cordillera (Spain). Nat. Hazards 2016, 84, 185–212. [Google Scholar] [CrossRef]
  14. Ibsen, M.-L.; Brunsden, D. The nature, use and problems of historical archives for the temporal occurrence of landslides, with specific reference to the south coast of Britain, Ventnor, Isle of Wight. Geomorphology 1996, 15, 241–258. [Google Scholar] [CrossRef]
  15. Caine, N. The Rainfall Intensity: Duration Control of Shallow Landslides and Debris Flows. Geogr. Ann. Ser. APhys. Geogr. 1980, 62, 23–27. [Google Scholar] [CrossRef]
  16. Innes, J.L. Debris flows. Prog. Phys. Geog. 1983, 7, 169–501. [Google Scholar] [CrossRef]
  17. Corominas, J.; Moya, J. Reconstructing recent landslide activity in relation to rainfall in the Llobregat River basin, Eastern Pyrenees, Spain. Geomorphology 1999, 30, 79–93. [Google Scholar] [CrossRef]
  18. Zêzere, J.; Rodrigues, M. Rainfall Thresholds for Landsliding in Lisbon Area (Portugal). In Proceedings of the Conference: 1st European Conference on Landslides, Lisse, Prague, 24–26 June 2002. [Google Scholar]
  19. Annunziati, A.; Focardi, A.; Focardi, P.; Martello, S.; Vannocci, P. Analysis of the rainfall thresholds that induced debris flows in the area of Apuan Alps Tuscany, Italy (19 June 1996 storm). In Proceedings of the EGS Plinius Conference on Mediterranean Storms, Maratea, Italy, 14–16 October 1999. [Google Scholar]
  20. Giannecchini, R. Rainfall triggering soil slips in the southern Apuan Alps (Tuscany, Italy). Adv. Geosci. 2005, 2. [Google Scholar] [CrossRef] [Green Version]
  21. Govi, M.; Mortara, G.; Sorzana, P. Eventi idrologici e frane. Geol. Appl. Ing. 1985, 20, 359–375. [Google Scholar]
  22. Cardinali, M.; Galli, M.; Guzzetti, F.; Ardizzone, F.; Reichenbach, P.; Bartoccini, P. Rainfall induced landslides in December 2004 in south-western Umbria, central Italy: Types, extent, damage and risk assessment. Nat. Hazards Earth Syst. Sci. 2006, 6, 237–260. [Google Scholar] [CrossRef]
  23. Terlien, M.T.J. The determination of statistical and deterministic hydrological landslide-triggering thresholds. Environ. Geol. 1998, 35, 124–130. [Google Scholar] [CrossRef]
  24. Pasuto, A.; Silvano, S. Rainfall as a triggering factor of shallow mass movements. A case study in the Dolomites, Italy. Environ. Geol. 1998, 35, 184–189. [Google Scholar] [CrossRef]
  25. De Vita, P. Fenomeni di instabilità delle coperture piroclastiche dei Monti Lattari, di Sarno e di Salerno (Campania) ed analisi degli eventi pluviometrici determinanti. Quad. Geol. Appl. 2000, 7, 213–235. [Google Scholar]
  26. Chleborad, A.F. Preliminary Evaluation of a Precipitation Threshold for Anticipating the Occurrence of Landslides in the Seattle, Washington, Area; Open-File Report 03-463; US Geological Survey: Reston, VA, USA, 2003.
  27. Soto, J.; Palenzuela, J.A.; Galve, J.; Luque-Espinar, J.A.; Azañón, J.; Tamay, J.; Irigaray, C. Estimation of empirical rainfall thresholds for landslide triggering using partial duration series and their relation with climatic cycles. An application in southern Ecuador. Bull. Eng. Geol. Environ. 2017. [Google Scholar] [CrossRef]
  28. Walker, G.T. Correlation in seasonal variation of weather. VIII: A preliminary study of world weather. Mem. India Meteorol. Dep. 1923, 24, 75–131. [Google Scholar]
  29. HF, D.; GN, K. Atmosferic teleconnections associated with the extremes phases of Southern Oscillation. In El Niño Historical and Paleoclimatic Aspects of the Southern Oscillation; Diaz, M., Ed.; Cambridge University Press: Cambridge, UK, 1992; pp. 7–28. [Google Scholar]
  30. Salinger, M.J.; Lefale, P. The occurrence and predictability of extreme events over the southwest pacific with particular reference to ENSO. In Natural Disasters and Extreme Events in Agriculture: Impacts and Mitigation; Springer-Verlag: Heidelberg/Berlin, Germany, 2005; pp. 34–49. [Google Scholar] [CrossRef]
  31. Froude, M.J.; Petley, D. Global fatal landslide occurrence from 2004 to 2016. Nat. Hazards Earth Syst. Sci. 2018, 18, 2161–2181. [Google Scholar] [CrossRef] [Green Version]
  32. Sepúlveda, S.A.; Petley, D.N. Regional trends and controlling factors of fatal landslides in Latin America and the Caribbean. Nat. Hazards Earth Syst. Sci. 2015, 15, 1821–1833. [Google Scholar] [CrossRef] [Green Version]
  33. Grimm, A.M.; Tedeschi, R.G. ENSO and Extreme Rainfall Events in South America. J. Clim. 2009, 22, 1589–1609. [Google Scholar] [CrossRef]
  34. Aparicio-Effen, M.; Arana, I.; Aparicio, J.; Cortez, P.; Coronel, G.; Pastén, M.; Nagy, G.J.; Galeano Rojas, A.; Flores, L.; Bidegain, M. Introducing Hydro-Climatic Extremes and Human Impacts in Bolivia, Paraguay and Uruguay. In Climate Change and Health: Improving Resilience and Reducing Risks; Leal Filho, W., Azeiteiro, U.M., Alves, F., Eds.; Springer International Publishing: Cham, Switzerland, 2016; pp. 449–473. [Google Scholar] [CrossRef]
  35. Hoyos, I.; Dominguez, F.; Cañón-Barriga, J.; Martínez, J.A.; Nieto, R.; Gimeno, L.; Dirmeyer, P.A. Moisture origin and transport processes in Colombia, northern South America. Clim. Dyn. 2018, 50, 971–990. [Google Scholar] [CrossRef]
  36. Aristizábal, E. Influencia del ENSO en la variabilidad espacial y temporal de la ocurrencia de movimientos en masa detonados por lluvias en la región Andina. Ingeniería y Ciencia 2019. [Google Scholar] [CrossRef] [Green Version]
  37. Vergara Dal Pont, I.P.; Santibañez Ossa, F.A.; Araneo, D.; Ferrando Acuña, F.J.; Moreiras, S.M. Determination of probabilities for the generation of high-discharge flows in the middle basin of Elqui River, Chile. Nat. Hazards 2018, 93, 531–546. [Google Scholar] [CrossRef]
  38. Moreiras, S.M. Climatic effect of ENSO associated with landslide occurrence in the Central Andes, Mendoza Province, Argentina. Landslides 2005, 2, 53–59. [Google Scholar] [CrossRef]
  39. Hermanns, R.L.; Niedermann, S.; Ivy-Ochs, S.; Kubik, P.W. Rock avalanching into a landslide-dammed lake causing multiple dam failure in Las Conchas valley (NW Argentina)—Evidence from surface exposure dating and stratigraphic analyses. Landslides 2004, 1, 113–122. [Google Scholar] [CrossRef]
  40. Moreiras, S.M.; Pont, I.V.D.; Araneo, D. Were merely storm-landslides driven by the 2015-2016 Niño in the Mendoza River valley? Landslides 2018, 15, 997–1014. [Google Scholar] [CrossRef]
  41. Garcia-Herrera, R.; Barriopedro, D.; Hernández, E.; Diaz, H.F.; Garcia, R.R.; Prieto, M.R.; Moyano, R. A Chronology of El Niño Events from Primary Documentary Sources in Northern Peru. J. Clim. 2008, 21, 1948–1962. [Google Scholar] [CrossRef] [Green Version]
  42. Vilímek, V.; Hanzlík, J.; Sládek, I.; Šandov, M.; Santillán, N. The Share of Landslides in the Occurrence of Natural Hazards and the Significance of El Niño in the Cordillera Blanca and Cordillera Negra Mountains, Peru. In Landslides: Global Risk Preparedness; Sassa, K., Rouhban, B., Briceño, S., McSaveney, M., He, B., Eds.; Springer: Berlin/Heidelberg, Germany, 2013; pp. 133–148. [Google Scholar] [CrossRef]
  43. Rossel, F.; Mejia, R.; Ontaneda, G.; Pombosa, R.; Roura, J.; Le Goulven, P.; Cadier, E.; Calvez, R. Regionalization of El Niño influence on rainfall in Ecuador. Bulletin de L’Institut Francaise d’Etudes Andines 1998, 27, 643–654. [Google Scholar]
  44. Lagos, P.; Silva, Y.; Nickl, E. El Niño y la Precipitación en los Andes del Perú. Sociedad Geológica del Perú Lima Volumen jubilar en honor a Alberto Giesecke Matto 2005, 6, 7–23. [Google Scholar]
  45. Son, R.; Wang, S.Y.S.; Tseng, W.-L.; Barreto Schuler, C.W.; Becker, E.; Yoon, J.-H. Climate diagnostics of the extreme floods in Peru during early 2017. Clim. Dyn. 2020, 54, 935–945. [Google Scholar] [CrossRef] [Green Version]
  46. De Guenni, L.B.; García, M.; Muñoz, Á.G.; Santos, J.L.; Cedeño, A.; Perugachi, C.; Castillo, J. Predicting monthly precipitation along coastal Ecuador: ENSO and transfer function models. Theor. Appl. Climatol. 2017, 129, 1059–1073. [Google Scholar] [CrossRef]
  47. Trigo, R.M.; Osborn, T.J.; Corte-Real, J.M. The North Atlantic Oscillation influence on Europe: Climate impacts and associated physical mechanisms. Clim. Res. 2002, 20, 9–17. [Google Scholar] [CrossRef]
  48. Trigo, R.M.; Pozo-Vázquez, D.; Osborn, T.J.; Castro-Díez, Y.; Gámiz-Fortis, S.; Esteban-Parra, M.J. North Atlantic oscillation influence on precipitation, river flow and water resources in the Iberian Peninsula. Int. J. Climatol. A J. R. Meteorol. Soc. 2004, 24, 925–944. [Google Scholar] [CrossRef]
  49. Vicente-Serrano, S.M.; López-Moreno, J.I. Nonstationary influence of the North Atlantic Oscillation on European precipitation. J. Geophys. Res. Atmos. 2008, 113. [Google Scholar] [CrossRef]
  50. Hurrell, J.W. Decadal Trends in the North Atlantic Oscillation: Regional Temperatures and Precipitation. Science 1995, 269, 676–679. [Google Scholar] [CrossRef] [PubMed] [Green Version]
  51. Hurrell, J.W.; Deser, C. North Atlantic climate variability: The role of the North Atlantic Oscillation. J. Mar. Syst. 2010, 79, 231–244. [Google Scholar] [CrossRef]
  52. Jones, P.D.; Jonsson, T.; Wheeler, D. Extension to the North Atlantic oscillation using early instrumental pressure observations from Gibraltar and south-west Iceland. Int. J. Climatol. A J. R. Meteorol. Soc. 1997, 17, 1433–1450. [Google Scholar] [CrossRef]
  53. Santos, M.; Fonseca, A.; Fragoso, M.; Santos, J.A. Recent and future changes of precipitation extremes in mainland Portugal. Theor. Appl. Climatol. 2019, 137, 1305–1319. [Google Scholar] [CrossRef]
  54. Andrade, C.; Leite, S.; Santos, J. Temperature extremes in Europe: Overview of their driving atmospheric patterns. Nat. Hazards Earth Syst. Sci. 2012, 12, 1671. [Google Scholar] [CrossRef] [Green Version]
  55. Santos, J.; Corte-Real, J. Temperature extremes in Europe and wintertime large-scale atmospheric circulation: HadCM3 future scenarios. Clim. Res. 2006, 31, 3–18. [Google Scholar] [CrossRef] [Green Version]
  56. Santos, J.A.; Corte-Real, J.; Ulbrich, U.; Palutikof, J. European winter precipitation extremes and large-scale circulation: A coupled model and its scenarios. Theor. Appl. Climatol. 2007, 87, 85–102. [Google Scholar] [CrossRef]
  57. Santos, M.; Fragoso, M.; Santos, J.A. Damaging flood severity assessment in Northern Portugal over more than 150 years (1865–2016). Nat. Hazards 2018, 91, 983–1002. [Google Scholar] [CrossRef]
  58. Benito, G.; Brázdil, R.; Herget, J.; Machado, M.J.; Discussions, E.S.S. Quantitative historical hydrology in Europe. Hydrol. Earth Syst. Sci. 2015, 19, 3517–3539. [Google Scholar] [CrossRef] [Green Version]
  59. Kiss, A. Introduction: Floods and Water-Level Fluctuations in Medieval (Central-)Europe. In Floods and Long-Term Water-Level Changes in Medieval Hungary; Kiss, A., Ed.; Springer International Publishing: Cham, Switzerland, 2019; pp. 1–50. [Google Scholar] [CrossRef]
  60. De Lima, M.I.P.; Santo, F.E.; Ramos, A.M.; Trigo, R.M. Trends and correlations in annual extreme precipitation indices for mainland Portugal, 1941–2007. Theor. Appl. Climatol. 2015, 119, 55–75. [Google Scholar] [CrossRef]
  61. Mariotti, A.; Zeng, N.; Lau, K.-M. Euro-Mediterranean rainfall and ENSO—A seasonally varying relationship. Geophys. Res. Lett. 2002, 29, 59-1–59-4. [Google Scholar] [CrossRef] [Green Version]
  62. Lionello, P.; Malanotte-Rizzoli, P.; Boscolo, R. Mediterranean Climate Variability; Elsevier: Amsterdam, The Netherlands, 2006. [Google Scholar]
  63. Brönnimann, S.; Xoplaki, E.; Casty, C.; Pauling, A.; Luterbacher, J.J.C.D. ENSO influence on Europe during the last centuries. Clim. Dyn. 2007, 28, 181–197. [Google Scholar] [CrossRef] [Green Version]
  64. Chacón, J.; Alameda-Hernández, P.; Chacón, E.; Delgado, J.; El Hamdouni, R.; Fernández, P.; Fernández, T.; Gómez-López, J.M.; Irigaray, C.; Jiménez-Perálvarez, J.; et al. The Calaiza landslide on the coast of Granada (Andalusia, Spain). Bull. Eng. Geol. Environ. 2019, 78, 2107–2124. [Google Scholar] [CrossRef]
  65. Luque-Espinar, J.A.; Mateos, R.M.; García-Moreno, I.; Pardo-Igúzquiza, E.; Herrera, G. Spectral analysis of climate cycles to predict rainfall induced landslides in the western Mediterranean (Majorca, Spain). Nat. Hazards 2017, 89, 985–1007. [Google Scholar] [CrossRef]
  66. Mateos, R.; García-Moreno, I.; Azañón, J.; Tsige, M. La avalancha de rocas de Son Cocó (Alaró, Mallorca). Descripción y análisis del movimiento. Boletín Geológico y Minero 2010, 121, 153–168. [Google Scholar]
  67. Martín-Vide, J. Ensayo sobre la Oscilación del Mediterráneo Occidental y su influencia en la pluviometría del este de España. In Proceedings of the III Congreso de la Asociación Española de Climatología “El agua y el clima”, Palma de Mallorca, Spain, 16–19 June 2002. [Google Scholar]
  68. Lemus Cánovas, M.; López-Bustins, J.A. Variabilidad espacio-temporal Inde la precipitación en el sur de Cataluña y su relación con la oscilación del Mediterráneo Occidental (WeMO). In Proceedings of the X International Congress AEC: Clima, sociedad, riesgos y ordenación del territorio, Alicante, Spain, 5–8 October 2016; Volume 21, pp. 225–236. [Google Scholar]
  69. Köeppen. Das geographische system der klimate. In Handbuch der Klimatologie, 1C.; Köeppen, W., Geiger, R., Eds.; Gebrüder Borntraeger: Berlin, Germany, 1936; p. 44. [Google Scholar]
  70. Jaramillo, M. Perspectivas del Medio Ambiente Urbano; Technical Report: GEO Loja; Programa de las Naciones Unidas para el Medio Ambiente (Oficina Regional para América Latina y el Caribe), la Municipalidad de Loja y Naturaleza y Cultura Internacional: Loja, Ecuador, 2007. [Google Scholar]
  71. Emck, P. A Climatology of South Ecuador—With Special Focus on the Major Andean Ridge as Atlantic-Pacific Climate Divide; Friedrich-Alexander-University of Erlangen-Nürnberg: Erlangen, Bavaria, Germany, 2007. [Google Scholar]
  72. Hungerbühler, D.; Steinmann, M.; Winkler, W.; Seward, D.; Egüez, A.; Peterson, D.E.; Helg, U.; Hammer, C. Neogene stratigraphy and Andean geodynamics of southern Ecuador. Earth-Sci. Rev. 2002, 57, 75–124. [Google Scholar] [CrossRef]
  73. Soto, J.; Galve, J.P.; Palenzuela, J.A.; Azañón, J.M.; Tamay, J.; Irigaray, C. A multi-method approach for the characterization of landslides in an intramontane basin in the Andes (Loja, Ecuador). Landslides 2017, 14, 1929–1947. [Google Scholar] [CrossRef]
  74. Schutt, B. Late Quaternary Environmental Change on the Iberian Peninsula. Erde 2005, 136, 3. [Google Scholar]
  75. Trujillo, F., III. Clima e información meteorológica. In PLAN INFOCA. Un Plan de Acción al Servicio del Monte Mediterráneo Andaluz; Consejería de Medio Ambiente; Junta de Andalucía: Seville, Spain, 1995. [Google Scholar]
  76. Gómez-Pugnaire, M.T.; Galindo-Zaldívar, J.; Rubatto, D.; González-Lodeiro, F.; López Sánchez-Vizcaíno, V.; Jabaloy, A. A reinterpretation of the Nevado-Filábride and Alpujárride Complexes (Betic Cordillera): Field, petrography and U-Pb ages from orthogneisses (western Sierra Nevada, S Spain). Schweiz. Mineral. Und Petrogr. Mitt. 2004, 84, 303–322. [Google Scholar] [CrossRef]
  77. Chacón, J.; Irigaray Fernández, C.; Fernández, T.; El Hamdouni, R. Landslides in the main urban areas of the Granada province, Andalucia, Spain. In Engineering Geology for Tomorrow’s Cities; Engineering Geology Special Publication 22, IAEG2006 ed.; Culshaw, M., Ed.; The Geological Society of London: Nottingham, UK, 2006; p. 11. [Google Scholar]
  78. Chacón, J.; Irigaray, C.; El Hamdouni, R.; Jiménez-Perálvarez, J. Diachroneity of Landslides. In Geologically Active; Williams, A.L., Pinches, G.M., Chin, C.Y., McMorran, T.J., Massey, C.I., Eds.; CRC Press Taylor & Francis Group: London, UK, 2010; Volume 1, pp. 999–1006. [Google Scholar]
  79. Irigaray, C.; Lamas, F.; El Hamdouni, R.; Fernández, T.; Chacón, J. The Importance of the Precipitation and the Susceptibility of the Slopes for the Triggering of Landslides along the Roads. Nat. Hazards 2000, 21, 65–81. [Google Scholar] [CrossRef]
  80. Palenzuela, J.A.; Marsella, M.; Nardinocchi, C.; Pérez, J.L.; Fernández, T.; Chacón, J.; Irigaray, C. Landslide detection and inventory by integrating LiDAR data in a GIS environment. Landslides 2014, 1–16. [Google Scholar] [CrossRef]
  81. Ferro Veiga, J.M. Paisajismo, Iluminación y Decoración de Exteriores e Interior; Createspace Independent Pub: Charleston, SC, USA, 2020; p. 371. [Google Scholar]
  82. IDEAL. Historia. Available online: http://canales.ideal.es/acercaIdeal/historia.html (accessed on 15 September 2014).
  83. NOAA.ESRL. Monthly Timeseries of El Niño 1+2 SST Index. Available online: https://www.esrl.noaa.gov/psd/gcos_wgsp/Timeseries/Data/nino12.long.anom.data (accessed on 15 December 2019).
  84. NOAA.ESRL. Monthly NAO Normalized. Available online: https://www.cpc.ncep.noaa.gov/products/precip/CWlink/pna/norm.nao.monthly.b5001.current.ascii.table (accessed on 15 December 2019).
  85. WeMO. Database and Resources. WeMO. Available online: http://www.ub.edu/gc/en/wemo/ (accessed on 15 December 2019).
  86. NOAA. What are El Niño and La Niña? Available online: https://oceanservice.noaa.gov/facts/ninonina.html (accessed on 16 July 2020).
  87. Ideo. North Atlantic Oscillation. Available online: https://www.ldeo.columbia.edu/res/pi/NAO/ (accessed on 16 July 2020).
  88. Trauth, M.H.; Alonso, R.A.; Haselton, K.R.; Hermanns, R.L.; Strecker, M.R. Climate change and mass movements in the NW Argentine Andes. Earth Planet. Sci. Lett. 2000, 179, 243–256. [Google Scholar] [CrossRef]
  89. Hoerling, M.P.; Kumar, A. Understanding and Predicting Extratropical Teleconnections Related to ENSO. In El Niño and the Southern Oscillation: Multiscale Variability and Global and Regional Impacts; Diaz, H.F., Markgraf, V., Eds.; Cambridge University Press: Cambridge, UK, 2000; pp. 57–88. [Google Scholar] [CrossRef]
  90. Diaz, H.F.; Hoerling, M.P.; Eischeid, J.K. ENSO variability, teleconnections and climate change. Int. J. Climatol. A J. R. Meteorol. Soc. 2001, 21, 1845–1862. [Google Scholar] [CrossRef]
  91. Can, R.; Kocaman, S.; Gokceoglu, C.A. Convolutional Neural Network Architecture for Auto-Detection of Landslide. Photographs to Assess Citizen Science and Volunteered Geographic Information Data Quality. ISPRS Int. J. Geo-Inf. 2019, 8, 300. [Google Scholar] [CrossRef] [Green Version]
  92. Li, Y.; Sun, R.; Yin, K.; Xu, Y.; Chai, B.; Xiao, L. Forecasting of landslide displacements using a chaos theory based wavelet analysis-Volterra filter model. Sci. Rep. 2019, 9, 19853. [Google Scholar] [CrossRef]
  93. Wu, C.L.; Chau, K.W. Prediction of rainfall time series using modular soft computingmethods. Eng. Appl. Artif. Intell. 2013, 26, 997–1007. [Google Scholar] [CrossRef] [Green Version]
  94. Homsi, R.; Shiru, M.S.; Shahid, S.; Ismail, T.; Harun, S.B.; Al-Ansari, N.; Chau, K.-W.; Yaseen, Z.M. Precipitation projection using a CMIP5 GCM ensemble model: A regional investigation of Syria. Eng. Appl. Comput. Fluid Mech. 2020, 14, 90–106. [Google Scholar] [CrossRef]
Figure 1. Location of the study areas. Basemap from ArcGIS® World Imagery.
Hydrology 07 00045 g001
Figure 2. Histogram of the mean monthly precipitation for both study areas.
Hydrology 07 00045 g002
Figure 3. Examples of geological sections in the area of the Loja Basin, in the directions NE-SW (a) and in the direction SW-NE (b). Taken from [74].
Hydrology 07 00045 g003
Figure 4. Mean values and heights of the rainfall gauges of southern Granada.
Hydrology 07 00045 g004
Figure 5. Scatter plots of the rainfall thresholds and the fitted CRTs: (a) fitted curve for low to very low mass movements in the Loja Basin (modified from [5]); (be) are fitted curves for the translational slides, rock falls, complex landslides, and all the landslide types, respectively, in southern Granada. Dash-dotted line: curve fit to lower values Rainfall-Duration; solid line: confidence bounds; dashed line: prediction bounds. Red points are the manually selected points to fit the CRT curve.
Hydrology 07 00045 g005aHydrology 07 00045 g005b
Figure 6. Graph of the differences after subtracting the general trend from the accumulated rainfall observed for the wet seasons October–April (dotted line) and the more significant climate indices (solid line): (a) graph for the Loja Basin including the ENSO index; (b) graph for the Loja Basin including the ENSO index for the monthly scale and the regression line of the ENSO index; (c) graph southern Granada including the NAO index; (d) graph for southern Granada including the WeMO index; (e) graph for southern Granada including the aggregation of NAO and WeMO indices. Triangles represent the relative quantity of documented landslides by year.
Hydrology 07 00045 g006aHydrology 07 00045 g006b
Table 1. Analysis of the variance (ANOVA) of the different rainfall gauges of southern Granada.
ANOVA
VarianceSquare Sum (SS)Degrees of Freedom (DF)Square Mean (SM)FProbabilityCritical Value of F
Between groups5209.2311.00473.570.560.861.86
Within groups111,843.41132.00847.30
Total117,052.64143.00
Table 2. Summary of the rainfall variables for the events triggering catalogued landslides. Aver. and SD stand for average and standard deviation, respectively.
GeolocationClimatic ZoneRainfall (E)Duration (E)
Aver.SDAver.SD
Loja (southern Ecuador)Cfb156.4 mm115.2 mm25.3 d28.93 d
Granada (southern Spain) BSk458.1 mm233.5 mm42.8 d22.39 d
Table 3. Summary of CRT (Critical Rainfall Thresholds) parameters and statistical significance of the curve fit.
AreaTypeαβR2
LojaEarth-slide, earth-flow, complex7.330.761.02
GranadaTranslational slide92.350.150.33
GranadaRock fall63.740.391.00
GranadaComplex52.340.421.33
GranadaAll types64.360.220.93
Table 4. Pearson coefficients for the correlation between the different climate indices and the differences after subtracting the general trend from the observed accumulated rainfall for the wet seasons October–April.
GeolocationClimate IndexPearson Coef.
Loja (southern Ecuador)ENSO0.27
Granada (southern Spain)NAO−0.44
WeMO−0.31
NAO + WeMO−0.55
Table 5. Magnitude of the negative spikes for the climate indices in southern Granada in hydrological years with documented landslides.
Hydrological YearIndexValues% Respect to Average of Negative Values
1995–1996 NAO−0.49131.17
WeMO−1.15266.82
NAO + WeMO−1.65254.9
1996–1997 NAO−0.0924.64
WeMO−0.69159.56
NAO + WeMO−0.78121.04
2008–2009NAO−0.038.34
WeMO−0.4296.33
NAO + WeMO−0.4569.26
2009–2010NAO−1.10290.76
WeMO−0.84193.66
NAO + WeMO−1.93299.16
Average:NAO−0.38
WeMO−0.43
NAO + WeMO−0.65
1st quartileNAO−0.50
WeMO−0.61
NAO + WeMO−1.07

