
Long Term Trend Analysis of River Flow and Climate in Northern Canada
by
 , , , , , and
Mohamed Sherif Zaghloul
1 ,
,
Ebrahim Ghaderpour
1 ,
,
Hatef Dastour
1 ,
,
Babak Farjad
2,
Anil Gupta
1,2,
Hyung Eum
2,
Gopal Achari
1 and
Quazi K. Hassan
1,*
1
Schulich School of Engineering, University of Calgary, 2500 University Drive, Calgary, AB T2N 1N4, Canada
2
Resource Stewardship Division, Alberta Environment and Protected Areas, 3535 Research Road NW, University Research Park, Calgary, AB T2L 2K8, Canada
*
Author to whom correspondence should be addressed.
Hydrology 2022, 9(11), 197; https://doi.org/10.3390/hydrology9110197
Submission received: 30 September 2022
/
Revised: 26 October 2022
/
Accepted: 2 November 2022
/
Published: 4 November 2022
(This article belongs to the Section Hydrology–Climate Interactions)
Abstract
:Changes in water resources within basins can significantly impact ecosystems, agriculture, and biodiversity, among others. Basins in northern Canada have a cold climate, and the recent changes in climate can have a profound impact on water resources in these basins. Therefore, it is crucial to study long term trends in water flow as well as their influential factors, such as temperature and precipitation. This study focused on analyzing long term trends in water flow across the Athabasca River Basin (ARB) and Peace River Basin (PRB). Long term trends in temperature and precipitation within these basins were also studied. Water flow data from 18 hydrometric stations provided by Water Survey of Canada were analyzed using the Mann-Kendall test and Sen’s slope. In addition, hybrid climate data provided by Alberta Environment and Parks at approximately 10 km spatial resolution were analyzed for the ARB and its surrounding regions during 1950–2019. Trend analysis was performed on the water flow data on monthly, seasonal, and annual scales, and the results were cross-checked with trends in temperature and precipitation and land use and land cover data. The overall temperature across the basins has been increasing since 1950, while precipitation showed an insignificant decrease during this period. Winter water flow in the upper ARB has been slowly and steadily increasing since 1956 because of the rising temperatures and the subsequent slow melting of snowpacks/glaciers. The warm season flows in the middle and lower subregions declined up to 1981, then started to show an increasing trend. The middle and lower ARB exhibited a rapid increase in warm-season water flow since 2015. A similar trend change was also observed in the PRB. The gradual increase in water flow observed in the recent decades may continue by the mid-century, which is beneficial for agriculture, forestry, fishery, and industry. However, climate and land cover changes may alter the trend of water flow in the future; therefore, it is important to have a proper management plan for water usage in the next decades.
1. Introduction
Climate dynamics can significantly affect hydrological regimes in river basins across the world. Changes in water availability in watersheds have profound impacts on ecosystems, agriculture, forestry, fishery, industry, and hazard management [1]. Therefore, continuous monitoring of water flow and the monitoring of its influential factors, such as precipitation and temperature, are crucial. Hydrological modelling for large basins is very difficult due to hydroclimatic complexity linked to changes in land cover, topography, soil drainage capacity, climate, and anthropogenic activities. In cold weather basins, water flow during winter is usually low, while during spring and summer, precipitation and snowmelt significantly increase water flow, which may result in flooding [2]. Watersheds located in high latitudes in Canada are subject to rapid hydroclimatic changes that directly influence the water availability in the regions. In the Athabasca River Basin (ARB), the changing hydrology impacts the natural ecosystem in national parks and reserves, the livelihood of the population, the agricultural and mining industries, as well as the oil and gas industry in the lower ARB [1]. The Peace-Athabasca Delta (PAD), which falls at the confluence of the Peace and Athabasca Rivers with Lake Athabasca, is home to a diverse ecosystem and is a breeding environment for wildlife [2]. Fossil fuel excavation and extraction within the ARB has utilized a growing amount of the Athabasca River, about 4.5% of river’s annual flow in 2012 [3].
Many researchers have studied trends in water flow across the ARB. A general decline in the summer water flow has been reported across Canadian rivers due to climatic and atmospheric factors [4,5]. The ARB has demonstrated an earlier spring peak water flow, a higher winter flow [6,7,8], and around a 20% reduction in the summer flow [9]. These observations were supported by studying the trends in the runoff, temperature, and precipitation along the ARB and their impact on water flow [10]. Historical data have also been used to analyze and explain different hydrological phenomena using modelling [11]. Hwang et al. (2018) [12] studied the water balance in the ARB to explain the increasing downstream flow during water deficit conditions using a 3D model for the surface and subsurface flow and evapotranspiration. They also integrated land cover data to investigate the role of different types of vegetation in the water balance.
Cold weather basins are generally very vulnerable to climate change. For example, the highly glacierized and mountainous Upper Indus Basin was shown to be highly affected by climate change [13]. The findings of Shah et al. [13] imply that other similar basins may also be affected by climate change, such as the ARB, since it is also mountainous and highly glacierized in the upper ARB and extends to prairies in the lower ARB. In addition to climate, land use and land cover (LULC) also contribute to the hydrological behavior of watersheds. With the changing climate, new analyses of the ARB hydrology with newly available data are required to have an up-to-date understanding of the current hydrological conditions and to make informed projections and decision making. Remote sensing data for 2001–2020 show a warming trend in the Canadian province of Alberta, where the ARB lies [14]. A recent LULC map was developed for the ARB and was used to detect changes in vegetation and human activities within the watershed, which can have a significant impact on the Athabasca River water flow [12,15]. A combined analysis of water flow, temperature, precipitation, and land cover can help in proper water resource planning, both currently and in the future.
In this study, hydrometric and hybrid climate datasets were analyzed to obtain a current hydrological understanding of the ARB. To the authors’ best knowledge, this is the first time that such analyses have been performed spatially for over 18 hydrometric stations, at pixel and subregion levels for climate, and temporally at monthly, seasonal, and annual scales during 1950–2020. These findings are comprehensive and provide more in-depth understanding of climate and water flow in the ARB and its north-western basin, the Peace River Basin (PRB). Bawden et al. [16] applied the Mann-Kendall (MK) test and Sen’s slope to hydrometric time series data for the ARB and surrounding regions for three different periods: 1976–2010 (35 years), 1971–2010 (40 years), and 1966–2010 (45 years). They investigated the trends of monthly water flow, annual mean and peaks, and warm season mean between 1976 and 2010. They compared the trends in the ARB with the surrounding watersheds using data from the Water Survey of Canada (WSC) and Reference Hydrometric Basin Network (RHBN) gauging stations. They also analyzed the trends in temperature and precipitation in the ARB using a 10 km resolution dataset [17]. In the present study, on one hand, eight different periods were investigated at monthly, seasonal, and annual scales: 1991–2020 (30 years), 1986–2020 (35 years), 1981–2020 (40 years), 1976–2020 (45 years), 1971–2020 (50 years), 1966–2020 (55 years), 1961–2020 (60 years), and 1956–2020 (65 years). From the statistical point of view, estimated trends for longer periods have greater power than shorter periods. However, more stations could be analyzed for recent years because many stations have started to operate recently, and some had major data gaps in the past. Furthermore, the potential regime shifts in water flow were investigated through a windowing strategy. On the other hand, the hybrid climate data, obtained from multiple climate datasets and prepared for the ARB and its surrounding regions, were recently released for the period 1950–2019, providing continuous and reliable data since 1950, which also cover the mountainous regions [18]. The long historical and continuous hybrid climate data allow the rigorous investigation of climate impact on water flow both in time and space, which were utilized in the present study. Moreover, the possible influence of recent land cover changes (2001–2020) on waterflow dynamics is also discussed here.
Note that the detailed water flow analysis results are presented for three main stations in the ARB located at three subregions of the ARB with long historical and continuous data, and the results for the rest of the stations are presented in the Supplementary Materials. The main contributions of this work are summarized below.
- (1)
- Long-term and short-term trend analyses of hydrometric datasets from 18 gauging stations in ARB and PRB at monthly, seasonal, and annual scales. These analyses show the direction of historical and recent water flow trends as well as the detection of months and seasons when the flow was decreasing or increasing.
- (2)
- Estimated monthly hydrographs for the water flow datasets for 30-year-long moving windows since 1956 to find whether there is any regime shifts in the mean of water flow for each station.
- (3)
- Estimated trends for temperature and precipitation at both pixel and subregion levels to investigate their possible relations with waterflow dynamics.
- (4)
- Discussed the recent trends in land cover types across the subregions and their potential interactions with water flow dynamics.
2. Data and Methods
2.1. Study Region
The Athabasca River Basin (ARB) is one of the largest watersheds in Alberta, with a drainage area of approximately 138,000 km2. The Athabasca River extends from the Athabasca Glacier, which extends from the Columbia Glacier in the Rocky Mountains and flows North-East into Lake Athabasca, then into the Arctic Ocean through the Mackenzie River [17]. The topography and ecology vary along the ARB, where the upper reach of the river flows through the Rocky Mountains with alpine, sub-alpine, and montane ecoregions. The middle reach of the Athabasca River then flows through low-populated foothills and prairie lands with boreal forests, where the river is surrounded by forests, coal mines, limestone quarries, and croplands. The McLeod River, Pembina River, and Lesser Slave River flow into the Athabasca River within the middle reach. The lower reach of the river starts at the urban centre of Fort McMurray. The lower ARB is the national centre for the oil industry, the third-largest oil deposit in the world. The Clearwater River and other small tributaries flow into the Athabasca River within the lower reach. Fort McMurray is highly populated (~60,500 in 2011 and ~66,500 in 2016) relative to other towns in the ARB, with an expanding residential and industrial footprint due to the influx of workers in the energy sector [19].
For the ARB, the annual mean daily maximum temperature was 6.2 °C, and the annual mean daily minimum temperature was −5.2 °C on average during the period 1950–2019. Additionally, the average annual precipitation was 492 mm for the ARB. Around 75% of the precipitation in the ARB is in the form of rain, while the rest is snow [16]. Water flow in the Athabasca River is characterized by low winter flows, followed by a rapid increase due to snowmelt in April. Peak flow occurs between May and August, depending on the location of the gauging station along the river. Figure 1 shows the location and topography of the ARB within the provinces of Alberta and Saskatchewan, as well as the locations and ID numbers of the gauging stations in and around the ARB that were used in this study. The details of the gauging stations are shown in Table 1. According to multiple criteria, such as topography, land cover, climate, and biodiversity, the ARB is divided into three subregions, namely the upper (the southern mountainous region), middle, and lower ARB [20], separated by dashed lines in Figure 1 (Hatfield Consultants 2008, see the Regional Aquatics Monitoring Program (RAMP): http://www.ramp-alberta.org/river/geography/basin+landscape.aspx, accessed on 2 April 2022). The focus of this study was on the ARB; however, for comparison purposes, three stations with long and continuous historical discharge records were also chosen in the PRB (see p1, p2, and p3 in Figure 1).
2.2. Datasets and Pre-Processing
2.2.1. Climate Data
A high-resolution (0.1 × 0.1 degree or ~10 km within ARB) hybrid gridded climate dataset for 1950–2019 was generated from a framework called the REFerence Reliability Evaluation System (REFRES) that systematically generates a performance-based hybrid climate dataset from multiple climate datasets for a region. In fact, Eum and Gupta [18] recommended the use of the hybrid climate dataset as reference for hydrological model forcing and statistical downscaling because it is a good proxy for the historical climate conditions. REFRES is composed of three modules, performance measures, ranking, and data generation.
2.2.2. Water Flow Data
The water flow data used in this study were acquired from the Water Survey of Canada (WSC). The WSC collects real-time hydrometric data (water flow and water level) from gauging stations across Canada. The parameters used in this study, which were extracted from the WSC data, were the monthly averages, annual averages, cold season averages, and open warm-season averages. The months included in the calculation of the cold and warm seasons varied across the ARB based on the observed flow conditions. In the upper ARB, the cold season with relatively higher water flow included the months November–April, while the warm season was May–October. The Middle and Lower cold and warm seasons were November–March and April–October, respectively. The WSC gauging stations were set up at various times since 1914, leading to a varying range of recorded data. Some stations also had gaps in recording that ranged between months to years, and other stations did not record in the winter months (seasonal operation). The gauging stations selected in this study were chosen based on data availability. Chosen stations were those that had continuous data, where the gaps in any parameter were not more than five years in total or three consecutive years in any gauging station, according to the 1981–2010 Canadian Climate Normals Report (https://climate.weather.gc.ca/climate_normals/, accessed on 2 April 2022). Furthermore, the chosen stations recorded data over the 12 months without seasonal discontinuity in the winter season, and finally, the chosen stations had a period of record that extended at least 30 years prior to 2020.
In addition to the WSC water flow data, another dataset was included in the study that covered the same region, even though it has a shorter period with more missing values than the WSC. The Regional Aquatics Monitoring Program (RAMP) was an industry funded program between 1997 and 2015. Its intent was to monitor the aquatic environments in the Wood Buffalo Area and study the impact of the oil sands projects. The RAMP program collected water flow data across the lower ARB and complemented the existing WSC data.
For the trend analysis, water flow data were split into subsets based on the years of record between 1991–2020 (30 years), 1986–2020 (35 years), 1981–2020 (40 years), 1976–2020 (45 years), 1971–2020 (50 years), 1966–2020 (55 years), 1961–2020 (60 years), and 1956–2020 (65 years). The water flow data were also arranged as subsets of a 30-year moving window every five years (1991–2020, 1986–2015, 1981–2010, 1976–2005, 1971–2000, 1966–1995, 1961–1990, 1956–1985). Then, monthly hydrographs were generated for each of the 30-year windows for all the 18 stations listed in Table 1, except l3. A minimum of 30 years of data allows for a rigorous long term trend analysis. Moreover, a 30-year time window is typically selected as baseline for climate studies because it is long enough to capture variations between decades and short enough to capture fluctuations within decades [20].
2.2.3. Land Use and Land Cover (LULC) Data
The Canada Centre for Remote Sensing (CCRS) has generated a land cover map of Canada for the base year 2010, as the first of a planned series of maps to be updated every five years or more frequently. This land cover dataset is also the Canadian contribution to the 30 m spatial resolution 2010 Land Cover Map of North America, produced by Mexican, American, and Canadian government institutions under a collaboration called the North American Land Change Monitoring System (NALCMS) [21]. The NALCMS is a collaborative framework involving CCRS’ parent organization, Natural Resources Canada (NRCan), the United States Geological Survey (USGS), and Mexican institutions, including the National Institute of Statistics and Geography (INEGI), the National Forestry Commission (CONAFOR), and the National Commission for Knowledge and Use of Biodiversity (CONABIO). The 2015 Land Use and Land Cover (LULC) classes were defined using the Land Cover Classification System (LCCS) standard developed by the Food and Agriculture Organization (FAO) of the United Nations. This map is based on 2015 Landsat satellite imagery for Canada at 30 m spatial resolution (the map is publicly available through the link: (http://www.cec.org/north-american-environmental-atlas/land-cover-30m-2015-landsat-and-rapideye/), accessed on 23 November 2021).
2.3. Climate Trend Analysis Methods
Linear regression models the relationship between dependent variables (e.g., temperatures) and independent variables (e.g., times). The least-squares approach is usually employed in linear regression to estimate the slope () and intercept of the linear fit line through minimizing the residual series. Considering the normality and independence of the residual series, one can determine the statistical significance of the estimated slope via the test statistics , which follows the student’s t-distribution, where is the standard error of the estimated slope In testing the statistical significance of the estimated slope, the null hypothesis is usually defined as no trend (), and the alternative hypothesis is defined as trend exists ().
2.4. Water Flow Trend Analysis Methods
The Mann-Kendall (MK) method is a non-parametric test that is common in detecting trends in hydrometric data [22,23]. It is based on the null hypothesis that there is no trend in the data, i.e., the measurements acquired over time are independent and identically distributed. The MK test can detect trends in data at certain significance levels (90%, 95%, and 99% in this study). The trend slopes were calculated using the Sen approach [24]. Sen slope is a non-parametric slope estimator that determines the magnitude and direction of the trend in hydrometric variables. The mathematical formulation of the MK test and Sen slope is outlined below. The MK test statistic S is calculated by:
and
where n is the number of measurements, and and are data values in time series i and j. The variance is calculated by:
when n >10, the standard normal test statistic Z is calculated by:
Positive Z values indicate an increasing trend and vice versa. The Sen slope is calculated by:
3. Results
3.1. Climate Trends
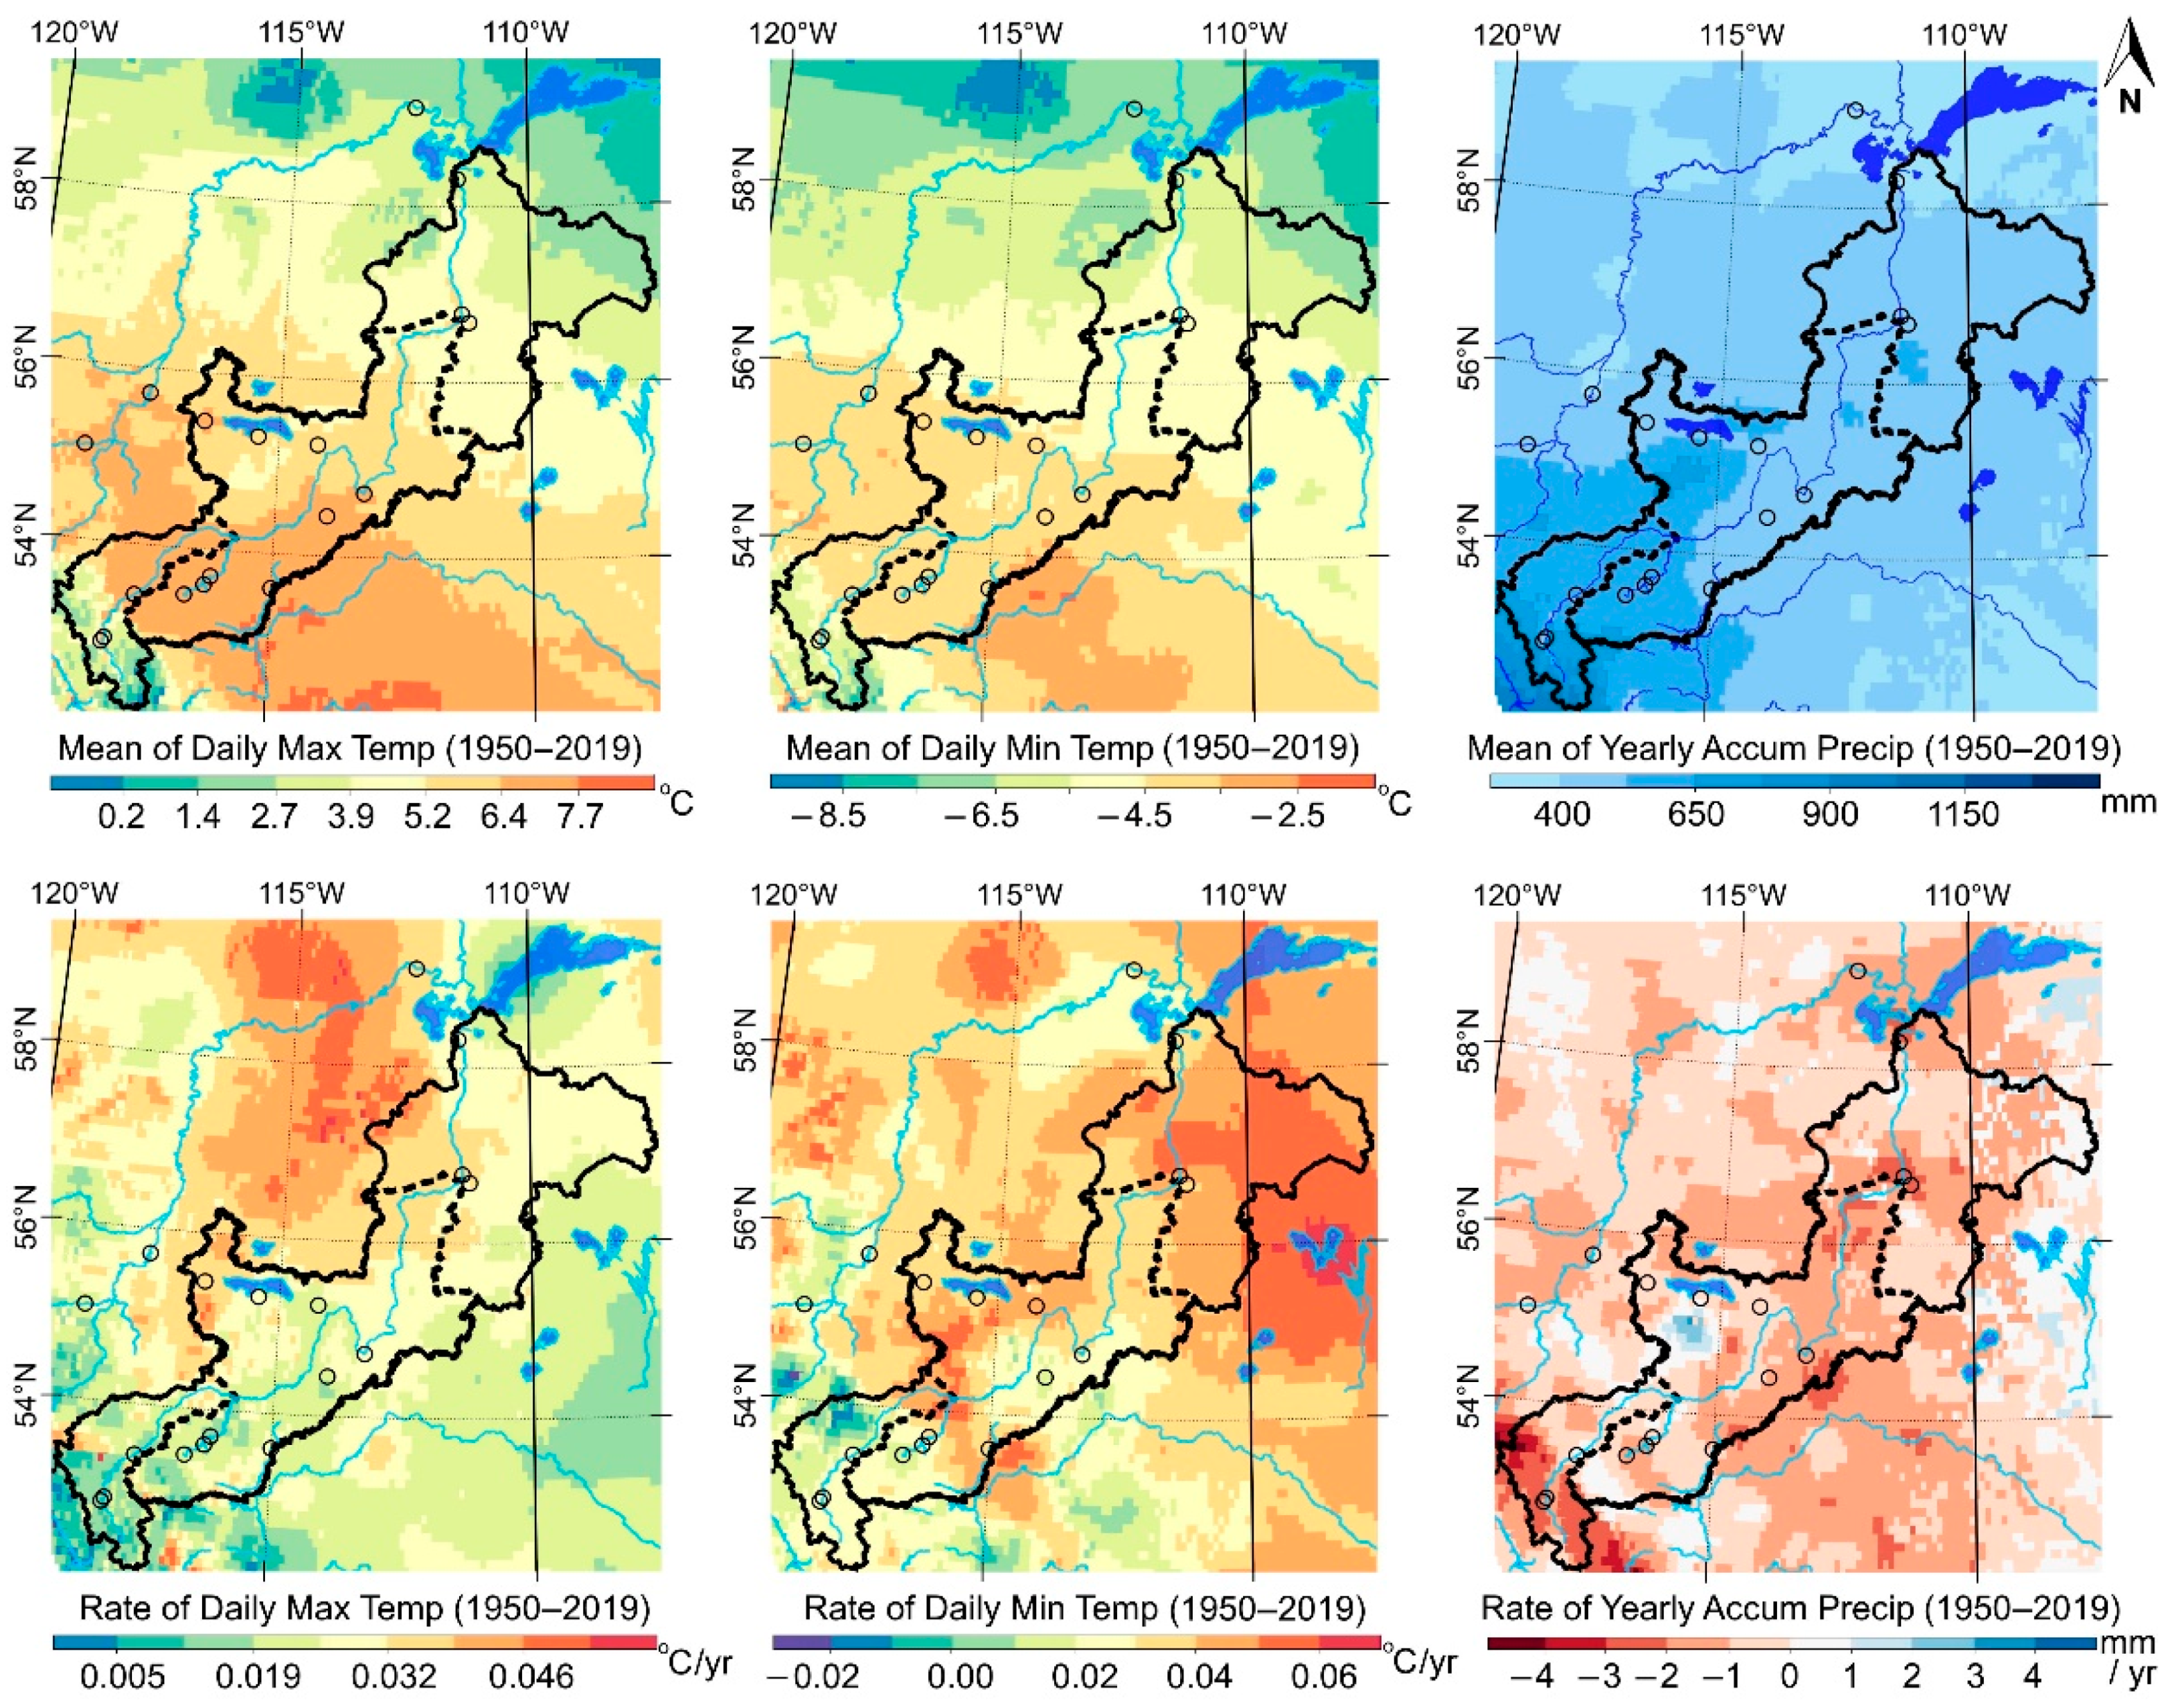
Climate is one of the main drivers of vegetation coverage and water flow. However, there is usually a time lag between these parameters, and their impact on each other depends on several other factors, such as urbanization, harvesting activities, soil types, topography, etc. To show the spatial variation of climate over the ARB and its surroundings, the mean of daily maximum and minimum temperatures was calculated between 1950 and 2019, as well as the mean of yearly-accumulated precipitation within that period. The results are shown in Figure 2. Furthermore, the overall rates of change in temperature and precipitation were calculated during that period, and the climate change map is also illustrated in Figure 2. Temperature has been increasing over the region, particularly in the middle and lower ARB. Additionally, precipitation has been decreasing within the ARB since 1950, particularly in the upper ARB.
The MK trend analysis and Sen’s slope of the climate data also demonstrated a decline in the precipitation across the ARB while temperatures were increasing, as shown in Table 2. Precipitation in the upper ARB has been decreasing by 11.28 mm per decade at a 90% significance level, since 1950. The precipitation in the middle and lower ARB has also been declining but with a significance level of less than 90%. As it can be seen in the bottom right panel of Figure 2, the increase and decrease in the precipitation rate were approximately equally distributed within the middle and lower ARB, while the upper ARB showed a more significant decline in the precipitation rate. The temperature, however, has been increasing across the ARB with over 99% significance. The maximum temperature has been uniformly increasing in the upper, middle, and lower ARB with rates of 0.23, 0.27, and 0.28 °C per decade. The minimum temperature demonstrated an increasing tapered rate along the ARB, where the upper, middle, and lower subregions increased by 0.17, 0.33, and 0.45 °C per decade.
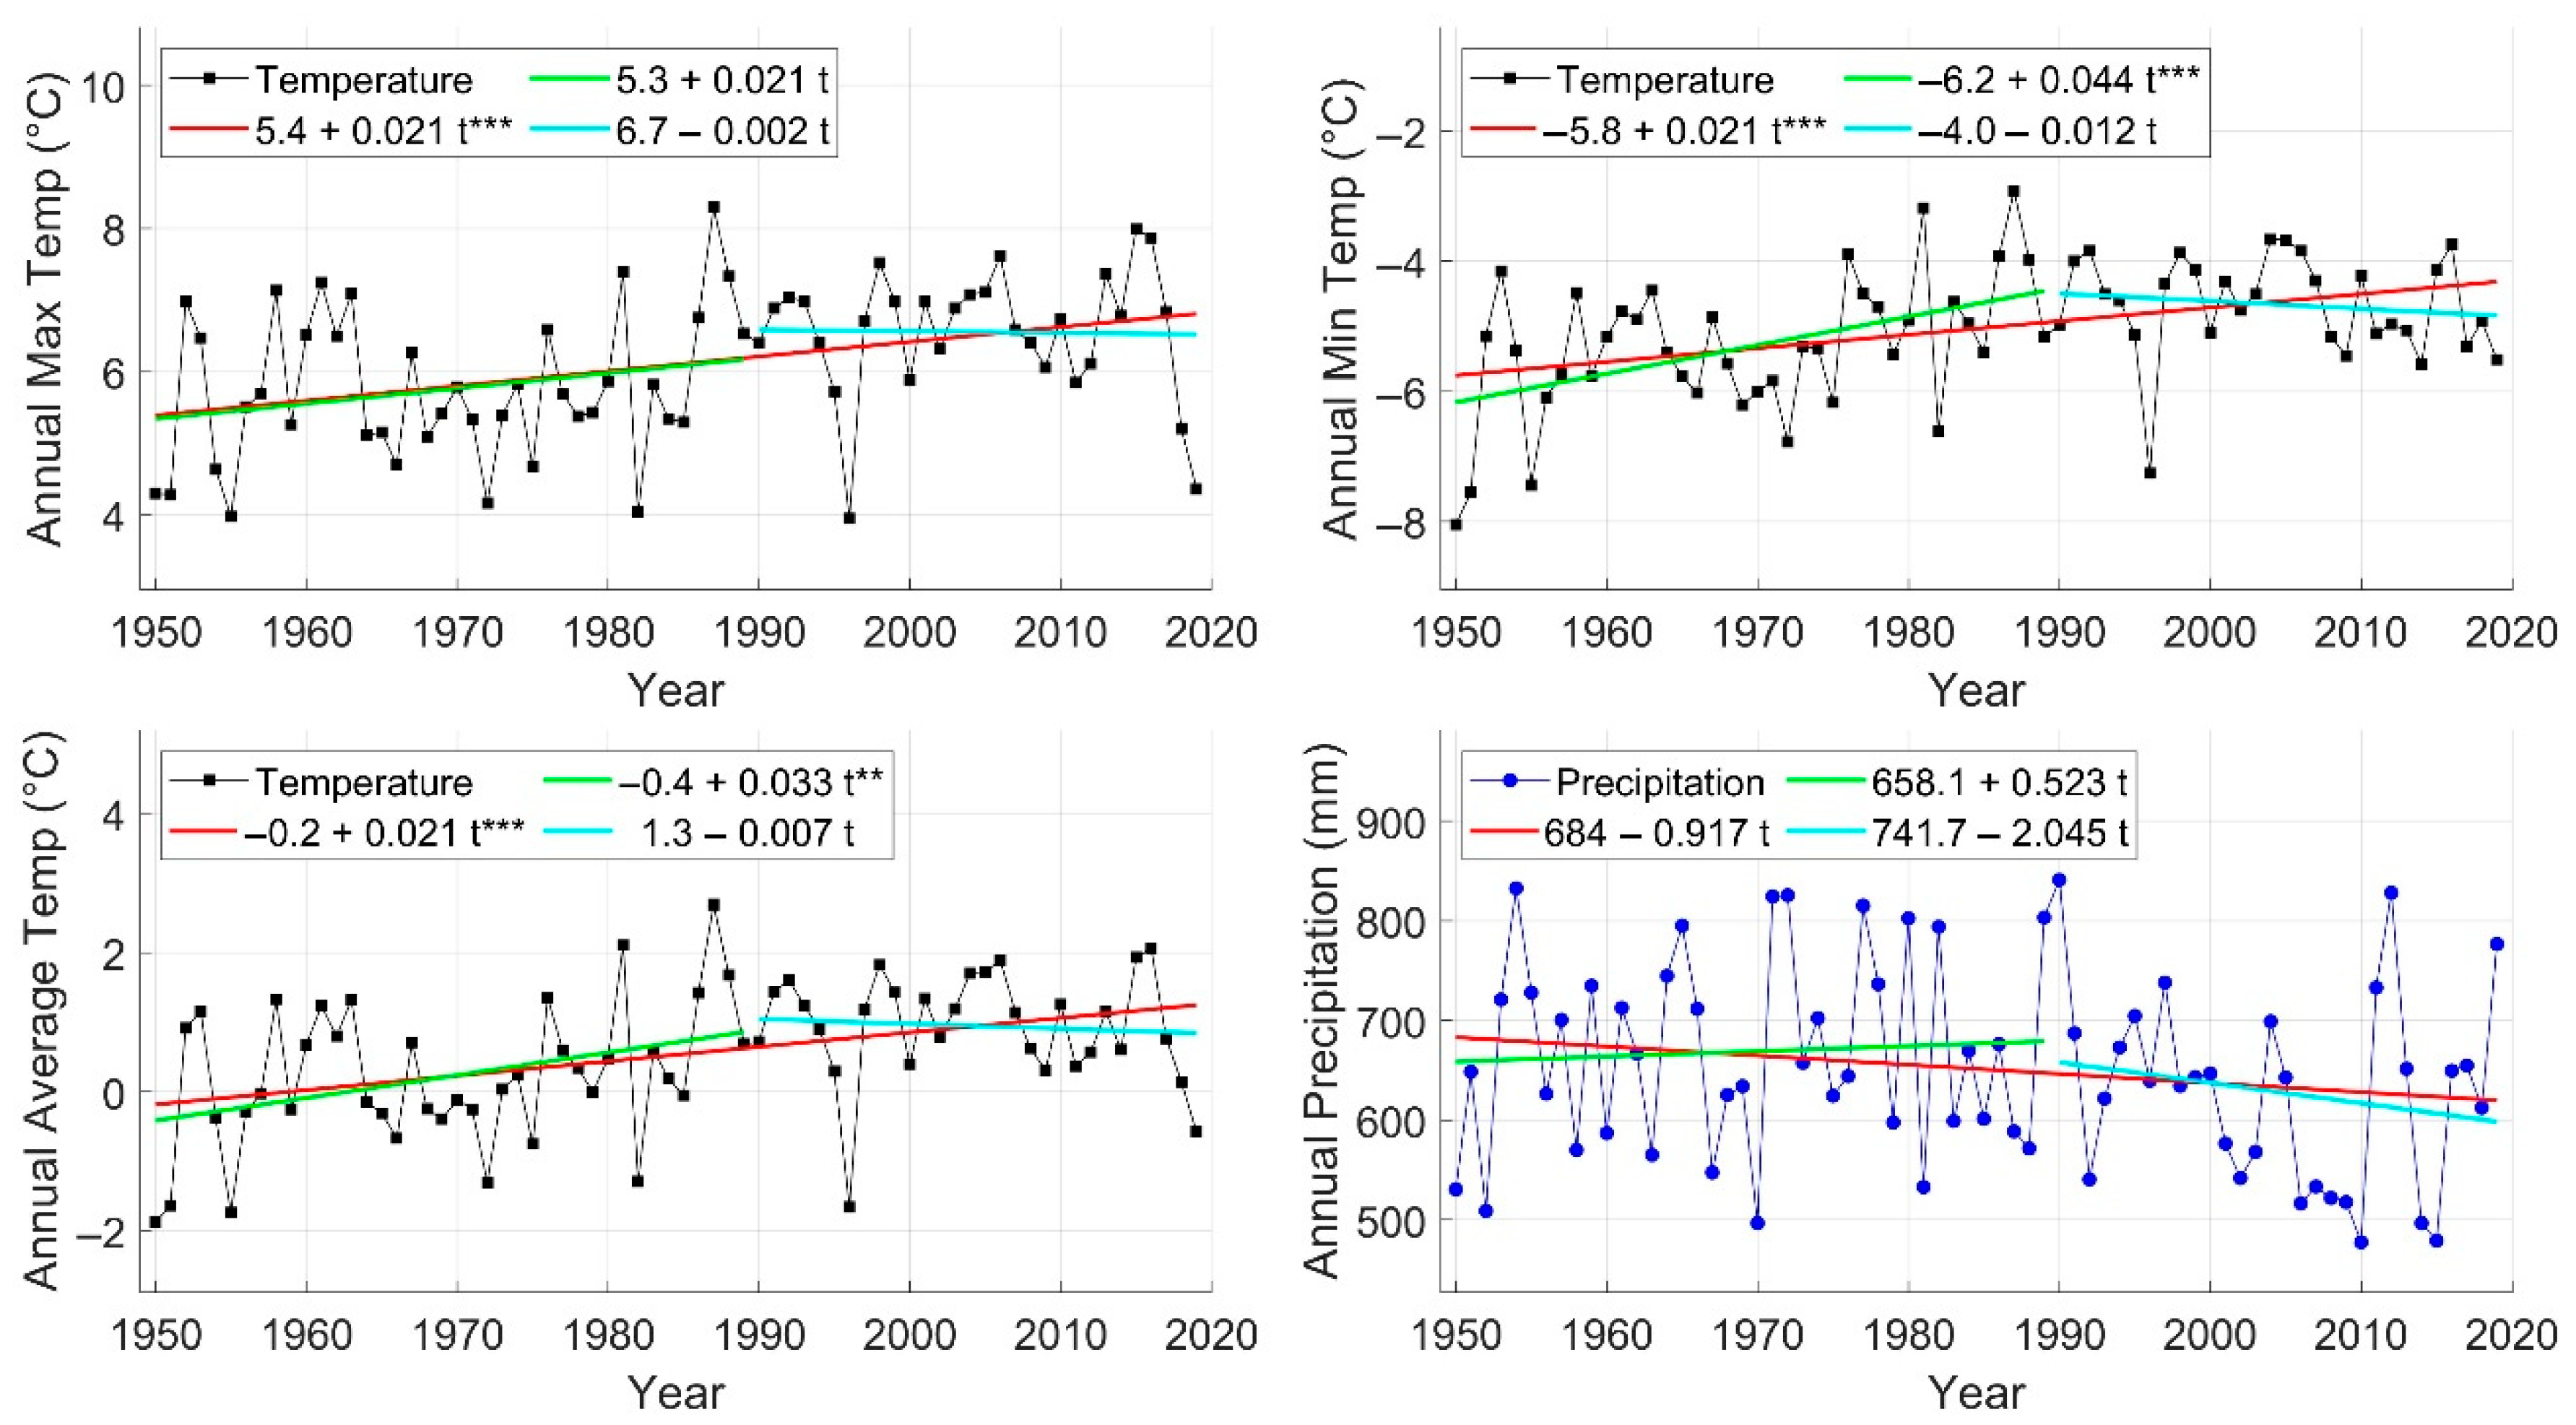
Linear regression was applied to each climate parameter, and their annual slope estimates matched with the decade Sen slope shown in Table 2, further confirming the trend results presented here. The climate time series for the lower, middle, and upper ARB are shown in Figure 3, Figure 4, and Figure 5, respectively. The average temperature was simply obtained by averaging the maximum and minimum temperatures. Note that “Annual Max Temp” on the y-axis is the mean of daily maximum temperatures in each year. Likewise, “Annual Min Temp” is the mean of daily minimum temperature in each year. To compare the past and current overall changes in temperature and precipitation, the time series were segmented from 1950 to 1990 (1950–1989) and from 1990 to 2020 (1990–2019). The breakpoint was manually chosen so that we could estimate and compare the climate trend for the 40 years prior to 1990 with the trend for the recent 30 years. The regression trend results for each segment are also illustrated in green and cyan in these figures.
3.2. Water Flow Trends
Three major stations were used to represent each subregion, as they were the most downstream stations in each subregion, on the Athabasca River itself, with complete datasets. Stations 07AD002 (at Jasper, u3), 07BE001 (at Athabasca, m6), and 07DA001 (below Fort McMurray, l2) were used as a proxy to represent the upper, middle, and lower ARB, respectively. Note that l2 was the only station in the lower ARB that had continuous and long-term measurement records, although it may not be a good proxy for the lower ARB as it is not located near the outlet of the lower ARB. The flow measured at l2 is the joint flow contribution from the Athabasca River and Clearwater River in the eastern part of the lower ARB. Station 07DD001 (at Embarras Airport, l3) lies on the Athabasca River at the river delta, near the outlet of the lower ARB. However, the water flow data at this station were only available for six years (1972, 1973, 1975, 2015, 2018, and 2019). Therefore, station 07DD001 was not included in the MK trend analysis but was used for comparing the water flow for these specific years. Three stations on the Peace River were also included in the MK test to compare with the Athabasca River. Stations 07GE001 (p1), 07GE001 (p2), and 07KC001 (p3) represented the upper, middle, and lower Peace River subregions, respectively.
The results of the water flow MK trend analysis and Sen’s slope calculation are shown in Table 3 for the three main stations in the ARB. Table 3 shows the trend slope and significance level for each parameter and each station at each test period. The slope and significance for the remaining stations are shown in Tables S1–S8 in the Supplementary Materials. The results show that the cold season average water flow in the upper ARB has increased with a significance level of 95%. This trend was detected in all time periods between the past 30 and 65 years. The open warm season exhibited a variable trend across the warm months. The water flow in May has significantly increased since 1981 in the middle ARB, while the August water flow showed a statistically significant decline. It is worth noting that the water flow decline in August was no longer statistically significant after 1981. The overall annual average flow has decreased since 1956. However, it started to increase starting from 1981, although with a significance level of less than 90%. The map of the RAMP water flow gauging stations in the lower ARB and the water flow time series are shown in Figures S3–S7. The MK trends of the RAMP stations are shown in Tables S9–S15. Some RAMP stations investigated in this study duplicated WSC stations between 1997 and 2017, where the stations were physically the same. These stations were 07DA006-S38, 07DA008-S07, 07DA018-S39, 07DB001-S26, 07DC001-S27, and 07DD001-S46.
Table 4 and Table 5 show the total number of stations that demonstrated a significant (≥90% significance) increasing or decreasing trend in the water flow data. Table 4 was developed for the ARB stations, except for the station Athabasca River at Embarras Airport, due to the lack of sufficient water flow data for robust trend analysis. Table 5 was developed for the three stations along the Peace River. The arrows adjacent to each number indicate whether it is increasing or decreasing. The numbers in Table 4 and Table 5 align with the observed trends in Table 3. As shown in Table 4, the number of stations with increasing water flow in the warm season was higher in more recent study periods. When including more years in the past, mainly before 1986, more declining trends appeared. This was also observed in the Peace River stations, as shown in Table 5.
The increasing trend in the open warm season flow has been observed in the middle and lower ARB. Figure 6 shows the chronological change in the open warm season average every year between 1991 and 2020. The year 2015 appears to be an inflection point, after which the water flow at Athabasca (07BE001) and Fort McMurray (07DA001) started to increase every year. That behavior was not present in the upper ARB, where the water flow remained relatively constant. The increasing trend was reflected in the MK trend analysis shown in Table 3. However, its significance was lower than 90%.
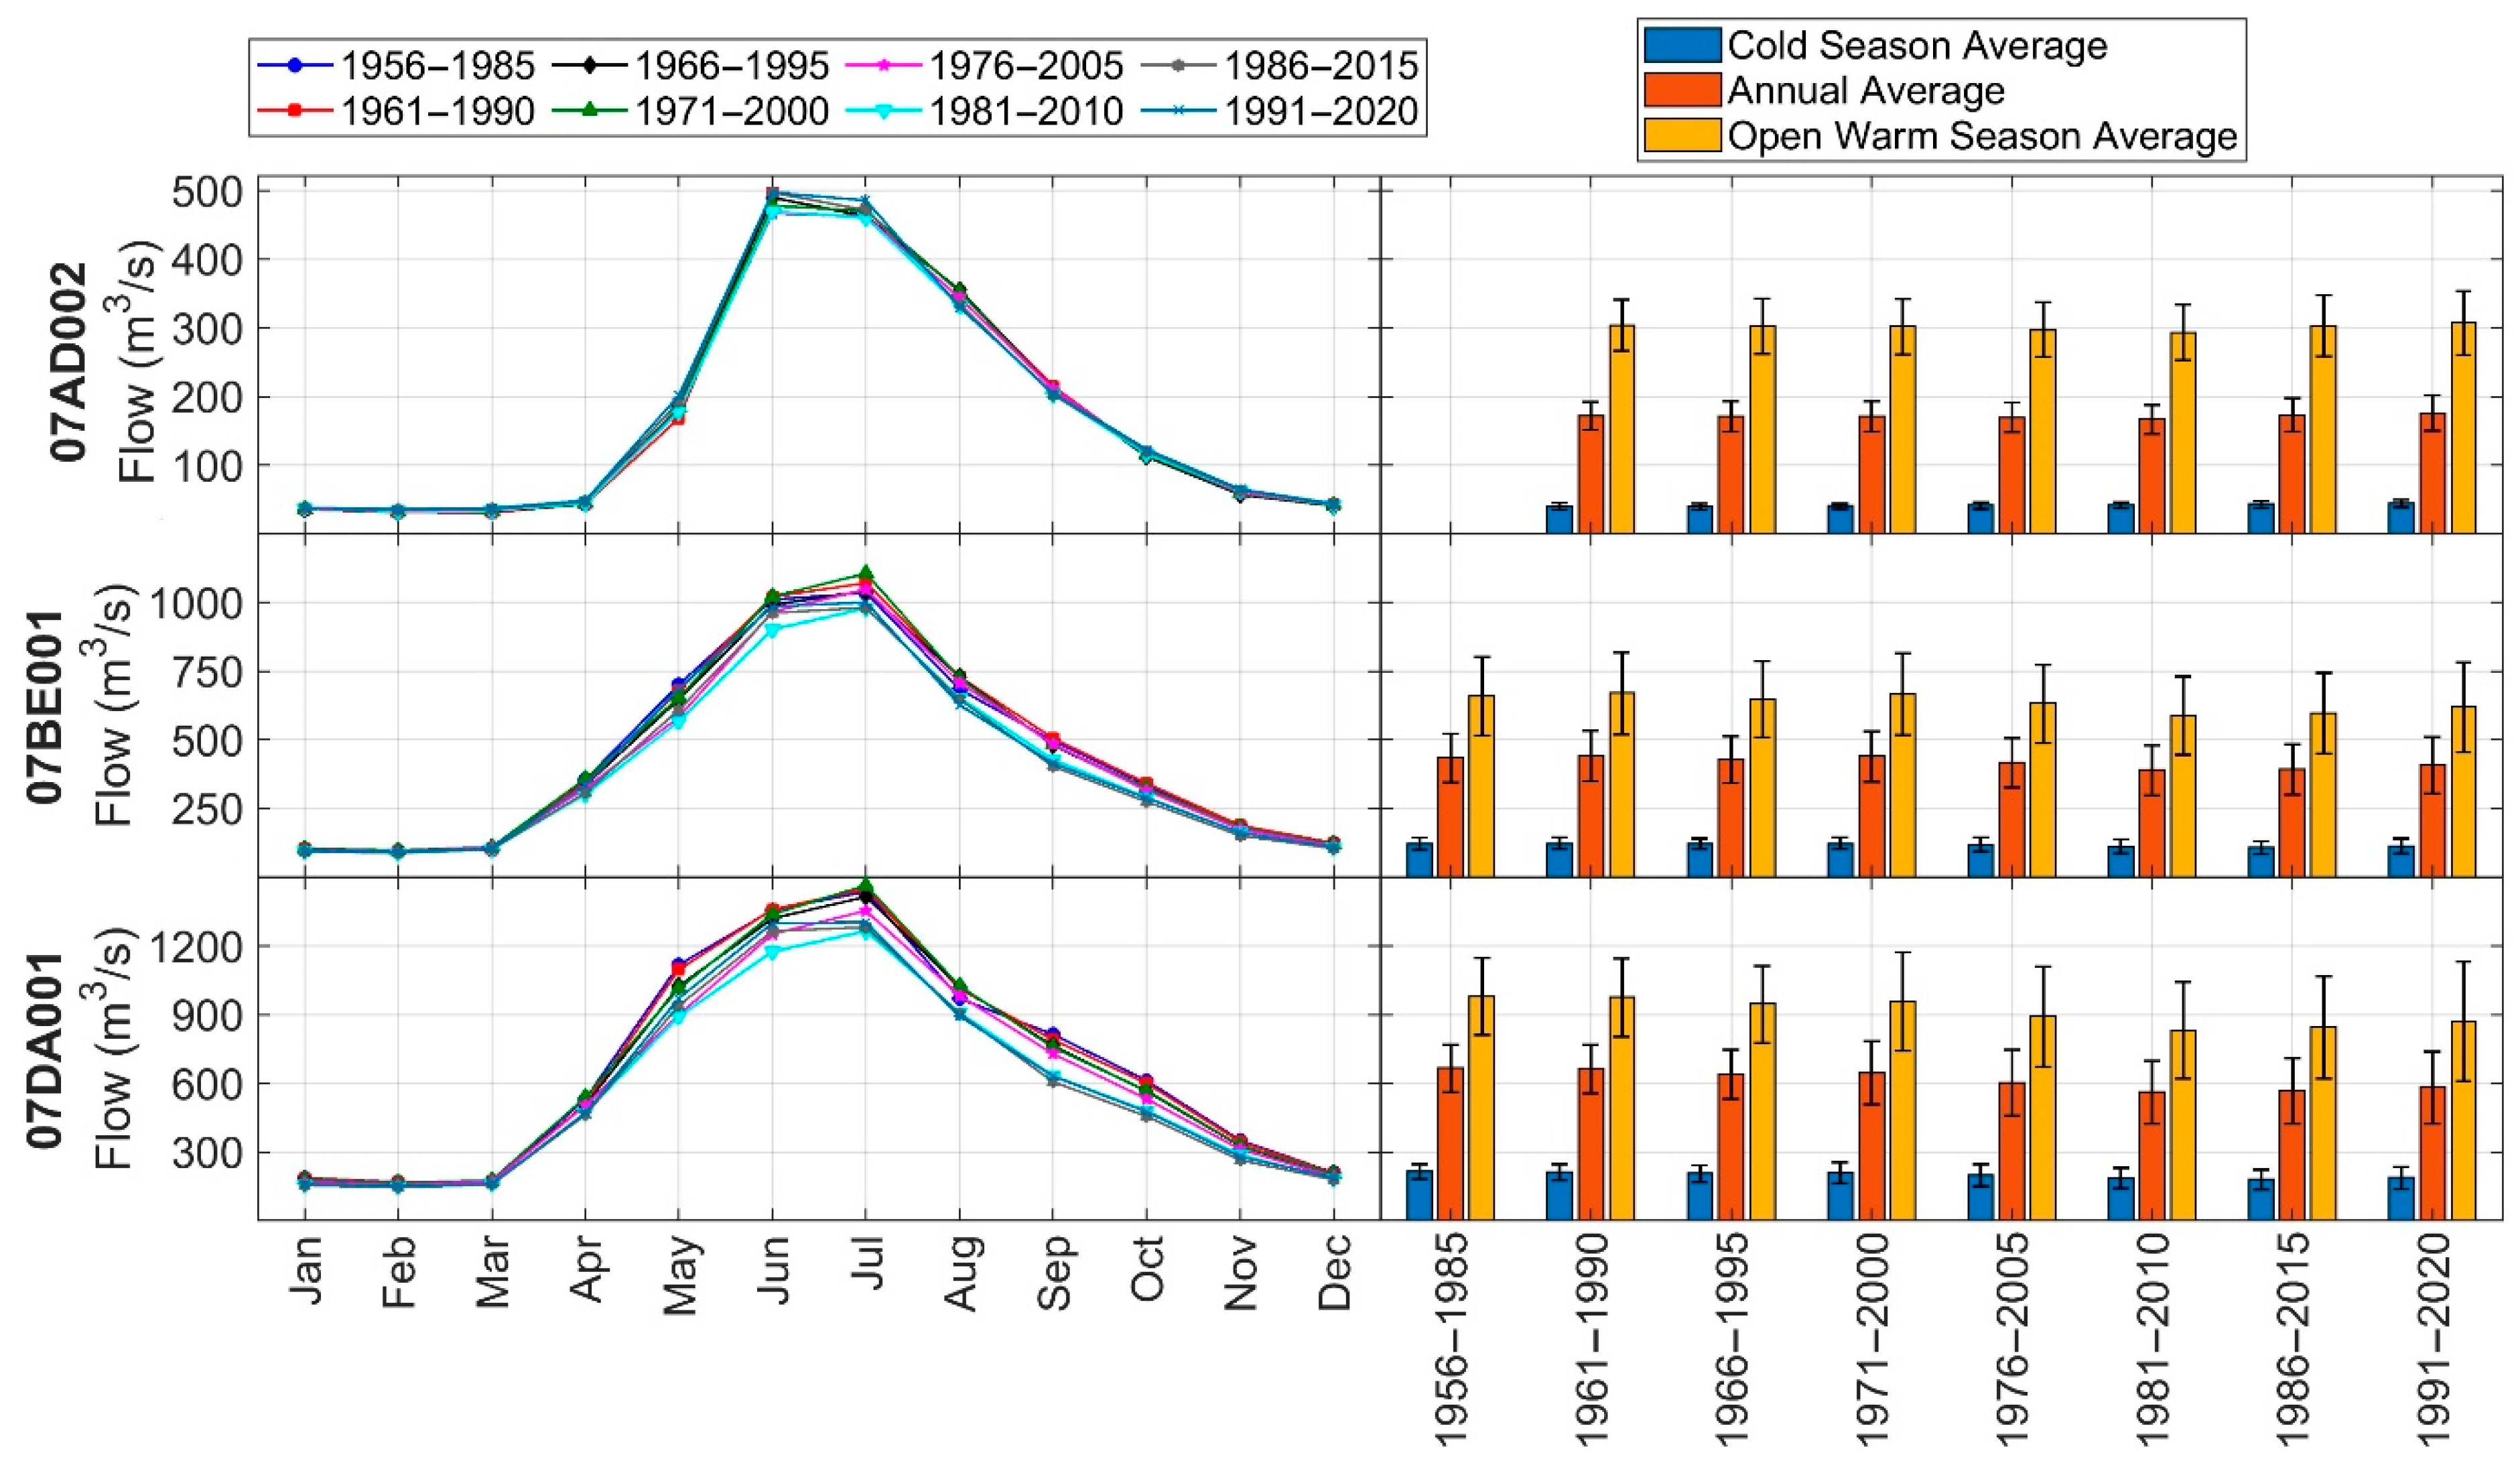
Analyzing 30-year windows of data that move every five years for the ARB since 1956 showed that the definition of cold and warm seasons can vary according to the climate and hydrology of the region. Possible regime shifts can be detected when analyzing the 30-year moving windows of data, which can reveal the periods when significant changes occurred. Figure 7 shows the average hydrographs of each of the 30-year windows, as well as the cold and warm season averages and the annual average for the three major stations along the Athabasca River. The remaining stations are shown in Figures S1 and S2 in the Supplementary Information. The hydrographs show that the month of April did not exhibit significant increases in water flow over the cold season months in all upper ARB stations. In the middle and lower subregions, the April water flow was significantly higher than the March water flow due to factors, such as warmer climate and flow contribution from other tributaries. For this reason, the calculation of the cold season and warm season averages for the ARB in this study was adjusted to reflect this behavior. The cold season was November to April in the ARB, while the rest of the year was considered open warm season. This was true in the upper ARB only, where the water flow in April was consistent with freezing conditions. The middle and lower ARB had high water flow measurements in April, which led to moving April to the warm season in these two subregions.
Stations 07GE001, 07GJ001, and 07KC001 are located on the Peace River with long-term and almost continuous historical records and in comparable locations to stations 07AD002, 07BE001, and 07DA001 along the Athabasca River, i.e., they are considered as a proxy for subregions of the Peace River Basin. Figure S2 includes the hydrographs of stations 07GE001, 07GJ001, and 07KC001. The hydrographs show that the Peace River has similar flowrates to the Athabasca River in the upper and middle subregions, but its lower subregion flowrate is higher. The Peace River had a consistent November-to-March cold season in its upper, middle, and lower reaches. Another observation was that the water flow in the cold months was significantly higher in the Peace River than in the Athabasca River.
The contribution of each of the upper, middle, and lower ARB subregions to the outlet water flow was calculated as percentages and shown in Figure 8. The only downstream WSC gauge station near the outlet of the Athabasca River, and with recorded water discharge data, was the Athabasca River Near Embarras Airport station (07DD001). The other stations used for representing the subregion contributions were the Athabasca River stations at Hinton (07AD002), Athabasca (07BE001), and below Fort McMurray (07DA001). Due to the presence of several data recording gaps, the only years where all four stations had complete annual recorded data were 1972, 1973, 1975, 2015, 2018, and 2019. These years were used to calculate the average water flow for each month and seasonal average and were plotted with the outlet water flow at Embarras Airport being 100%. Table 6 and Table 7 show the average flow percentages split according to the decade of available data.
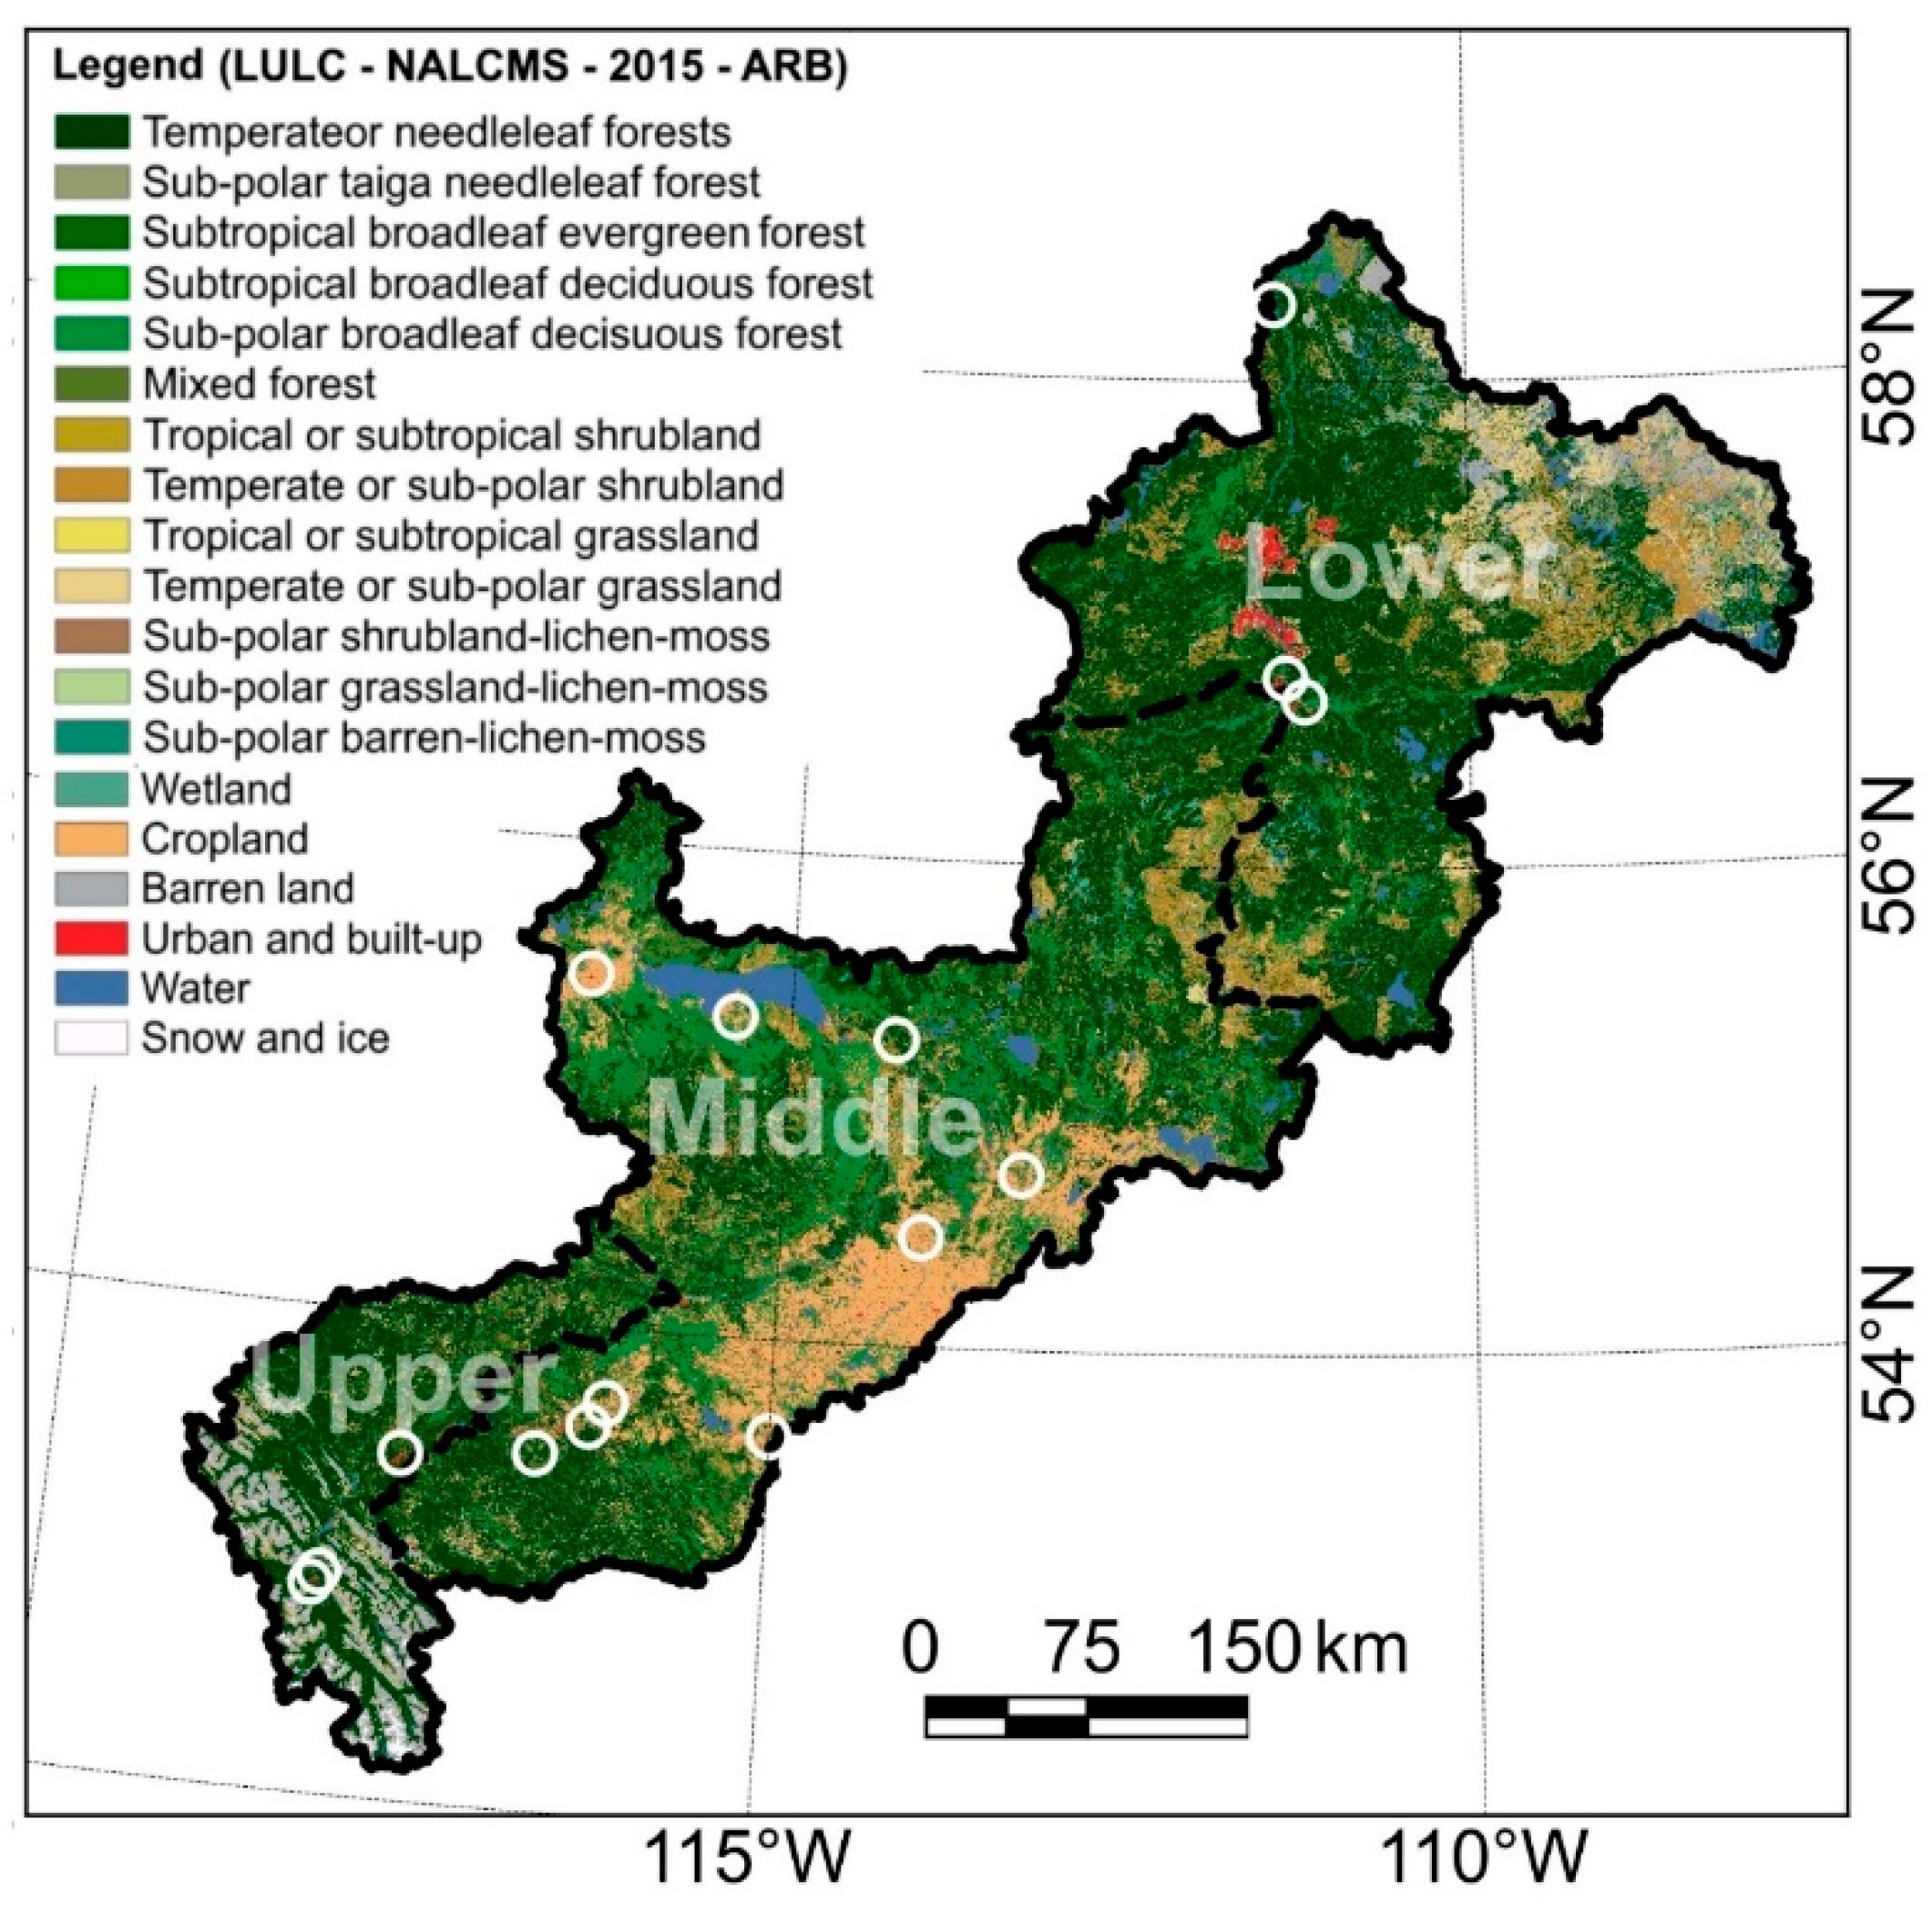
The contribution of each subregion to the downstream flowrate could be affected by physical characteristics such as topography, drainage patterns, and soil properties, as well as the land cover in the corresponding watershed. The LULC map shown in Figure 9 illustrates the prevalent land cover across the ARB in 2015. It is important to note that the LULC map is only relevant to the recent hydrology of the ARB, as historical LULC data were not available. The upper ARB is mainly mountainous, as it lies within the Rocky Mountains, with some forested cover. The middle ARB is covered with a mixture of grassland and forested areas. The lower ARB is also covered with grassland and forests, but the distribution is more uniform where the western side is more forested than the eastern side. The lower ARB is also home to the larger residential and industrial communities at Fort McMurray.
4. Discussion
In this study, a trend analysis was conducted on the water flow and climate data in the ARB region between 1956 and 2020. To the best of the knowledge of the authors, this study is the only one that included the recent records of the ARB (2010–2020). The study period of 1956–2020 for the water flow data provided a trade-off between a comprehensive historical analysis and the completeness of the datasets. Previous studies covered inconsistent study periods, which varied from 50 years [16,25] to more than 90 years [3,10]. In this study, the selection criteria of gauge stations were based on the presence of data gaps. It was found that records prior to 1956 were segmented and not suitable for robust trend analysis. In addition to the WSC data, the lower ARB water flow records from the RAMP dataset were also analyzed (see Supplementary Materials). While the RAMP data were also mostly seasonal and segmented, their results agreed with the results of the WSC data employed in this study.
The individual station water flow trend analysis demonstrated that the discharge in the Athabasca River has been steadily declining for the past 60 years, which is consistent with the literature [3,26]. The climate trends were also consistent with the hydrological behavior of the Athabasca River, where the precipitation has been declining across the ARB, with the most significant rate of −11.28 mm/decade at the upper ARB. The temperatures have also been steadily rising with a rate of 0.2–0.45 °C/decade across the ARB, leading to changes in the regional hydrology in terms of snowmelt, evapotranspiration, and groundwater table variation. The overall temperature within the ARB increased by about 2 °C during the past sixty years, particularly near Jasper. Previous studies on the climate trends between 1976 and 2010 were unable to detect significant trends in temperature [10,16], which could be due to several factors, such as pacific decadal oscillation, change in wet-dry cycles, and change in LULC [10]. The distribution of cooling and warming regions across ARB during warm seasons between 1976 and 2010 was approximately the same (see Figure 5 in [16]). In this study, when the period of record was expanded between 1950 and 2019 for climate data, the MK test revealed >99% significant increasing trends in temperature across the ARB, and most of the ARB showed significant warming trends during this period (see Figure 2). As Figure 3, Figure 4 and Figure 5 show, the temperature had an increasing trend with a faster rate during 1950–1989 than during 1990–2019, particularly with a negative rate during 1990–2019 for the upper ARB, though it was not statistically significant.
The trend results in this study agreed with earlier studies, where a significant decrease in the precipitation trend and a significant increase in the temperature trend were estimated over ARB [16,26]. However, the present study provided more in-depth trend results both spatially and temporally compared to earlier studies [16,26]. For example, herein, it was found that the overall precipitation in the upper ARB was declining in the more significantly than the middle and lower ARB during the past 70 years. In [26], climate trends for ARB were estimated for two regions, northern and southern ARB, and declining precipitation and increasing temperature since 1960 were observed for both regions. In the present research, however, ARB was divided into three subregions, where each subregion is relatively homogeneous in terms of topography, climate, land cover, soil type, and biodiversity [20]. Table 2 and Figure 2, Figure 3, Figure 4 and Figure 5 showed that the most significant declining precipitation was in the upper ARB, while the temperature was increasing for all the three subregions at a 99% confidence level since 1950.
The annual water flowrates for the three stations in Table 3 for the period 1961–2020 were approximately the same as the estimated flowrates shown in Table 3 in [26]. Other studies also estimated declining annual flowrates for longer historical periods [27]. However, in the present study, the flowrates for each month as well as cold and open warm seasons were also estimated, and it was observed that the flow in the upper ARB (07AD002, u3) was increasing during the cold months and cold season for all periods, 30-year to 60-year, particularly in March. In [27], it was reported that January and February for Hinton (u3) had an increasing flowrate, while July, August, and September showed a declining flowrate during 1955–2011, which is similar to the long-term trend analysis in this study (see Table 3). This shows that the gradual warming in the upper ARB had a profound impact on the melting of glaciers during cold months and particularly in early spring, contributing to water flow. While the flowrate had a declining trend for 07BE001 (m6) and 07DA001 (l2) during longer periods (e.g., 60-year), it was increasing significantly during the cold season in the recent period, 1991–2020. One reason is the water flow increase in the upper ARB during the cold season (minimum temperate rate of ~0.4 /decade), which significantly contributed to the total basin flow [20]. Table 6 and Table 7 show that the contribution of water flow from Hinton to the middle and lower Athabasca River was significantly higher in the recent years (2015, 2018, and 2019) compared to earlier years (1972, 1973, and 1975). Some studies [28,29] suggest that deep purple algae, likely because of forest fires, caused the glaciers to absorb more solar energy, which, together with winter warming, caused the rapid melting of glaciers over the last few decades. A significant positive flowrate in the tributaries of the Athabasca River was another major factor of flow increase in m6 and l2 during the recent decades. For example, Tables S1–S4 show a significant flowrate increase at a 99% confidence level since 1981 for 07CD001 (l1), a major tributary of l2.
Figure 2 demonstrates a gradual warming trend and a declining precipitation rate near 07GE001 (p1) and 07GJ001 (p2), which are, respectively, stations at Wapiti River and Smoky River, one of the main tributaries of the Peace River. Tables S1–S3 show increasing trends in the cold season and the annual water flow at p1 and p2, whereas, for longer periods, the annual water flow had a declining trend for p1 and p2 though not statistically significant, which was similar to the results of the Athabasca River (see Tables S5–S7). The gradual melting of glaciers near p1 is likely one of the main contributing factors in water flow increase over the past few decades. Figure 7, Figures S1 and S2 demonstrate that the average water flow in the open warm season during 1981–2010 was relatively lower than other 30-year periods, particularly for stations 07GJ001 (p2), 07BE001 (m6), and 07DA001 (l2), where the water flow started to exhibit a positive gradient after 1981 (see Tables S1–S8). These results suggest the non-stationary behavior of water flow time series in the ARB and PRB, which is in line with the findings of Wu et al. [30].
Satellite remote sensing imagery acquired for 2001–2019 showed that grasslands and non-vegetated lands increased, while evergreen needleleaf forests decreased in the past two decades in the upper ARB [31], which is potentially a contributing factor to the high-altitude regional warming and water flow increase. Furthermore, an increase in water flow during 1991–2019 (see Table 3) is likely due to the recent changes in land cover of the ARB subregions. For example, from the same satellite imagery, it was observed that evergreen needleleaf forests in the middle ARB have increased by 4% per decade since 2001 [31]. Grasslands have also increased by 3% per decade since 2001 in the lower ARB, with a declining trend in forest cover [31]. Figure 3, Figure 4 and Figure 5 show that the annual precipitation had a decreasing trend for upper and lower ARB, while it had an increasing trend for the middle ARB during 1991–2019, though not statistically significant at 90%. These gradual changes in precipitation might have had a significant impact on the water flow and forest cover of middle ARB, which was increasing, and forest cover of upper and lower ARB, which was decreasing during 2001–2019, as observed from satellite imagery. Deforestation by human and wildfires were some other factors of declining trends in forest covers [15,29,31].
When including the most recent water flow data, it was observed that the water flow had been steadily increasing between 2015 and 2020 in the middle and lower ARB. For some of the stations, the flow had an increasing trend using the MK test, which was less than 90% significant. The MK trends since 1952 demonstrated that, while the water flow was decreasing, the number of stations with significant declining slopes was also decreasing. At the same time, the stations with increasing significant trends were increasing in recent times. Several reasons could contribute to this behavior, including changes in land cover, groundwater, and human activities within the ARB. The 2015 LULC map displayed in Figure 9 shows an abundance of grassland and peatland in the middle ARB, which can influence the water balance in the watershed. A recent study presented a surface-subsurface flow and evapotranspiration model for the ARB to study the effect of the distribution of forests and peatland on the water balance in the ARB [12]. They reported that the peatlands in the middle and lower ARB reduce evapotranspiration and increase water availability, which aligns with the findings of this study.
The contributions of the upper, middle, and lower subregions to the total discharge of the Athabasca River, shown in Figure 8, reflect the factors affecting the river water flow. The upper subregion water flow behavior, captured by stations 07AD002 and 07BE001, demonstrates significant seasonal variability, which indicates that the water flow is mainly driven by climatic factors, such as temperature and precipitation, leading to snowmelt. The middle and lower ARB demonstrated less seasonal variation due to the year-long contributions of different tributaries as well as the interaction with groundwater, which diluted the effect of the upper subregion seasonal variation. The abundance of peatland and grassland across the middle and lower ARB may also contribute to the lower seasonal variability due to lowering the impact of evapotranspiration [12]. The long-term warming and long-term precipitation decrease, as observed in Figure 3, Figure 4 and Figure 5, may potentially result in the reduction of water flow in the future, noting that glaciers in the upper ARB will disappear in the future due to their persistently negative mass balances [28].
The use of the MK trend test should be applied with care to any datasets characterized by the occurrence of seasonal regimes. Climate and water flow data are typically seasonal, with cyclic variations between warm and cold seasons. In this study, seasonality was eliminated by considering each month as a separate parameter, with the time steps being the years. In this case, each parameter represented the average of a specific month every year, which removes cyclic seasonal trends but retains other trends. Additionally, the correction of the MK test for serial correlation and regime shift has been a debatable topic in the literature [7,16]. A false trend can be detected in small datasets with small trend slopes due to linear serial correlations in the data. The Trend-Free Pre-Whitening (TFPW) correction can be applied to the dataset to remove the effect of serial correlation by distinguishing between the true trend and the serial correlation [32]. On the other hand, the TFPW correction was not recommended due to the significant power loss it causes, and it is not needed for sample sizes that exceed 50, as serial correlation was found to have a negligible effect on the rejection rate of the MK test in this case [33]. Natural variability in hydrologic data can cause regime shifts or a lack of continuity, which compromises the accuracy of the trend analysis that may be performed on the data [34]. Therefore, the data must be tested for the presence of regime shifts [35]. However, in the ARB, the water flow data did not exhibit signs of regime shifts and, therefore, was considered to reflect actual trends due to continuous climatic changes in the region [16].
5. Conclusions
In this study, trend analysis was conducted for the water flow and climate data in the ARB and PRB using the MK test and least-squares method. The data used in this study were collected from multiple locations across the entire ARB and PRB, with a period of record between 1956 and 2020 for water flow data and between 1950 and 2019 for climate data. The monthly, seasonal, and annual averaged trend analysis results for various historical periods were demonstrated. Possible interactions between climate, LULC, and water flow dynamics of the basins were also discussed. The findings of the study showed that, while the water flow trends in the past 60 years had a declining trend in the middle and lower subregions, the flowrate was increasing during the cold and open warm seasons over the past 30–40 years, which is likely because of the flowrate increase in the upper ARB and the recent climate and land cover changes in these subregions. The analysis of a longer climate record also confirmed an increasing trend in temperature and a decline in precipitation across the basins. Further research is recommended to analyze the contribution of the land cover and human activities to the water availability as well as the interaction between surface and groundwater in the different subregions of the ARB and PRB. It is also recommended to conduct the same analysis in the next five to ten years to confirm if the detected water flow increase will continue to occur. Finally, a comprehensive analysis of water availability across the entire ARB and PRB is recommended for future research, where a better understanding can be obtained regarding the contribution of climate, snowmelt, groundwater, and LULC to the Athabasca River and Peace River flows.
Supplementary Materials
The following are available online at https://www.mdpi.com/article/10.3390/hydrology9110197/s1, Figure S1: Hydrographs (left panels) and seasonal averages with standard deviation (right panels) of ARB stations; Figure S2: Hydrographs (left panels) and seasonal averages with standard deviation (right panels) of ARB stations (continued); Figure S3: Map of the RAMP and WSC gauging stations in the lower ARB. Some stations were replicated in the RAMP and WSC data under different IDs: 07DA006-S38, 07DA008-S07, 07DA018-S39, 07DB001-S26, 07DC001-S27, and 07DD001-S46; Figure S4: Hydrographs of the WSC stations between 1965 and 2020; Figure S5: Hydrographs of the RAMP stations between 1996 and 2017; Figure S6: Hydrographs of the RAMP stations between 1996 and 2017; Figure S7: Average flow percentages of hydrometric stations at Fort McMurray, Athabasca River below Eymundson Creek, and Embarras Airport for the years 2012, 2013, and 2014; Table S1: MK water flow slope and significance for a period of 30 years (1991–2020); Table S2: MK water flow slope and significance for a period of 35 years (1986–2020); Table S3: MK water flow slope and significance for a period of 40 years (1981–2020); Table S4: MK water flow slope and significance for a period of 45 years (1976–2020); Table S5: MK water flow slope and significance for a period of 50 years (1971–2020); Table S6: MK water flow slope and significance for a period of 55 years (1966–2020); Table S7: MK water flow slope and significance for a period of 60 years (1961–2020); Table S8: MK water flow slope and significance for a period of 65 years (1956–2020); Table S9: MK trend analysis of the RAMP water flow data for the time period of 1996–2017. Cells highlighted in red represent insufficient data for a robust analysis. Slope and significance (^ = 90%), (* = 95%), and (** = 99%); Table S10: MK trend analysis of the lower ARB water flow for the period of 1991–2020. Cells highlighted in red represent insufficient data for a robust analysis. Slope and significance (^ = 90%), (* = 95%), and (** = 99%); Table S11: MK trend analysis of the lower ARB water flow for the period of 1986–2020. Cells highlighted in red represent insufficient data for a robust analysis. Slope and significance (^ = 90%), (* = 95%), and (** = 99%); Table S12: MK trend analysis of the lower ARB water flow for the period of 1981–2020. Cells highlighted in red represent insufficient data for a robust analysis. Slope and significance (^ = 90%), (* = 95%), and (** = 99%); Table S13: MK trend analysis of the lower ARB water flow for the time period of 1976–2020. Cells highlighted in red represent insufficient data for a robust analysis. Slope and significance (^ = 90%), (* = 95%), and (** = 99%); Table S14: MK trend analysis of the lower ARB water flow for the period of 1971–2020. Cells highlighted in red represent insufficient data for a robust analysis. Slope and Significance (^ = 90%), (* = 95%), and (** = 99%); Table S15: MK trend analysis of the lower ARB water flow for the period of 1955–2020. Cells highlighted in red represent insufficient data for a robust analysis. Slope and significance (^ = 90%), (* = 95%), and (** = 99%)
Author Contributions
Conceptualization: M.S.Z., E.G. and Q.K.H.; formal analysis: M.S.Z., E.G. and H.D.; methodology: M.S.Z., E.G., H.D., B.F., A.G., H.E., G.A. and Q.K.H.; data curation: B.F.; supervision: Q.K.H.; writing—original draft: M.S.Z., E.G. and H.D.; writing—review and editing: B.F., A.G., H.E., G.A. and Q.K.H. All authors have read and agreed to the published version of the manuscript.
Funding
This research was funded by the Oil Sands Monitoring (OSM) Program of Alberta Environment and Protected Areas. It was independent of any position of the OSM Program. The fund was awarded to Q.K.H. and G.A. having an agreement number of 21GRRSD29. OSM had no role in the study design, data collection and analysis, decision to publish, and preparation of the manuscript.
Institutional Review Board Statement
Not applicable.
Informed Consent Statement
Not applicable.
Data Availability Statement
The data used in this research are available in public domain.
Acknowledgments
The authors would acknowledge the: (i) Government of Alberta for providing gridded climate data, and (ii) Water Survey of Canada for water flow data, and (iii) Commission for Environmental Cooperation for land use and land cover map, at free of cost.
Conflicts of Interest
The authors declare no conflict of interest.
References
- Xu, C.-Y.; Singh, V.P. Review on regional water resources assessment models under stationary and changing climate. Water Resour. Manag. 2004, 18, 591–612. [Google Scholar] [CrossRef] [Green Version]
- Wolfe, B.B.; Karst-Riddoch, T.L.; Vardy, S.R.; Falcone, M.D.; Hall, R.I.; Edwards, T.W.D. Impacts of climate and river flooding on the hydro-ecology of a floodplain basin, Peace-Athabasca Delta, Canada since AD 1700. Quat. Res. 2005, 64, 147–162. [Google Scholar] [CrossRef]
- Sauchyn, D.J.; St-Jacques, J.-M.; Luckman, B.H. Long-term reliability of the Athabasca River (Alberta, Canada) as the water source for oil sands mining. Proc. Natl. Acad. Sci. USA 2015, 112, 12621–12626. [Google Scholar] [CrossRef] [PubMed] [Green Version]
- Burn, D.H.; Elnur, M.A.H. Detection of hydrologic trends and variability. J. Hydrol. 2002, 255, 107–122. [Google Scholar] [CrossRef]
- Zhang, X.; Harvey, K.D.; Hogg, W.D.; Yuzyk, T.R. Trends in Canadian streamflow. Water Resour. Res. 2001, 37, 987–998. [Google Scholar] [CrossRef]
- Burn, D.H.; Abdul Aziz, O.I.; Pietroniro, A. A comparison of trends in hydrological variables for two watersheds in the Mackenzie River Basin. Can. Water Resour. J./Rev. Can. Ressour. Hydr. 2004, 29, 283–298. [Google Scholar] [CrossRef] [Green Version]
- Burn, D.H.; Cunderlik, J.M.; Pietroniro, A. Hydrological trends and variability in the Liard River basin/Tendances hydrologiques et variabilité dans le basin de la rivière Liard. Hydrol. Sci. J. 2004, 49, 53–67. [Google Scholar] [CrossRef] [Green Version]
- Rood, S.B.; Pan, J.; Gill, K.M.; Franks, C.G.; Samuelson, G.M.; Shepherd, A. Declining summer flows of Rocky Mountain rivers: Changing seasonal hydrology and probable impacts on floodplain forests. J. Hydrol. 2008, 349, 397–410. [Google Scholar] [CrossRef]
- Schindler, D.W.; Donahue, W.F. An impending water crisis in Canada’s western prairie provinces. Proc. Natl. Acad. Sci. USA 2006, 103, 7210–7216. [Google Scholar] [CrossRef] [Green Version]
- Peters, D.L.; Atkinson, D.; Monk, W.A.; Tenenbaum, D.E.; Baird, D.J. A multi-scale hydroclimatic analysis of runoff generation in the Athabasca River, western Canada. Hydrol. Process. 2013, 27, 1915–1934. [Google Scholar] [CrossRef]
- Belvederesi, C.; Zaghloul, M.S.; Achari, G.; Gupta, A.; Hassan, Q.K. Modelling river flow in cold and ungauged regions: A review of the purposes, methods, and challenges. Environ. Rev. 2022, 30, 159–173. [Google Scholar] [CrossRef]
- Hwang, H.T.; Park, Y.J.; Sudicky, E.A.; Berg, S.J.; McLaughlin, R.; Jones, J.P. Understanding the water balance paradox in the Athabasca River Basin, Canada. Hydrol. Process. 2018, 32, 729–746. [Google Scholar] [CrossRef]
- Shah, M.I.; Khan, A.; Akbar, T.A.; Hassan, Q.K.; Khan, A.J.; Dewan, A. Predicting hydrologic responses to climate changes in highly glacierized and mountainous region Upper Indus Basin. R. Soc. Open Sci. 2020, 7, 191957. [Google Scholar] [CrossRef] [PubMed]
- Hassan, Q.K.; Ejiagha, I.R.; Ahmed, M.R.; Gupta, A.; Rangelova, E.; Dewan, A. Remote sensing of local warming trend in Alberta, Canada during 2001–2020, and its relationship with large-scale atmospheric circulations. Remote Sens. 2021, 13, 3441. [Google Scholar] [CrossRef]
- Afrin, S.; Gupta, A.; Farjad, B.; Razu Ahmed, M.; Achari, G.; Hassan, Q. Development of land-use/land-cover maps using landsat-8 and MODIS data, and their integration for hydro-ecological applications. Sensors 2019, 19, 4891. [Google Scholar] [CrossRef] [Green Version]
- Bawden, A.J.; Linton, H.C.; Burn, D.H.; Prowse, T.D. A spatiotemporal analysis of hydrological trends and variability in the Athabasca River region, Canada. J. Hydrol. 2014, 509, 333–342. [Google Scholar] [CrossRef]
- McKenney, D.W.; Hutchinson, M.F.; Papadopol, P.; Lawrence, K.; Pedlar, J.; Campbell, K.; Milewska, E.; Hopkinson, R.F.; Price, D.; Owen, T. Customized spatial climate models for North America. Bull. Am. Meteorol. Soc. 2011, 92, 1611–1622. [Google Scholar] [CrossRef] [Green Version]
- Eum, H.-I.; Gupta, A. Hybrid climate datasets from a climate data evaluation system and their impacts on hydrologic simulations for the Athabasca River basin in Canada. Hydrol. Earth Syst. Sci. 2019, 23, 5151–5173. [Google Scholar] [CrossRef] [Green Version]
- Belvederesi, C.; Dominic, J.A.; Hassan, Q.K.; Gupta, A.; Achari, G. Short-Term River Flow Forecasting Framework and Its Application in Cold Climatic Regions. Water 2020, 12, 3049. [Google Scholar] [CrossRef]
- Dibike, Y.; Eum, H.-I.; Prowse, T. Modelling the Athabasca watershed snow response to a changing climate. J. Hydrol. Reg. Stud. 2018, 15, 134–148. [Google Scholar] [CrossRef]
- Latifovic, R.; Pouliot, D.; Olthof, I. Circa 2010 land cover of Canada: Local optimization methodology and product development. Remote Sens. 2017, 9, 1098. [Google Scholar] [CrossRef] [Green Version]
- Kendall, M.G. Rank Correlation Methods; American Psychological Association: Washington, DC, USA, 1948. [Google Scholar]
- Mann, H.B. Nonparametric tests against trend. Econom. J. Econom. Soc. 1945, 13, 245–259. [Google Scholar] [CrossRef]
- Sen, P.K. Estimates of the regression coefficient based on Kendall’s tau. J. Am. Stat. Assoc. 1968, 63, 1379–1389. [Google Scholar] [CrossRef]
- Rasouli, K.; Hernández-Henríquez, M.A.; Déry, S.J. Streamflow input to Lake Athabasca, Canada. Hydrol. Earth Syst. Sci. 2013, 17, 1681–1691. [Google Scholar] [CrossRef] [Green Version]
- Ghaderpour, E.; Vujadinovic, T.; Hassan, Q.K. Application of the Least-Squares Wavelet software in hydrology: Athabasca River Basin. J. Hydrol. Reg. Stud. 2021, 36, 100847. [Google Scholar] [CrossRef]
- Rood, S.B.; Stupple, G.W.; Gill, K.M. Century-long records reveal slight, ecoregion-localized changes in Athabasca River flows. Hydrol. Process. 2015, 29, 805–816. [Google Scholar] [CrossRef]
- Pradhananga, D.; Pomeroy, J.W. Diagnosing changes in glacier hydrology from physical principles, using a hydrological model with snow redistribution, sublimation, firnification and energy balance ablation algorithms. J. Hydrol. 2022, 608, 127545. [Google Scholar] [CrossRef]
- Wheater, H.S.; Pomeroy, J.W.; Pietroniro, A.; Davison, B.; Elshamy, M.; Yassin, F.; Rokaya, P.; Fayad, A.; Tesemma, Z.; Princz, D.; et al. Advances in modelling large river basins in cold regions with Modélisation Environmentale Communautaire—Surface and Hydrology (MESH), the Canadian hydrological land surface scheme. Hydrol. Process. 2022, 36, e14557. [Google Scholar] [CrossRef]
- Wu, Y.; Gan, T.Y.; She, Y.; Xu, C.; Yan, H. Five centuries of reconstructed streamflow in Athabasca River Basin, Canada: Non-stationarity and teleconnection to climate patterns. Sci. Total Environ. 2020, 746, 141330. [Google Scholar] [CrossRef]
- Dastour, H.; Ghaderpour, E.; Zaghloul, M.S.; Farjad, B.; Gupta, A.; Eum, H.; Achari, G.; Hassan, Q.K. Wavelet-based spatiotemporal analyses of climate and vegetation for the Athabasca River basin in Canada. Int. J. Appl. Earth Obs. Geoinf. 2022, 114, 103044. [Google Scholar] [CrossRef]
- Yue, S.; Pilon, P.; Phinney, B.; Cavadias, G. The influence of autocorrelation on the ability to detect trend in hydrological series. Hydrol. Process. 2002, 16, 1807–1829. [Google Scholar] [CrossRef]
- Bayazit, M.; Önöz, B. To prewhiten or not to prewhiten in trend analysis? Hydrol. Sci. J. 2007, 52, 611–624. [Google Scholar] [CrossRef]
- Stewart, I.T.; Cayan, D.R.; Dettinger, M.D. Changes toward earlier streamflow timing across western North America. J. Clim. 2005, 18, 1136–1155. [Google Scholar] [CrossRef]
- Rodionov, S. A sequential method of detecting abrupt changes in the correlation coefficient and its application to Bering Sea climate. Climate 2015, 3, 474–491. [Google Scholar] [CrossRef]
Figure 1.
Map of the ARB and its location and topography, and the ID and locations of the waterflow gauging stations used in this study. Hydrometric stations marked with closed circles were considered to represent the subregion in which they lie because they are located along the Athabasca River and provided long-duration and continuous flow measurements. Note that l2 was the only station that provided continuous historical records since 1956 as compared to other stations in the lower ARB; see the Supplementary Materials. Stations p1, p2, and p3 are in the PRB.

Figure 2.
Spatiotemporal maps for daily maximum and minimum temperatures and yearly accumulated precipitation since 1950 (top three panels show the climate mean, and bottom three panels show the rates of change since 1950).
Figure 2.
Spatiotemporal maps for daily maximum and minimum temperatures and yearly accumulated precipitation since 1950 (top three panels show the climate mean, and bottom three panels show the rates of change since 1950).

Figure 3.
Climate trend analysis results for the lower ARB. The statistically significant slopes are marked by stars: (** = 95%), (*** = 99%).
Figure 3.
Climate trend analysis results for the lower ARB. The statistically significant slopes are marked by stars: (** = 95%), (*** = 99%).

Figure 4.
Climate trend analysis results for the middle ARB. The statistically significant slopes are marked by stars: (* = 90%), (*** = 99%).
Figure 4.
Climate trend analysis results for the middle ARB. The statistically significant slopes are marked by stars: (* = 90%), (*** = 99%).

Figure 5.
Climate trend analysis results for the upper ARB. The statistically significant slopes are marked by stars: (** = 95%), (*** = 99%).
Figure 5.
Climate trend analysis results for the upper ARB. The statistically significant slopes are marked by stars: (** = 95%), (*** = 99%).

Figure 6.
Time series of the open warm season average flowrate between 1991 and 2020.

Figure 7.
Hydrographs (left panels) and seasonal averages with the standard deviation (right panels) of stations 07AD002 (u3), 07BE001 (m6), and 07DA001 (l2), which represent the upper, middle, and lower ARB, respectively.
Figure 7.
Hydrographs (left panels) and seasonal averages with the standard deviation (right panels) of stations 07AD002 (u3), 07BE001 (m6), and 07DA001 (l2), which represent the upper, middle, and lower ARB, respectively.

Figure 8.
Average flow percentages of hydrometric stations at Hinton, Athabasca, below Fort McMurray, and Embarras Airport for the years 1972, 1973, 1975, 2015, 2018, and 2019.
Figure 8.
Average flow percentages of hydrometric stations at Hinton, Athabasca, below Fort McMurray, and Embarras Airport for the years 1972, 1973, 1975, 2015, 2018, and 2019.

Figure 9.
LULC map of the ARB with the hydrometric gauging stations marked as white circles.


Table 1.
Gauging station attributes in the ARB and surrounding area. Letters u, m, and l in the first column refer to the upper, middle, and lower ARB, respectively. Additionally, letter p in the first column refers to the PRB.
Table 1.
Gauging station attributes in the ARB and surrounding area. Letters u, m, and l in the first column refer to the upper, middle, and lower ARB, respectively. Additionally, letter p in the first column refers to the PRB.
| Label | Station ID | Station Name | Latitude | Longitude | Drainage Area (km2) | Elevation (m) | Period of Record |
|---|---|---|---|---|---|---|---|
| u1 | 07AA001 | Miette River near Jasper | 52.8641 | −118.107 | 629 | 1062 | 1976–2020 |
| u2 | 07AA002 | Athabasca River near Jasper | 52.9102 | −118.059 | 3870 | 1059 | 1971–2020 |
| u3 | 07AD002 | Athabasca River at Hinton | 53.4243 | −117.569 | 9760 | 954 | 1961–2020 |
| m1 | 07AF002 | Mcleod River above Embarras River | 53.4702 | −116.631 | 2560 | 920 | 1956–2020 |
| m2 | 07AG003 | Wolf Creek at Highway No. 16A | 53.5984 | −116.272 | 826 | 862 | 1956–2020 |
| m3 | 07AG007 | Mcleod River near Rosevear | 53.697 | −116.162 | 7140 | 822 | 1986–2020 |
| m4 | 07BB002 | Pembina River near Entwistle | 53.6042 | −115.005 | 4400 | 718 | 1956–2020 |
| m5 | 07BC002 | Pembina River at Jarvie | 54.4503 | −113.993 | 13,100 | 609 | 1961–2020 |
| m6 | 07BE001 | Athabasca River at Athabasca | 54.722 | −113.288 | 74,600 | 516 | 1956–2020 |
| m7 | 07BF002 | West Prairie River near High Prairie | 55.4482 | −116.493 | 1150 | 588 | 1971–2020 |
| m8 | 07BJ001 | Swan River near Kinuso | 55.3155 | −115.417 | 1900 | 588 | 1971–2020 |
| m9 | 07BK007 | Driftwood River near the Mouth | 55.2555 | −114.231 | 2100 | 550 | 1971–2020 |
| l1 | 07CD001 | Clearwater River at Draper | 56.6853 | −111.255 | 30,800 | 261 | 1956–2020 |
| l2 | 07DA001 | Athabasca River below Fort McMurray | 56.7803 | −111.402 | 133,000 | 237 | 1956–2020 |
| l3 | 07DD001 | Athabasca River at Embarras Airport | 58.3126 | −111.515 | 155,000 | 225 | 1971–2019 |
| p1 | 07GE001 | Wapiti River near Grande Prairie | 55.0713 | −118.803 | 11,300 | 514 | 1961–2020 |
| p2 | 07GJ001 | Smoky River at Watino | 55.7146 | −117.623 | 50,300 | 378 | 1956–2020 |
| p3 | 07KC001 | Peace River at Peace Point (Alberta) | 59.1181 | −112.437 | 293,000 | 228 | 1961–2020 |
Table 2.
MK trend slopes of climate data in the ARB between 1950 and 2019.
| Slope (Per Decade) and Significance (* = 90%) (*** = 99%) | ||||
|---|---|---|---|---|
| Precipitation (mm/10 Year) | Max Temp. (°C/10 Year) | Min Temp. (°C/10 Year) | Average Temp. (°C/10 Year) | |
| Upper ARB | −11.28 * | 0.23 *** | 0.17 *** | 0.2 *** |
| Middle ARB | −3.7 | 0.27 *** | 0.33 *** | 0.3 *** |
| Lower ARB | −0.5 | 0.28 *** | 0.45 *** | 0.37 *** |
Table 3.
Mann-Kendall water flow trend slopes and significance. Stations 07AD002 (u3), 07BE001 (m6), and 07DA001 (l2) are in the upper, middle, and lower ARB, respectively.
Table 3.
Mann-Kendall water flow trend slopes and significance. Stations 07AD002 (u3), 07BE001 (m6), and 07DA001 (l2) are in the upper, middle, and lower ARB, respectively.
| Slope (m3/Year) and Significance (* = 90%) (** = 95%) (*** = 99%) | ||||||||||||||||
|---|---|---|---|---|---|---|---|---|---|---|---|---|---|---|---|---|
| Period | Station ID | Jan | Feb | Mar | Apr | May | Jun | Jul | Aug | Sep | Oct | Nov | Dec | Cold Season | Annual Average | Open Warm Season |
| 30 Years (1991–2020) | 07AD002 | 0.12 | 0.23 ** | 0.35 *** | 0.33 | 1.78 | 3.14 | 0.44 | −0.41 | 1.08 | 0.78 | 0.66 ** | 0.16 | 0.3 ** | 0.91 | 1.48 |
| 07BE001 | 0.73 | 1.02 * | 0.73 | 3.17 | 10.33 * | 8.06 | −0.91 | −2.24 | 2.83 | 2.64 | 1.33 | 1.26 * | 1.35 ** | 2.85 | 4.74 | |
| 07DA001 | 1.31 | 1.25 | 1 | −1.28 | 10.06 | 15 | 0.42 | −2.26 | 1.81 | 5.07 * | 2.11 | 1.8 | 1.74 ** | 4.29 | 5.59 | |
| 35 Years (1986–2020) | 07AD002 | 0.11 | 0.26 *** | 0.36 *** | 0.31 | 0.54 | 1 | 1.11 | −1.04 | 0.71 | 0.63 | 0.42 * | 0.14 | 0.27 *** | 0.55 | 0.79 |
| 07BE001 | 0.33 | 0.66 | 0.25 | 2.56 | 9.67 ** | 4.79 | −4.23 | −4.57 | 0.57 | 1.57 | 0.6 | 0.74 | 0.71 | 1.12 | 1.96 | |
| 07DA001 | 0.75 | 0.7 | 0.47 | −1.78 | 7.6 | 7.78 | −3.93 | −6 | −0.5 | 2.89 | 1 | 0.67 | 0.82 | 0.26 | 1.45 | |
| 40 Years (1981–2020) | 07AD002 | 0.02 | 0.29 *** | 0.30 *** | 0.33 ** | 1.17 | 2.23 | 1.09 | −0.88 | 0.2 | 0.58 | 0.34 * | 0.15 | 0.26 *** | 0.61 * | 0.91 |
| 07BE001 | −0.05 | 0.4 | 0 | 2.09 | 8.44 ** | 4.9 | −2.28 | −3.29 | −0.64 | 0.58 | −0.2 | 0.27 | 0.05 | 0.75 | 1.14 | |
| 07DA001 | 0.21 | 0.17 | 0.18 | −0.89 | 5.04 | 8.27 | −3.42 | −3.05 | −1.46 | 0.69 | −0.38 | 0.17 | −0.02 | 0.03 | 1 | |
| 45 Years (1976–2020) | 07AD002 | 0.11 | 0.24 *** | 0.25 *** | 0.25 ** | 1 | 2 | 0.86 | −0.63 | −0.05 | 0.4 | 0.44 *** | 0.14 | 0.26 *** | 0.47 | 0.74 |
| 07BE001 | −0.29 | −0.01 | −0.35 | 0.22 | 4.18 | 1.54 | −3.59 | −4 ** | −2.92 * | −0.79 | −0.67 | −0.04 | −0.26 | −0.79 | −1.28 | |
| 07DA001 | −0.87 | −0.53 | −0.56 | −3.24 | 1.9 | 3.2 | −4.42 | −5.88 | −5.73 ** | −2.16 | −1.51 | −0.51 | −0.81 | −1.82 | −2.42 | |
| 50 Years (1971–2020) | 07AD002 | 0.14 ** | 0.2 *** | 0.21 *** | 0.24 *** | 0.80 | 1.07 | 0.43 | −0.63 | 0.14 | 0.33 | 0.39 *** | 0.1 | 0.22 *** | 0.31 | 0.44 |
| 07BE001 | −0.26 | −0.09 | −0.21 | −0.75 | 0.73 | −0.5 | −5 | −3.37 ** | −2.21 * | −1.18 | −0.9 | −0.19 | −0.29 | −1.87 | −2.73 | |
| 07DA001 | −1 * | −0.69 | −0.56 | −3.59 | −3.04 | −2.29 | −8.61 * | −6.32 ** | −5.09 ** | −3.25 * | −2 * | −0.8 | −1.02 ** | −3.09 *** | −4.61 ** | |
| 55 Years (1966–2020) | 07AD002 | 0.1 * | 0.12 *** | 0.19 *** | 0.21 *** | 0.75 | 0.35 | 0.10 | −1.08 ** | −0.01 | 0.28 | 0.32 *** | 0.1 | 0.17 *** | 0.14 | 0.15 |
| 07BE001 | −0.14 | 0.02 | 0.06 | 0.11 | 1.09 | 0.24 | −1.33 | −3.13 ** | −1.78 * | −0.58 | −0.45 | −0.08 | −0.11 | −0.75 | −1.28 | |
| 07DA001 | −0.64 | −0.45 | −0.34 | −1.84 | −2.84 | −0.79 | −5 | −5.26 ** | −4.46 ** | −2.75 * | −1.4 * | −0.47 | −0.62 | −2.34 ** | −3.27 * | |
| 60 Years (1961–2020) | 07AD002 | 0.12 ** | 0.13 *** | 0.23 *** | 0.14 ** | 1 * | −0.08 | −0.25 | −0.9 ** | −0.18 | 0.12 | 0.2 * | 0.06 | 0.14 *** | 0.06 | −0.01 |
| 07BE001 | −0.11 | 0.06 | 0.19 | −0.21 | −0.03 | −0.26 | −0.91 | −2.9 ** | −1.78 * | −0.88 | −0.57 | −0.16 | −0.08 | −0.75 | −1.27 | |
| 07DA001 | −0.64 * | −0.43 | −0.22 | −1.2 | −4.5 | −1.73 | −3.77 | −4.14 * | −3.88 ** | −2.64 ** | −1.4 ** | −0.49 | −0.64 * | −2.26 ** | −2.99 ** | |
| 65 Years (1956–2020) | 07BE001 | 0 | 0.14 | 0.23 | −0.29 | 0.1 | 0.03 | 0.12 | −1.64 | −1.28 | −0.48 | −0.16 | −0.05 | 0.02 | −0.29 | −0.43 |
| 07DA001 | −0.57 | −0.32 | −0.1 | −1.67 | −3.78 | −1.29 | −2.93 | −2.5 | −3.75 ** | −2.2 ** | −1.2 ** | −0.47 | −0.54 | −1.93 ** | −2.61 * | |
Table 4.
Number of gauging stations with a significant increasing (↑) or decreasing (↓) water flow trend (≥90% significance) in the ARB.
Table 4.
Number of gauging stations with a significant increasing (↑) or decreasing (↓) water flow trend (≥90% significance) in the ARB.
| 30 Years (1991–2020) n = 14 | 35 Years (1986–2020) n = 14 | 40 Years (1981–2020) n = 13 | 45 Years (1976–2020) n = 13 | 50 Years (1971–2020) n = 12 | 55 Years (1966–2020) n = 8 | 60 Years (1961–2020) n = 8 | 65 Years (1956–2020) n = 6 | |
|---|---|---|---|---|---|---|---|---|
| Jan | 0-0 | 0-0 | 0-0 | 0-0 | 0-0 | 0-0 | 0-0 | 0-0 |
| Feb | 0-0 | 0-0 | 0-0 | 0-0 | 0-0 | 0-0 | 0-0 | 0-0 |
| Mar | 0-0 | 0-0 | 0-0 | 0-0 | 0-0 | 0-0 | 0-0 | 0-0 |
| Apr | 1↑-0 | 1↑-1↓ | 1↑-0 | 0-1↓ | 0-1↓ | 0-1↓ | 0-0 | 0-1↓ |
| May | 4↑-0 | 2↑-0 | 2↑-0 | 2↑-0 | 0-1↓ | 0-1↓ | 0-1↓ | 0-1↓ |
| Jun | 5↑-0 | 4↑-0 | 3↑-0 | 2↑-0 | 0-1↓ | 0-0 | 0-1↓ | 0-0 |
| Jul | 1↑-0 | 1↑-2↓ | 1↑-2↓ | 0-2↓ | 0-2↓ | 0-1↓ | 0-1↓ | 0-1↓ |
| Aug | 1↑-2↓ | 1↑-2↓ | 0-2↓ | 0-2↓ | 0-2↓ | 0-2↓ | 0-2↓ | 0-1↓ |
| Sep | 3↑-0 | 1↑-0 | 1↑-0 | 0-2↓ | 0-2↓ | 0-2↓ | 0-2↓ | 0-1↓ |
| Oct | 3↑-0 | 2↑-0 | 0-0 | 0-1↓ | 0-1↓ | 0-1↓ | 0-1↓ | 0-1↓ |
| Nov | 1↑-0 | 0-0 | 0-0 | 0-0 | 0-1↓ | 0-0 | 0-0 | 0-0 |
| Dec | 1↑-0 | 0-0 | 0-0 | 0-0 | 0-0 | 0-0 | 0-0 | 0-0 |
| Cold Season Average | 1↑-0 | 0-0 | 0-0 | 0-0 | 0-0 | 0-0 | 0-0 | 0-0 |
| Annual Avg | 2↑-0 | 0-0 | 0-0 | 0-1↓ | 0-2↓ | 0-1↓ | 0-1↓ | 0-1↓ |
| Open Warm Season Avg | 3↑-0 | 1↑-0 | 0-0 | 0-1↓ | 0-2↓ | 0-1↓ | 0-1↓ | 0-1↓ |
Table 5.
Number of gauging stations with a significant increasing (↑) or decreasing (↓) water flow trend (≥90% significance) along the Peace River.
Table 5.
Number of gauging stations with a significant increasing (↑) or decreasing (↓) water flow trend (≥90% significance) along the Peace River.
| 30 Years (1991–2020) n = 3 | 35 Years (1986–2020) n = 3 | 40 Years (1981–2020) n = 3 | 45 Years (1976–2020) n = 3 | 50 Years (1971–2020) n = 3 | 55 Years (1966–2020) n = 3 | 60 Years (1961–2020) n = 3 | 65 Years (1956–2020) n = 1 | |
|---|---|---|---|---|---|---|---|---|
| Jan | 0-1↓ | 0-1↓ | 0-1↓ | 0-1↓ | 0-0 | 1↑-0 | 1↑-0 | 0-0 |
| Feb | 0-1↓ | 0-1↓ | 0-1↓ | 0-1↓ | 0-0 | 1↑-0 | 1↑-0 | 0-0 |
| Mar | 0-1↓ | 0-1↓ | 1↑-0 | 1↑-0 | 1↑-0 | 1↑-0 | 1↑-0 | 0-0 |
| Apr | 1↑-1↓ | 1↑-1↓ | 1↑-1↓ | 1↑-0 | 1↑-0 | 1↑-0 | 1↑-0 | 0-0 |
| May | 2↑-1↓ | 2↑-1↓ | 1↑-1↓ | 1↑-1↓ | 0-1↓ | 0-1↓ | 0-2↓ | 0-1↓ |
| Jun | 2↑-0 | 1↑-1↓ | 1↑-1↓ | 0-2↓ | 0-2↓ | 0-2↓ | 0-2↓ | 0-1↓ |
| Jul | 1↑-1↓ | 1↑-1↓ | 0-1↓ | 0-1↓ | 0-1↓ | 0-1↓ | 0-1↓ | 0-0 |
| Aug | 1↑-0 | 1↑-0 | 0-2↓ | 0-2↓ | 0-1↓ | 0-1↓ | 0-2↓ | 0-0 |
| Sep | 1↑-0 | 1↑-0 | 0-1↓ | 0-1↓ | 0-1↓ | 0-0 | 0-0 | 0-0 |
| Oct | 0-1↓ | 0-1↓ | 0-1↓ | 0-1↓ | 0-1↓ | 0-1↓ | 0-1↓ | 0-0 |
| Nov | 0-1↓ | 0-1↓ | 0-1↓ | 0-1↓ | 0-1↓ | 1↑-0 | 1↑-0 | 0-0 |
| Dec | 0-1↓ | 0-1↓ | 0-1↓ | 0-1↓ | 0-0 | 1↑-0 | 1↑-0 | 0-0 |
| Cold Season Average | 0-1↓ | 0-1↓ | 0-1↓ | 0-1↓ | 0-0 | 1↑-0 | 1↑-0 | 0-0 |
| Annual Avg | 1↑-0 | 1↑-1↓ | 0-1↓ | 0-1↓ | 0-1↓ | 0-1↓ | 0-1↓ | 0-0 |
| Open Warm Season Avg | 1↑-1↓ | 1↑-1↓ | 1↑-1↓ | 0-1↓ | 0-1↓ | 0-1↓ | 0-2↓ | 0-0 |
Table 6.
Average flow at hydrometric stations at Hinton (07AD002, u3), Athabasca (07BE001, m6), and below Fort McMurray (07DA001, l2) as a percentage of flow at the outlet Embarras Airport (07DD001, l3) for the years 1972, 1973, and 1975.
Table 6.
Average flow at hydrometric stations at Hinton (07AD002, u3), Athabasca (07BE001, m6), and below Fort McMurray (07DA001, l2) as a percentage of flow at the outlet Embarras Airport (07DD001, l3) for the years 1972, 1973, and 1975.
| 07AD002 | 07BE001 | 07DA001 | 07DD001 | |
|---|---|---|---|---|
| Jan | 17.38 | 58.95 | 103.32 | 100 |
| Feb | 17.92 | 61.55 | 102.93 | 100 |
| Mar | 18.02 | 53.44 | 93.63 | 100 |
| Apr | 7.952 | 68.25 | 95.31 | 100 |
| May | 11.87 | 55.76 | 85.98 | 100 |
| Jun | 31.61 | 67.86 | 93.90 | 100 |
| Jul | 26.18 | 58.49 | 87.83 | 100 |
| Aug | 28.47 | 57.63 | 92.82 | 100 |
| Sep | 22.32 | 54.68 | 95.95 | 100 |
| Oct | 15.14 | 51.38 | 97.79 | 100 |
| Nov | 13.86 | 46.26 | 94.02 | 100 |
| Dec | 15.97 | 50.65 | 92.42 | 100 |
| Cold Season Average | 15.18 | 54.17 | 97.26 | 100 |
| Annual Avg | 18.89 | 57.08 | 94.66 | 100 |
| Open Warm Season Avg | 22.60 | 59.15 | 92.80 | 100 |
Table 7.
Average flow at hydrometric stations at Hinton (07AD002, u3), Athabasca (07BE001, m6), and below Fort McMurray (07DA001, l2) as a percentage of flow at the outlet Embarras Airport (07DD001, l3) for the years 2015, 2018, and 2019.
Table 7.
Average flow at hydrometric stations at Hinton (07AD002, u3), Athabasca (07BE001, m6), and below Fort McMurray (07DA001, l2) as a percentage of flow at the outlet Embarras Airport (07DD001, l3) for the years 2015, 2018, and 2019.
| 07AD002 | 07BE001 | 07DA001 | 07DD001 | |
|---|---|---|---|---|
| Jan | 18.94 | 49.98 | 83.17 | 100 |
| Feb | 19.82 | 56.16 | 87.79 | 100 |
| Mar | 20.97 | 68.52 | 89.88 | 100 |
| Apr | 10.75 | 78.20 | 98.07 | 100 |
| May | 30.24 | 68.51 | 92.45 | 100 |
| Jun | 46.80 | 82.01 | 97.95 | 100 |
| Jul | 35.70 | 72.88 | 91.34 | 100 |
| Aug | 35.63 | 63.43 | 89.14 | 100 |
| Sep | 35.84 | 66.08 | 90.48 | 100 |
| Oct | 24.75 | 61.52 | 87.54 | 100 |
| Nov | 20.98 | 52.79 | 78.08 | 100 |
| Dec | 17.86 | 48.35 | 82.52 | 100 |
| Cold Season Average | 18.22 | 55.16 | 84.29 | 100 |
| Annual Avg | 26.52 | 64.03 | 89.03 | 100 |
| Open Warm Season Avg | 34.83 | 70.38 | 92.42 | 100 |
Publisher’s Note: MDPI stays neutral with regard to jurisdictional claims in published maps and institutional affiliations. |
© 2022 by the authors. Licensee MDPI, Basel, Switzerland. This article is an open access article distributed under the terms and conditions of the Creative Commons Attribution (CC BY) license (https://creativecommons.org/licenses/by/4.0/).
Share and Cite
MDPI and ACS Style
Zaghloul, M.S.; Ghaderpour, E.; Dastour, H.; Farjad, B.; Gupta, A.; Eum, H.; Achari, G.; Hassan, Q.K. Long Term Trend Analysis of River Flow and Climate in Northern Canada. Hydrology 2022, 9, 197. https://doi.org/10.3390/hydrology9110197
AMA Style
Zaghloul MS, Ghaderpour E, Dastour H, Farjad B, Gupta A, Eum H, Achari G, Hassan QK. Long Term Trend Analysis of River Flow and Climate in Northern Canada. Hydrology. 2022; 9(11):197. https://doi.org/10.3390/hydrology9110197
Chicago/Turabian StyleZaghloul, Mohamed Sherif, Ebrahim Ghaderpour, Hatef Dastour, Babak Farjad, Anil Gupta, Hyung Eum, Gopal Achari, and Quazi K. Hassan. 2022. "Long Term Trend Analysis of River Flow and Climate in Northern Canada" Hydrology 9, no. 11: 197. https://doi.org/10.3390/hydrology9110197
Note that from the first issue of 2016, this journal uses article numbers instead of page numbers. See further details here.