
Decrease in the Water Level of Lake Prespa (North Macedonia) Studied by Remote Sensing Methodology: Relation with Hydrology and Agriculture


1
Cavanilles Institute of Biodiversity and Evolutionary Biology, University of Valencia, 46980 Paterna, Spain
2
Department of Pharmacology, University of Valencia, 46100 Burjassot, Spain
3
Ohrid SOS Citizens’ Initiative, 1000 Skopje, North Macedonia
*
Author to whom correspondence should be addressed.
Hydrology 2022, 9(6), 99; https://doi.org/10.3390/hydrology9060099
Submission received: 23 April 2022
/
Revised: 25 May 2022
/
Accepted: 1 June 2022
/
Published: 5 June 2022
(This article belongs to the Special Issue The Application of Remote Sensing in Hydrology)
Abstract
:The Ohrid-Prespa lake system is the oldest and most diverse permanent lake system in Europe, dating from the Pliocene era and aged at over 4Ma. Its smaller component is Lake Macro Prespa (thereafter called Prespa), shared by North Macedonia, Albania, and Greece. Lake Prespa’s depth was reported as 14 m mean and 48 m maximum before its major water level decline. The lake is highly sensitive to external impacts, including climate change, and has been suffering major water loss for decades. A lake-level decline of almost 10 m was documented between 1950 and 2009 due to restricted precipitation and increased water abstraction for irrigation. This study describes the changes in the surface size of Prespa Lake and the vegetation/land use in the surrounding area in the period 1984–2020 using satellite images (remote sensing, Landsat 5 & 8 images by United States Geological Survey). The lake lost 18.87 km2 of surface in this period (6.9% of its size, dropping from 273.38 km2 to 254.51 km2). Water loss was greater in the period 1987–1993 and 1998–2004. The Analysis of Normalized Difference Vegetation Index (NDVI) in the area (app. 4950 km2) surrounding Lake Prespa revealed an increase in the mean NDVI values over the period studied (1984–2020), pointing to a general increase in vegetation. Areas with NDVI > 0.13 increased from 78% in 1984 to 86% in 2020, while those with the highest vegetation intensity (NDVI > 0.45) increased by 40%. These changes in vegetation may be related to the water loss of the lake.
1. Introduction
Most of the lakes on Earth are of post-glacial origin, originating from the changes that have occurred in the territories since the last glaciation, both inland and on the coast. An example is the great lakes of North America. However, there are some much older lakes whose origin predates glaciation, due to tectonic movements [1]. The best known are Lake Baikal in Siberia and Lake Tanganyika in the African Rift Valley lakes. Some tectonic lakes are also found in Europe, but of smaller size, such as the lakes of the Balkan peninsula, where the best known is Lake Ohrid [2].
The lowering of water levels in lakes is a process that occurs naturally in these ecosystems. The natural evolution of a lake is to silt up and disappear as a result of material inputs from its basin until it fills its water body [3]. However, at present, this natural process of clogging is linked to decreases in water level in general due to the use of water resources in the hydrological basin [4]. Thus, the loss of water level is not only due to the clogging of sediments, but also to a decrease in the volume of stored water, accelerating the disappearance of these water bodies. Some well-known examples are the disappearance of most of the surface of the Aral Sea or the drying up of Lake Chad, in both cases due to the use of the waters that fed these lakes [5,6].
The Ohrid-Prespa lakes system is the oldest and most diverse permanent lake system in Europe, dating from the Pliocene and aged at over 4 Ma [2]. Its relevance has been acknowledged, among other nominations, with the declaration of Ohrid-Prespa Transboundary Biosphere Reserve (North Macedonia/Albania, 446,244 ha) by UNESCO in 2014 [7]. The lake system is transboundary and composed of Lake Ohrid (shared by N. Macedonia and Albania) and Lake Prespa, which itself contains two lakes: Macro Prespa (Big Prespa, hereafter Prespa, with a surface of 253.6 km2) shared by N. Macedonia, Greece and Albania; Micro Prespa (Small Prespa, 47.4 km2), which is entirely in Greece [2]. State authorities of the three countries have enforced the protection status of the Prespa lakes through national and international legislation. A large part of the lakes and their catchment basin have been characterized as National Park (N. Macedonia, Albania and Greece); Monument of Nature (N. Macedonia); and Wetland of International Importance under the Ramsar Convention (N. Macedonia, Albania and Greece) [8]. Although it contains one hydrological basin, during the 20th century Prespa´s protection by the three littoral states was not performed in a coordinated way [9]. One such effort is the Transboundary Prespa Park, established in 2000, but it has not rendered significant results either.
The agricultural development of the Balkan region is linked to the change of political regime at the end of the 20th century. Until 1990, agricultural production was related to self-consumption in former Yugoslavia, being of regional type and of products that were in demand by the domestic market. However, with the new geopolitical map of the Balkans, the new N. Macedonia entered the capitalist orbit and shifted towards globalized agricultural production. The policies of the Ministry of Agriculture, Forestry and Water Management of the Republic of N. Macedonia are aimed at developing the economic viability of milk production and increasing the livestock fund through the Program for Financial Support of Agriculture, in support of milk production, according to the politic of the Agency for Encouraging the Development of Agriculture. In the Pelagonia region, some food multinationals come into play and there is a development of agricultural production for export, mainly of Israeli hybrid-maize varieties intended for animal feed, and the increase of agricultural production of goat and cow milk to over 400,000 m3 per year [10]. Changes in the agricultural production have also occurred in Albania and Greece over the last decades.
The conservation of forested areas is important to regulate surface runoff, but in times of heavy rainfall, the forest is not able to retain enough water and reduce flood intensity, especially if the times of concentration are short [11]. Loss of lake quality has also been a cause for concern for the last three decades, as eutrophication processes are combined with the concentration processes that occur due to a decrease in water volume. The main manifestation is the growth of cyanobacteria [12]. The studies carried out between 1926 and 1928 showed a water body of very good quality, with a transparency in summer between 7 and 8 m. Symptoms of eutrophication were already observed, as well as the process of desiccation that seemed to have been a trend for centuries [13]. The first sign of poor ecological condition was detected in 1994 after the first drops in water level, when the anoxic hypolimnion, which had never been measured before was observed [14]. Studies carried out on the sediments of Prespa Lake showed that the area has undergone climatic fluctuations and in the last two millennia the climate has been warmer, drier and has had less snow. Coupled with human activity, this would explain the continuous drop in water level that has been recorded [15].
Remote sensing is a tool that has been used to monitor lakes from the point of view of both water quality and hydrology [16]. On the one hand, the presence of chlorophyll in the water is an indicator of water quality because of its relationship with eutrophication processes [17]. On the other hand, the measurement of water surface area is a measure of the volume of water in a lake or reservoir and it can be used as an estimate of inflows and outflows [18]. This tool is very useful especially in large lakes and steppe areas, because it allows surface variations to be appreciated with little effort. Bathymetric measurement using satellite images is also a good tool as it allows knowledge of variations in many places where there are no or incomplete data, such as the work carried out in reservoirs [19] and even the bathymetric determination in shallow areas of beaches and coastal lagoons [20]. The study by Bastawesy et al. [21] in desert lakes in Egypt is an example of this methodology whose specific application to Prespa Lake is the subject of this paper.
The aim of our study was to describe the changes in (i) the surface size of Prespa Lake and (ii) the vegetation/land use in this area in the period 1984–2020.
2. Materials and Methods
2.1. Study Site
Lake Prespa is a tectonic lake situated at 849 m a.s.l whose exact age is still uncertain, but it may be even older than Lake Ohrid. It is a relatively shallow lake whose mean and maximum depths were reported as 14 m and 48 m, respectively, before the major water level decline [22]. The water input of the lake is 16.92 m3/s, via rivers and catchment runoff (56%); direct precipitation (35%); inflow (9%) from the nearby Lake Micro Prespa and groundwater, whereas the water output is estimated to occur mainly through evaporation (52%); water abstraction for irrigation (2%); and subsurface outflow through the karstic aquifers of Galichica Mountain (46%) [2].
Macro and Micro Prespa are linked by a small channel with a sluice that separates them. Between Lake Prespa and Lake Ohrid is Mount Galichica, a karstic massif through which Lake Prespa feeds Lake Ohrid with fresh water (Figure 1). The water level of lake Prespa has been dropping constantly for the last century. In the period 1951–2008, it declined from 852 m a.s.l to 844 m a.s.l, a dramatic ~8 m in less than 60 years [2]. The water in the lake during dry seasons decreases by 1 cm per day due to the combined effects of evaporation and irrigation [22]. The level was 847 m a.s.l as of September 2021. The causes of this major decline are complex and multiple and are likely a combination of climate change factors (which refers to restricted precipitation, specifically snowfall and higher air and water temperature); diminished water input (rivers); and increased water abstraction for irrigation, as well as hydrogeological modifications (earthquakes), which enhance the water outflow through the underground karst drainage channels [23]. In an effort to determine the causes of the decline, van der Schriek and Giannakopoulos determined that sustained low lake levels below 847 m, following the dramatic water-level fall in 1987/88–1994/95, which was triggered by an extensive drought period, are caused by water abstraction (~72%) and amplified by climate-related inflow decreases (~28%) [24].
2.2. Meteorological Data
In order to evaluate the impact of climate on the lake´s water level alterations, we have analyzed data (provided by the National Hydrometeorological Service in N. Macedonia) regarding temperatures and precipitation in the area (specifically in the village of Pretor located on the shore, in the northeastern part of the lake, municipality of Resen) (Figure 1b). However, to our knowledge there is no other station in the Macedonian part of the Lake that offers complete temperature and precipitation data. A climatological station was established in the town of Resen (881 m a.s.l.) in 1947 but stopped operation in 1993, while a meteorological station in Pretor (municipality of Resen, Lat. 40.9797; Long. 21.0617; 993 m a.s.l.) was established in 1991. Therefore, in order to know the most recent values we have also used data from an automatic weather station located in Stenje (municipality of Resen, Lat. 40.9453; Long. 20.9017; 1063 m a.s.l.) located at the west shore of the Lake. The time series of data are analyzed with the Mann-Kendall statistical test to evaluate the significance of the trend according to Gilbert [25], after verifying that autocorrelation was not significative. According to Hirsch et al. [26], the Mann–Kendall Test is not affected by missing data other than the fact that the number of sample points are reduced and hence might adversely affect the statistical significance. Further, it is not affected by irregular spacing of the time points of the measurement or by the length of the time series. In our time series, some values are missing as those data were unavailable, therefore for the statistical analysis, for the missing data we used the average of the other, available months.
2.3. Satellite Processing
We analysed by remote sensing a series of satellite images (Landsat 5 & 8 images by European Space Agency and United States Geological Survey), that was obtained from the summer period (June–August) in various years. Satellite maps show the density of plant growth and can be used to quantify the amount and type of the vegetation present. One of the most used indices is calculated from multispectral information as a normalized ratio between the reflectance in red and near infrared bands and is called the Normalized Difference Vegetation Index (NDVI) [27]. This index is a measure of greenness that is calculated from the light reflected by vegetation as green vegetation absorbs most of the visible light that hits it and reflects a large portion of the near-infrared light. The direct use is to characterize canopy growth or vigor as chlorophyll actively absorbs red and reflects near infrared light. NDVI values range from −1 to 1; negative values approaching −1 correspond to water; values close to zero (−0.1 to 0.1) correspond to barren areas of rock, sand, or snow; moderate values represent shrub and grassland (0.2 to 0.3); high values indicate temperate forests (0.6 to 0.8); while tropical rainforests are approaching 1 [28]. The images were processed using the freeware SNAP application (Brockmann Consult Gmbh, Hamburg, Germany), version 8.
3. Results
3.1. Climate
We collected 348 monthly data of air temperature for analysis, from the period 1991–2020 in Pretor station; data regarding seven months in the series were not available. In order to be able to perform statistical analysis, for the missing data we used the average value of the same month of the other years. A statistically significative increasing trend according to the Mann–Kendall test in the mean annual temperature was observed (Figure 2) with values of 0.48% annual, S = 167, Z = 3.9, p < 0.001. The maximal mean monthly temperature value was 0.2% annual, but there was no statistically significant trend, p = 0.094 (Figure 2). The minimal mean monthly temperature value was 20.2% annual, and there was no statistically significant trend, p = 0.195 (Figure 2).
Regarding the precipitation data, we collected 840 monthly data in Pretor and Stenje, but the data of 24 months at different points in the series were not available. In order to be able to perform the statistical analysis, for the missing data we used the average value of the same month in the other years. The assessment of the amount of precipitation in this same period revealed that the mean monthly precipitation and the annual precipitation did not decrease; rather, they had a tendency to increase. Stenje station presented a significant difference mean of annual rainfall value for the studied period of 871 mm (n = 30), while for Pretor it was 682 mm (n = 27; p = 0.002). Similarly, there were no major changes in the trend of the maximal monthly precipitation; on the contrary, the percentage that this value represented in comparison with the total annual precipitation showed a non-statistically significant decreasing trend in Stenje (Figure 3, Z = −1.75; p = 0.08) and statistically significant increasing trend in Pretor (Z = 2.42; p = 0.016), according to the Mann–Kendall test. In other words, the month with the most precipitation each year represented cca 25% of the whole yearly precipitation in the early 1990s, while this figure dropped to 15% in the late 2000s. Exactly how these meteorological figures represent climate change in the area and how they are connected to the drop in the water level Lake Prespa has experienced is unknown and requires further study. Nevertheless, these data seem to support the idea that other causes may be the leading factor in the phenomenon of water loss which has been occurring for centuries [13].
3.2. Hydrological Changes
Analysis of the data regarding the surface area of Lake Prespa was performed using satellite images in the period 1984–2020 (Figure 4a). The lake lost 18.87 km2 of surface in this period, i.e., 6.9% of its surface (Figure 4b), dropping from 273.38 km2 (June 1984) to 254.51 km2 (July 2020). The rate of water loss was greater in the period 1987–1993 and 1998–2004, while the surface of the lake has not varied in the last decade. Of note, the two periods in which there was a major decrease in the surface area coincide with the two periods in which other authors reported a major decline in the water levels [22].
Hydrologically, the volume of water lost from the lake is much more important relatively than the surface diminution. While the water table decrease is estimated at 6.9%, if we take as a reference the water level at 852 m above sea level, the volume of water stored in the lake was 3850 hm3; with a drop in level of 7 m, the volume at 845 m elevation in 2009 was 1785 hm3. This represents a decrease in the volume of stored water of more than 2000 hm3. In relative terms, this is a loss of 54% of its volume (see aspect in Figure A1). The volume of water lost is much more important than it may seem if we consider only the decrease in the surface area of the lake, and this aspect has not been considered so far in the studies carried out.
3.3. Vegetation Intensity
In the studied area (app. 4950 km2), the vegetated surface (NDVI > 0.13) increased from 78% in 1984 to 86% in 2020. In particular, the area with the highest vegetation intensity (NDVI > 0.45) increased by 40% (Figure 5). On the one hand, this contributes to the retention of runoff in the forest areas and, on the other, to water consumption in the irrigated areas. The images of summer 1984 and 2020 show that the level of vegetation has increased in the Baba Mountain and in the surrounding area. In the mountains, the natural vegetation has developed, possibly due to loss of livestock and forest enhancement. The surrounding area has manifested itself with a higher NDVI value; while in 1984 the county appears in shades of green (NDVI value = 0.0), today it is in shades of yellow-orange (NDVI value 0.2 to 0.3). This change may reflect the growth of crops, currently dedicated to the production of corn in summer.
Further studies are needed to understand whether the changes in the amount and type of forests nearby, particularly Mount Baba (on the East side of Lake Prespa) are related to the alterations of the water level of the lake. Similarly, the increase in the agricultural use of the land in the Pelagonia region (Black River basin, Crna Reka in Macedonian, Figure 1), and particularly in the water basin and catchment, need to be studied in detail. The lake’s water is used for agricultural purposes in all three neighboring countries. It is estimated that within the Prespa Lake region there are 6500 ha of agricultural land [29]. Many of the agricultural fields are placed in Prespa’s catchment; therefore, pesticides and fertilizers pollute the lake. Since the intensity of the source of pollution is more or less constant, when the amount of water decreases, the concentration of polluting compounds increases.
4. Discussion
The decrease in the surface area of the water surface in lakes is one of the major environmental impacts on aquatic ecosystems. This process occurs naturally due to sediment input from the basin and the siltation of the basin. Hydrological alterations due to the use of water for economic purposes are the main cause of the drying up of many lakes and wetlands by human activity, accelerating the natural process of the disappearance of water bodies. In tectonic lakes, which are much older than other lakes, this process has been occurring for millions of years but is currently more affected by humans. Those located in basins with subsidence maintain their size and depth; however, shallower lakes or those with greater hydrological alterations have disappeared or are greatly affected. Therefore, while Lake Ohrid has had no volume variations, Lake Prespa, located at a higher level, is decreasing its water level, partly because it empties over Ohrid [24].
Among the best known, the disappearance of most of the surface area of the Aral Sea is impressive, with a reduction in surface area of 74% and in water volume of 90%, between 1960 and 2000 [30]. In the same time interval, Lake Chad (Africa) also reduced its surface area by 90%. In both cases, the decrease occurred as a result of water abstraction for irrigation [31]. In the case of Lake Prespa, given its geometric profile, the loss of surface area may not seem so important, but the volume of the lost water is. Another case of rapid decline is Lake Urmia (Iran) which between 2002 and 2014 has reduced its surface area by 70% and its water volume by 80% due to the impact of groundwater extraction in its basin [32]. The NDVI index and Landsat satellite images were the tools used to carry out studies in Lake Urmia [33], where a relationship was found between the development of intensive agriculture in its basin and the increase in water consumption for irrigation, producing the decrease in inputs to the lake, its hypersalinization and the alteration of food webs [34]. Onion, corn and melon production increased in the region with Iran’s reformist and liberal economic development policies favored by the end of the fundamentalist government, increasing the irrigated area by 48% between 1987 and 2020 [35]. Data on crop water demand in Lake Prespa watershed in the report “Irrigation Systems and Crop Water Demand” (Hydrogeological Study for the Lake Prespa Watershed in 2013) reveal the net irrigation water demand was estimated to be 24.76 million m3. Considering the 70% efficiency of the irrigation systems, the annual gross water demand for irrigation can be estimated as 35.37 million m3 [36].
The disappearance of lakes means a loss in the natural and ecological heritage of the planet. Many are currently protected by the Ramsar convention as a habitat for bird species of interest [37], and this leads to the implementation of measures to optimize the management of these places for the sake of their conservation. However, in the last millennium, many lakes have disappeared mainly due to human action. An example is those that were eliminated to increase the availability of land, as happened in Mexico in the 17th century [38]. In other cases, it is a matter of increasing the urbanization of the territory at the cost of decreasing the surface of the lake, especially in coastal lakes; an example is the occupation of the Tunis-Carthage lagoon with the development of the two cities on its shore, which has gradually reduced its surface [39]. This occupation on the lake shores has not occurred so far in Lake Prespa, and in the last decade especially, because the process of the reduction of the surface keeps the shores unstable and it is not easy for them to be occupied.
In addition, lakes act on the regional climate, as interactions between lakes and the atmosphere modify water and energy cycles [40]. Land use has a diffuse but potentially large impact on Prespa Lake. In the same area, changes in land use are described by Kastridis and Kamperidou and the effect over the Volvi Lake [41], where an increase of 6% of the forested area in combination with the improvement of scrublands quality were enough to cause a 15% decrease in the mean annual sedimentation and a 50% decrease in alluviation rate. Agricultural development in the Pelagonia valley may also have contributed to the increase in water consumption because it is located at an elevation 180 m lower than Prespa Lake and belongs to the same hydrogeological unit, despite the fact that the surface hydrological basins are different [42]. For now, no major changes in the regional climatology are apparent, although the measurements of temperature and precipitation at one specific point cannot describe the climate for the entire Prespa watershed area which is a clear limitation of this study. Another phenomenon to be considered is increased evaporation, as has been suggested by some studies [36]. Further, the entire outflow of Lake Prespa is into Lake Ohrid through the karst channels. Since most of the transported phosphorus is retained in the aquifer, thanks to this natural filter, Lake Prespa does not pose an immediate threat to Lake Ohrid. However, the increased phosphorus load from Lake Prespa will lead to an increase in the phosphorus content of Lake Ohrid, which will endanger its fragile ecosystem as a potential hazard [43].
Conservation strategies for Prespa Lake must take into account human activities in its drainage basins and also in its hydrogeological basin including the wider area with the Black River valley in Pelagonia, as has been suggested in the case of the African Rift Valley Lakes [44]. This requires cooperation between the riparian countries, in this case, Albania, Greece and North Macedonia, as well as technological and financial support from the international community.
5. Conclusions
Lake Prespa has suffered a dramatic drop in water level of 8m over the past decades, although previous studies suggest that this lake’s level has been dropping for centuries. Remote sensing methodology is a useful way to study changes in Lake Prespa regarding size and changes in the vegetation in the surrounding area. The area of the surface of the lake has decreased about 6.9% while the decline in the volume of water can be estimated as about 54%. The increase in the vegetation may be associated with enhanced irrigation in the surrounding area for agricultural use, a factor participating in the loss of water from the lake. The survival of the lake requires urgent measures, a serious hydrogeological survey, strong legislation and better cooperation among the three countries involved in management of the lake. However, since the process of emptying the lake follows a century-long trend, its almost total disappearance in the form it has been known for to date may only be a matter of short time, as has happened with the Aral Sea and Lake Chad, among others.
Author Contributions
Conceptualization, J.S. and N.A.; methodology, J.S.; investigation, J.S. and N.A.; resources, J.S. and N.A.; writing—original draft preparation, review and editing, J.S and N.A. All authors have read and agreed to the published version of the manuscript.
Funding
The authors acknowledge the funding provided by the Heinrich Böll Foundation (Germany).
Institutional Review Board Statement
Not applicable.
Informed Consent Statement
Not applicable.
Data Availability Statement
Meteorological data are provided by the National Hydrometeorological Service of North Macedonia. Landsat images are provided by the United States Geological Survey to J.S. for scientific purposes.
Acknowledgments
Ohrid SOS, Citizens’ Initiative (Skopje, N. Macedonia) for field support data.
Conflicts of Interest
The authors declare no conflict of interest.
Appendix A
Figure A1.
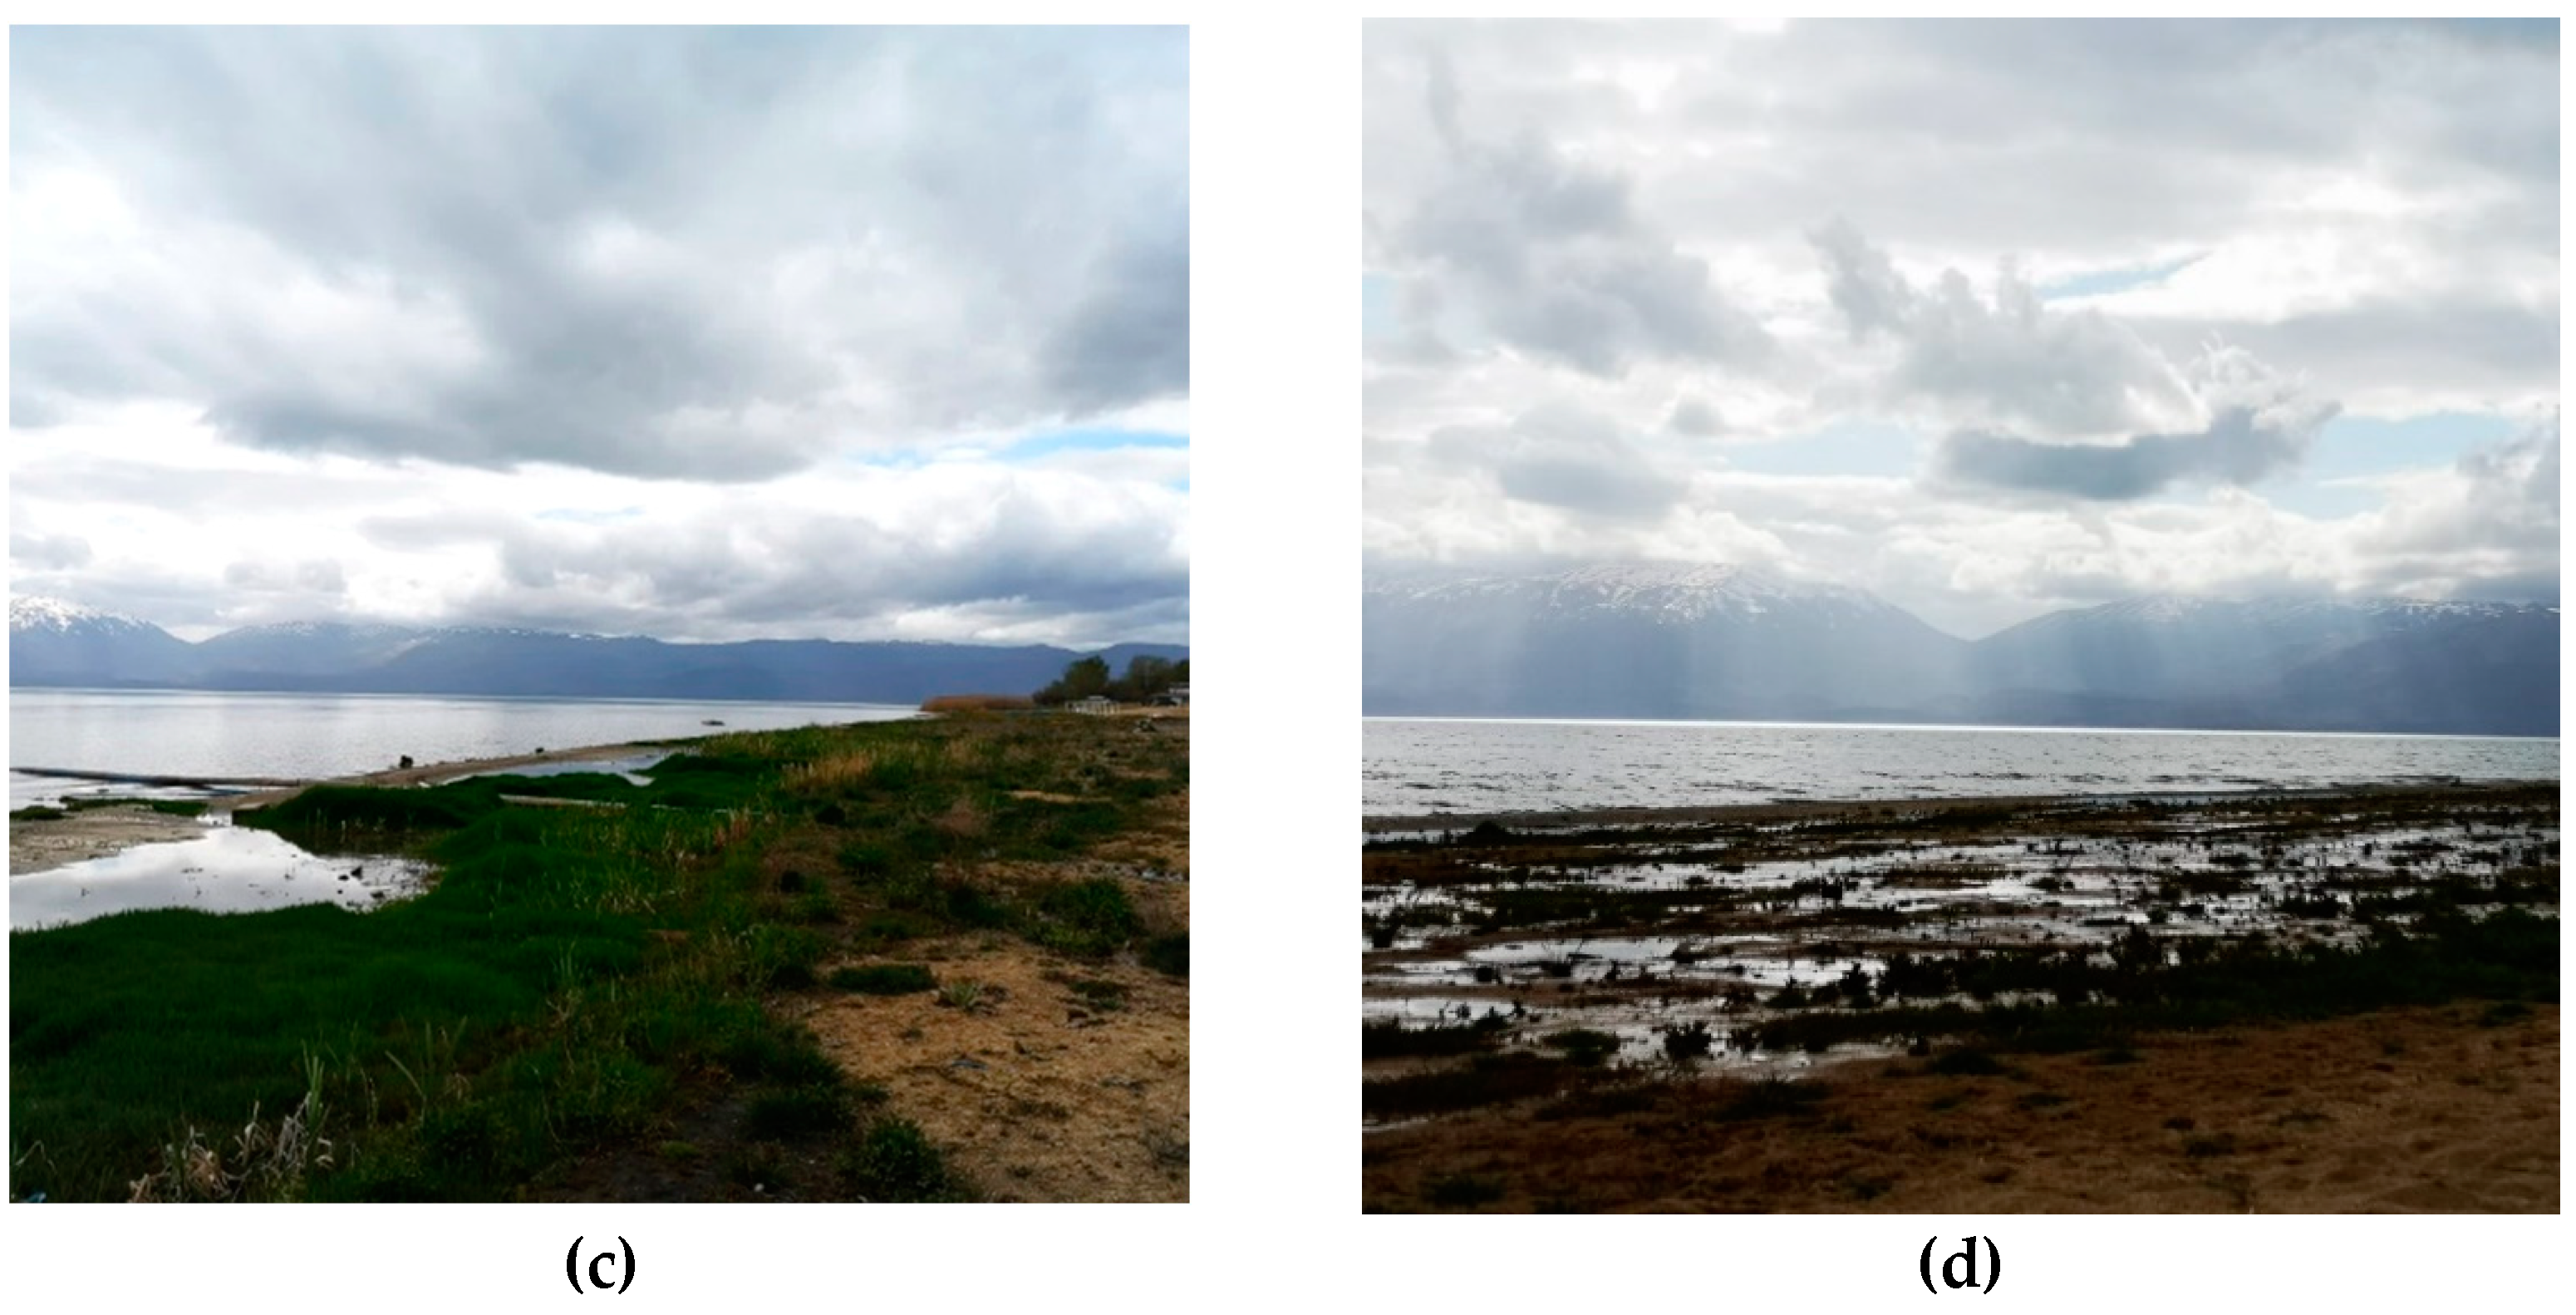
The current state of Prespa Lake´s shore in Pretor (spring 2022). The shoreline has receded for several hundred meters over the past few decades. (a) View to SW. A water level gauge (red arrow) can be seen that was in use a few decades ago, now showing where the water frontline once was. (b) View to S. (c,d) View to W to Mount Galichica. Source: N.A.
Figure A1.
The current state of Prespa Lake´s shore in Pretor (spring 2022). The shoreline has receded for several hundred meters over the past few decades. (a) View to SW. A water level gauge (red arrow) can be seen that was in use a few decades ago, now showing where the water frontline once was. (b) View to S. (c,d) View to W to Mount Galichica. Source: N.A.

References
- Wetzel, R.G. Limnology, 3rd ed.; Elsevier: San Diego, CA, USA, 2001. [Google Scholar]
- Popovska, C.; Bonacci, C. Basic data on the hydrology of Lakes Ohrid and Prespa. Hydrol. Process. 2007, 21, 658–664. [Google Scholar] [CrossRef]
- Mitsch, W.J.; Gosselink, J.G. Wetlands; John Wiley & Sons: Hoboken, NJ, USA, 2015. [Google Scholar]
- Jeppesen, E.; Brucet, S.; Naselli-Flores, L.; Papastergiadou, E.; Stefanidis, K.; Noges, T.; Noges, P.; Attayde, J.L.; Zohary, T.; Coppens, J.; et al. Ecological impacts of global warming and water abstraction on lakes and reservoirs due to changes in water level and related changes in salinity. Hydrobiologia 2015, 750, 201–227. [Google Scholar] [CrossRef]
- Micklin, P. The past, present, and future Aral Sea. Lakes Reserv. Res. Manag. 2010, 15, 193–213. [Google Scholar] [CrossRef]
- Pham-Duc, B.; Sylvestre, F.; Papa, F.; Frappart, F.; Bouchez, C.; Crétaux, J.F. The Lake Chad hydrology under current climate change. Sci. Rep. 2020, 10, 5498. [Google Scholar] [CrossRef] [PubMed] [Green Version]
- UNESCO. Ohrid-Prespa Transboundary Biosphere Reserve, Albania/North Macedonia. Available online: https://en.unesco.org/biosphere/eu-na/ohrid-prespa (accessed on 15 May 2022).
- Ramsar Convention Secretariat. List of Transboundary Ramsar Sites. (Ramsar Convention Secretariat: Gland, Switzerland). Available online: https://www.ramsar.org/sites/default/files/documents/library/list_of_transboundary_sites.pdf (accessed on 15 May 2022).
- Catsadorakis, G.; Roumeliotou, V.; Koutseri, I.; Malakou, M. Multifaceted local action for the conservation of the transboundary Prespa lakes Ramsar sites in the Balkans. Mar. Fresh. Res. 2021, 21, 123. [Google Scholar] [CrossRef]
- Petrovska, B.; Gacovski, Z.; Petrovska, N.; Uzunova, K.; Fejzulah, F.; Tekovski, Z. Profitability farm production of milk from Holstein Friesian breed in the Bitola part of Pelagonia, R. Macedonia. Int. Sci. Line J. Sci. Technol. 2019, 9, 39–45. [Google Scholar]
- Kastridis, A.; Stathis, D. Evaluation of Hydrological and Hydraulic Models Applied in Typical Mediterranean Ungauged Watersheds Using Post-Flash-Flood Measurements. Hydrology 2020, 7, 12. [Google Scholar] [CrossRef] [Green Version]
- Maliaka, V.; Lürling, M.; Fritz, C.; Verstijnen, Y.J.M.; Faassen, E.J.; van Oosterhout, F.; Smolders, A.J.P. Interannual and Spatial Variability of Cyanotoxins in the Prespa Lake Area, Greece. Water 2021, 13, 357. [Google Scholar] [CrossRef]
- Stanković, S. Contribution à la connaissance des lacs d’Ochrida et de Prespa. SIL Proc. 1929, 4, 588–599. [Google Scholar] [CrossRef]
- Löffler, H.; Schiller, E.; Kusel, E.; Kraill, H. Lake Prespa, a European natural monument, endangered by irrigation and eutrophication? Hydrobiologia 1998, 384, 69–74. [Google Scholar] [CrossRef]
- Aufgebauer, A.; Panagiotopoulos, K.; Wagner, B.; Schaebitz, F.; Viehberg Finn, A.; Vogel, H.; Zanchetta, G.; Sulpizio, R.; Leng, M.J.; Damaschke, M. Climate and environmental change in the Balkans over the last 17 ka recorded in sediments from Lake Prespa (Albania/F.Y.R. of Macedonia/Greece). Quat. Int. 2012, 274, 122–135. [Google Scholar] [CrossRef]
- Dörnhöfer, K.; Oppelt, N. Remote sensing for lake research and monitoring–Recent advances. Ecol. Ind. 2016, 64, 105–122. [Google Scholar] [CrossRef]
- Binding, C.E.; Jerome, J.H.; Bukata, R.P.; Booty, W.G. Trends in water clarity of the lower Great Lakes from remotely sensed aquatic color. J. Great Lakes Res. 2007, 33, 828–841. [Google Scholar] [CrossRef] [Green Version]
- Lu, S.; Ouyang, N.; Wu, B.; Wei, Y.; Tesemma, Z. Lake water volume calculation with time series remote-sensing images. Int. J. Remote Sens. 2013, 34, 7962–7973. [Google Scholar] [CrossRef]
- Li, Y.; Gao, H.; Zhao, G.; Tseng, K.H. A high-resolution bathymetry dataset for global reservoirs using multi-source satellite imagery and altimetry. Remote Sens. Environ. 2020, 244, 111831. [Google Scholar] [CrossRef]
- Erena, M.; Domínguez, J.A.; Atenza, J.F.; García-Galiano, S.; Soria, J.; Pérez-Ruzafa, Á. Bathymetry Time Series Using High Spatial Resolution Satellite Images. Water 2020, 12, 531. [Google Scholar] [CrossRef] [Green Version]
- Bastawesy, M.A.; Khalaf, F.I.; Arafat, S.M. The use of remote sensing and GIS for the estimation of water loss from Tushka lakes, southwestern desert, Egypt. J. Afr. Earth Sci. 2008, 52, 73–80. [Google Scholar] [CrossRef]
- Popov, V.; Anovski, T.; Gospavic, R. Sustainable management of Lake Prespa. The Art of Resisting Extreme Natural Forces. Trans. Eng. Sci. 2007, 58, 71–79. [Google Scholar] [CrossRef] [Green Version]
- Burchfiel, B.C.; King, R.W.; Todosov, A.; Kotzev, V.; Durmurdzanov, N.; Serafimovski, T.; Nurce, B. GPS results for Macedonia and its importance for the tectonics of the Southern Balkan extensional regime. Tectonophysics 2006, 413, 239–248. [Google Scholar] [CrossRef]
- van der Schriek, T.; Giannakopoulos, C. Determining the causes for the dramatic recent fall of Lake Prespa (southwest Balkans). Hydrol. Sci. J. 2017, 62, 1131–1148. [Google Scholar] [CrossRef] [Green Version]
- Gilbert, R.O. Statistical Methods for Environmental Pollution Monitoring; Van Nostrand Reinhold: New York, NY, USA, 1987. [Google Scholar]
- Hirsch, R.M.; Slack, J.R.; Smith, R.A. Techniques of trend analysis for monthly water quality data. Water Resour. Res. 1982, 18, 107–121. [Google Scholar] [CrossRef] [Green Version]
- Karnieli, A.; Agam, N.; Pinker, R.T.; Anderson, M.; Imhoff, M.L.; Gutman, G.G.; Panov, N.; Goldberg, A. Use of NDVI and Land Surface Temperature for Drought Assessment: Merits and Limitations. J. Clim. 2010, 23, 618–633. [Google Scholar] [CrossRef]
- Wittich, K.P.; Hansing, O. Area-averaged vegetative cover fraction estimated from satellite data. Int. J. Biometeorol. 1995, 38, 209–215. [Google Scholar] [CrossRef]
- Krstic, S. Environmental changes in lakes catchments as a trigger for rapid eutrophication—A Prespa Lake case study. In Studies on Environmental and Applied Geomorphology; IntechOpen: Shanghai, China, 2012; pp. 63–118. [Google Scholar] [CrossRef] [Green Version]
- Micklin, P. The Aral Sea disaster. Annu. Rev. Earth Planet. Sci. 2007, 35, 47–72. [Google Scholar] [CrossRef] [Green Version]
- Magrin, G. The disappearance of Lake Chad: History of a myth. J. Political Ecol. 2017, 23, 204–222. [Google Scholar] [CrossRef] [Green Version]
- Tourian, M.J.; Elmi, O.; Chen, Q.; Devaraju, B.; Roohi, S.; Sneeuw, N. A spaceborne multisensor approach to monitor the desiccation of Lake Urmia in Iran. Remote Sens. Environ. 2015, 156, 349–360. [Google Scholar] [CrossRef]
- Hesami, A.; Amini, A. Changes in irrigated land and agricultural water use in the Lake Urmia basin. Lake Reserv. Manag. 2016, 32, 288–296. [Google Scholar] [CrossRef]
- Golabian, H. Urmia Lake: Hydro-Ecological Stabilization and Permanence Macro-Engineering Seawater in Unique Environments; Springer-Verlag: Berlin/Heidelberg, Germany, 2010; pp. 365–397. [Google Scholar]
- Barideh, R.; Nasimi, F. Investigating the changes in agricultural land use and actual evapotranspiration of the Urmia Lake basin based on FAO’s WaPOR database. Agric. Water Manag. 2022, 264, 107509. [Google Scholar] [CrossRef]
- Popovska, C. Hydrology of Lake Prespa. Vodoprivreda 2016, 48, 19–28. [Google Scholar]
- Sánchez-García, J.Y.; Ramírez-Gutiérrez, A.G.; Núñez-Ríos, J.E.; Cardoso-Castro, P.P.; Rojas, O.G. Systems Thinking Approach to Sustainable Performance in RAMSAR Sites. Sustainability 2019, 11, 6469. [Google Scholar] [CrossRef] [Green Version]
- López-Espinoza, E.; Ruiz-Angulo, A.; Zavala-Hidalgo, J.; Romero-Centeno, R.; Escamilla-Salazar, J. Impacts of the Desiccated Lake System on Precipitation in the Basin of Mexico City. Atmosphere 2019, 10, 628. [Google Scholar] [CrossRef] [Green Version]
- El Mahrad, B.; Abalansa, S.; Newton, A.; Icely, J.D.; Snoussi, M.; Kacimi, I. Social-Environmental Analysis for the Management of Coastal Lagoons in North Africa. Front. Environ. Sci. 2020, 8, 37. [Google Scholar] [CrossRef]
- Notaro, M.; Holman, K.; Zarrin, A.; Fluck, E.; Vavrus, S.; Bennington, V. Influence of the Laurentian Great Lakes on regional climate. J. Clim. 2013, 26, 789–804. [Google Scholar] [CrossRef] [Green Version]
- Kastridis, A.; Kamperidou, V. Influence of land use changes on alluviation of Volvi Lake wetland (North Greece). Soil Water Res. 2015, 10, 121–129. [Google Scholar] [CrossRef] [Green Version]
- Jovanovski, M. Hydrogeological Survey on Groundwater in Macedonia; Faculty of Civil Engineering, University of Ss. Cyril and Methodius: Skopje, Republic of North Macedonia, 2009. [Google Scholar]
- Matzinger, A.; Jordanoski, M.; Veljanoska-Sarafiloska, E.; Sturm, M.; Müller, B.; Wüest, A. Is Lake Prespa Jeopardizing the Ecosystem of Ancient Lake Ohrid? Hydrobiologia 2006, 553, 89–109. [Google Scholar] [CrossRef]
- Bootsma, H.A.; Hecky, R.E. Conservation of the African Great Lakes: A limnological perspective. Conserv. Biol. 1993, 7, 644–656. [Google Scholar] [CrossRef]
Figure 1.
(a) Location map of Ohrid and Prespa lakes in the Balkans. The blue line indicates the watershed of Prespa. Source map: Landsat-8 Imagery in September 2020, processed by J.S. (b) View from E to NW, from Pretor to Galichica mountain in spring 2022. Source: N.A.
Figure 1.
(a) Location map of Ohrid and Prespa lakes in the Balkans. The blue line indicates the watershed of Prespa. Source map: Landsat-8 Imagery in September 2020, processed by J.S. (b) View from E to NW, from Pretor to Galichica mountain in spring 2022. Source: N.A.

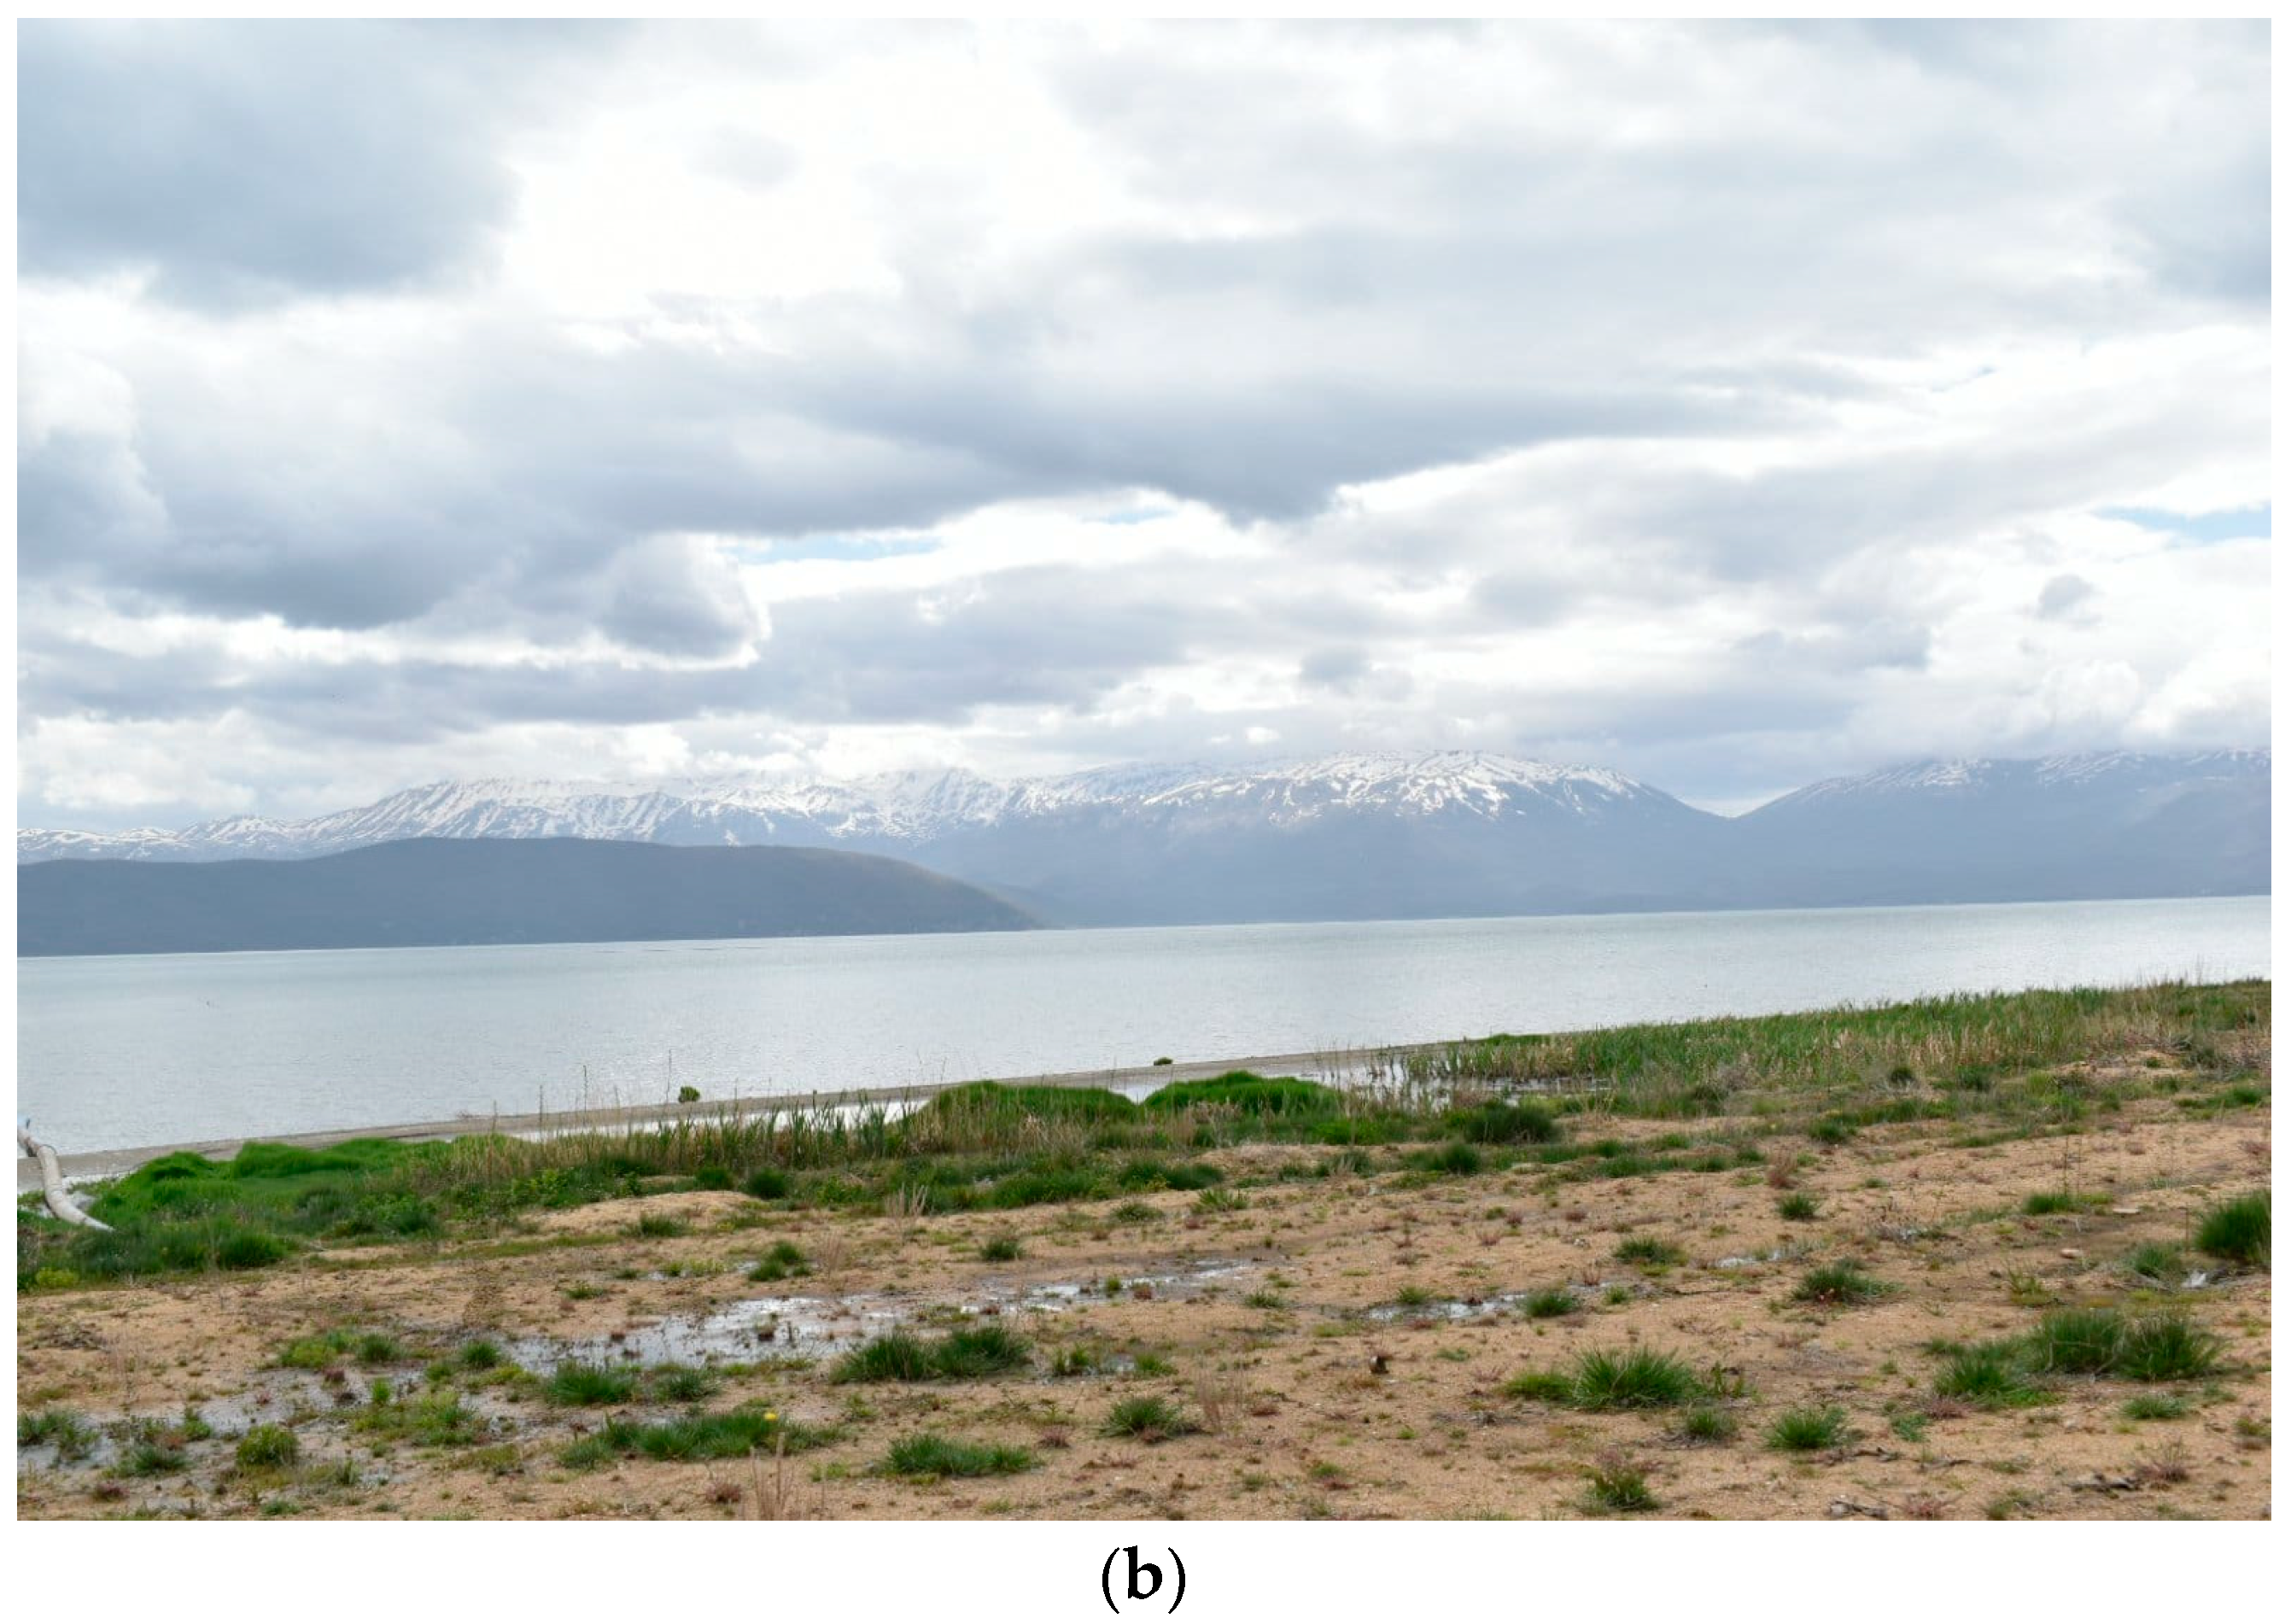
Figure 2.
Values of temperature from 1990 to 2020 in Pretor station; green line: annual mean; red line: maximal mean monthly; blue line: minimal mean monthly. Source data: National Hydrometeorological Service of North Macedonia.
Figure 2.
Values of temperature from 1990 to 2020 in Pretor station; green line: annual mean; red line: maximal mean monthly; blue line: minimal mean monthly. Source data: National Hydrometeorological Service of North Macedonia.
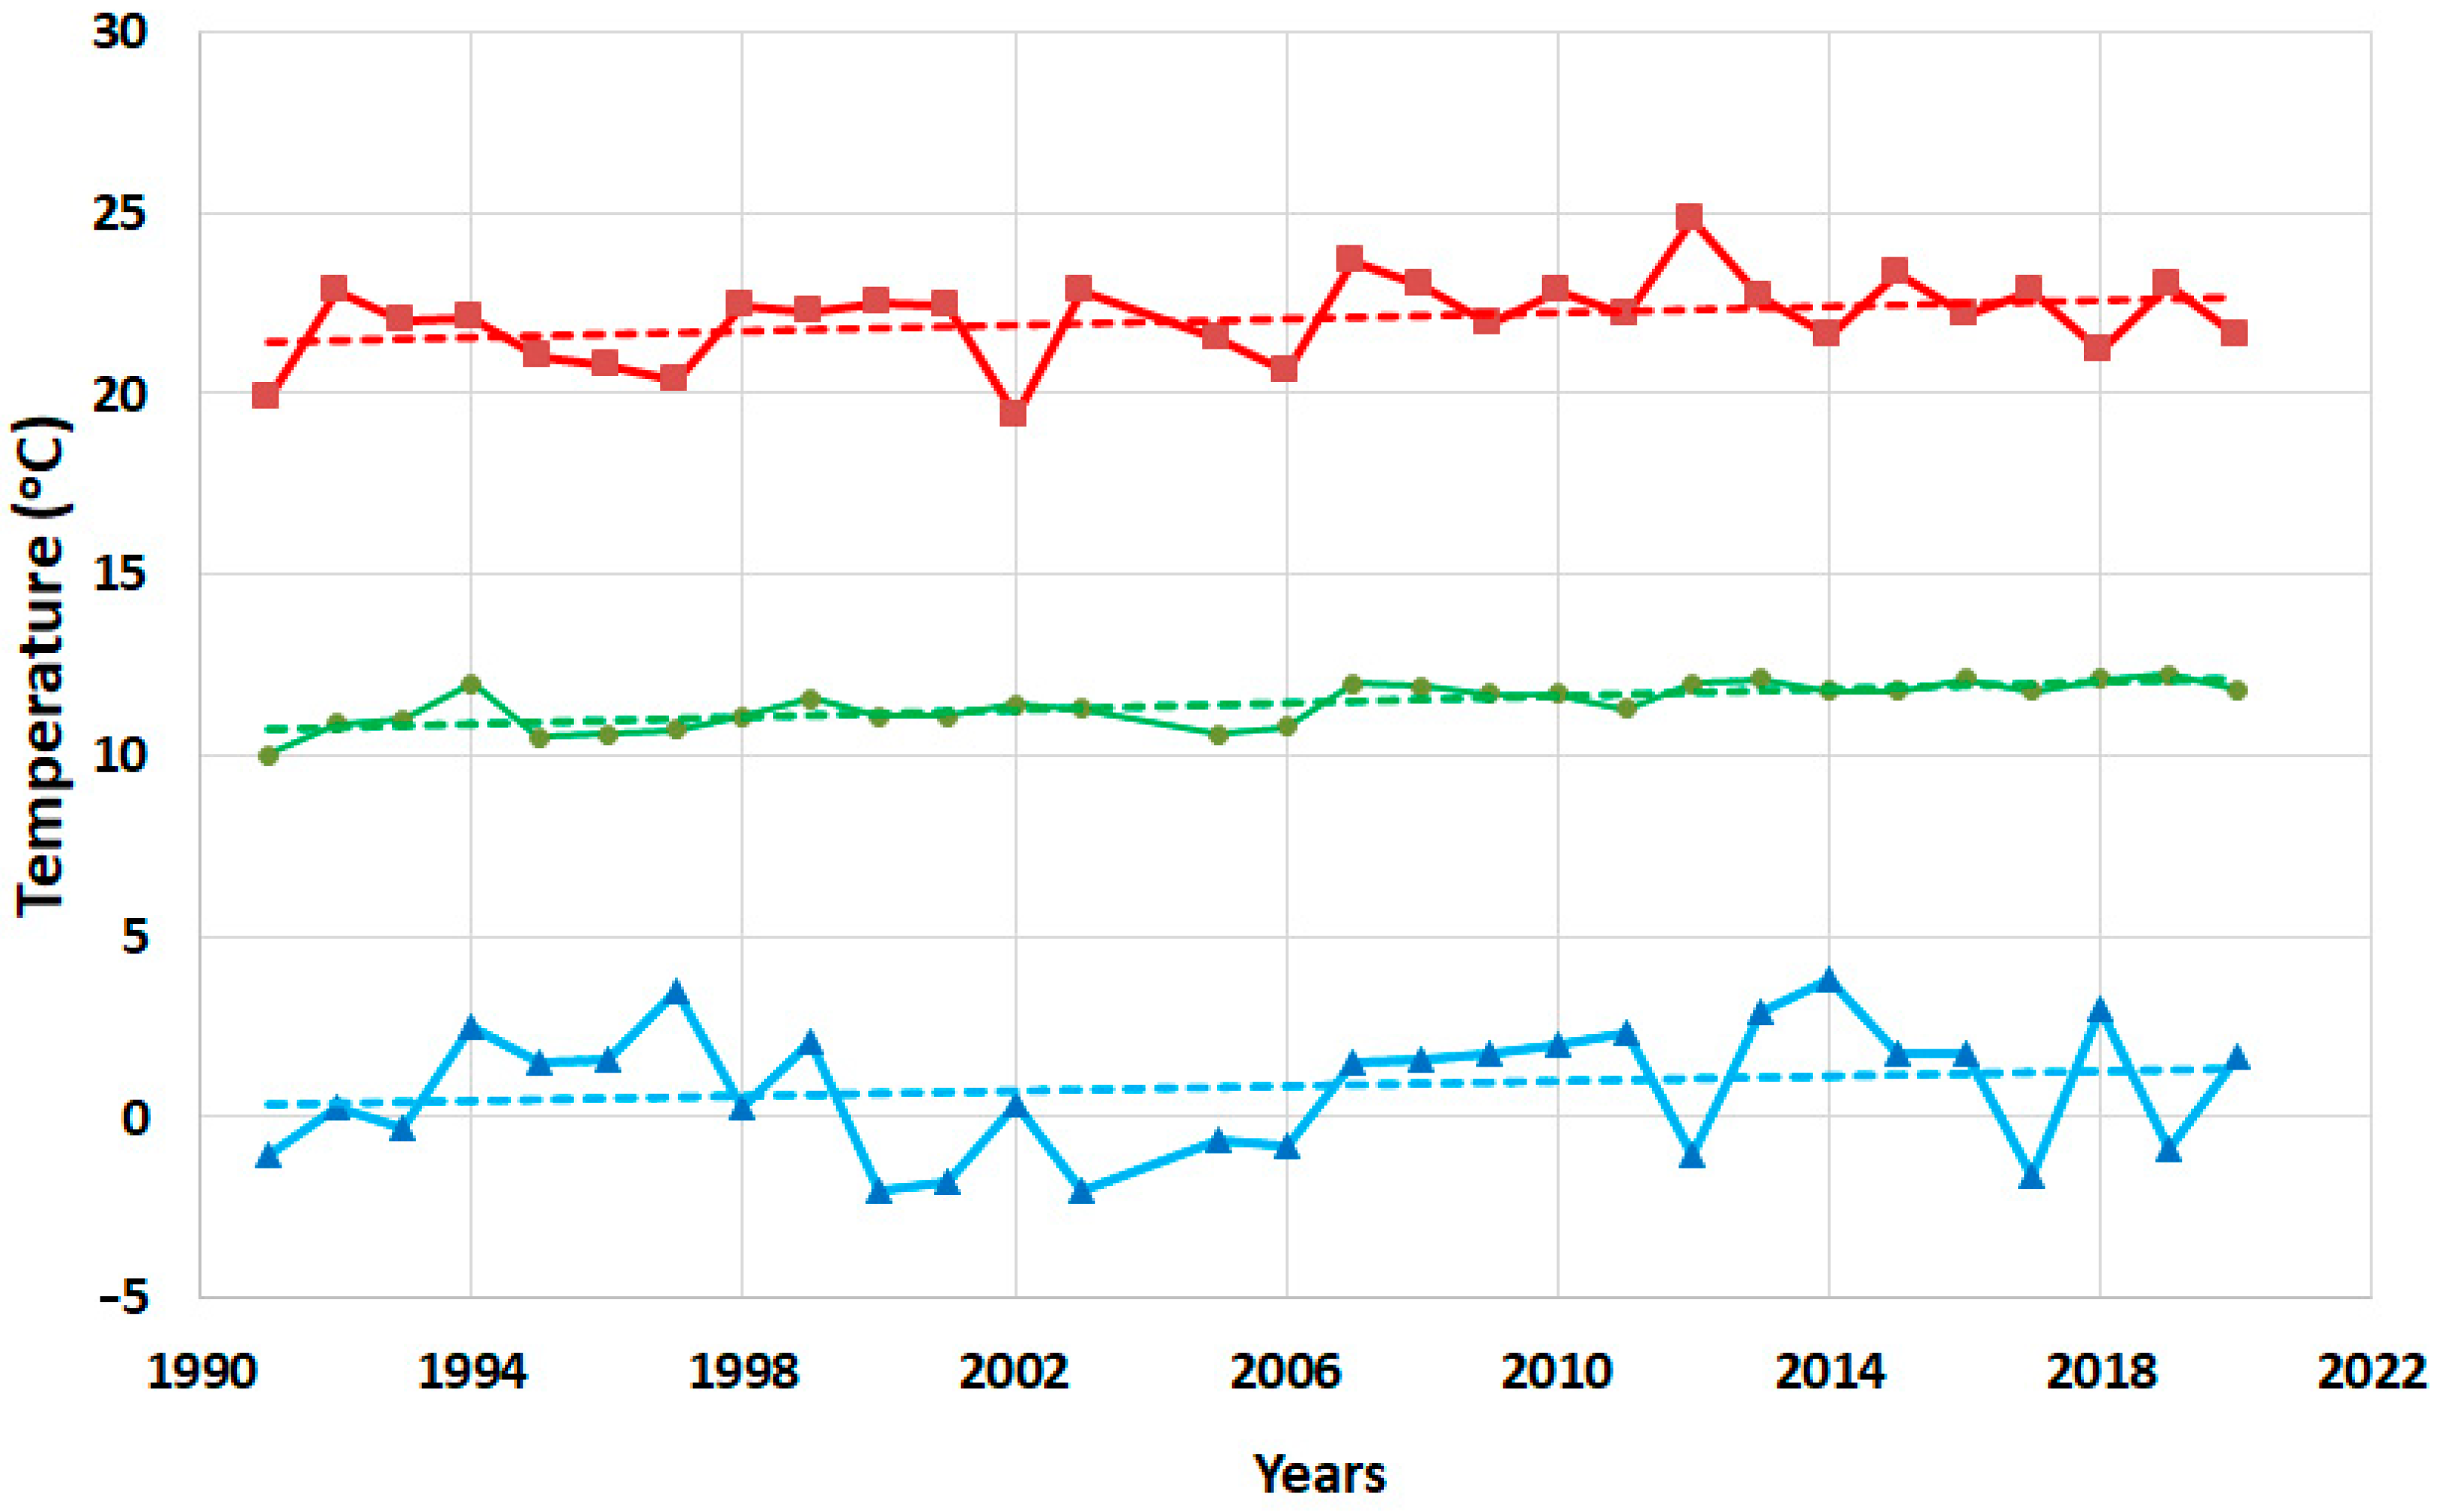
Figure 3.
Values of annual rainfall from 1981 to 2020 in Stenje and Pretor stations, on the shore of Prespa Lake. Source data: National Hydrometeorological Service of North Macedonia.
Figure 3.
Values of annual rainfall from 1981 to 2020 in Stenje and Pretor stations, on the shore of Prespa Lake. Source data: National Hydrometeorological Service of North Macedonia.
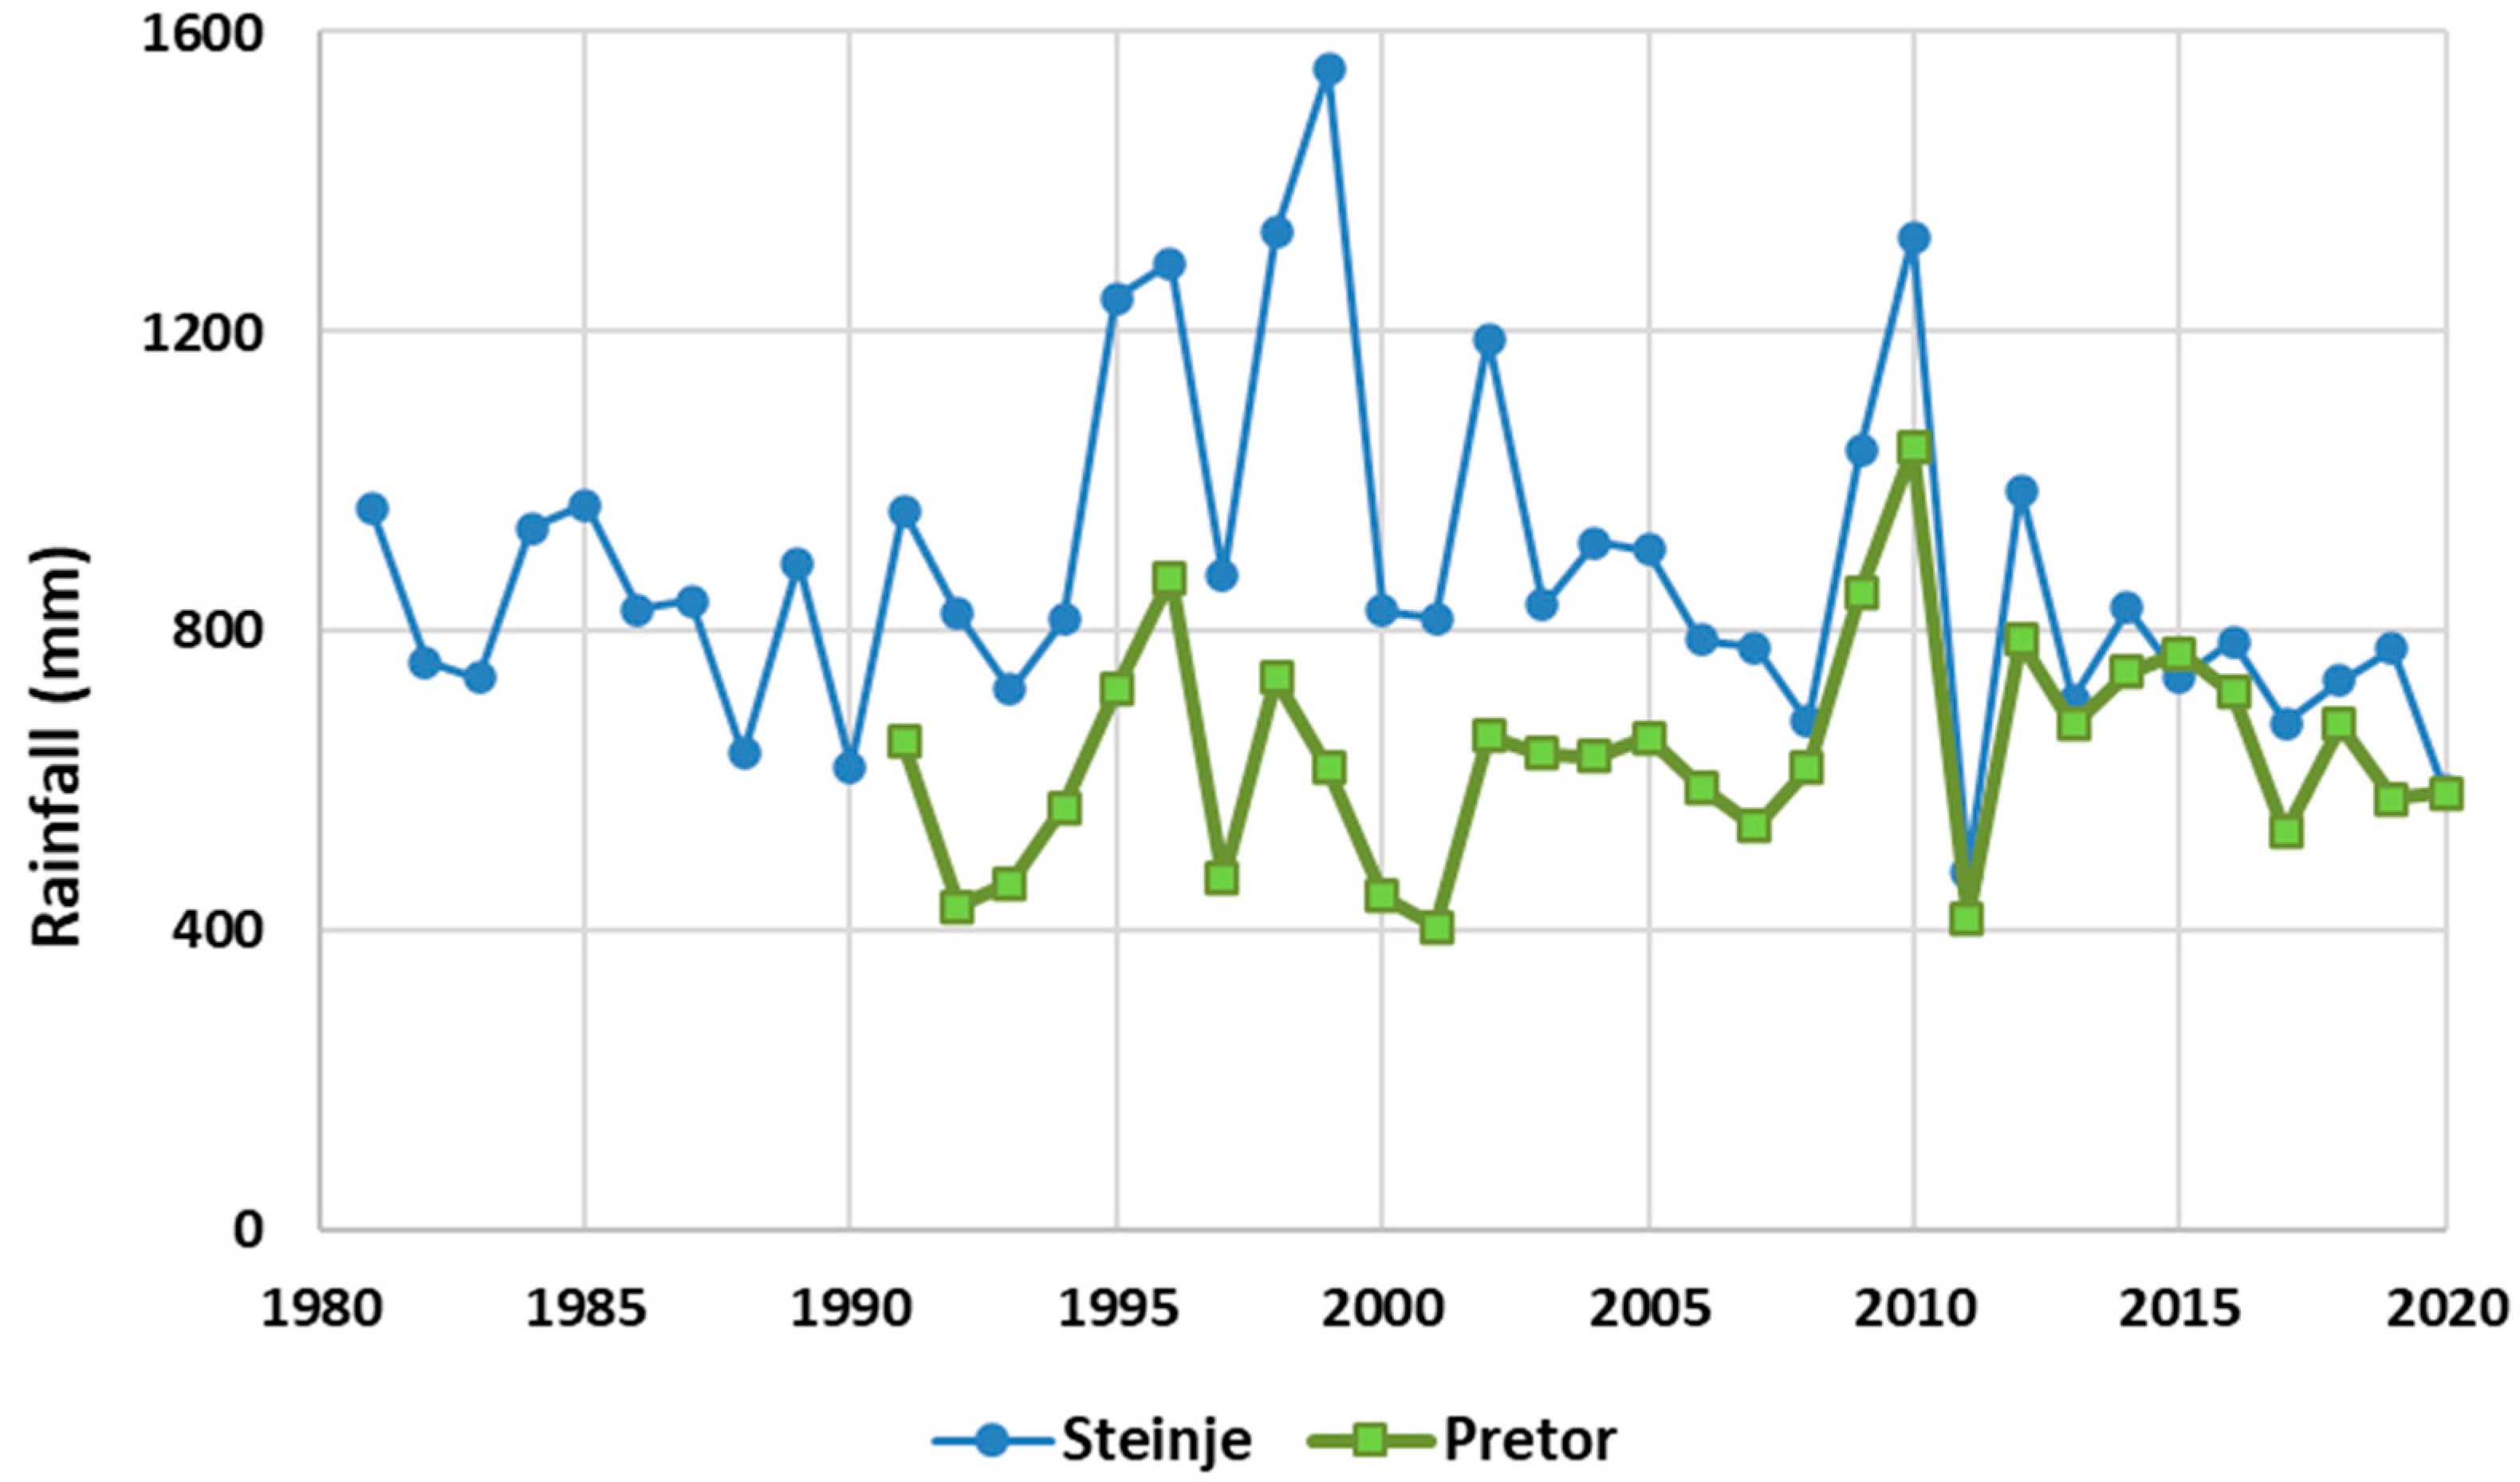
Figure 4.
(a) Satellite image of Lake Prespa from Landsat 5 in 1984; (b) Satellite image of Lake Prespa in 2020 from Landsat 8 imagery; (c) Evolution of the lake surface in the period 1984–2020 obtained from remote sensing images.
Figure 4.
(a) Satellite image of Lake Prespa from Landsat 5 in 1984; (b) Satellite image of Lake Prespa in 2020 from Landsat 8 imagery; (c) Evolution of the lake surface in the period 1984–2020 obtained from remote sensing images.

Figure 5.
NDVI values in the region of Prespa Lake, Baba Mountain and the adjacent area.

Publisher’s Note: MDPI stays neutral with regard to jurisdictional claims in published maps and institutional affiliations. |
© 2022 by the authors. Licensee MDPI, Basel, Switzerland. This article is an open access article distributed under the terms and conditions of the Creative Commons Attribution (CC BY) license (https://creativecommons.org/licenses/by/4.0/).
Share and Cite
MDPI and ACS Style
Soria, J.; Apostolova, N. Decrease in the Water Level of Lake Prespa (North Macedonia) Studied by Remote Sensing Methodology: Relation with Hydrology and Agriculture. Hydrology 2022, 9, 99. https://doi.org/10.3390/hydrology9060099
AMA Style
Soria J, Apostolova N. Decrease in the Water Level of Lake Prespa (North Macedonia) Studied by Remote Sensing Methodology: Relation with Hydrology and Agriculture. Hydrology. 2022; 9(6):99. https://doi.org/10.3390/hydrology9060099
Chicago/Turabian StyleSoria, Juan, and Nadezda Apostolova. 2022. "Decrease in the Water Level of Lake Prespa (North Macedonia) Studied by Remote Sensing Methodology: Relation with Hydrology and Agriculture" Hydrology 9, no. 6: 99. https://doi.org/10.3390/hydrology9060099
Note that from the first issue of 2016, this journal uses article numbers instead of page numbers. See further details here.