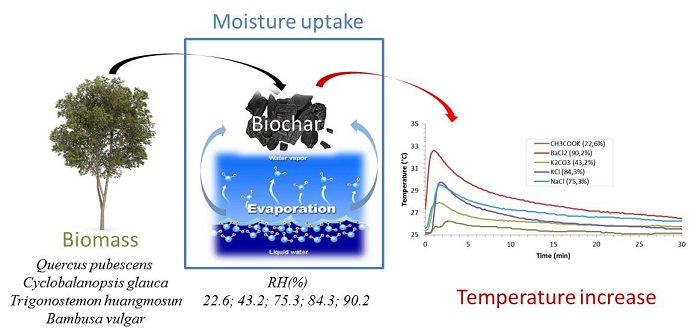
3.1. Overall Results
Table 3 and
Table 4 provide the average values for water adsorption (
W) and the temperature (
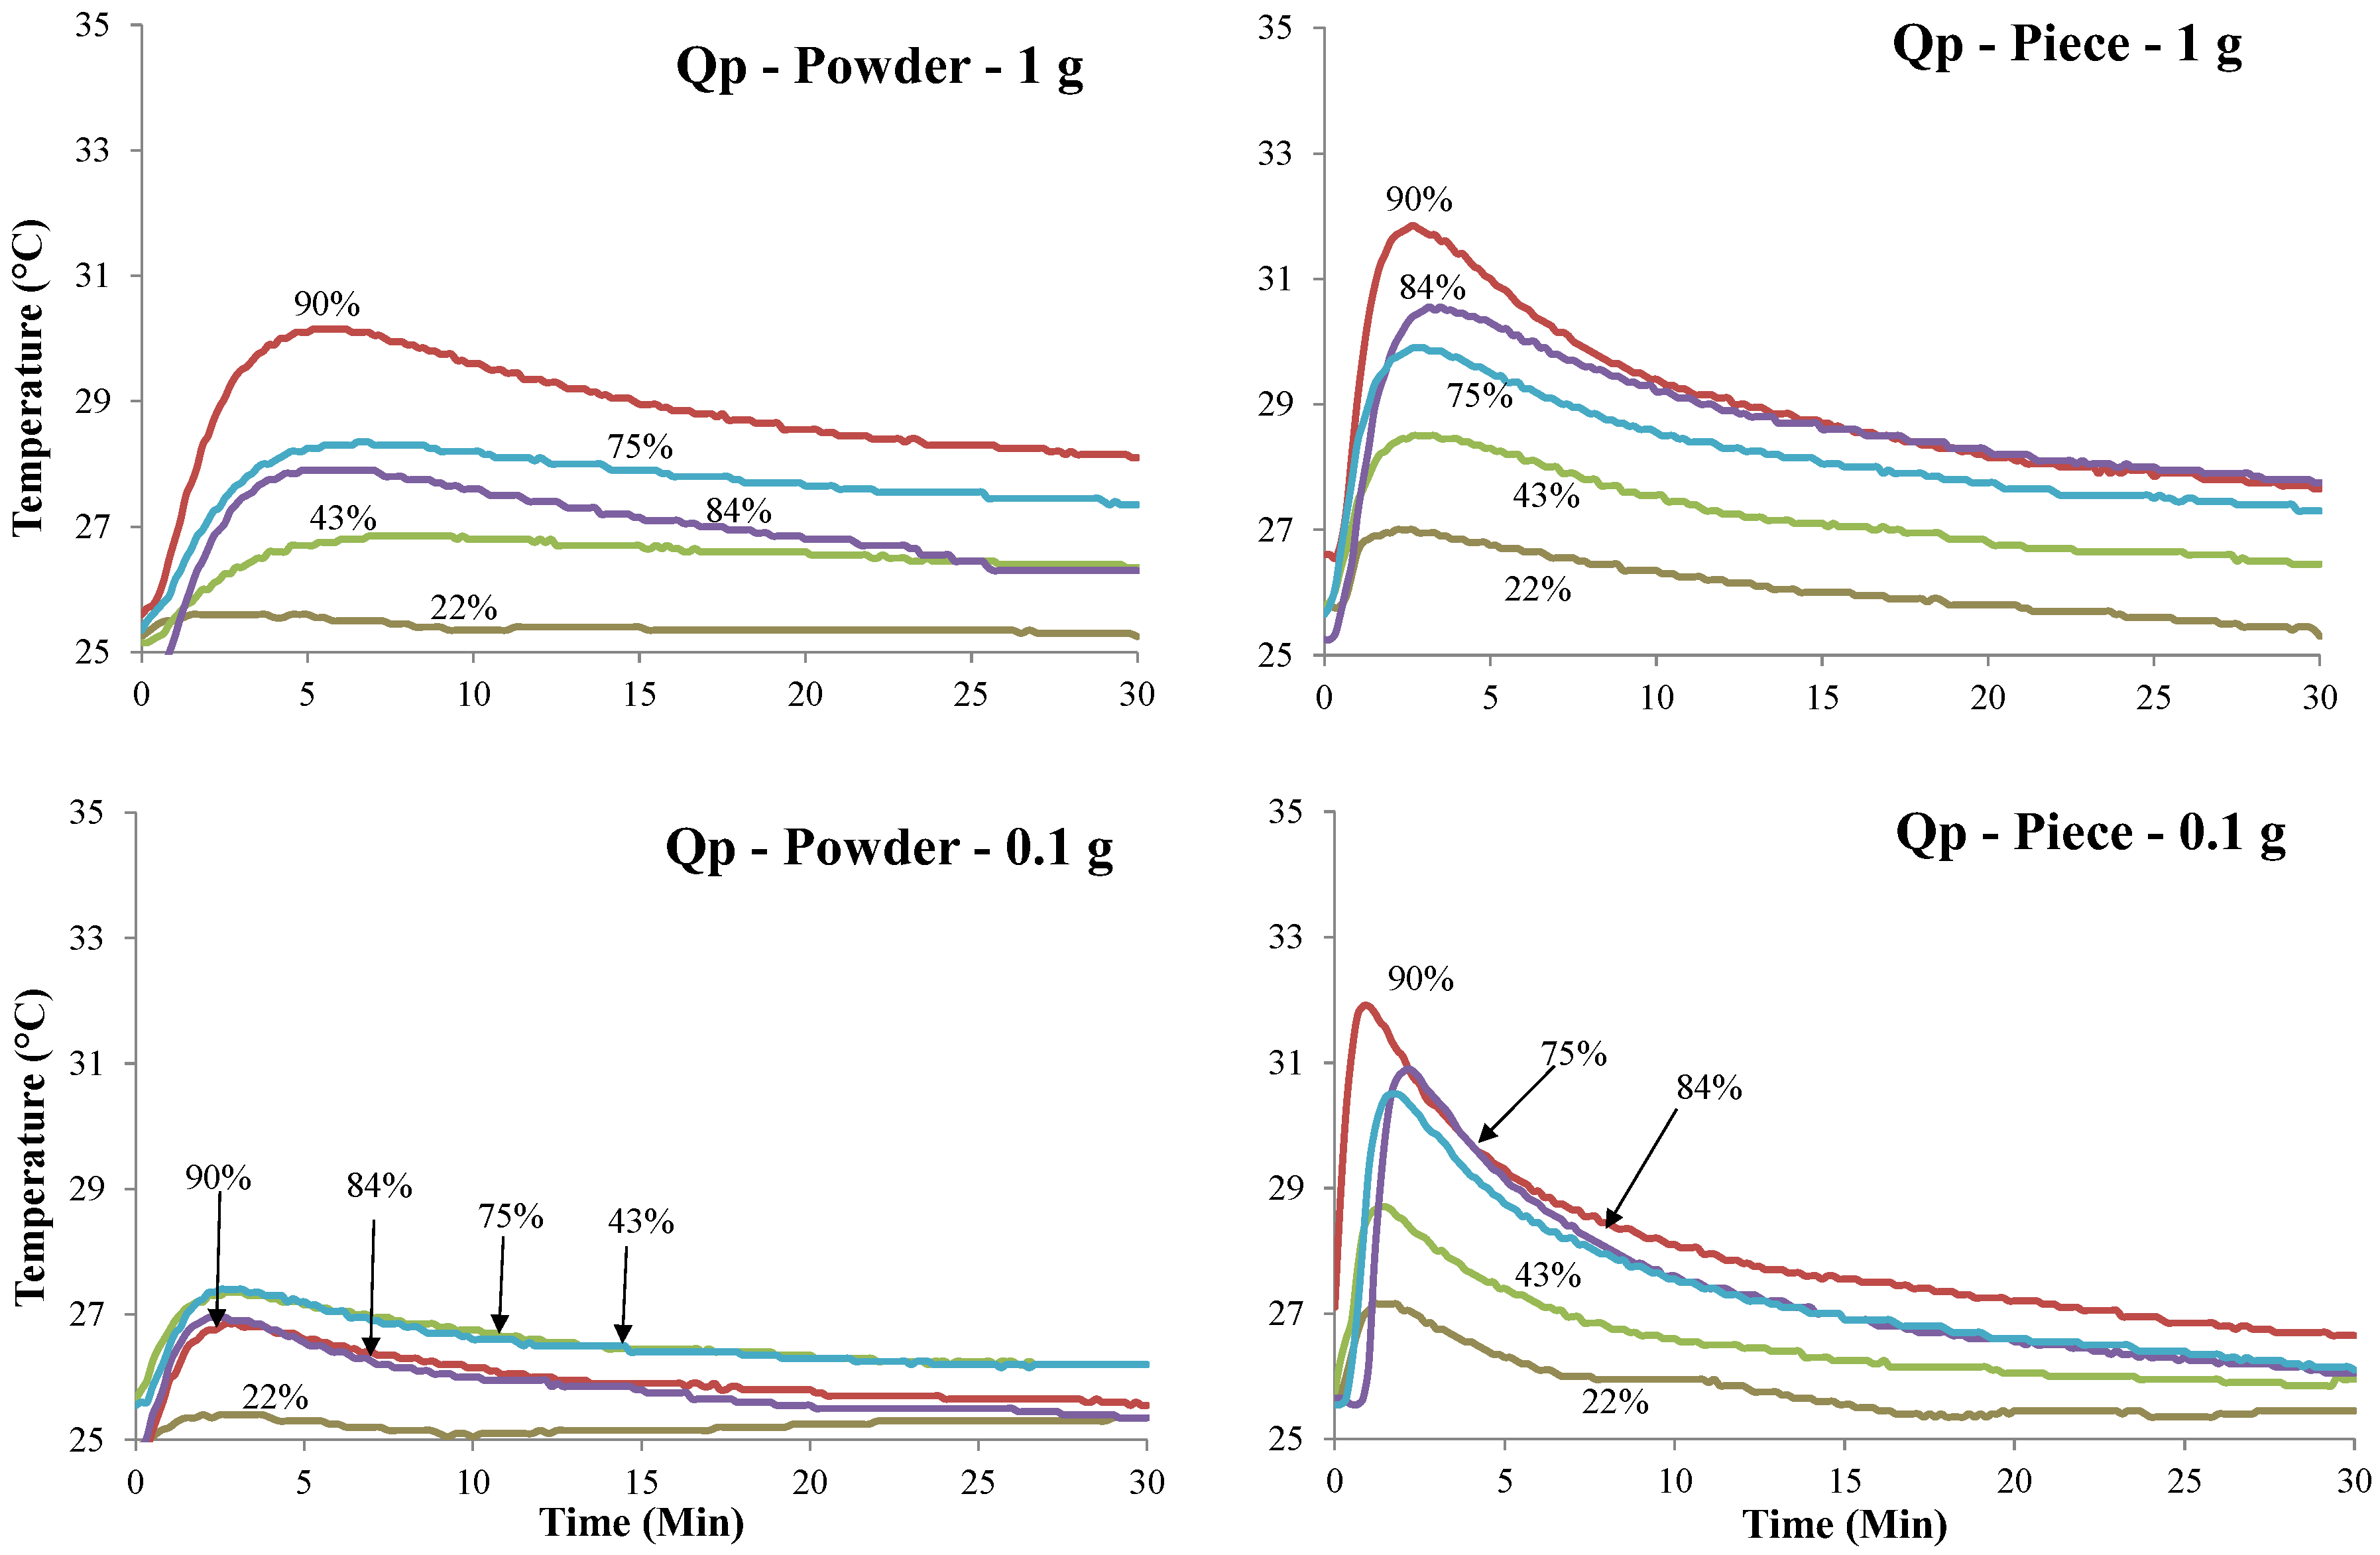
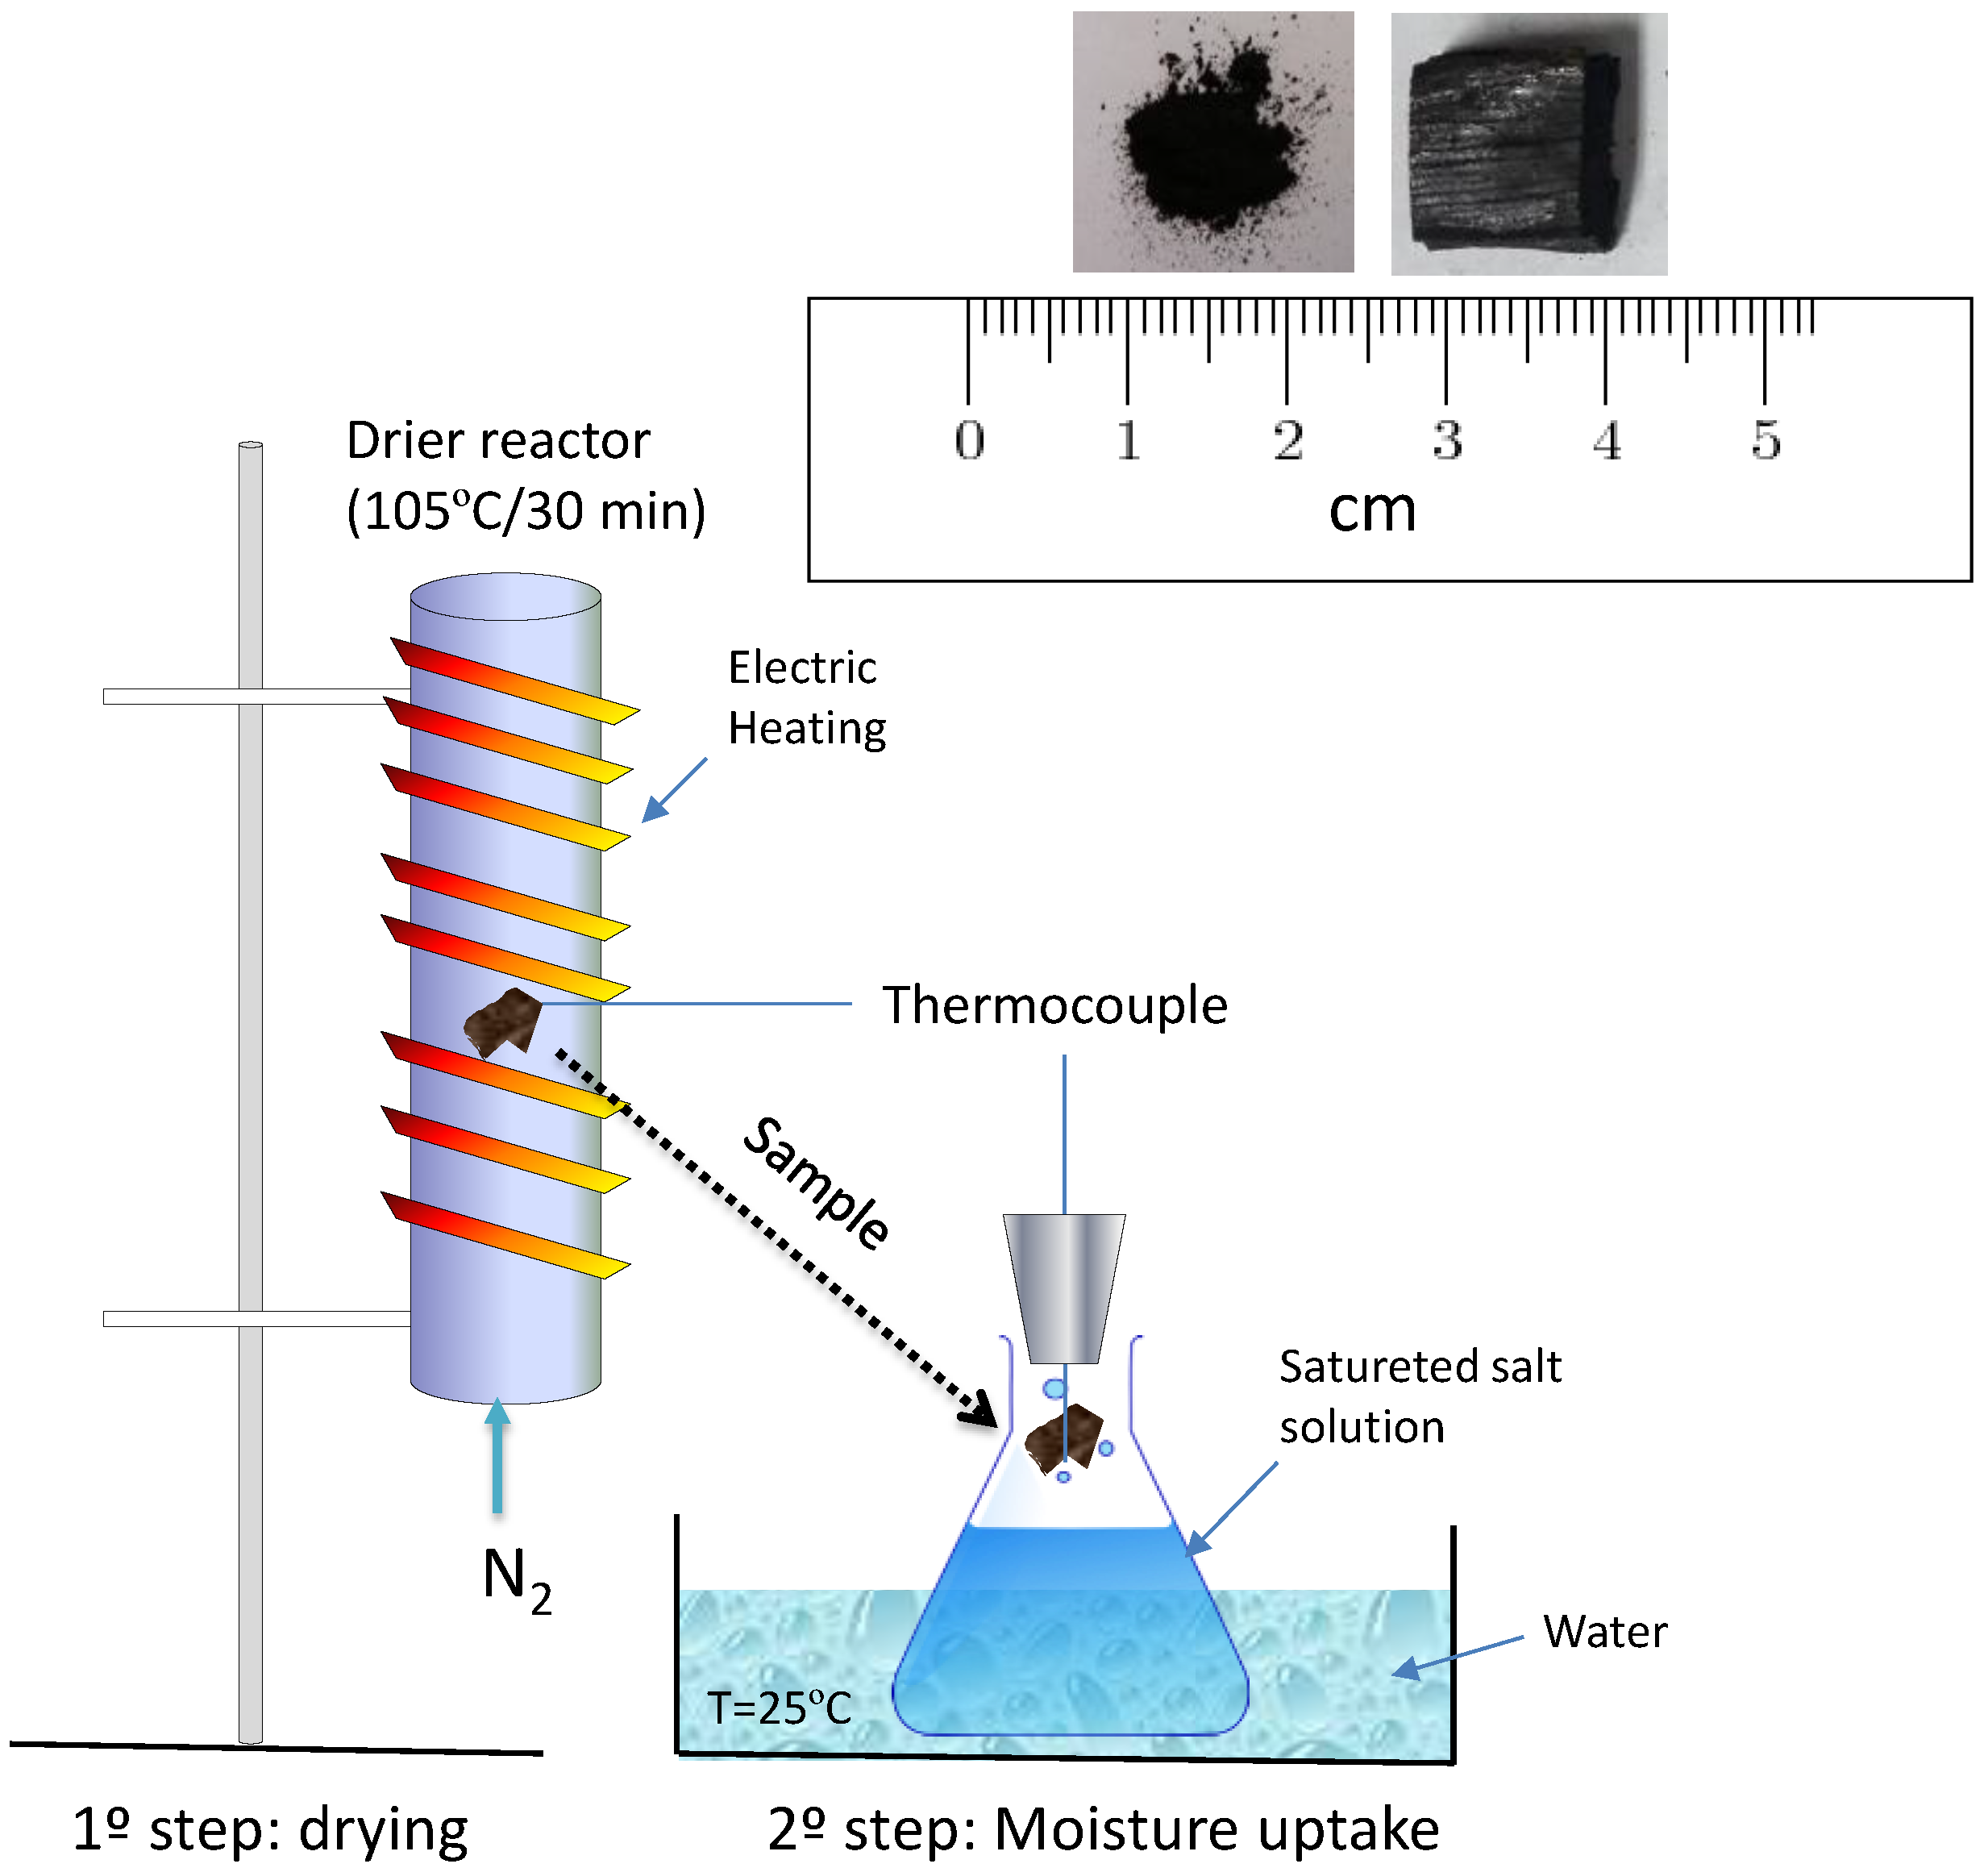
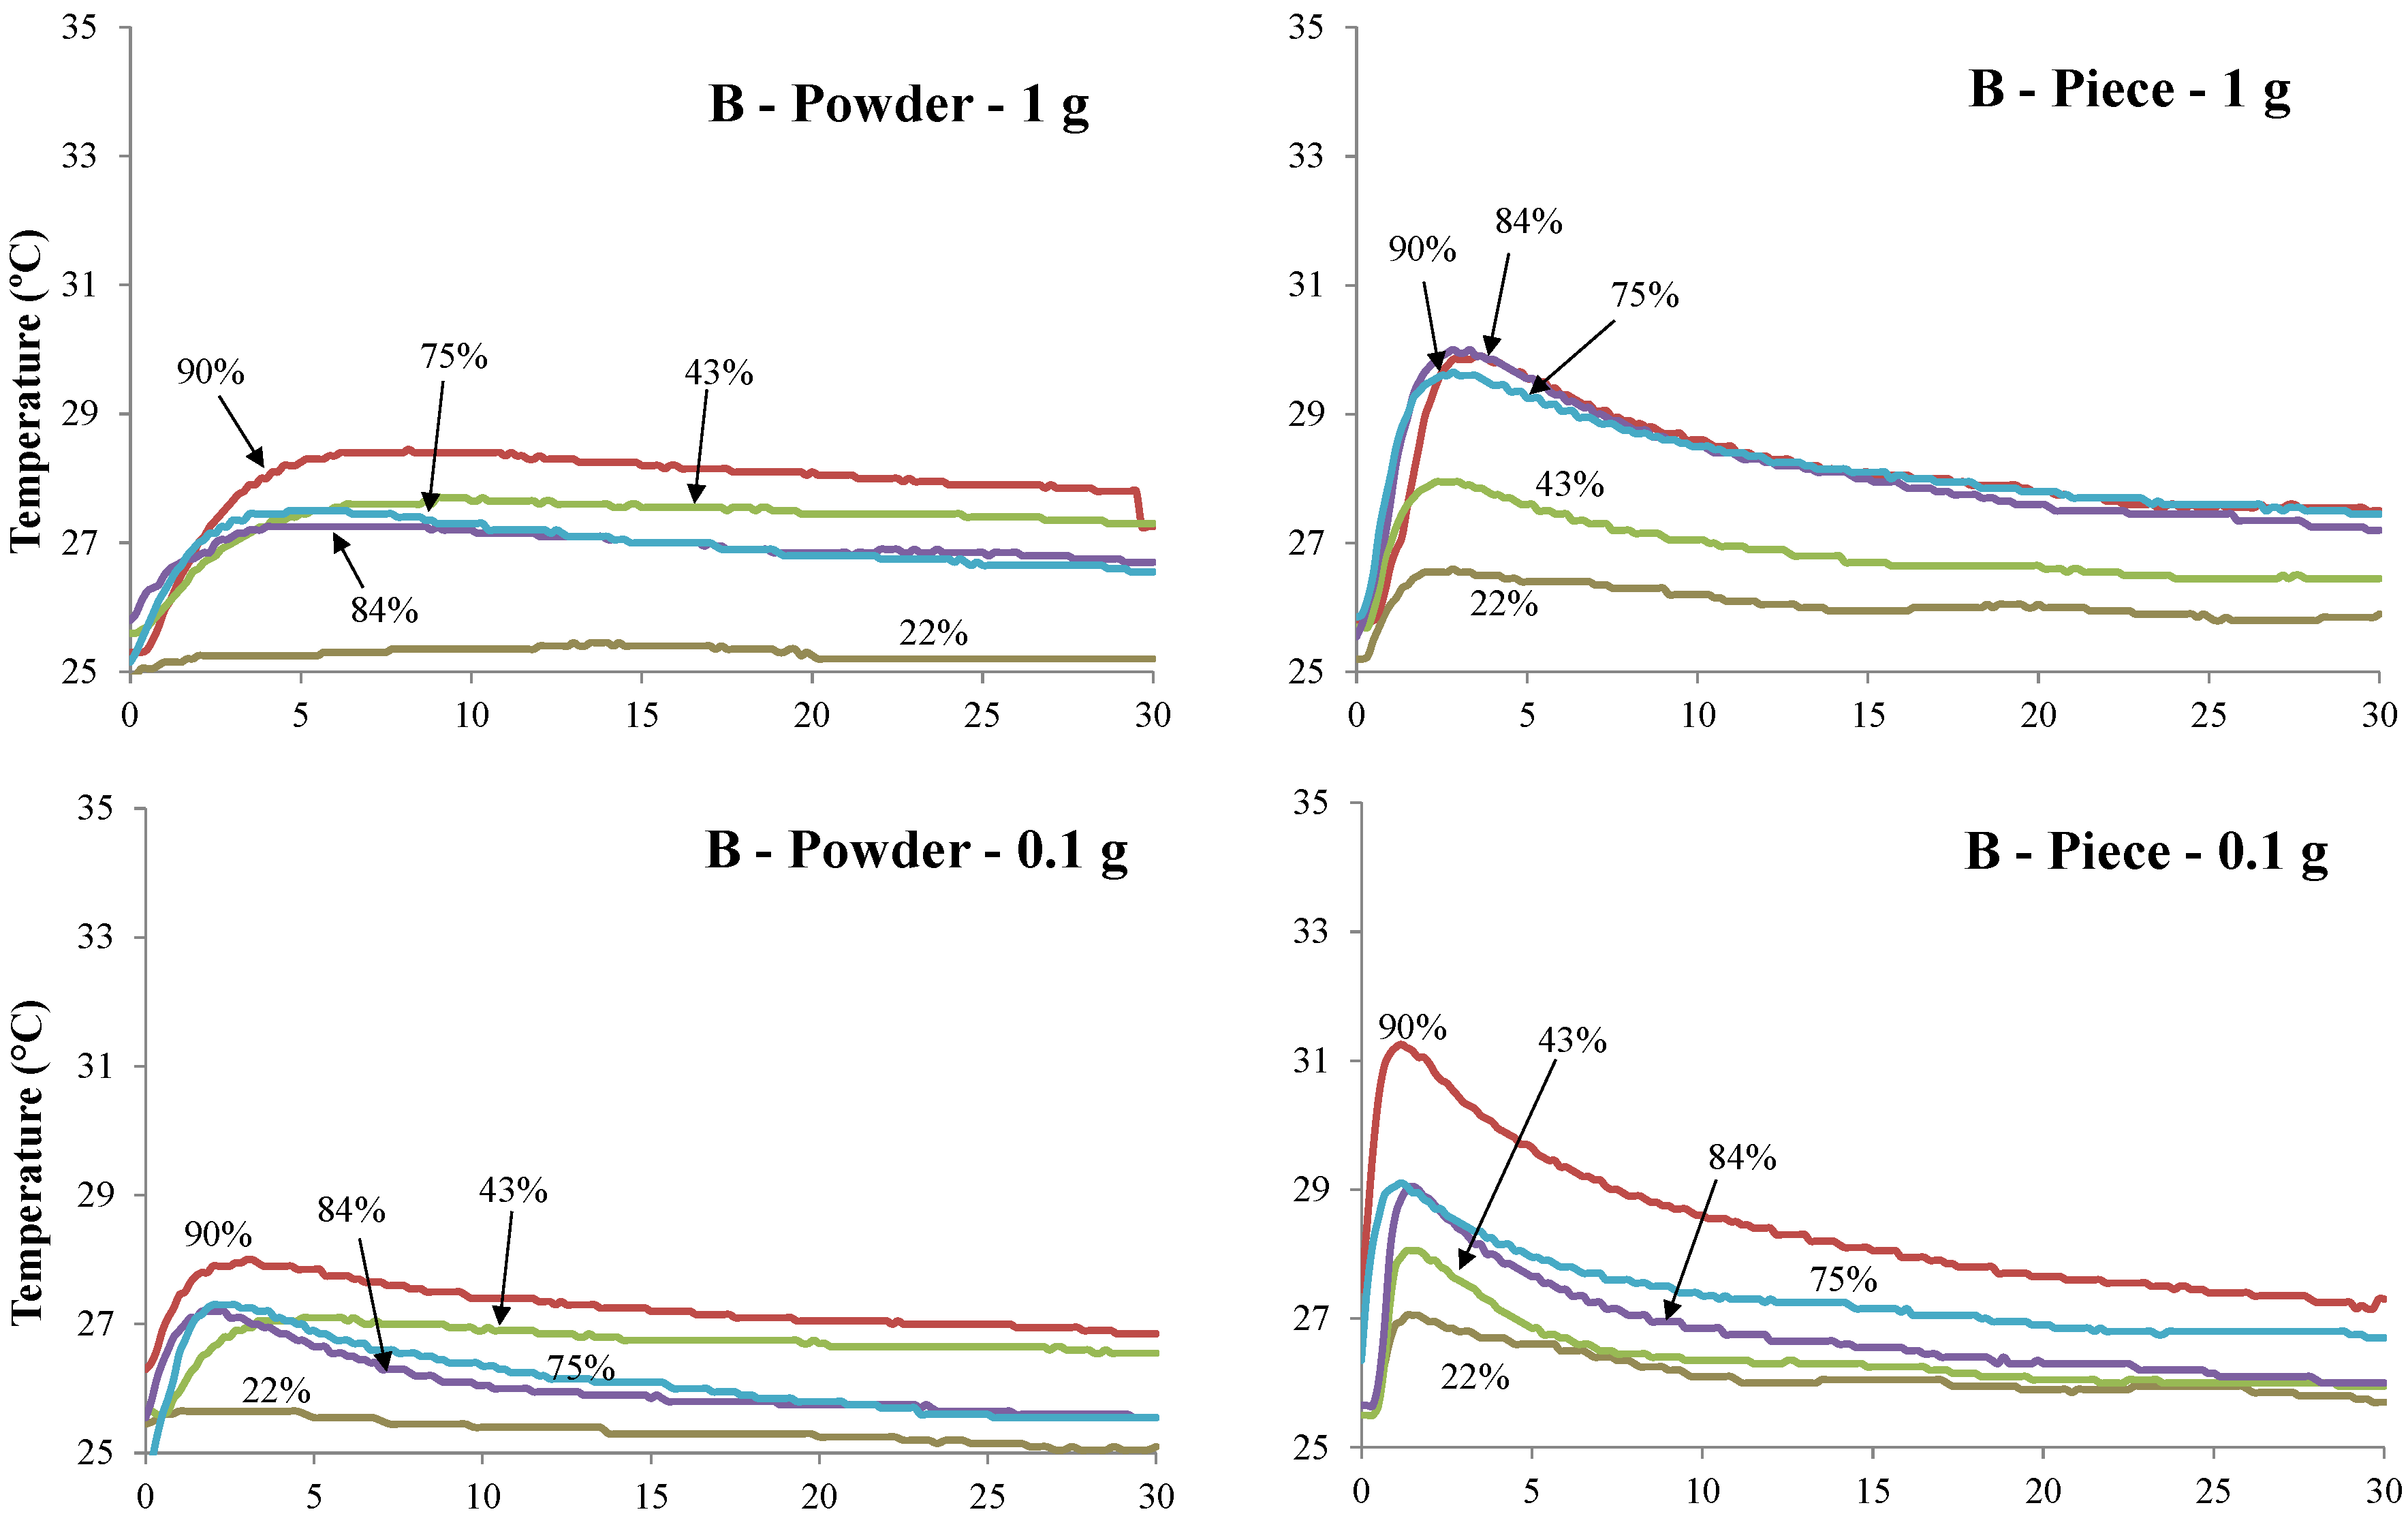
T) of biochar pieces and powdered biochar reached when exposed to five different conditions of relative humidity. All samples show a significant increase in temperature. The higher the air humidity value is, the higher the increase in temperature is. This tendency is observed for almost all samples. The highest and fastest increase in temperature is observed for the piece of biochar characterized by the lowest weight (0.1 g) (
Figure 2). The temperature profiles of the powdered biochar samples are significantly different from the biochar piece samples and this is independent of the weight of the samples. While the biochar piece samples required around 2 min to reach the peak temperature, the powdered biochar samples required 5 to 8 min under the highest relative humidity conditions. Cg biochar and piece samples reached the highest temperature (6 °C) for a relative humidity of 90.2%.
Concerning the water vapor adsorption for all conditions, all the samples with a mass of 1.0 g show a lower water vapor adsorption capacity than samples with a mass of 0.1 g. The values obtained are more dispersed. However, the global trend shows that more mass of water vapor was adsorbed when the samples were exposed to higher levels of relative humidity. This difference is mainly due to the difference in mass transfer in the samples [
2]. The highest amount of water adsorbed is observed for Cg (piece 0.1 g/84.3%), Cg (powder 0.1 g/90.2%), and B (powder 0.1 g/84.3%) with 7%, 6.5%, and 6.2%, respectively. For the powdered biochar samples, the better adsorption capacity can be explained by the larger surface area exposed to outside conditions compared to the piece. The surface area is also an important physical property for self-ignition. A direct correlation between oxygen chemisorption and active surface area has been reported by Zhao [
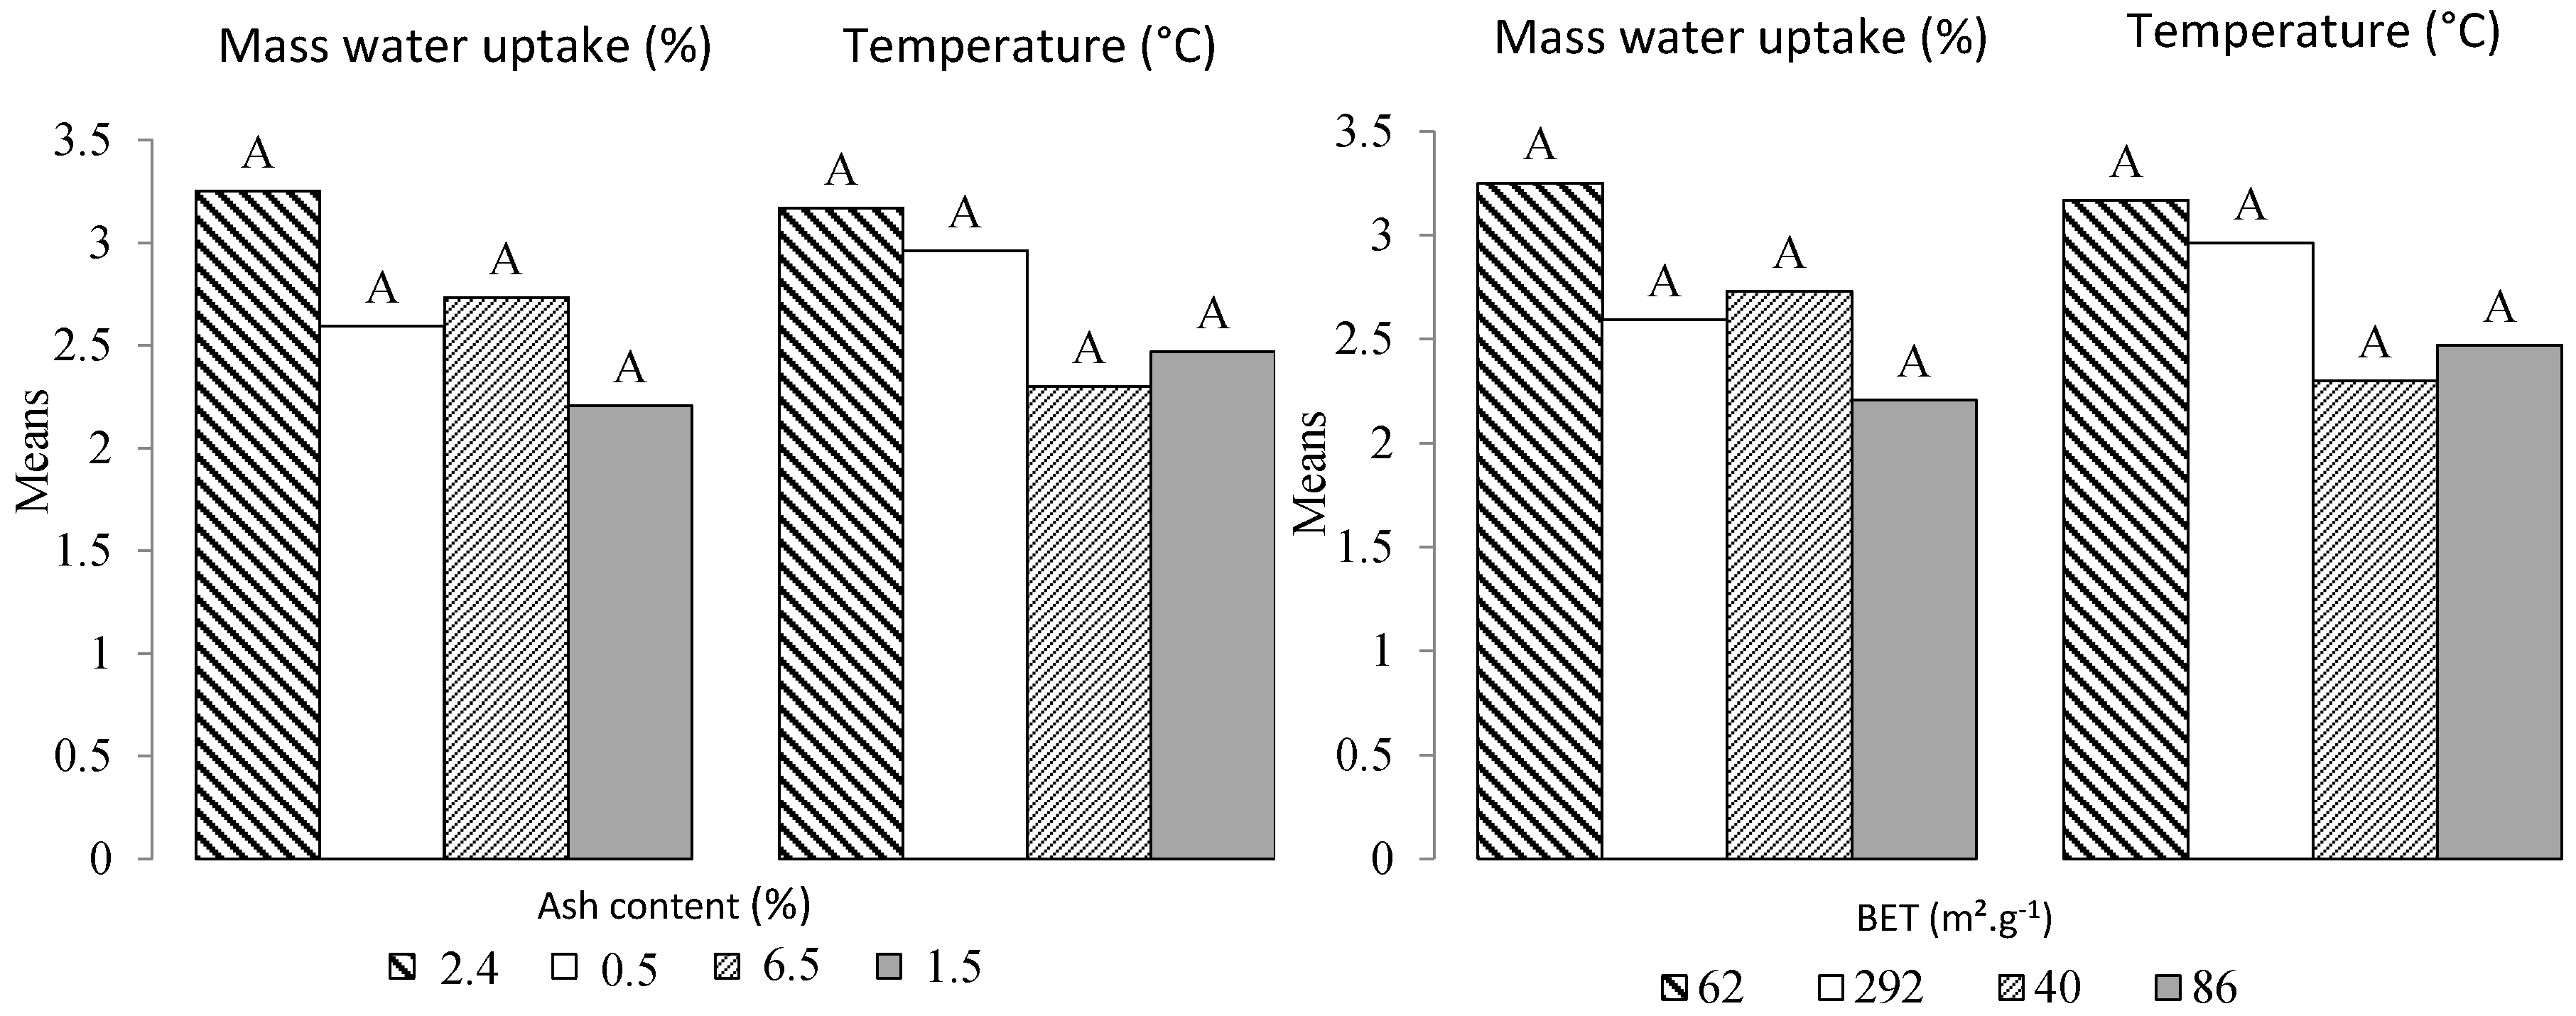
17]. However, this phenomenon does not seem to be correlated to the BET results (
Table 1), where (Qp) and (B) biochars with 292 and 40 m
2·g
−1, respectively, did not show the strongest and lowest potential for spontaneous combustion, respectively. To confirm this, we performed a one-way balanced analysis of variance. As shown in
Figure 3, the Tukey’s HSD (Honestly Significantly Different) test was applied to all pairwise differences between means. As all the combinations shared the same letter, it can be concluded that the BET does not significantly affect water absorption (
W) and temperature (
T).
The above discussion shows that the adsorption of water vapor under different relative humidity conditions (
Table 3) has the potential to raise the temperature of the samples. However, other biochar-related physical and chemical properties can also affect water sorption and consequently the increase in temperature (
Table 4). For example, the mineral content acts as a heat sink [
17]. With the increase in mineral content (indicated by increasing ash content), it has been shown that the crossing point of coal temperature increases (CPT), which is used to evaluate the spontaneous combustion of coal. The Crossing-point Temperature (CPT) is the temperature (temperature and corresponding time) at which the increasing coal temperature is equal to the increasing oven temperature within a Temperature-Programmed System (TPS) [
18]. These results suggest that Bamboo with 6.5% ash content should be the most subject to spontaneous combustion, while Qp should be the least affected (0.5%). A recent study by [
15] showed the opposite.
Figure 3 shows no difference related to ash content for the four biochars. In the literature, a lot of models have been developed to predict spontaneous ignition. They were mainly engineering models and small-scale methods requiring producing input data for such models [
9]. In the next sections, a statistical analysis based on linear regressions and analysis of variance (ANOVA) is reported, investigating the weight of each independent or explanatory variable according to the model equation presented in the experimental section.
3.2. Linear Regression Model
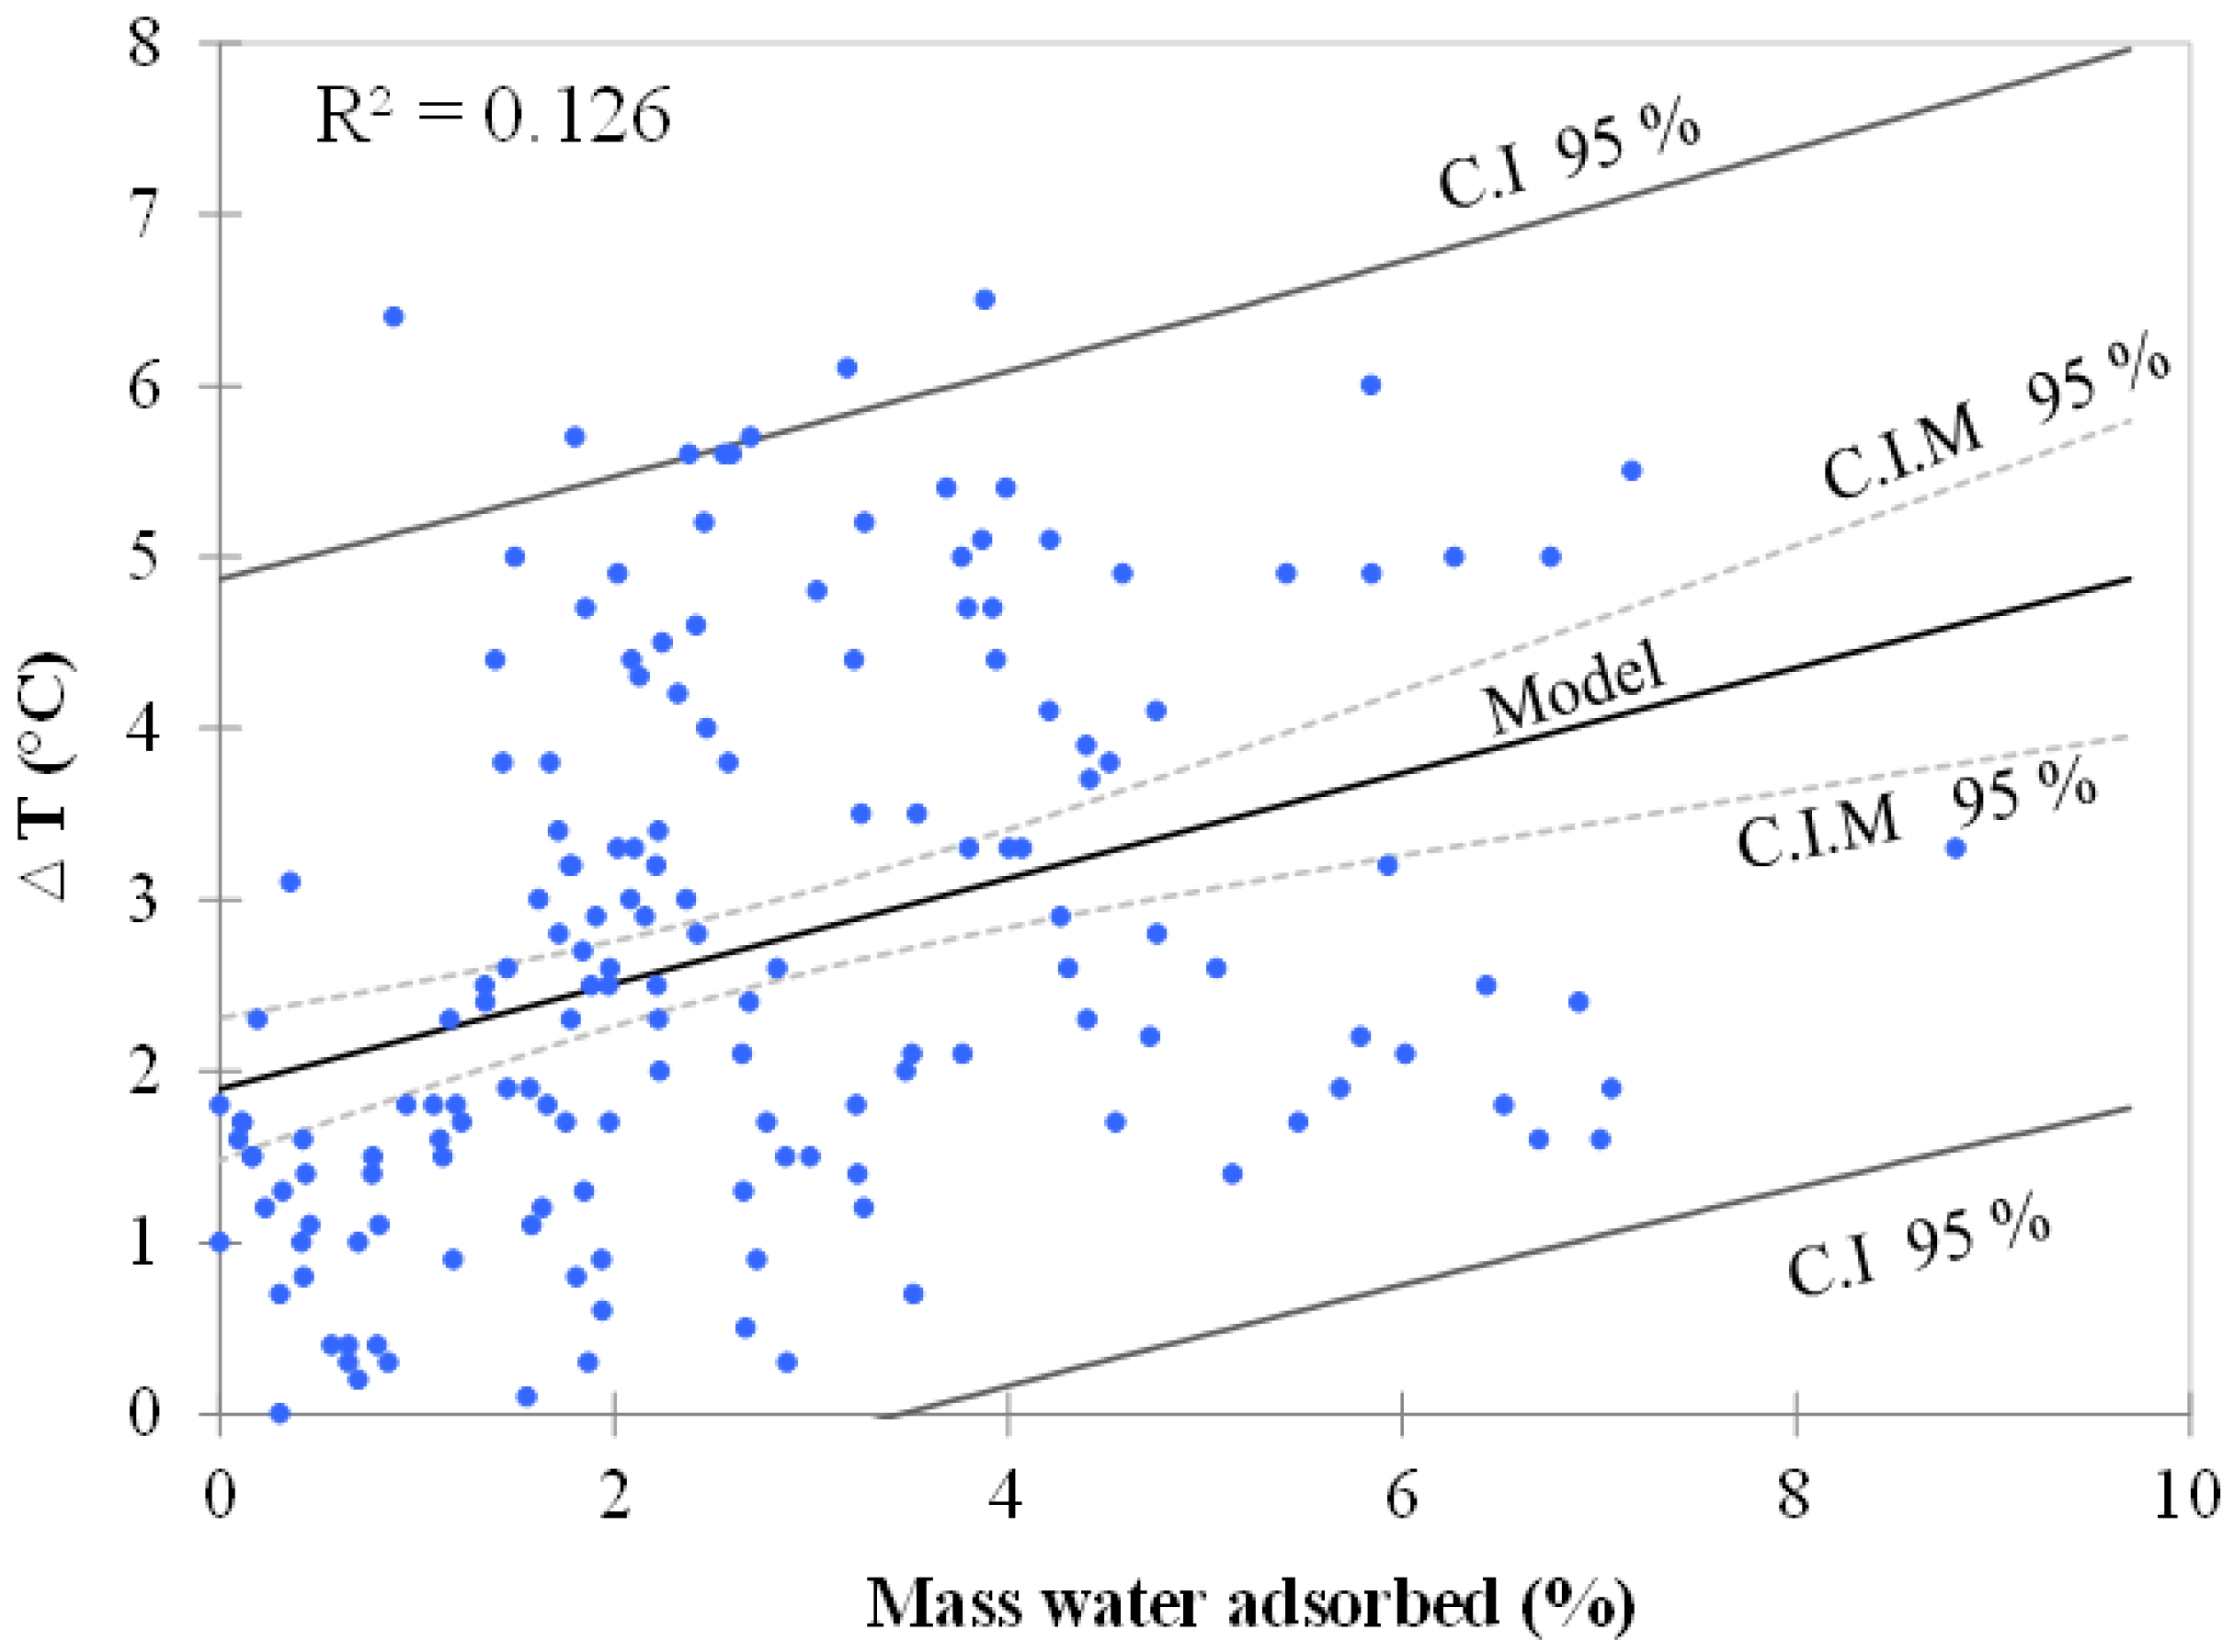
Applying a simple linear regression model based on Ordinary Least Squares (OLS), the objective was to determine how temperature (
T) varies with water adsorption (
W) and to verify if a linear model makes sense. The chart from
Figure 4 allows us to visualize the data, the regression line (the fitted model), and two confidence intervals at 95%. It can be clearly seen that there is a linear trend, but also a high variability around the line. This high dispersion of results is corroborated by a low R
2 value (0.126), indicating that only 13% of the variability of the temperature can be explained by water adsorption. The model equation in this case is given by:
Several linear regressions were performed to verify if any linear models limited to selected data from each independent variable (
RH,
B,
M, and
S) could better explain the results obtained. Statistics are summarized in
Table 5 and enabled us to determine whether or not the explanatory independent variables bring significant information to the model. Despite generally low R
2 values for all explanatory variables, the information brought by size (piece), mass (0.1 and 1 g), and type of biochar (Th) is observed to be more significant than the other variables. These variables explain 60, 40, 30, and 17% of the relation between temperature and water adsorption, respectively. Their probabilities corresponding to the F value were found to be lower than 0.0001. If we can partially conclude with confidence that these four independent variables brought a significant amount of information, the linear regression model still shows limitations; using a simple linear regression is not acceptable for the prediction of temperature increase as a function of water adsorption.
3.3. Analysis of Variance (ANOVA)
The ANOVA function was used to find out if the results would differ according to the formula described in
Section 2.3 and, if so, which formula is the most effective. A pairwise comparison was performed to be able to run a Tukey’s test, which is generally used in conjunction with an ANOVA to determine which means significantly differ from each other. The test compares the mean of each treatment to the mean of every other treatment. A stepwise method was selected and the statistics corresponding to the different steps were displayed. Finally, the best models for each number or variables with the corresponding statistics and for the criterion chosen were calculated.
Table 6 displays the goodness of fit coefficients for the 160 observations, including the R
2 (coefficient of determination). The two dependent variables display a very low coefficient of variation (<1), indicating a good control over the operating conditions. For both water adsorption and temperature, around 89% of the variability is explained. The remaining 11 percent are hidden in other variables including biochar physical and chemical characteristics, which the model classifies as “random effects”. Given that the probability (Pr) corresponding to the Fisher’s F is lower than 0.0001 for both
W and
T, we can conclude that the explanatory variables and their interactions have a significant effect.
To elaborate the two models for each dependent variable (
W and
T), the selection process started adding the variable with the largest contribution to the model. If a second variable is such that the probability associated with its “
t” is less than the “Probability for entry”, it is added to the model. The procedure continues until no more variables can be added. This analysis allowed us to retain eight and nine explanatory variables (
Table 7) to predict
W and
T, respectively. The cumulative coefficient of determination R² gives a fair idea of how much of the variability of
W and
T can be explained by these four qualitative variables and their interactions.
It is observed that the three interactions Size × Biochars, Size × Biochars × RH and Size × Mass × RH do not affect water sorption and temperature, while the variable RH influences them. The same observation is observed with the mass variable (M). This means that when explanatory variables are taken independently, they influence experimental results, but if associated, their effects are limited. The two independent variables Size and Biochars, and the second order interaction Biochars × RH, are found to only influence the temperature variable (T), while Biochars × Mass, Biochars × Mass × RH and Size × Biochars × Mass × RH, (second, third, and fourth order interactions, respectively) only influence the water sorption variable (W). Although the biomasses selected had different morphologic properties, it is noted that these do not affect water adsorption. This observation confirms that the BET area is not correlated to this quantitative variable (W). Finally, all the other explanatory variables and their interactions are observed to significantly influence W and T. For T, around 50% of the variations can be explained by the relative humidity variable, while W variations can be explained by the interaction “Mass × relative humidity” (R2 = 0.48).
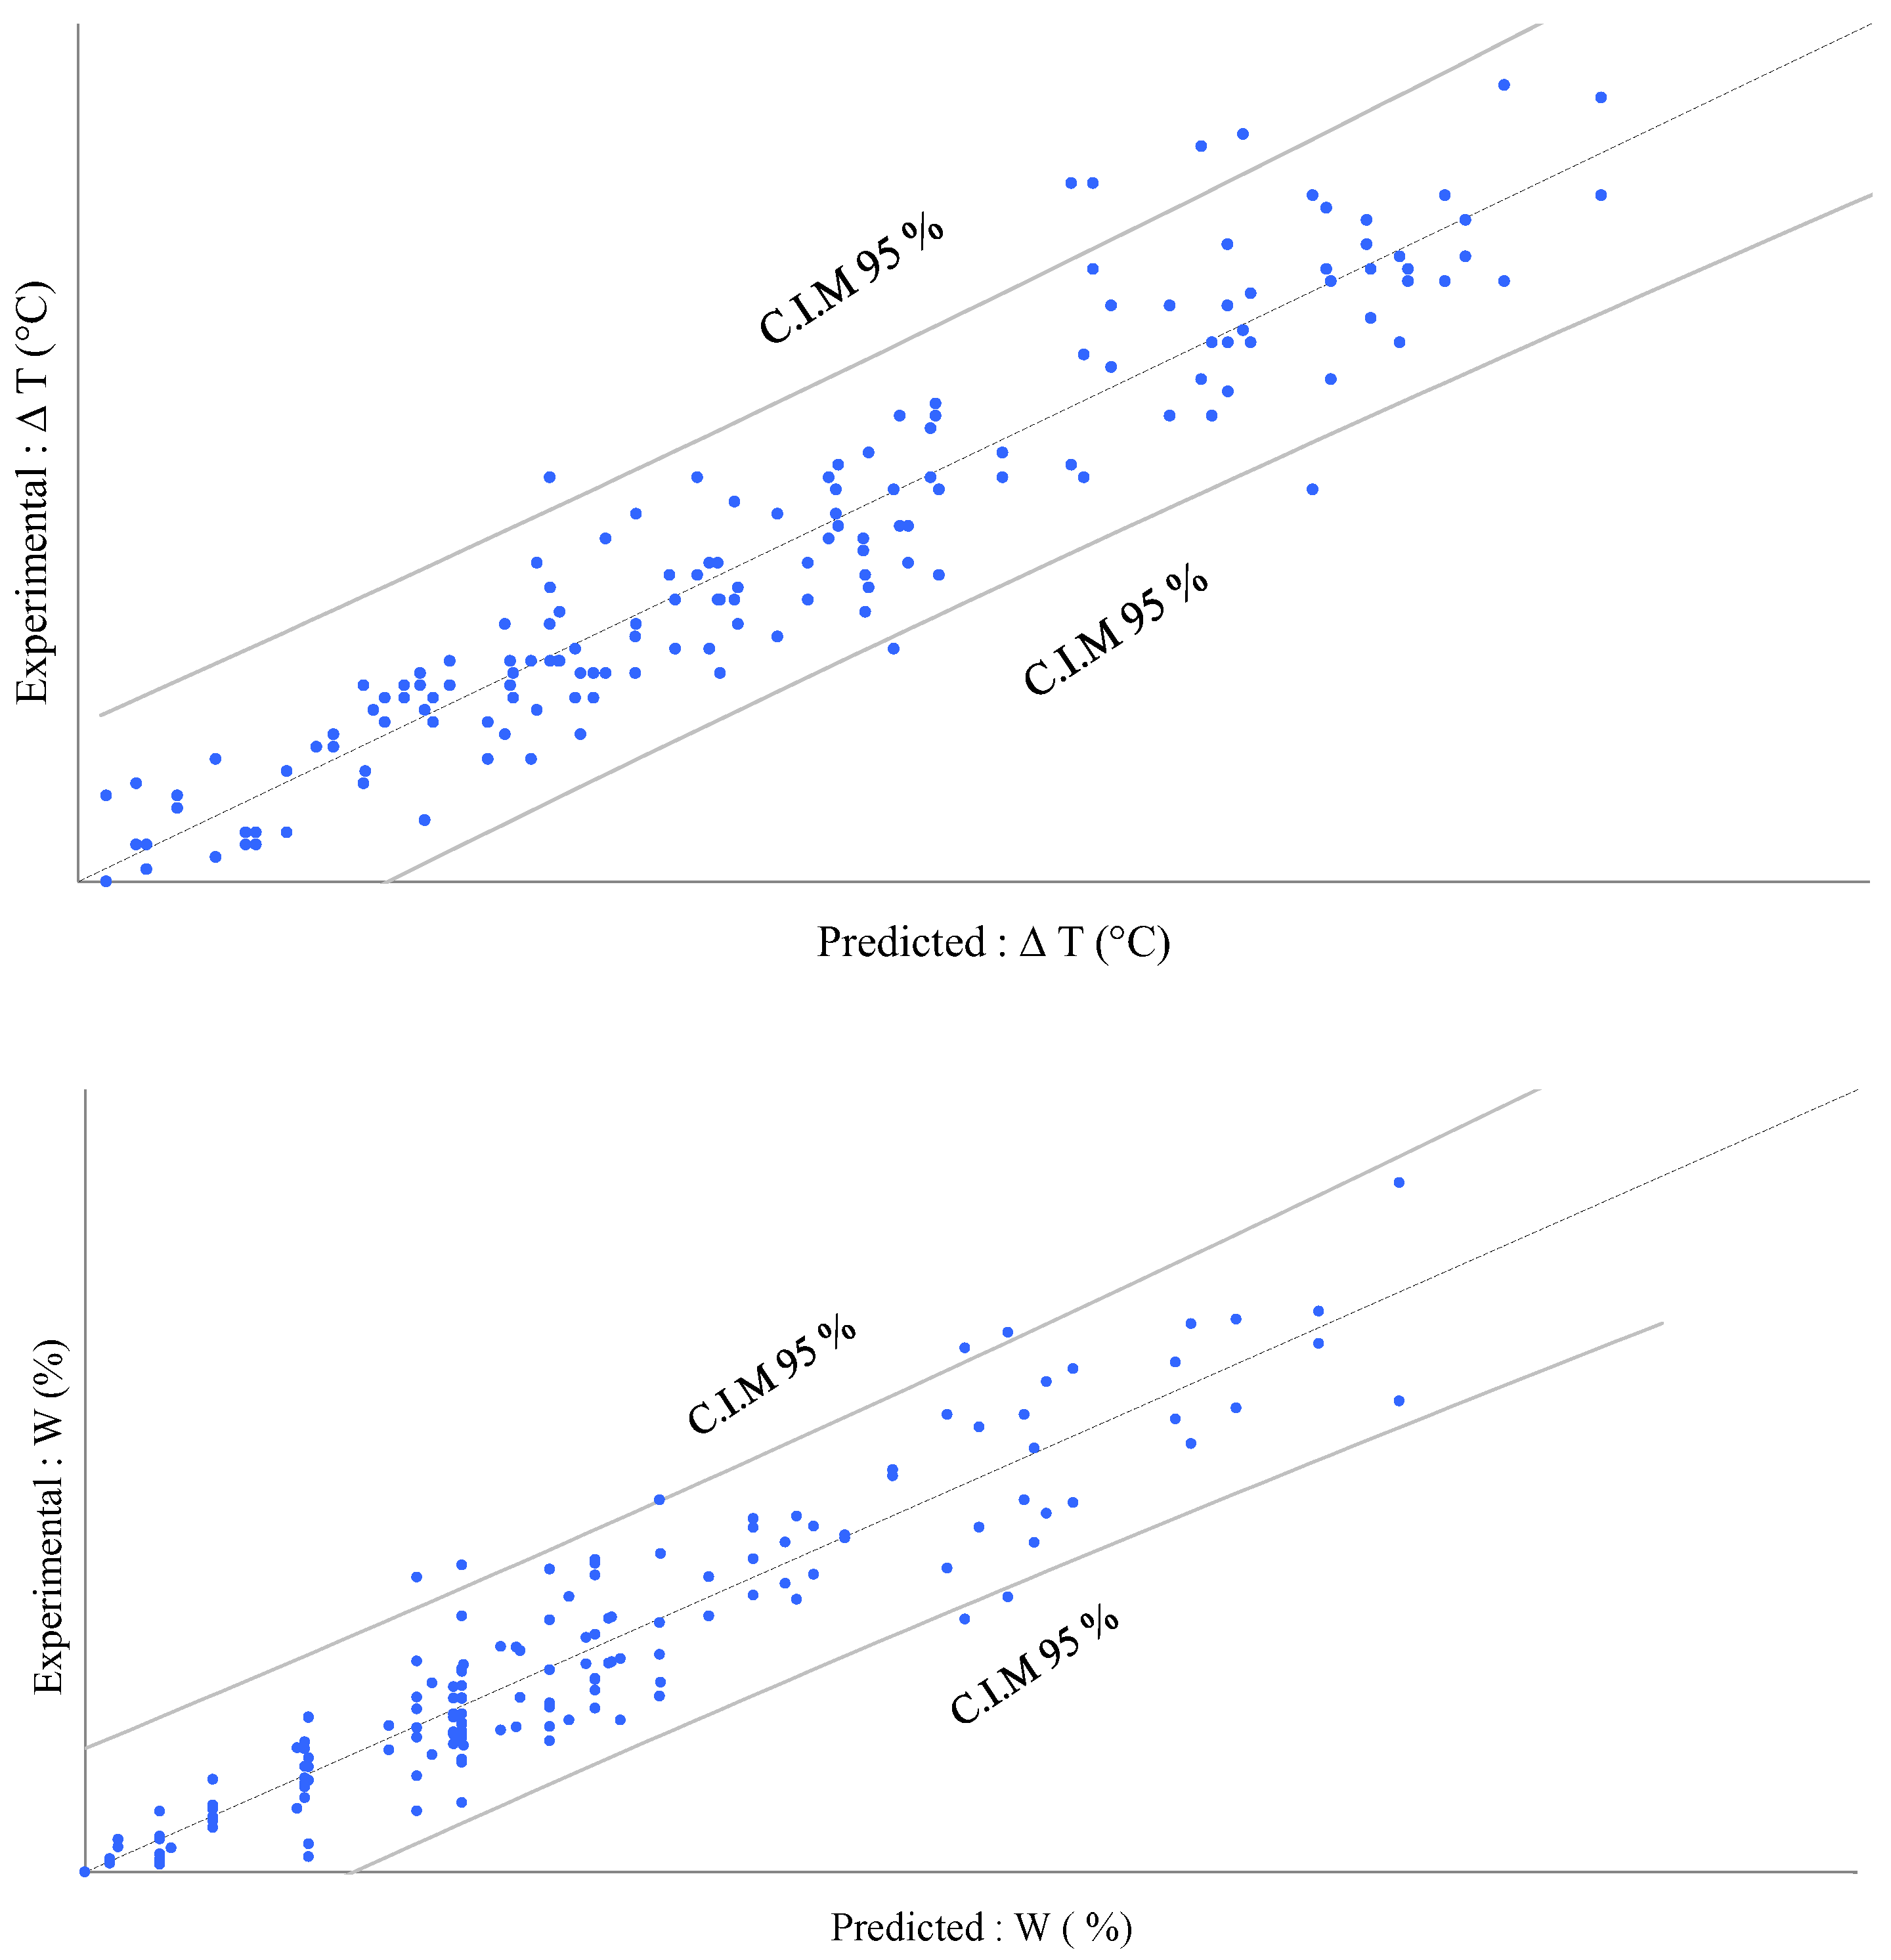
Figure 5 allows a comparison of the predictions to the experimental values. The confidence limits permit us to identify outliers, as with the regression plot displayed above. The two models bring significant information to explain the experimental results for
W and
T. The quite low deviation observed for all points, which remained close to the first bisector line, allow us to conclude that these two models did fit with the experimental results quite well.
The previous conclusions drawn from the means are statistically supported by the pairwise multiple comparisons. Significant information arising from
Table 7 was summarized. All the combinations between the levels of the four factors and their interactions were associated to letters after applying the Tukey’s test. This section focuses on the interpretation of all pairwise differences between means. Two level combinations sharing the same letter translate into not being significantly different. Two combinations with no letter in common translate into being significantly different. Attention is paid to factors and interactions that are the most significant according to the models. The following two factors and three interactions were identified: Mass, RH, Size × RH, Mass × RH, and Size × Biochars × Mass.
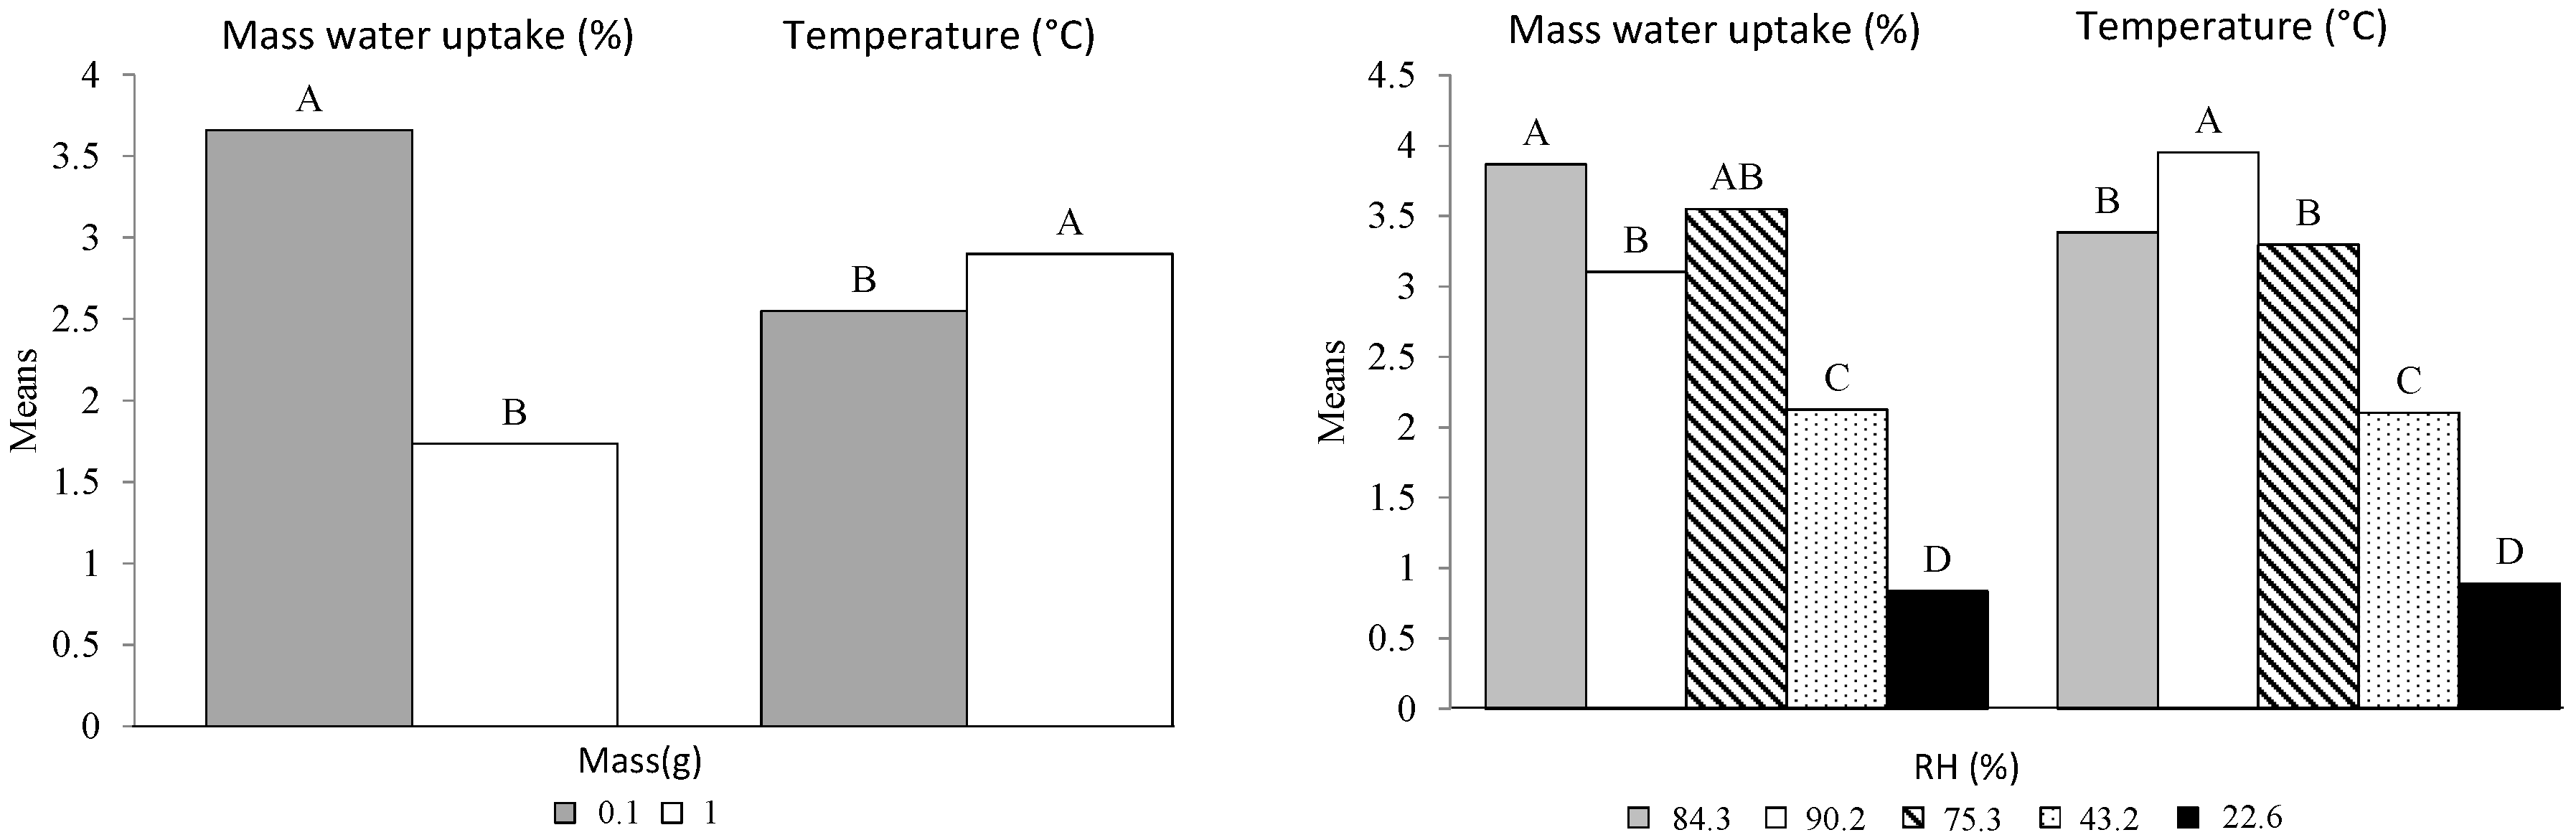
As a reminder, the variable “Mass” is characterized by two values: 0.1 and 1 g.
Figure 6 shows two distinct groups (A and B) for both W and T. Although the difference between the water sorption averages is evident (1.9%), this analysis of variance shows a significant difference for T, despite relatively similar average values (2.55 °C and 2.90 °C). Concerning the explanatory variable RH, the four pairs of categories are found to be different. The two RH pairs 84.3 × 75.3 and 90.2 × 75.3 do not show any significant differences, while the means between 84.2 and 90.2 are significantly different (3.1 and 3.9%). Except for 75.2%, all the other air relative humidity conditions show significant differences with regard to the observed adsorption values. The highest and the lowest values are 3.87 and 0.84% for RH values of 84.4 and 22.6, respectively. The maximum temperature is obtained with the highest relative humidity (3.95 °C) and the minimum temperature with the lowest RH (0.84 °C), as corroborated by the literature [
14]. We can conclude that these two factors (Mass and RH) played a significant role in both the two models.
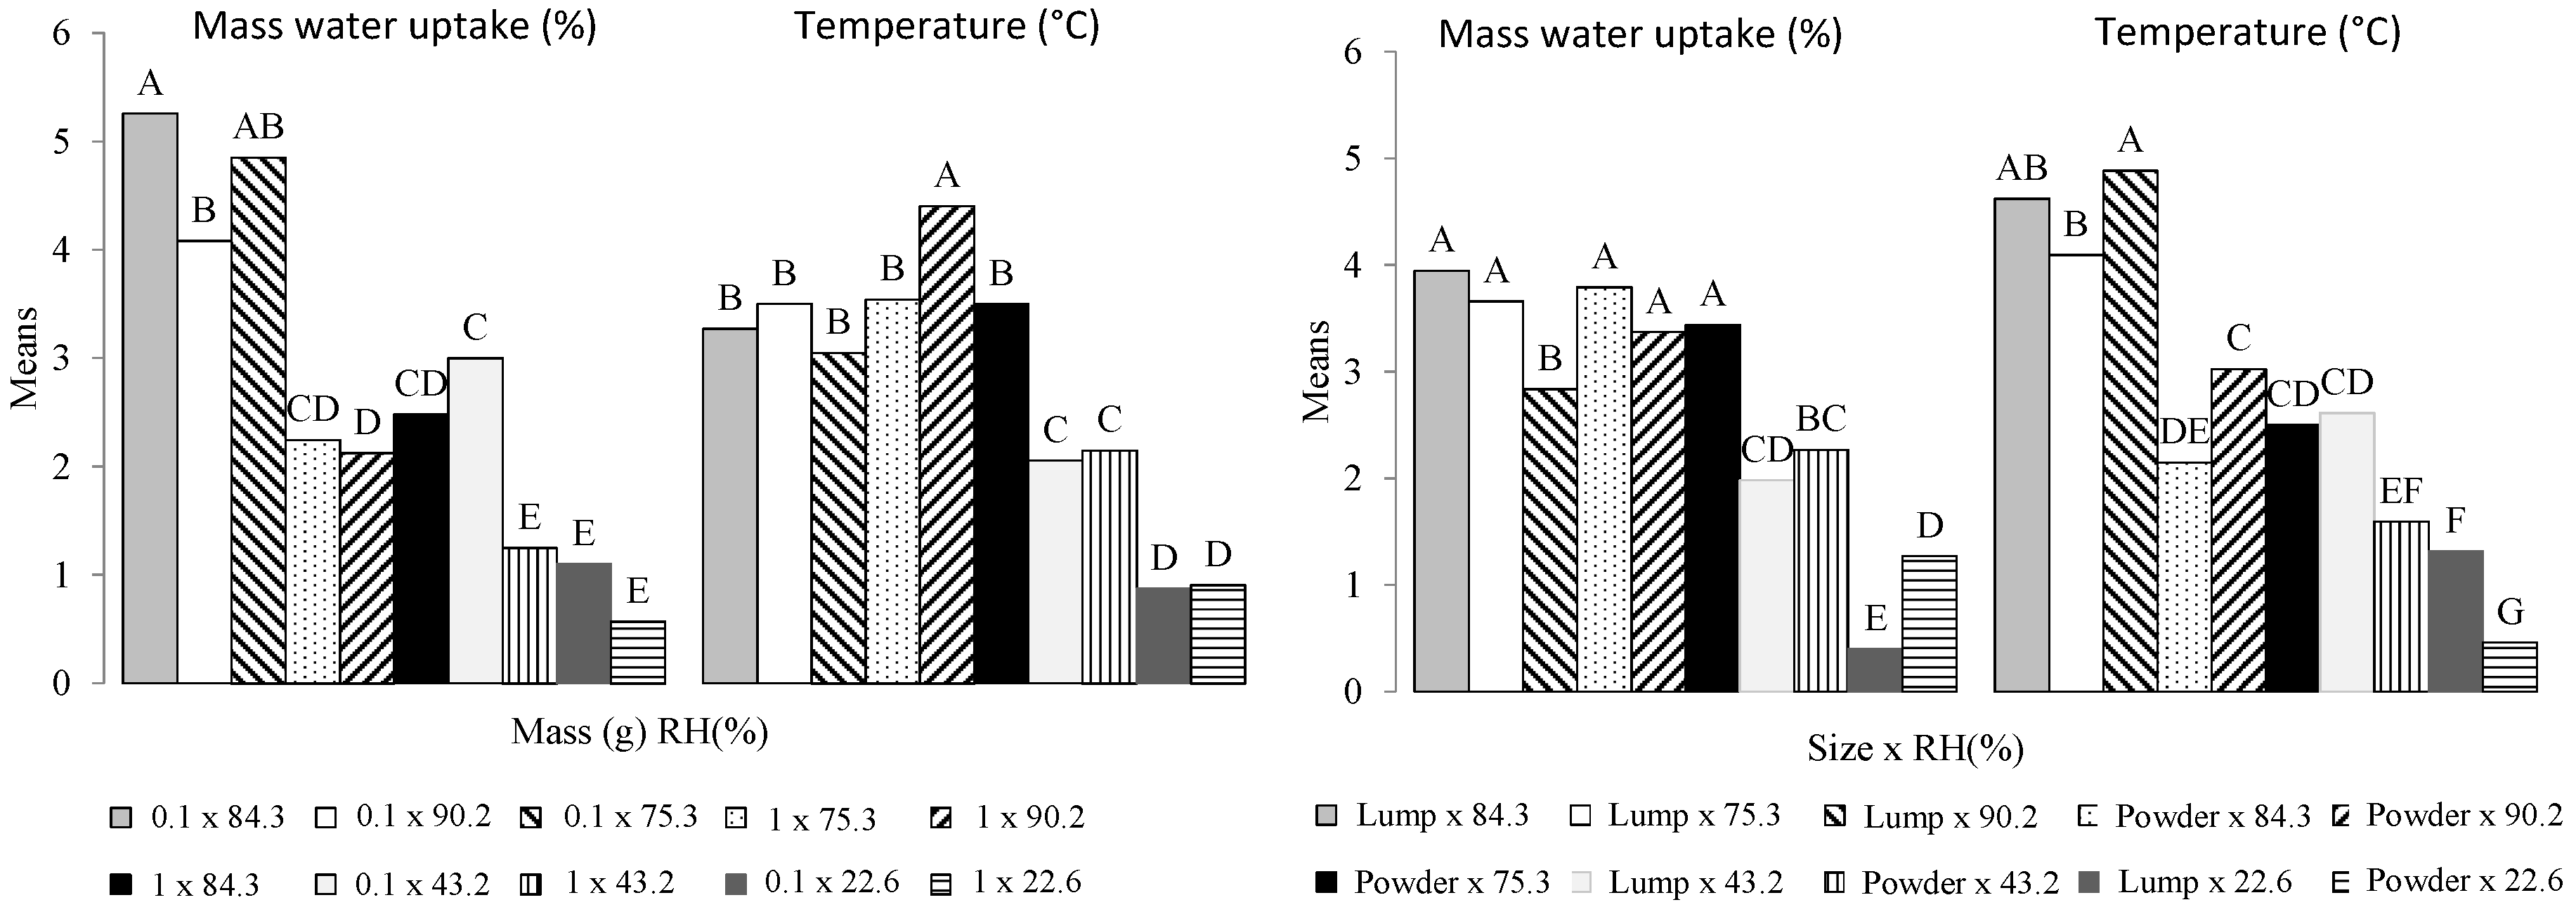
Figure 7 shows the pairwise multiple comparisons for the second order interactions Size × RH and Mass × RH. For each interaction, all the combinations of levels between the two factors are compared to one another. The number of combinations possible between interactions and variables is 10. The variable Size is characterized by grinded biochar (powder) or biochar piece. The interaction Size × RH shows five and seven groups for water adsorption and temperature, respectively. Water sorption shows five combinations with means that are not significantly different. It concerns mainly high relative humidity values regardless of the sample size. Indeed, the difference appears mainly with the lowest humidity values (22 and 43%). The temperature shows two combinations (Piece × 90.2 and powder × 22.6) with no letter in common. Biochar pieces are more sensitive to relative humidity than powdered biochar, showing a higher average temperature (4.8 °C). This can mainly be attributed to the difference in the mass transfer rates and heat generation related to the sample size [
2]. Indeed, it has been demonstrated that the effect of both the temperature overshoot and the pressure is dependent on sample thickness [
19].
The combinations associated with the interaction Mass × RH show five and four groups for W and T. The variable T shows lesser variability compared to the Size × RH interaction. Five combinations concerning mainly high relative humidities have the same letter (B). Water sorption is mostly influenced by small mass combined with RH, except when RH is equal to 22.6%. When combined with humidity, the explanatory variable Size mostly influences the temperature, while the variable M mostly influences the adsorption of water.
The last common parameter to W and T models is the third order interaction Size × Biochars × Mass.
Table 8 gives the average value classified by the Tukey test. The variable
T presents seven groups and W only four groups. The temperature variable is more sensible to this interaction than the water adsorption variable and can be explained by the factors “biochars” and “Size” only present in the T model (
Table 7). The overall results confirm that water adsorption is not correlated to the increase in temperature. Therefore, others elements, not yet identified, are likely involved in the increase in temperature.

 and
and 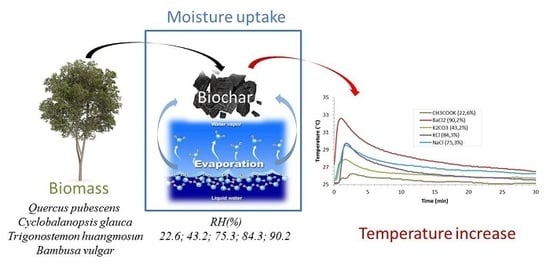


