Article

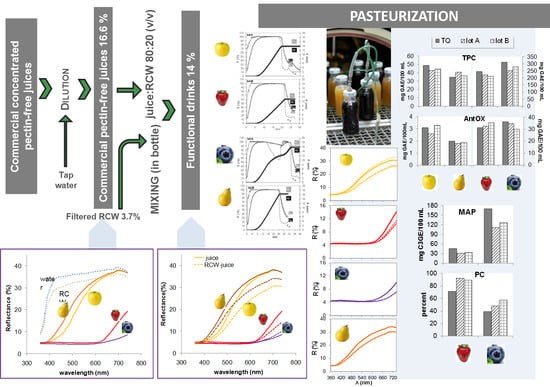
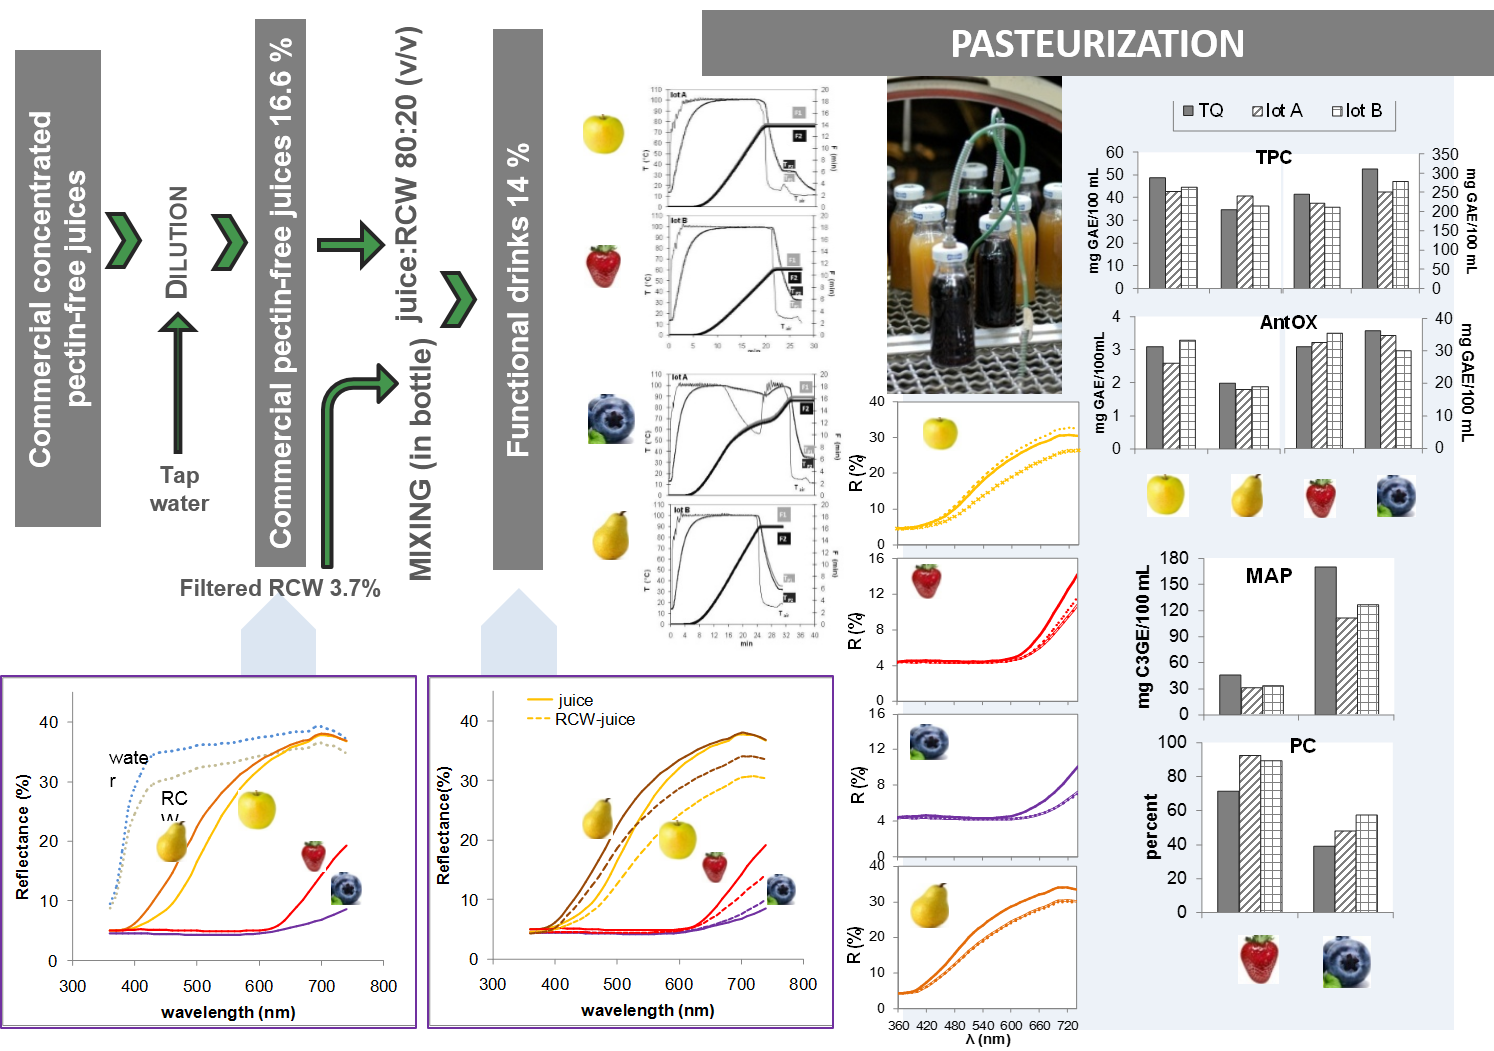
Ricotta Cheese Whey-Fruit-Based Beverages: Pasteurization Effects on Antioxidant Composition and Color

Consiglio per la ricerca in agricoltura e l’analisi dell’economia agraria, Unità di ricerca per i processi dell’industria agroalimentare (CREA-IAA), via Venezian 26, I-20133 Milano, Italy
*
Author to whom correspondence should be addressed.
Beverages 2017, 3(1), 15; https://doi.org/10.3390/beverages3010015
Submission received: 18 October 2016 / Revised: 9 February 2017 / Accepted: 13 February 2017 / Published: 20 February 2017
(This article belongs to the Special Issue Dairy Beverages: New Trends and Concepts)

Abstract

:
In order to minimize the precipitate formation upon pasteurization for whey-fruit juice-based beverages, a novel type of functional beverage was prepared, in which whey was replaced with Ricotta-cheese whey (RCW). Aiming at evaluating the influence of fruit juice type (yellow: apple, pear; red: blueberry, strawberry) and pasteurization conditions on color and antioxidants, four fruit-RCW-based beverages (juice/RCW ratio: 80/20, 14% soluble solids content) were prepared and divided into two lots, and each lot was pasteurized according to different times/temperatures. After pasteurization, no formation of precipitate was observed in the bottles, even if some turbidity, ranging from 25 NTU (pear-RCW) to 190 NTU (blueberry-RCW), was observed. The blending of juices with RCW caused color darkening in apple, pear, and strawberry blends, and brightening in the blueberry one. The pasteurization conditions had a greater impact on the color changes of ‘yellow’ beverages than those of the ‘red’ ones. With a lethal rate F 100 10 = 14 , there was a greater decrease in the total phenolic content (TPC) in blueberry-, strawberry-, and apple-RCW beverages, and a greater decrease in the monomeric anthocyanin pigment (MAP) and a smaller increase in the percent of polymeric color, in the blueberry-RCW beverage. Results on the antioxidant activity suggested that the Maillard reaction products formed in response to thermal treatment and/or the formation of anthocyanin polymers, likely compensate for the loss of antioxidant activity due to TPC and MAP degradations.

Graphical Abstract

1. Introduction

Among the dairy-based beverages, whose market is still at a niche level, the whey-based fruit juice-type could be considered a novel functional beverage: the nutraceutical components coming from the fruit itself are combined with the highly prized nutraceutical components of whey, thus strengthening the functional status of the resulting product [1]. Whey contains: lactose, which has dietary fiber-like and prebiotic properties, and enhances the absorption of calcium and magnesium [2]; caseinomacropeptide (CMP), which protects against toxins, bacteria, and viruses, promotes bifidobacterial growth, and modulates immuno system responses [3]; and α-lactoalbumin and β-lactoglobulin, proteins of high biological value which are rich in essential amino acids (leucine, isoleucine and valine) that are readily metabolized for energy use by the muscle [4]. By changing the type of fruit juice used in the formulation, the functional properties of the beverage can be modulated, as fruit is a rich source of several bioactive molecules, including carotenoids, polyphenols, isothiocyanates, sulphide, and phytosterols. The presence of phenolics, such as anthocyanins, flavonols, catechins, and phenolic acids in blueberries and strawberries, has been related to various functional properties, such as the prevention of oxidative stress by scavenging reactive oxygen species and free radicals [5,6], and a reduction of the risks of several diseases, such as cardiovascular disease and cancer [7]. Pear juice is rich in hydroxycinnamic acids, such as chlorogenic and coumarylquinic acid, arbutin, glycosides of the flavonols quercetin and isorhamnetin, and catechins such as epicatechin and procyanidin polymeric units, with chain lengths of up to 25 units. It thus has a potent antioxidant power, and the protective activities of pear juice against both human erythrocyte lysis and protein oxidation have been linked to the singlet oxygen quenching abilities of pear juice [8]. Apple juice contains large amounts of polyphenols, including flavonoids (quercetin glycosides, procyanidins, epicatechins, chlorogenic acids, and phloretin glycosides) and phenolic acids, and it has been reported that apple may reduce the risk of chronic disease by various mechanisms, including antioxidant, antiproliferative, and cell signaling effects [9].
Several studies have focused on the development of whey-based fruit blends with various formulations, to select the optimal mixture based on sensory perception [10,11,12,13], as the poor sensory profile of whey protein beverages still remains a challenge to consumer acceptance.
It has been reported that the acid whey from the manufacture of quark or cottage cheese is suitable for fruit-juice type whey-based beverages, as it is more compatible with the acidic flavor of fruit [1]. Depending on the processing technique, resulting in the casein removal from fluid milk, sweet and acid whey contain between 63 and 70 g/L of total solids [14]. The acid whey, similar to sweet rennet-based whey, contains lactose (70%–72% of total solids), whey proteins (8%–10%), and minerals (12%–15%), but differs from the whey produced from rennet coagulated cheese in its mineral content, acidity, and composition of the whey protein fraction. The whey protein fraction is characterized by the lack of glycomacropeptide (GMP), which, on the other hand, constitutes about 20% of the whey protein fraction of sweet rennet-based whey [14]. In contrast to sweet rennet-based whey and acid whey, ricotta-cheese whey (RCW, scotta), the main by-product of Ricotta cheese production, contains 0.15%–0.22% of proteins, 1%–1.13% of salts, and 4.8%–5% of lactose. It is obtained after the flocculation of whey proteins, and their separation as Ricotta cheese is induced by the thermal treatment of cheese whey at 85–90 °C, for about 20 min. RCW is produced in Southern Europe, with about 1 Mt per year in Italy, and, having an estimated biological oxygen demand of 50 g/L and a chemical oxygen demand of 88 g/L [15], it is a highly pollutant dairy waste, whose disposal represents a serious environmental problem. Currently, most of the RCW is used directly as cattle dietary supplement, and its low protein concentration makes RCW useless for all of the processes which involve protein valorization, but its high lactose content could be exploited for bio-ethanol production [16].
Nevertheless, another way to valorize RCW is to use it as an ingredient in fruit-based beverages, by exploiting its low protein concentration. In fact, it has been reported that acid whey and sweet rennet-based whey fruit-based beverages may suffer from precipitation, a phenomenon resulting from the aggregation of thermally-denatured proteins [17], which could negatively influence consumer acceptance. Hence, studies have been focused on finding out the best conditions to avoid whey protein precipitation upon thermal treatment of whey fruit-based beverages [13,18,19,20]. Therefore, replacing whey with RCW in the formulation of fruit-based beverages might overcome or minimize the precipitate formation upon thermal treatment. To our knowledge, the use of RCW as an ingredient for preparing beverages has not been studied thus far. With the aim of filling this gap, this work includes ‘yellow’ and ‘red’ fruit-RCW-based beverages, bottled in uncolored glass and suitable for a long time storage at ambient temperature, which were studied for their physico-chemical characteristics, color, and antioxidant composition, as a function of the type of fruit juice (apple and pear for the ‘yellow’ type, strawberry and blueberry for the ‘red’ type) and heat treatment conditions (lethal rate F 100 10 value).

2. Materials and Methods

2.1. Materials

The cow RCW used to prepare the fruit-RCW-based beverages was provided as a frozen product by a dairy industry of the Lombardy region (Italy), producing Ricotta cheese using their own cheese whey. After thawing at 2 °C for 24 h, the RCW was thoroughly mixed and filtered by vacuum suction through a porcelain Büchner funnel with a fritted glass disc and filter paper, in order to remove the majority of fat. The resulting product had a pH of 6.24 and 3.67% ± 0.04% of soluble solids content (SSC). The filtered RCW was kept for up to 24 h at 3 °C, before blending with the fruit juices.
Concentrated clear fruit juices were purchased as frozen products, without any preservers and colorants addition, from a fruit juice producer industry (GMC G. Mariani & C. S.p.A., Cellatica, BS, Italy). Four types of fruit juices were used in the beverage preparation: 65% pectin-free strawberry, 65% pectin-free blueberry, 70% pear, and 70% apple. The thawed concentrated juices were diluted to 16.6% SSC with tap water, for a better prediction of the effects in an industrial context ,and kept at 2 °C till blending with the RCW.
The reagents sodium hydroxide 0.1 N in water, potassium chloride, sodium acetate, potassium bisulfate, sodium carbonate, Folin-Ciocalteu reagent, 1,1-diphenyl-2-picrylhydrazyl radical (DPPH), ethyl alcohol, and hydrochloric acid, were all from Sigma-Aldrich (Milano, Italy); the gallic acid was from Merck KGaA (Darmstadt, Germany). All reagents were of analytical grade.

2.2. Methods

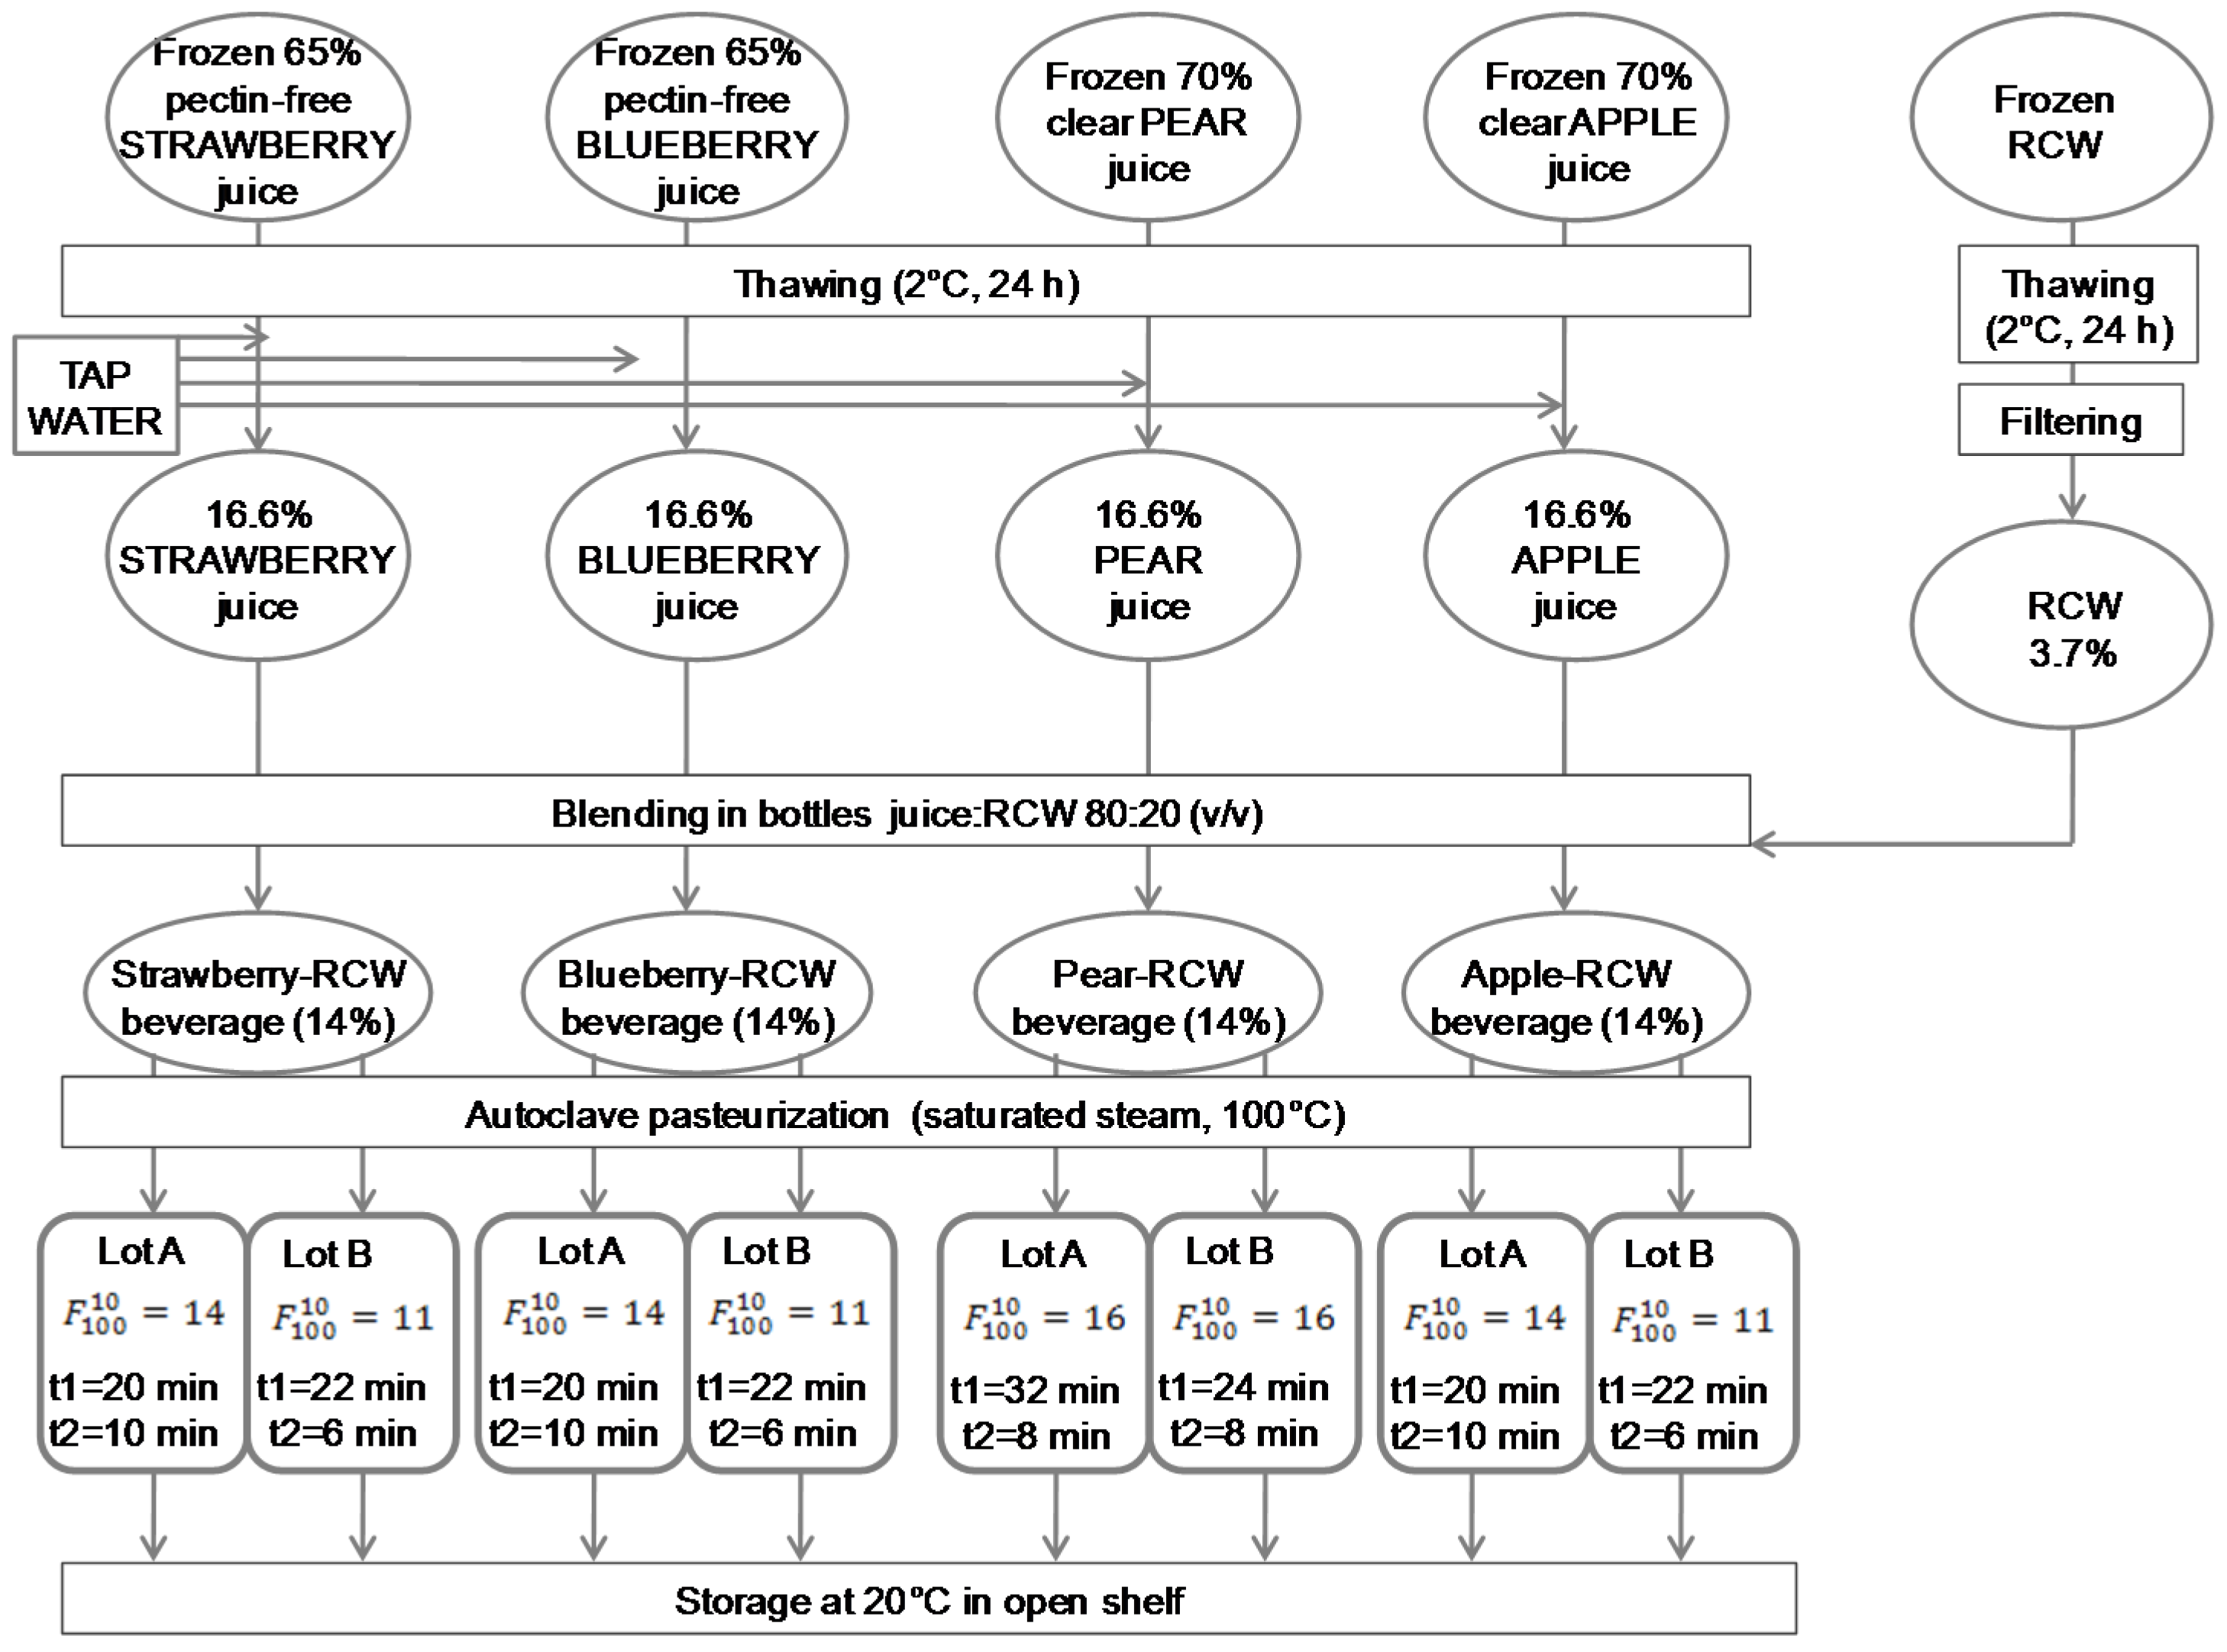
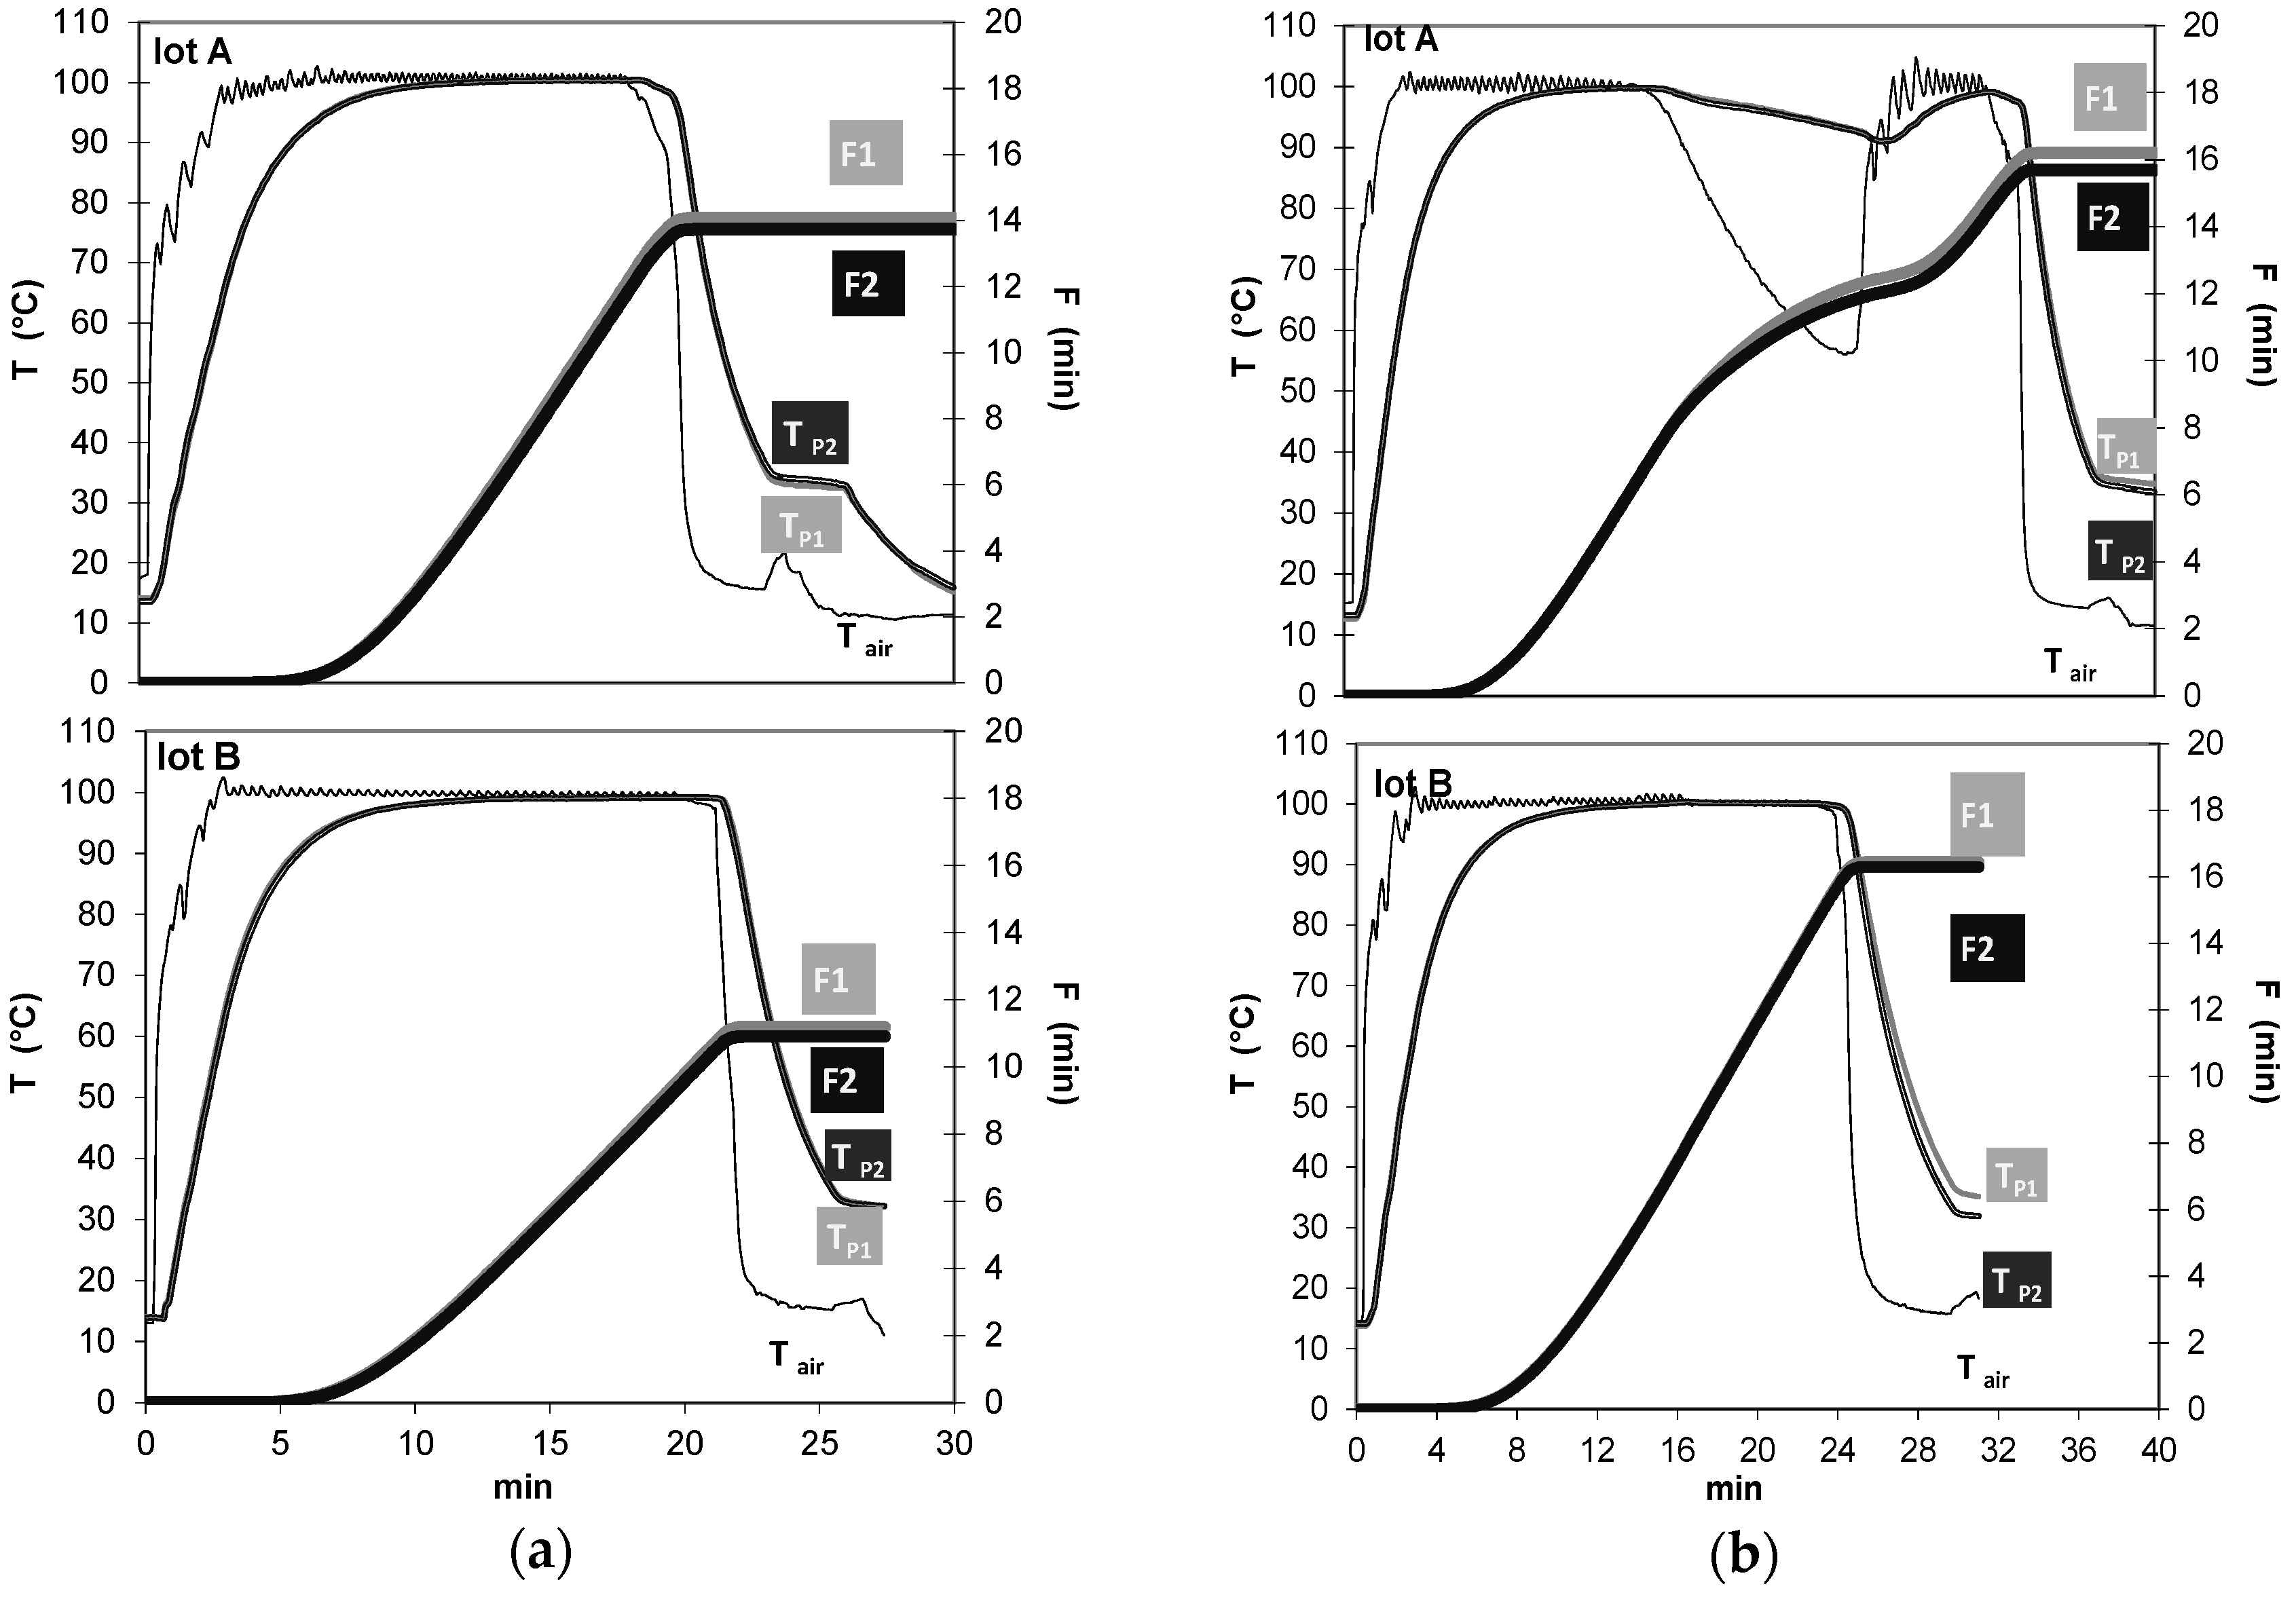
2.2.1. Beverage Preparation

Beverages with SSC, standardized at about 14%, were prepared according to the flow diagram reported in Figure 1, by blending fruit juices and RCW in 80:20 (v/v) ratio in 125 mL uncolored glass bottles, capped with a twist-off lid. Three bottles per juice type were kept at 2 °C till analysis and were used as a control (TQ samples). The remaining bottles were divided into two lots (A and B) and each lot (3 bottles per juice type/lot) was separately pasteurized in an autoclave (Ghizzoni Dante and Figlio, Felino, Parma, Italy), using saturated steam. In order to withstand storage at ambient temperature for a long time, they were pasteurized at 100 °C, a temperature higher than the classical 72–74 °C pasteurization temperatures, which only allow storage at T < 4–6 °C for a short period of time, but lower than the UHT (Ultra High Temperature) sterilization temperature (>135 °C). Pasteurization temperatures were detected in the autoclave and at the core of the bottle by means of flexible thermocouple probes, and monitored with an E-Val 2.10 software system (Figure 2); for strawberry-RCW, apple-RCW, and blueberry-RCW beverages, characterized by pH < 4.2, the F 100 10 value was 14 for pasteurization A and 11 for pasteurization B, while for the pear-RCW beverage, with a pH > 4.2, an F 100 10 = 16 value was adopted for both pasteurizations. In pasteurization A of the pear-RCW beverage, this value was reached after 32 min, due to technical problems, in comparison to the 25 min produced by pasteurization B. After pasteurization, the bottles were kept for 15 days on open shelves at ambient temperature (20 °C), prior to analysis.
TQ (3 bottles) and pasteurized beverages (3 bottles/lot) were analyzed for pH, titratable acidity, soluble solids content, phenolics, anthocyanins, total antioxidant activity, color, color density and polymeric color. Pasteurized beverages (3 bottles/lot) were also analyzed for turbidity. Each bottle was analyzed separately (1 bottle = 1 replicate).

2.2.2. Physicochemical Analysis

The pH values and titratable acidity (three replicates) were determined with a titroprocessor (model 682, Metrohm AG, Switzerland), by titrating 5 g of beverage, plus 100 mL of distilled water, with 0.1 N NaOH to pH = 8.2. The soluble solids content (SSC, three replicates) was measured using an automatic refractometer (RFM81, Bellingham-Stanley Ltd., England). Turbidity measurements (three replicates) were performed in a laboratory nephelometer (Ratio™ Turbidimeter model 18900, HACH, Loveland, CO, USA).

2.2.3. Determination of Total Phenolics and Total Anthocyanin Content

The total phenolic content (TPC) (three replicates) was measured spectrophotometrically by the Folin−Ciocalteau assay [21], and was expressed as gallic acid equivalents (mg GAE/100 mL). The total monomeric anthocyanin pigment (MAP) (three replicates) was estimated spectrophotometrically by the pH-differential method [22], and was expressed as cyanidin 3-glucoside equivalents (mg C3GE/100 mL). The percent of polymeric color was measured using the bisulphite bleaching method [22].

2.2.4. Determination of Antioxidant Activity

The antioxidant activity (AntOx) (three replicates) was measured spectrophotometrically by using the stabilized, artificial-free radical 2,2-diphenyl-1-picrylhydrazyl (DPPH), according to the method described by Lo Scalzo et al. [23], and was expressed as gallic acid equivalents (mg GAE/100 mL).

2.2.5. Color Measurements

Color parameters were measured by means of a Spectrophotometer CM-2600 (Minolta, Japan), equipped with a sample holder for 10 mm-plastic cells suited for liquid analysis, using the primary illuminant D65 [24] and a 2° observer in the L*, a*, b* color space, acquiring the reflectance (R) spectrum from 360 to 740 nm at 10 nm intervals. A specular component included (SCI) mode was selected and a white calibration tile was used as the background. From L*, a*, b* values, chroma (C*), hue () and color index (E*) were computed, according to the following equations [25]:
C* = (a*2 + b*2)−2
h° = arctangent (b*/a*) × 360/(2 × 3.14)
with h° = 90° corresponding to the ‘yellow’ color and h° = 360° to the violet one, and:
E* = (L*2 + a*2 + b*2)−2
The color difference ∆Eab* in the L*a*b* color space was computed according to:
∆Eab* = ((LTQ* − LP*)2 + (aTQ* − aP*)2 + (bTQ* − bP*)2)−2
where subscript TQ refers to the beverages before pasteurization and subscript P to the beverages after pasteurization. Furthermore, the color difference was evaluated by the ΔE2000 equation [26], which matches closer to the color difference perception of the human eye and contains a so-called rotational term for the blue-violet region:
∆E00* = ((∆L’/(kLSL))2 + (∆C’/(kCSC))2 + (∆H’/(kHSH))2 + RT(∆C’/(kCSC))(∆H’/(kHSH)))−2
How the L, C, H values are transformed into the L’, C’, and H’ notation, have been explained in detail by Sharma et al. [27]. This formula has five corrections to CIELab: a weighting function for lightness kLSL; a weighting function for chroma kCSC; a weighting function for hue kHSH; an interactive term between the chroma and hue differences, for improving the performance of the blue color; and a factor RT for rescaling the CIELab a*-axis, for improving the performance of the grey colors.
∆E00* values have been computed using the Color Difference Calculator v.3.0 [28], considering L*, a*, b* data before pasteurization as a reference, and L*, a*, b* data after pasteurization as a sample.

2.2.6. Statistical Analysis

The Statgraphics v.5.2 (Manugistic Inc., Rockville, MD, USA) software package was used. Three bottles of TQ beverages and three bottles/lot of pasteurized beverages were individually analyzed (one bottle=one replicate); each bottle was evaluated in duplicate and averaged prior to statistical analysis. Data were submitted for the multifactor analysis of variance (ANOVA). This was completed separately for ‘yellow’ type (apple and pear) and ‘red’ type (blueberry and strawberry) beverage data sets, considering the type of juice used in beverage preparation, the pasteurization lot, and their interaction as sources of variation. To calculate the statistical significance of the difference between means, compared two by two, the Student’s t test was used.

3. Results and Discussion

3.1. Multifactor Analysis of Variance

Table 1 reports the results of the multifactor analysis of variance for the ‘yellow’ type (apple and pear) and the‘red’ type (blueberry and strawberry) beverage data sets.
Generally, the J main factor (type of juice used in the preparation of fruit-RCW beverages) had a very significant effect (99.9%) on the physicochemical and color parameters, and on the antioxidant composition of both types of beverages, except for the SSC in the ‘yellow’ type (not significant effect) and the AntOx in the ‘red’ type (95%). The H main factor (heat treatment) had a very significant effect (99.9%) on: all color parameters in the ‘yellow’ type and on E* in the ‘red’ one, on pH and NTU in both types, and on SSC in the ‘red’ type, while the H factor had a lower influence on the TA and SSC in the ‘yellow’ type and on the L*, h° and C* in the ‘red’ beverages, and had no significant effect on the TA in the ‘red’ type. Regarding antioxidants, the TPC and MAP in ‘red’ beverages and the AntOx in ‘yellow’ ones, were strongly influenced by H, which, on the other hand, had no significant effect on the TPC in ‘yellow’ beverages and the AntOx and PC in ‘red’ ones. Apart from the TA and SSC in the ‘yellow’ beverages, and the TA and C* in the ‘red’ ones, there was a significant effect of the interaction J × H.
The effect of the main factors J and H, and of their interaction J × H, on the changes occurring with heat treatment, on the antioxidants and color, was also investigated by separately performing multifactor ANOVA for the ‘yellow’ and ‘red’ type beverage data sets (Table 2). Regarding the ‘yellow’ beverages, the factor J had a very strong influence on the changes in TPC, and the L*, h° and C* color parameters, and a slighter lower infleunce on the ∆Eab* and ∆E00* color differences, but it did not affect changes in the AntOx; the factor H had a very significant effect on the AntOx, L*, h°, and ∆Eab* and ∆E00* color differences, but it had no significant effect on TPC and C* variations. Moreover, there was a significant effect of the interaction J×H on the changes in antioxidants and color, even if with different significance levels. A different scenario was observed for the ‘red’ beverages (Table 2): notwithstanding the factor J had a very strong influence on the changes in antioxidants and color, apart from ∆PC (non significant effect), the factor H had a strong influence (99%) on the ∆C*, ∆Eab* and ∆E00* color differences, but either a low (95%) or insignificant effect on antioxidants, and the ∆L* and ∆h° color parameters. The interaction J × H had no significant effect on the ∆PC, ∆C*, ∆Eab* and ∆E00* color differences, and a significant effect on ∆TPC, ∆AntOx, ∆MAP, ∆L*, and ∆h°, even if with different significance levels.

3.2. Physicochemical Analysis

Table 3 shows the results obtained in the physicochemical analysis of the four beverages after the two pasteurizations. On average, the SSC was 14.28% ± 0.04% (standard error) and the percentage variations in the SSC data, due to the individual blending of the fruit juice and RCW in each bottle, was lower than the 5% tolerance level usually used in control charts to establish whether a product conforms to the standards of production [29]. Hence, the differences between the two lots indicated that the titratable acidity, SSC, and pH, could be reasonably ascribed to lot preparation, rather than to an influence of the pasteurization conditions.
In contrast to what was reported for whey-based fruit juice beverages, after thermal treatments, no formation of precipitate was observed at the bottom of the bottles, whatever the formulation, even if some turbidity, ranging from about 25 NTU (pear-RCW beverage) to about 190 NTU (blueberry-RCW beverage), was found. The values of turbidity found in this research are 10–80 times lower than the range of turbidity reported by Baccouche et al. [30] for whey-based prickly pear beverages, suggesting that replacing whey with RCW in fruit-based functional beverages could maintain drink clarity at a pH near to the isoelectric point of proteins, which is about 4.6 [20], as found in this research for the pear-based beverage. The very low turbidity values found in this research could be due to both the low number of total proteins in the filtered RCW used to prepare drinks (4 g/L) [31], and to its composition, i.e., ≈46% non-protein-nitrogen (urea, ammonia, creatina, creatinine, uric acid, orotic acids, and very low molecular weight components), ≈24% caseinomacropeptide, and ≈38% peptides [31].
The type of fruit juice used for the preparation of the fruit-RCW beverage had a significant influence on the turbidity, pH, and titratable acidity (Table 3). On average, the turbidity values ranged from 24.5 NTU (pear) to 37.5 (apple), 85 (strawberry), and 189.3 NTU (blueberry). These differences among fruit juices could be dependent on the different antioxidant pigment compositions, mainly on the presence of anthocyanins, which, at high concentrations, might interfere with the turbidity measurement [32]. The titratable acidity ranged from 18.9 meq/100 mL for the blueberry-based drink, to 15.8 (strawberry), 6.7 (apple), and 3.4 meq/100 mL (pear), and the pH ranged from 3.38 (blueberry), to 3.61 (strawberry), 3.79 (apple), and 4.39 (pear).

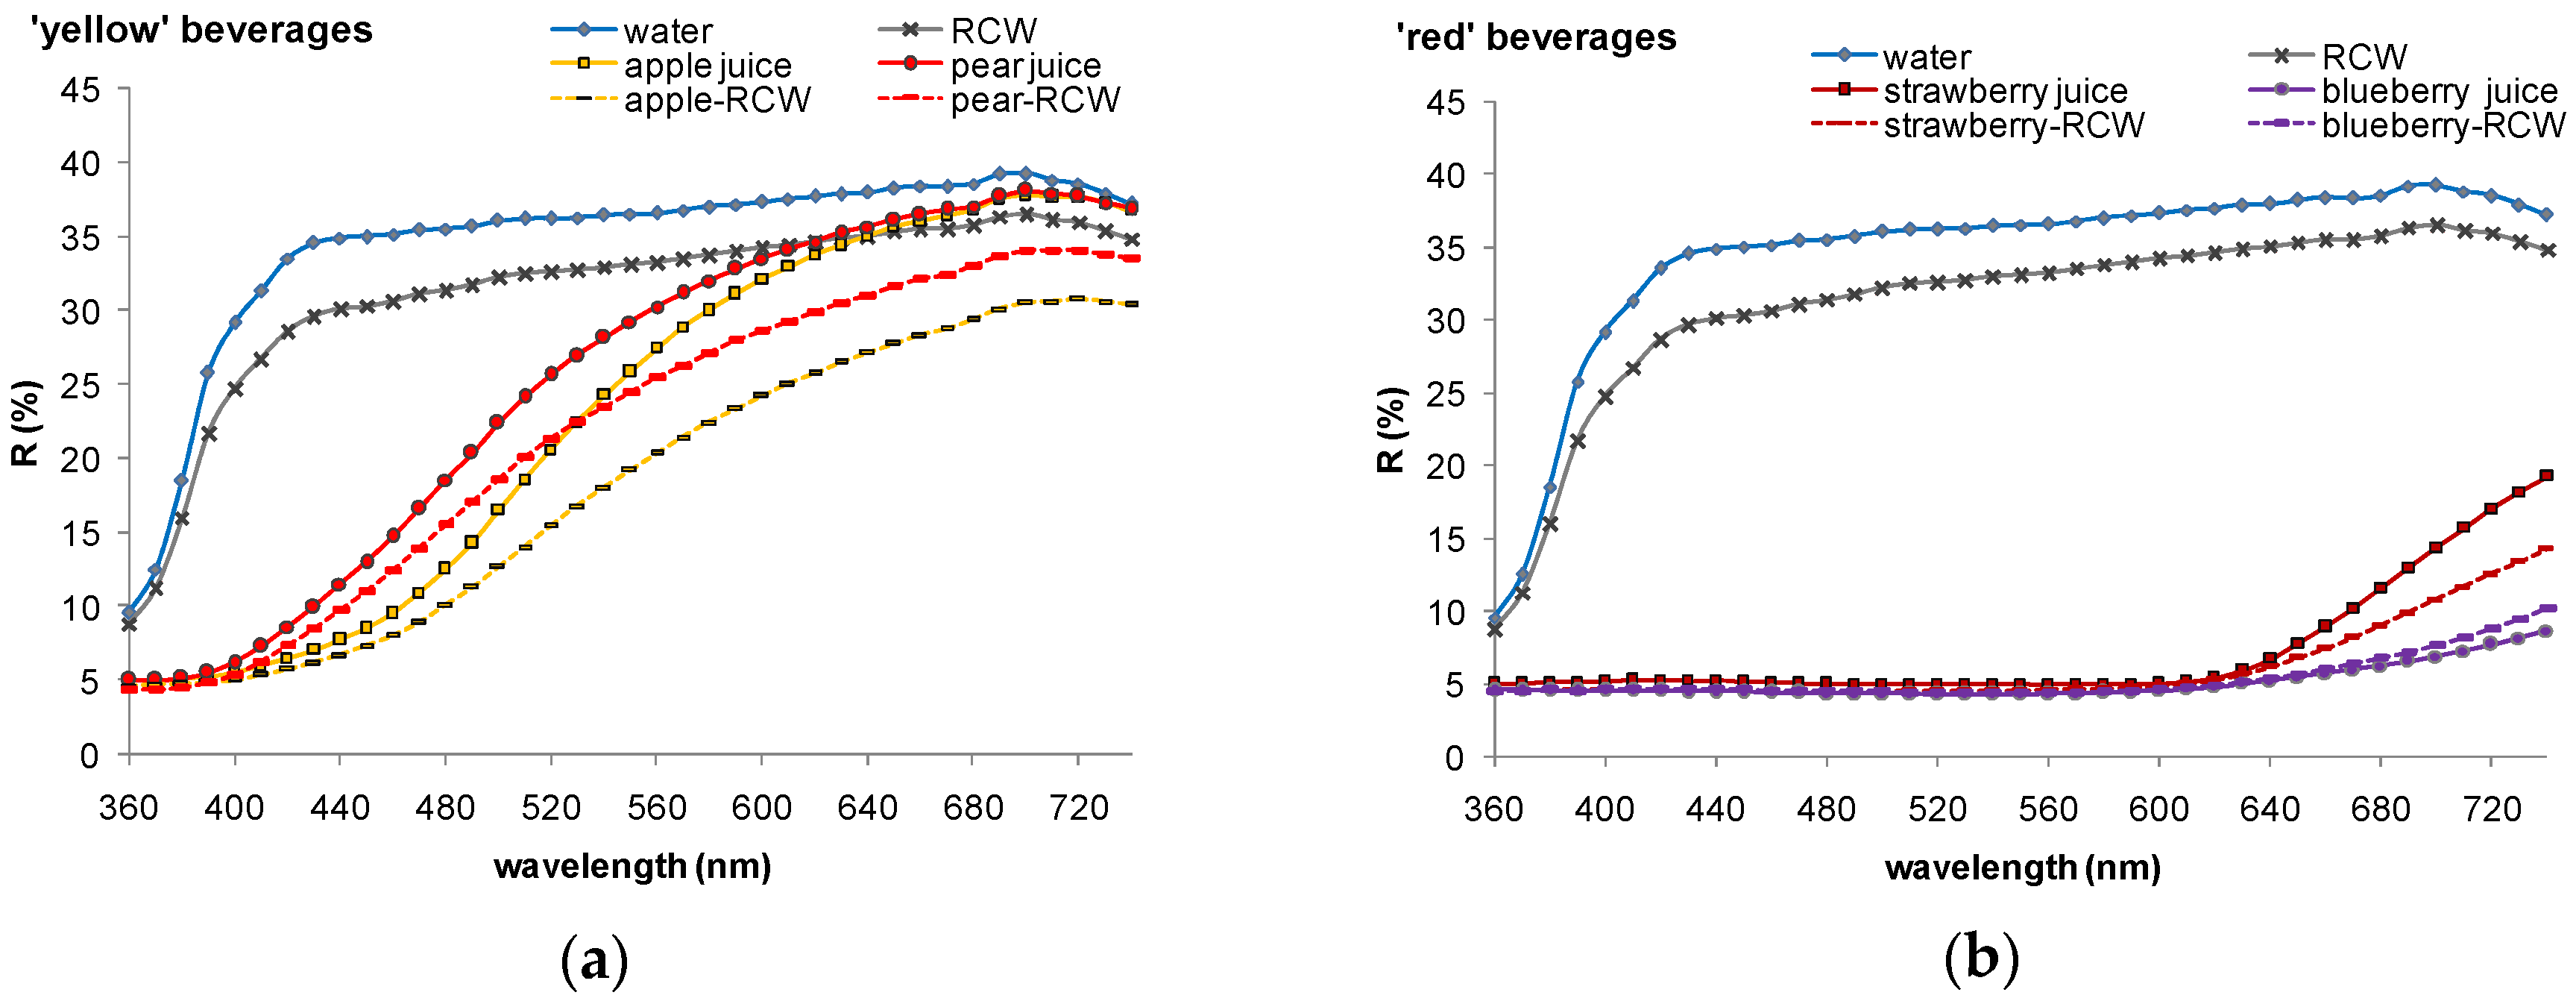
3.3. Influence of Blending with RCW on Fruit Juice Color

Table 4 shows the color values of concentrated juices diluted to 14% soluble solid content, the standardized SSC value used in all of the fruit-RCW beverages, in comparison with those of fruit-RCW beverages before pasteurization.
The blending of juice with RCW caused a darkening of color in apple-, pear-, and strawberry- based blends, due to significant decreases in L*, h°, C* and E* for both ‘yellow’ drinks, and to significant decreases in L* and E* for the strawberry beverage. In contrast, for the blueberry-based blend, the L*, C* and E* values of the RCW-blend were higher than those of 14% SSC juice, indicating that some color brightening occurred upon blending with RCW. Upon blending, the color of the apple- and pear-based blends shifted from yellow to yellow-orange, and concomitantly became less intense, as indicated by the decrease in the and C* values. Both in blueberry- and strawberry-based blends, the color was more intense than that of juice alone (higher C* values), but the color shifted from violet red toward violet in the blueberry blend, and from violet-red toward deep red in the strawberry one. Considering the reflectance spectra (Figure 3), pear juice showed lower values of R in the 400–550 nm range than apple juice, but similar R values of apple juice in the 630–740 nm range.
The blending with RCW induced a significant reduction of R in the 400–740 nm range in both ‘yellow’ juices, with a higher impact seen for the apple juice. Strawberry and blueberry juices were characterized by very low R values (about 5%), in the 360–600 nm range; in the 630–740 nm range, the strawberry juice had lower R values than the blueberry juice and, similarly to what was observed for ‘yellow’ juices, blending the strawberry juice with RCW caused a significant reduction of R values, in the 630–740 nm range. The blueberry juice was characterized by the lowest values of R for the whole reflectance spectrum, reaching the highest value of about 8.5% at 740 nm, and upon blending with RCW, there was only a slight increase in the R values, in the 680–740 nm range.

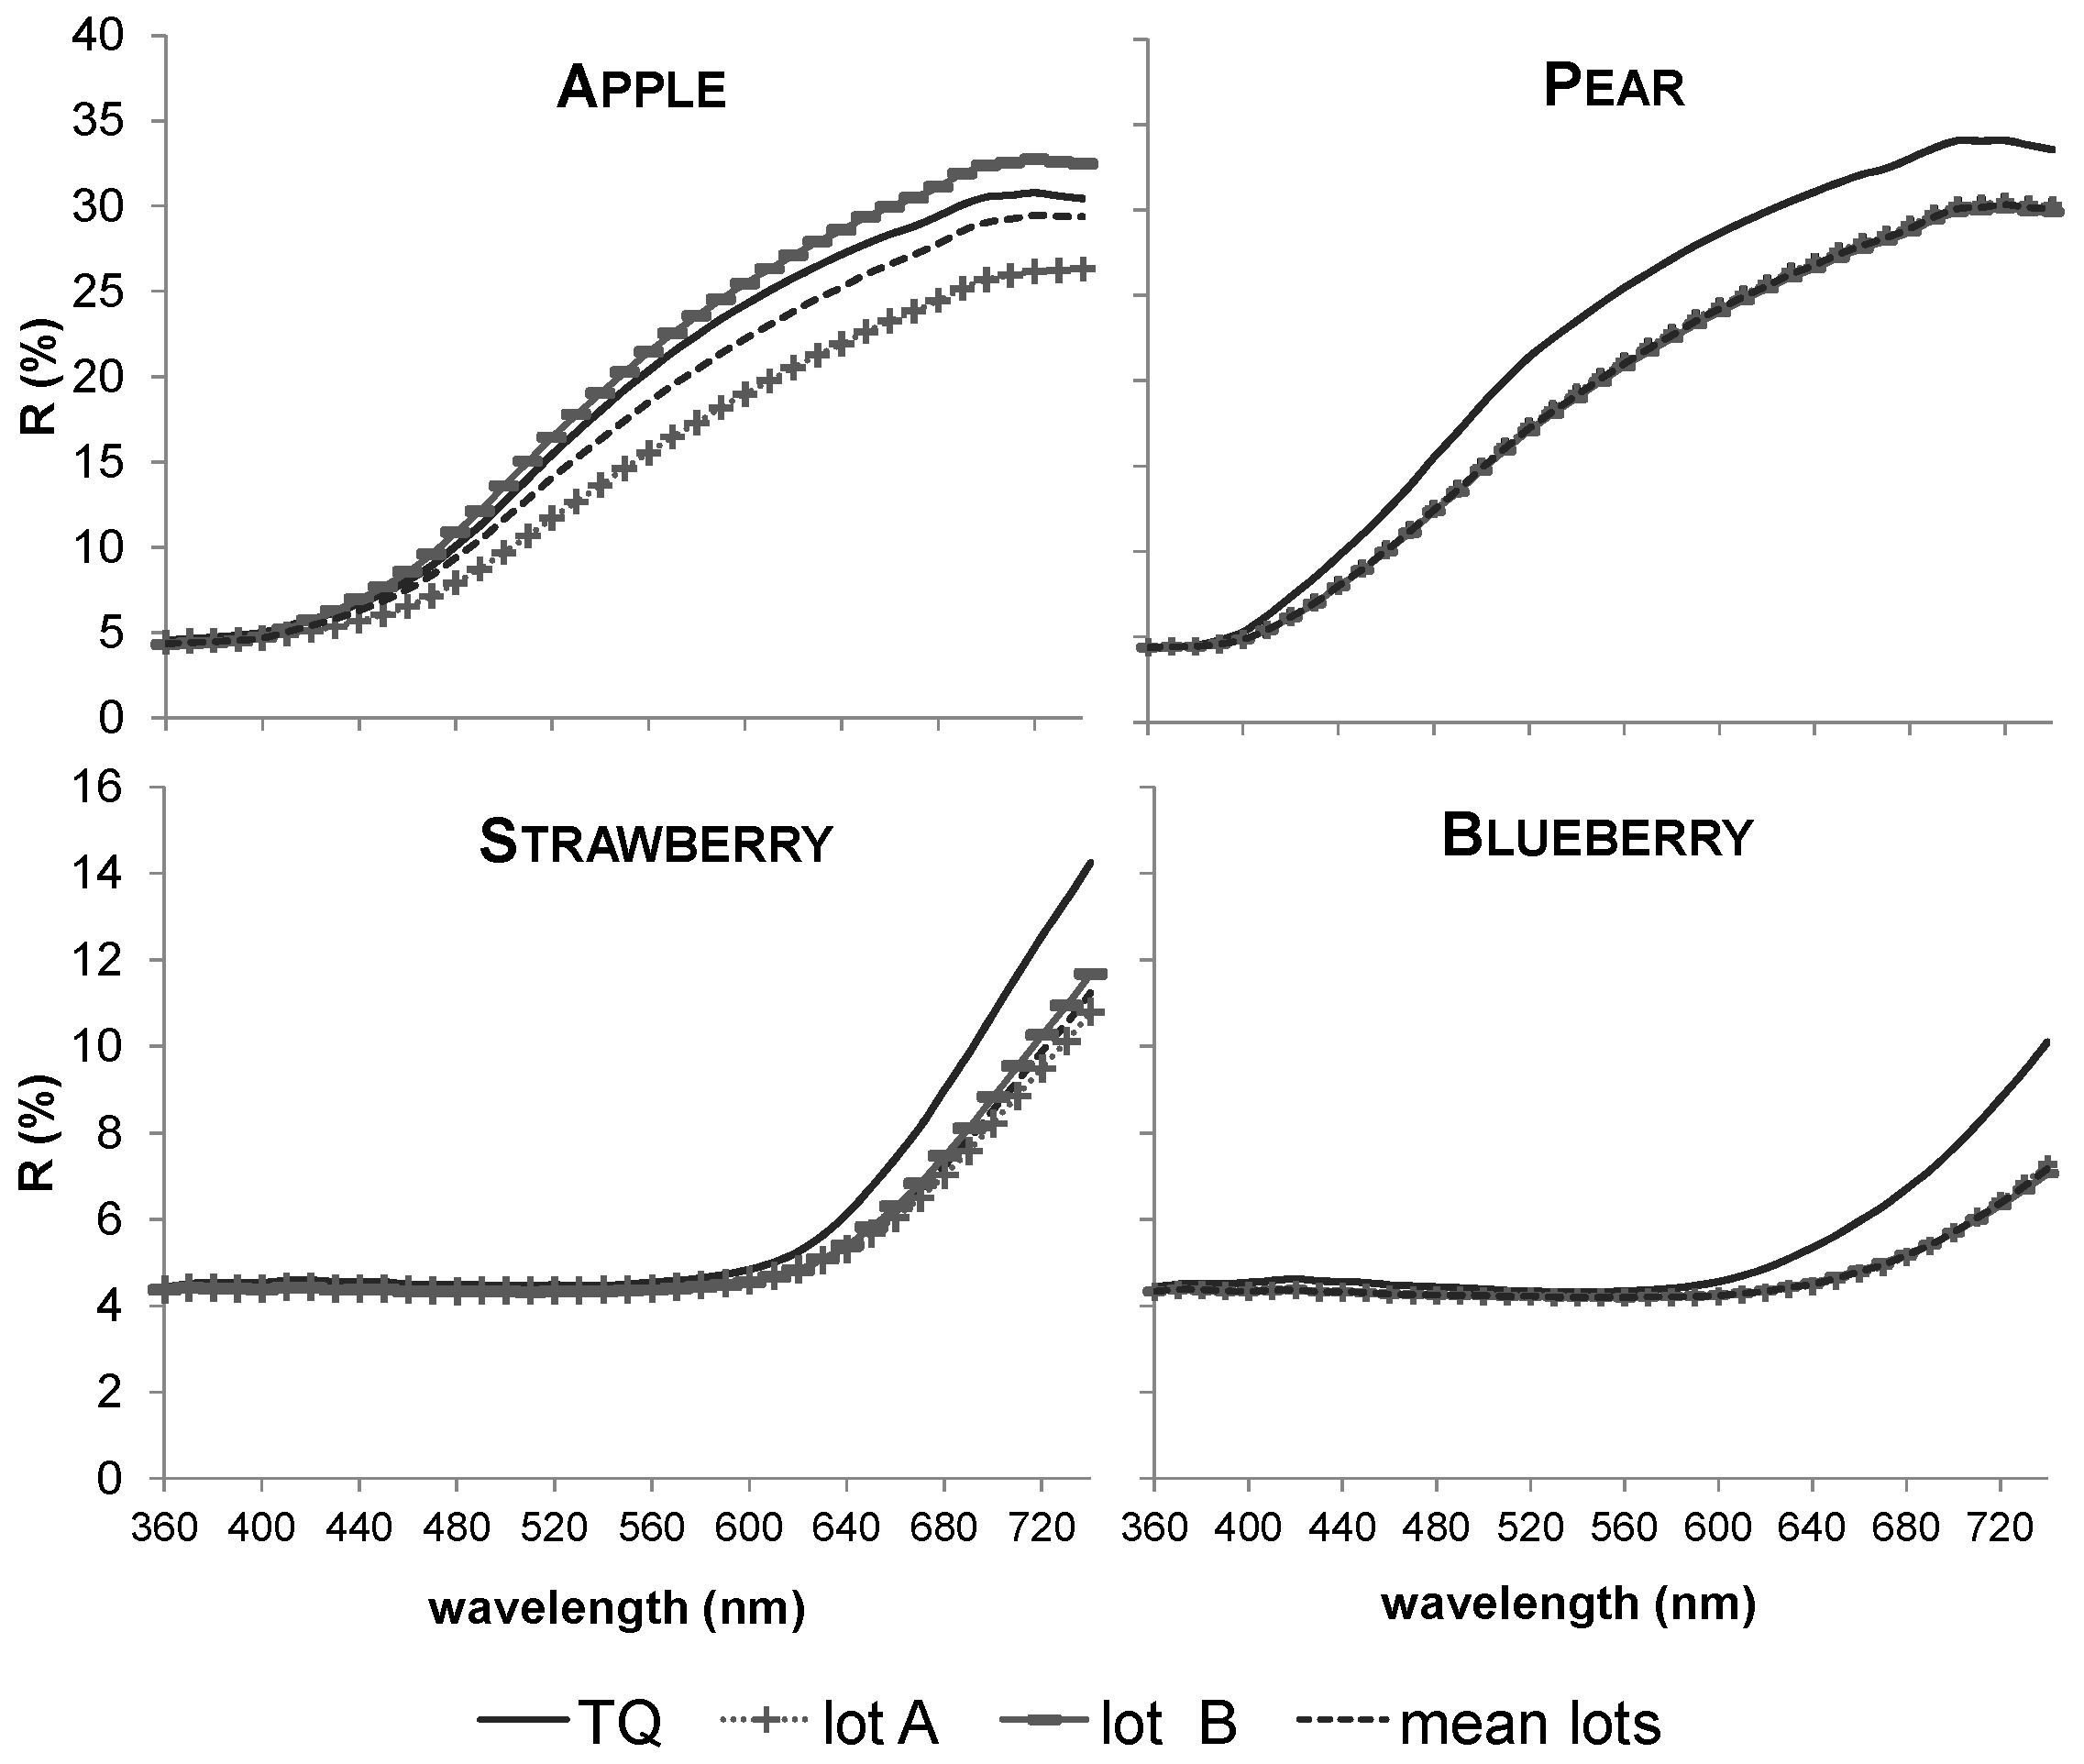
3.4. Influence of Pasteurization on Fruit-RCW BeveragesColor

The different pasteurization conditions used for lots A and B exerted a significant effect on the color changes of fruit-RCW beverages (Table 5). The decrease of the F 100 10 value from 14 to 11 for fruit-RCW beverages having pH < 4.2, had a greater impact on the apple-based beverage than on ‘red’ fruit-RCW beverages. In fact, when F 100 10 = 14 was adopted in the apple-RCW beverage, L*, C*, and decreased, indicating that in lot A, the apple-RCW beverage color became darker, less intense, and shifted toward earth-yellow.
The reflectance spectrum was also influenced (Figure 4); a decrease in the R values in the 560–740 nm range was observed. On the other hand, when F 100 10 = 11 was used, the scenario of color variations upon the pasteurization of the apple-RCW beverage dramatically changed: L*, C*, and h° increased, indicating that in lot B, the apple-RCW beverage color was lighter, became yellower (Table 5), and had higher R values, mainly in the 680–720 nm range (Figure 4), than the TQ apple-RCW beverage. These results are in agreement with Ibarz et al.’s [33] findings on apple puree heating, showing that lower heating temperatures and time corresponded to higher values of L*, as well as higher R values.
Similarly to what found for lot A of the apple-RCW beverage, in the pear-based formulation, L*, C*, and h° decreased with pasteurization, indicating that the color was darker and less intense than that of the TQ beverage, as well as that it shifted toward earth-yellow (Table 5). This is similar to Ibarz et al.’s [34] findings on kinetic models of color changes for pear puree, which indicate a decrease of lightness with both the increase of heating temperature and the treatment time, as well as a loss of the sample’s yellow hues, which shifted into reddish hues. The fact that changes in L* and h° were higher in lot B could be due to the technical problems which occurred during lot A pasteurization (Figure 2), causing a decrease in the temperature at the core of the product, from 100 °C to 90 °C at the 16–24 min pasteurization time, leading to an actual F 100 10 value lower than the theoretical one of 16, which had a lower impact on the color characteristic of the drink. Notwithstanding these differences, the reflectance spectra of the two lots were identical and both showed, when compared to the TQ drink, a decrease in the R values, in the 560–740 nm range. Ibarz et al. [33,34] found a decrease in the reflectance values of apple and pear purees as the heating time increased, mainly in the 520–600 nm range, corresponding to green and orange hues, suggesting that the decrease in R values indicated that upon heating there was a more pronounced degradation of greenish and yellow pigments of apple and pear purees.
In contrast, in ‘red’ fruit-RCW beverages, the different pasteurization conditions used for lots A and B did not influence the trends of changes in the color parameters, i.e., a decrease of L*, C*, and h° values for the blueberry-RCW beverage and a decrease in L* and C*, and an increase of h° values for the strawberry-RCW beverage (Table 5). Similar trends of color parameters as a consequence of thermal treatments were reported by Ngo et al. [35] for pasteurized canned strawberries, and by Lee et al. [36] for pasteurized and concentrated blueberry juices. However, in the blueberry-RCW beverage, the decreases in C* and h° were higher in lot A, when a higher F 100 10 value was used, than in lot B, while in the strawberry-RCW beverage, the decrease in L* was higher in lot B and the decrease of C* was higher in lot A. The changes in color parameters indicated that the color of the pasteurized ‘red’ fruit-RCW beverages was darker and less intense than that of the TQ ‘red’ beverages, as well as that it shifted further toward violet in the blueberry-RCW beverage and toward earth red in the strawberry-RCW beverage. The different pasteurization conditions used for lots A and B did not influence the magnitude of the decrease in R values in the 640–740 nm range of the color spectra (Figure 4); in fact, for both types of ‘red’ fruit-RCW beverage, pasteurization caused a decrease in the R values, which varied from about 0.8% at 640 nm, to about 2% at 740 nm (Figure 4).
The total color differences ΔEab* and ΔE00* (Table 5) give an indication of whether the differences in the color parameters occurring upon pasteurization of the fruit-RCW-beverages were noticeable, and depending on the ΔE value, the color differences can be estimated, such as not noticeable (0–0.5), slightly noticeable (0.5–1.5), noticeable (1.5–3.0), well visible (3.0–6.0), and great (6.0–12.0) [37]. As for the apple-RCW beverage, the values of ΔEab* and ΔE00* indicate that there was a strong difference between the TQ and lot A pasteurized beverage, but a slightly noticeable difference for the lot B pasteurized beverage. On the other hand, in ‘red’ fruit-RCW beverages, even if ΔEab* and ΔE00* values of the lot A pasteurized beverages were significantly higher than those of the lot B pasteurized beverages, for both lots, ΔEab* and ΔE00* values indicate that there was only a slightly noticeable color difference between the TQ and pasteurized strawberry-RCW beverage, and a noticeable one for the blueberry-RCW beverage. For both lots of the pear-RCW beverage, the ΔEab* and ΔE00* values indicate that there was a well visible color difference between the TQ and pasteurized beverage, which was significantly higher for lot B, if ΔEab* is considered.
The color of the four types of fruit-RCW beverages from lot B pasteurizations was scored from 1 (highly unpleasant) to 9 (highly pleasant), with hedonic scale tests [38], and it was found that blueberry-RCW and apple-RCW beverages had significantly higher scores than strawberry-RCW and pear-RCW beverages ones, with medians of: 7.0, 6.5, 5.0, and 5.0, and average ranks of: 28.7, 25.1, 11.9, and 16.2, for the blueberry, apple, strawberry, and pear-RCW beverages, respectively. Hence, considering both the instrumental color changes with pasteurization and the results on color pleasantness of pasteurized beverages, as previously described by our research group [38], it would be better to use apple juice for the ‘yellow’ type and blueberry juice for the ‘red’ one, as an ingredient in the fruit-RCW beverages.

3.5. Influence of Fruit Juice Type on Total Phenolics, Total Anthocyanin Content and Antioxidant Activity

As expected, the antioxidant composition and antioxidant activity of fruit-RCW beverages greatly depended on the type of fruit juice used for the preparation, both for the two ‘yellow’ beverages (apple and pear) and the two ‘red’ ones (blueberry and strawberry), with the former having main antioxidant compounds of phenolics, and the latter having anthocyanins and phenolics. As for the ‘yellow’ beverages, the apple-RCW showed a higher total phenolic content and higher antioxidant activity than the pear-RCW beverage, whereas the blueberry-RCW beverage had a higher TPC, MAP, and AntOx, and a lower percent of polymeric color than the strawberry-RCW one (Table 6).

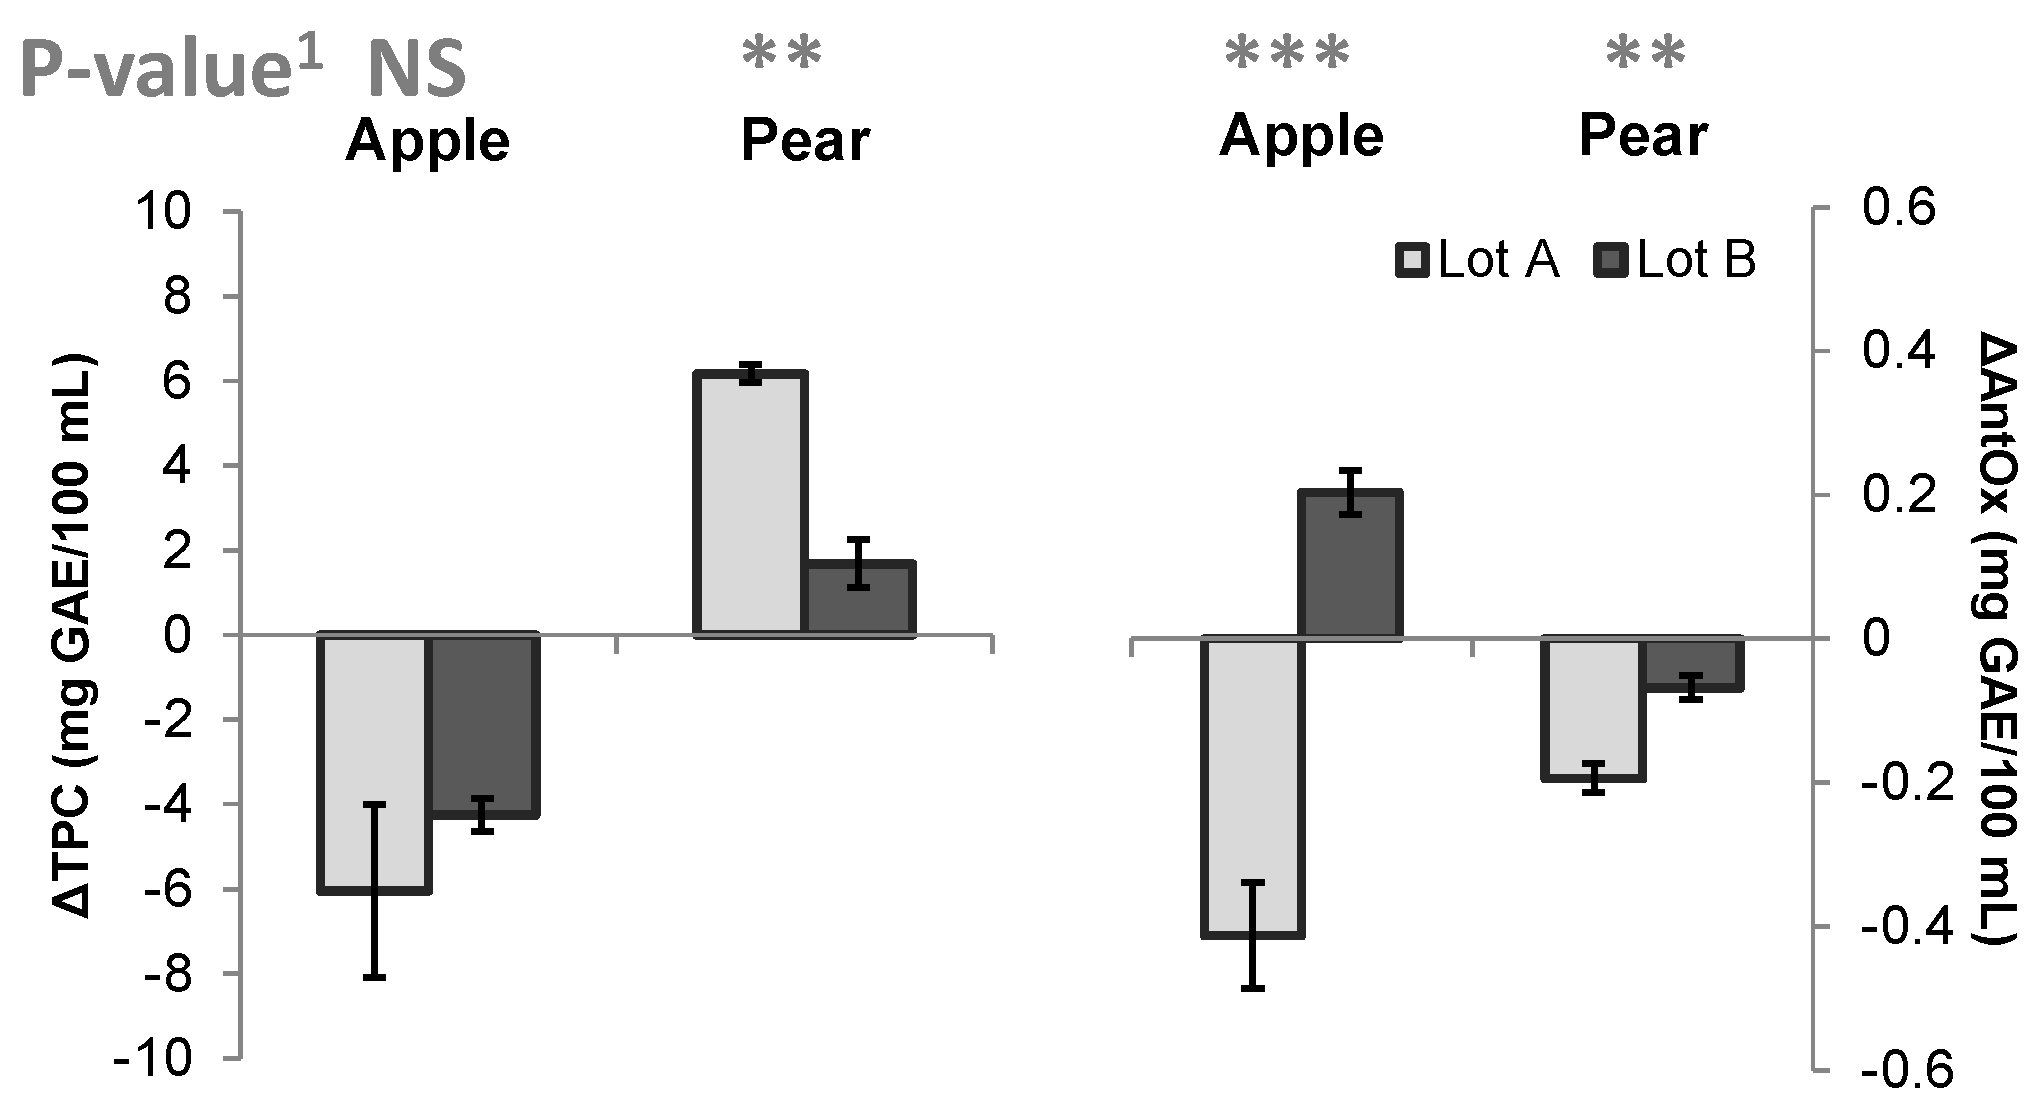
3.6. Influence of Pasteurization on Total Phenolics, Total Anthocyanin Content, and Antioxidant Activity

Many studies have shown that thermal pasteurization can cause phenolic compounds to degrade in most fruit juice [39]. Noci et al. [40] observed greater phenolic degradation in apple juice pasteurized at 94 °C, compared to that pasteurized at 72 °C. Also, the pasteurization time was shown to be an important factor that influences phenolic degradation in fruit juice. Odrizola-Serrano et al. [41] found that applying 90 °C heat to strawberry juice for 1 min led to a higher degradation of total phenolics than holding it for 30 s. Similarly, our results indicate that the higher F 100 10 value used for the lot A pasteurization induced a higher decrease in the TPC of apple-RCW (≈12.3%) and blueberry-RCW beverages, but a lower TPC decrease in the strawberry-RCW beverage (Figure 5, Table 7), with respect to variations occurring with the lower F 100 10 value used for lot B pasteurization. In contrast to apple-, blueberry- and strawberry-RCW beverages, in the pear-RCW beverage, the thermal treatment induced an increase in the total phenolic content, of approximately 18% in lot A and of about 5% in lot B (Figure 5), which was an unexpected result. The composition of the phenolic fraction was not analyzed in this experiment; however, it can be hypothesized that the increase in TPC content may be due to the additional thermal treatment after blending with RCW, which could have induced thermal degradation of the cinnamics and procyanidins contained in pear juice, with an increase in the number of hydroxyl groups which react with the Folin reagent.
Concomitantly to the higher TPC decrease, in lot A of the blueberry-RCW beverage, there was a greater decrease in the MAP content, and a smaller increase in the percent of polymeric color, than in the lot B samples (Table 7). Similarly to our results on the MAP content, studies on anthocyanin thermal degradation in blueberry juices have highlighted that the reaction follows a first-order kinetics process, and that the kinetic rate constant k value increases with temperature, i.e. that a greater degradation occurs at higher processing temperatures [42,43,44]. Since one of the most important reactions occurring during anthocyanin thermal degradation is polymerization, Martynenko and Chen [44] suggested the use of PC as a good indicator for anthocyanin degradation, as they found a strong negative exponential relationship between anthocyanin content and PC. Polymerization mostly occurs by binding monomeric anthocyanins with other phenolic compounds, such as phenolic acid and condensed tannins [45], and the kinetics of percent polymeric color formation during the HTD processing of blueberries was found to follow a zero-order reaction, with the k values of polymeric color formation increasing with temperature [44].
The strawberry-RCW beverage before pasteurization showed a high value of percent polymeric color (Table 6), as well as a low MAP, indicating that the anthocyanins had already undergone some degradation at the factory, during the production of the 65% pectin-free strawberry juice used for the preparation of the strawberry-RCW beverage. Upon pasteurization, there were a decrease in the MAP and an increase in percent polymeric color, without any significant difference between the two lots.
The changes in antioxidant activity with pasteurization mainly differed according to the type of fruit juice used in the preparation of the drink, and, to a lesser extent, with pasteurization conditions. As for ‘yellow’ beverages, the antioxidant activity decreased in both lots of pear-RCW beverage (more in lot A (≈10%) than in lot B (≈3%)), and in lot A (≈13.4%) of the apple-RCW beverage, which was opposite to the increase (≈6.6%) observed for lot B (Figure 5). Considering the ‘red’ beverages, the antioxidant activity decreased in both lots of the blueberry-RCW beverage, although more in lot B than in lot A, and increased in both lots of the strawberry-RCW beverage, without any significant difference between the two lots (Table 7). The trends of antioxidant activity with pasteurization found for both lots of pear- and strawberry-RCW beverages, and lot A of the apple-RCW beverage, seem to be inconsistent with the trends found for antioxidant compounds (TPC, MAP), as well as the lower decrease in antioxidant activity of lot A of the blueberry-RCW beverage, coupled with a higher decrease in the TPC and MAP, if compared to the lot B sample. Similarly, for blueberry juices, Brownmiller et al. [46] described the effects as being due to pasteurization minor losses in MAP (8% nonclarified and 5% clarified juice), and increases in antioxidant capacity (7% nonclarified and 1% clarified juice), suggesting that the increase in antioxidant capacity may be due to the formation of Maillard reaction products in response to thermal treatment, which exert antioxidant activity [47] or the formation of anthocyanin polymers, whose antioxidant capacity likely compensates for the loss of antioxidant capacity as a result of monomeric anthocyanin degradation.

4. Conclusions

Our results showed that it is feasible to obtain novel functional beverages which do not require a cold chain, using only two ingredients: fruit juice and RCW. Replacing whey with RCW in the formulation of fruit-based beverages succeeded in preventing the formation of precipitate at the bottom of the bottles with pasteurization, even if some turbidity in the 25-190 NTU was observed.
All the steps of beverage preparation had an influence on color: the blending of juices with RCW caused a darkening of color in apple, pear, and strawberry blends, but a brightening of blueberry ones. The different time/temperature conditions used for pasteurization had a greater impact on color changes of ‘yellow’ fruit-RCW beverages than on the ‘red’ fruit-RCW ones, the former having ΔEab* and ΔE00* values indicating a strong color difference (apple-RCW beverage pasteurized at F 100 10 = 14 ), or well visible color difference (pear-RCW beverage from both lots).
With F 100 10 = 14 pasteurization, a higher decrease in TPC in blueberry-, strawberry- and apple-RCW beverages, and a higher decrease in MAP and a lower increase in percent polymeric color in the blueberry-RCW beverage, were observed. Results on antioxidant activity suggested that the Maillard reaction products formed in response to thermal treatment and/or the formation of anthocyanin polymers, likely compensates for the loss of antioxidant activity due to TPC and MAP degradations.
Considering the interplay between the type of fruit juice and the pasteurization conditions, it could be concluded that higher quality fruit-RCW beverages may be obtained by using apple juice for the ‘yellow’ type and blueberry juice for the ‘red’ one, and adopting the lower F 100 10 value for the pasteurization.

Acknowledgments

This research was carried out within the “Twinning Italy-Canada activities in Research and Innovation in the Agro-Food Area—CANADAIR” project funded by the Italian Ministry of Agriculture (Ministry Decree 27240/7303/2011). The Authors would like to thank Nicola Luccini for the contribution to preparation and analyses of fruit-RCW beverages.

Author Contributions

A.R. and G.C. conceived and designed the experiment; G.C. did all the experimental work; A.R. and G.C. analyzed the data; A.R. wrote the manuscript.

Conflicts of Interest

The authors declare no conflict of interest.

Abbreviations

The following abbreviations are used in this manuscript:
RCW
Ricotta-cheese whey
SSC
Soluble solid content
TPC
Total phenolic content
MAP
Monomeric anthocyanin pigment
AntOx
Antioxidant activity
PC
Percent polymeric color

References

  1. Hözer, B.; Kirmaci, H.A. Functional milks and dairy beverages. Int. J. Dairy Technol. 2010, 63, 1–15. [Google Scholar]
  2. Shaafsma, G. Lactose and lactose derivatives as bioactive ingredients in human nutrition. Int. Dairy J. 2008, 18, 458–465. [Google Scholar] [CrossRef]
  3. Manso, M.A.; López-Fandiño, R. κ-Casein macropeptides from cheese whey: physicochemical, biological, nutritional and technological features for possible uses. Food Rev. Int. 2004, 20, 329–355. [Google Scholar] [CrossRef]
  4. Ko, S.; Kwak, H.-S. Bioactive components in whey products. In Bioactive Components in Milk and Dairy Products; Park, Y.W., Ed.; Wiley-Blackwell: Ames, IA, USA, 2009; pp. 263–284. [Google Scholar]
  5. Brambilla, A.; Lo Scalzo, R.; Bertolo, G.; Torreggiani, D. Steam-blanched highbush blueberry (Vaccinium corymbosum L.) juice: Phenolic profile and antioxidant capacity in relation to cultivar selection. J. Agric. Food Chem. 2008, 56, 2643–2648. [Google Scholar] [CrossRef] [PubMed]
  6. Zafra-Stone, S.; Yasmin, T.; Bagchi, M.; Chatterjee, A.; Vinson, J.A.; Bagchi, D. Berry anthocyanins as novel antioxidants in human health and disease prevention. Mol. Nutr. Food Res. 2007, 51, 675–683. [Google Scholar] [CrossRef] [PubMed]
  7. Navindra, P.S. Recent trends and advances in berry health benefits research. J. Agric. Food Chem. 2010, 58, 3869–3870. [Google Scholar]
  8. Ferreira Wessel, D.; Coelho, E.; Coimbra, A.M. Pear Juice. In Handbook of Functional Beverages and Human Health; Shahidi, F., Alasavar, C., Eds.; CRC Press Taylor & Francis Group: Boca Raton, FL, USA, 2016; pp. 475–488. [Google Scholar]
  9. Hyson, D.H. A comprehensive review of apples and apple components and their relationship to human health. Adv. Nutr. 2011, 2, 408–420. [Google Scholar] [CrossRef] [PubMed]
  10. Djurić, M.; Carić, M.; Milanović, S.; Tekić, M.; Panić, M. Development of whey-based beverages. Eur. Food Res. Technol. 2004, 219, 321–328. [Google Scholar] [CrossRef]
  11. Castro, W.F.; Cruz, A.G.; Bisinotto, M.S.; Guerriero, L.M.R.; Faria, J.A.F.; Bolini, H.M.A.; Cunha, R.L.; Deliza, R. Development of probiotic dairy beverages: Rheological properties and application of mathematical models in sensory evaluation. J. Dairy Sci. 2012, 96, 16–25. [Google Scholar] [CrossRef] [PubMed]
  12. Sakhale, B.K.; Pawar, V.N.; Ranveer, R.C. Studies on the development and storage of whey based RTS beverage from mango cv. Kesar. J. Food Process. Technol. 2012, 3, 148. [Google Scholar]
  13. Goudarzi, M.; Madadlou, A.; Mousavi, M.E.; Emam-Djomeh, Z. Formulation of apple juice beverages containing whey protein isolate or whey protein hydrolysate based on sensory and physicochemical analysis. Int. J. Dairy Technol. 2015, 68, 70–78. [Google Scholar] [CrossRef]
  14. Panesar, P.S.; Kennedy, J.F. Biotechnological approaches for the value addition of whey. Crit. Rev. Biotechnol. 2012, 32, 327–348. [Google Scholar] [CrossRef] [PubMed]
  15. Sansonetti, S.; Curcio, S.; Calabrò, V.; Iorio, G. Bio-ethanol production of ricotta cheese-whey as an effective alternative non-vegetable source. Biomass Bioenerg. 2009, 33, 1687–1697. [Google Scholar] [CrossRef]
  16. Sansonetti, S.; Curcio, S.; Calabrò, V.; Iorio, G. Optimization of ricotta cheese whey (RCW) fermentation by response surface methodology. Bioresour. Technol. 2010, 101, 9156–9162. [Google Scholar] [CrossRef] [PubMed]
  17. Ryan, K.N.; Vardhanabhuti, B.; Jaramillo, D.P.; Van Zanten, J.N.; Coupland, J.N.; Foegeding, E.A. Stability and mechanism of whey protein soluble aggregates thermally treated with salts. Food Hydrocoll. 2012, 27, 411–420. [Google Scholar] [CrossRef]
  18. Koffi, E.; Shewfelt, R.; Wicker, L. Storage stability and sensory analysis of UHT-processed whey-banana beverages. J. Food Qual. 2005, 28, 386–401. [Google Scholar] [CrossRef]
  19. Lee, C.A.; Vickers, Z.M. The astringency of whey protein beverages is caused by their acidity. Int. Dairy J. 2008, 18, 1153–1156. [Google Scholar] [CrossRef]
  20. LaClair, C.E.; Etzel, R.M. Ingredient and pH are key to clear beverages that contain whey protein. J. Food Sci. 2010, 75, C21–C27. [Google Scholar] [CrossRef] [PubMed]
  21. Singleton, V.L.; Rossi, J.A. Colorimetry of total phenolics with phosphomolybdic-phosphotungstic acid reagents. Am. J. Enol. Vitic. 1965, 16, 144–158. [Google Scholar]
  22. Giusti, M.M.; Wrolstad, R.E. Characterization and measurement of anthocyanins by UV-visible spectroscopy. In Current Protocols in Food Analytical Chemistry; Wrolstad, R.E., Acree, T.E., An, H., Decker, E.A., Penner, M.H., Reid, D.S., Schwartz, S.J., Shoemaker, C.F., Sporns, P., Eds.; John Wiley and Sons: New York, NY, USA, 2001; pp. F1.2.1–F1.2.13. [Google Scholar]
  23. Lo Scalzo, R.; Iannoccari, T.; Summa, C.; Morelli, R.; Rapisarda, P. Effect of thermal treatments on antioxidant and antiradical activity of blood orange juice. Food Chem. 2004, 85, 41–47. [Google Scholar] [CrossRef]
  24. CIE. Colorimetry—Part 2: CIE Standard Illuminants. [ISO 11664-2:2007]. 2006. Available online: https://www.iso.org/obp/ui/#iso:std:iso:11664:-2:ed-1:v1:en (accessed on 15 March 2015).
  25. Romano, G.; Baranyai, L.; Gottschalck, K.; Zude, M. An approach for monitoring the moisture content changes of drying banana slices with laser light backscattering imaging. Food Bioprocess Tech. 2008, 4, 410–414. [Google Scholar] [CrossRef]
  26. CIE. Improvement to Industrial Color Difference Evaluation, CIE Technical Report 142-2001; CIE Central Bureau: Vienna, Austria, 2001.
  27. Sharma, G.; Wu, W.; Dalal, E.N. The CIEDE2000 color-difference formula: Implementation notes, supplementary test data, and mathematical observations. Color Res. Appl. 2005, 30, 21–30. [Google Scholar] [CrossRef]
  28. Lindbloom, B.J. Color Difference Calculator Version 3.0, 2012. Available online: http://brucelindbloom.com/ColorDifferenceCalc.html (accessed on 19 July 2015).
  29. Kang, C.W.; Kvam, P.H. Basic Statistical Tools for Improving Quality; John Wiley & Sons: Hoboken, NJ, USA, 2011; pp. 97–124. [Google Scholar]
  30. Baccouche, A.; Ennouri, M.; Felfoul, I.; Attia, H. A physical stability study of whey-based prickly-pear beverages. Food Hydrocoll. 2013, 33, 234–244. [Google Scholar] [CrossRef]
  31. Monti, L.; Povolo, M.; Passolungo, L.; Contarini, G. Chemical characterization of Ricotta-cheese whey (scotta). In Proceedings of the Final Conference of project CANADAIR, Twinning Italy-Canada activities in Research and Innovation in the Agro-Food Area, Lodi, Italy, 15 June 2015; CREA: Roma, Italy, 2015; pp. 60–64. [Google Scholar]
  32. APAT IRSA-CNR. 2110 Torbidità. In Manual 29:2003 Metodi analitici per le acque; Belli, M., Centiolo, D., de Zorzi, P., Sansone, U., Capri, S., Pagnotta, R., Pettine, M., Eds.; APAT: Roma, Italy, 2003; Volume 1, pp. 177–182. [Google Scholar]
  33. Ibarz, A.; Pagán, J.; Garza, S. Kinetic models of non-enzymatic browning in apple puree. J. Sci. Food Agric. 2000, 80, 1162–1168. [Google Scholar] [CrossRef]
  34. Ibarz, A.; Pagán, J.; Garza, S. Kinetic models for colour changes in pear puree during heating at relatively high temperatures. J. Food Eng. 1999, 39, 415–422. [Google Scholar] [CrossRef]
  35. Ngo, T.; Wrolstad, R.E.; Zhao, Y. Color quality of Oregon strawberries—Impact of genotype, composition, and processing. J. Food Sci. 2007, 72, C25–C32. [Google Scholar] [CrossRef] [PubMed]
  36. Lee, J.; Durst, R.W.; Wrolstad, R.E. Impact of juice processing on blueberry anthocyanins and polyphenolics: Comparison of two pretreatments. J. Food Sci. 2002, 67, 1660–1667. [Google Scholar] [CrossRef]
  37. Cserhalmi, Z.; Sass-Kiss, Á.; Tóth-Markus, M.; Lechner, N. Study of pulsed electric field treated citrus juices. Innov. Food Sci. Emerg. 2006, 7, 49–54. [Google Scholar] [CrossRef]
  38. Cortellino, G.; Rizzolo, A.; Cattaneo, T.M.P. Ricotta-cheese whey- fruit based functional drinks. In Proceedings of the Final Conference of project CANADAIR, Twinning Italy-Canada activities in Research and Innovation in the Agro-Food Area, Lodi, Italy, 15 June 2015; CREA: Roma, Italy, 2015; pp. 65–70. [Google Scholar]
  39. Chen, Y.; Yu, L.J.; Rupasinghe, H.P.V. Effect of thermal and non-thermal pasteurisation on the microbial inactivation and phenolic degradation in fruit juice: A mini-review. J. Sci. Food Agric. 2013, 93, 981–986. [Google Scholar] [CrossRef] [PubMed]
  40. Noci, F.; Riener, J.; Walkling-Ribeiro, M.; Cronin, D.A.; Morgan, D.J.; Lyng, J.G. Ultraviolet irradiation and pulsed electric fields (PEF) in a hurdle strategy for the preservation of fresh apple juice. J. Food Eng. 2008, 85, 141–146. [Google Scholar] [CrossRef]
  41. Odrizola-Serrano, I.; Soliva-Fortuny, R.; Martin-Belloso, O. Phenolic acids, flavonoids, vitamin C and antioxidant capacity of strawberry juices processed by high-intensity pulsed electric fields or heat treatments. Eur. Food Res. Technol. 2008, 228, 239–248. [Google Scholar] [CrossRef]
  42. Buckow, R.; Kastell, A.; Terefe, N.S.; Versteeg, C. Pressure and temperature effects on degradation kinetics and storage stability of total anthocyanins in blueberry juice. J. Agric. Food Chem. 2010, 58, 10078–10084. [Google Scholar] [CrossRef] [PubMed]
  43. Kechinski, C.P.; Guimarães, P.V.R.; Noreña, C.P.Z.; Tessaro, I.C.; Marczak, L.D.F. Degradation kinetics of anthocyanin in blueberry juice during thermal treatment. J. Food Sci. 2010, 75, C173–C176. [Google Scholar] [CrossRef] [PubMed]
  44. Martynenko, A.; Chen, Y. Degradation kinetics of total anthocyanins and formation of polymeric color in blueberry hydrothermodynamic (HTD) processing. J. Food Eng. 2016, 171, 44–51. [Google Scholar] [CrossRef]
  45. Türkyilmaz, M.; Özkan, M. Kinetics of anthocyanin degradation and polymeric colour formation in black carrot juice concentrates during storage. Int. J. Food Sci. Technol. 2012, 47, 2273–2281. [Google Scholar] [CrossRef]
  46. Brownmiller, C.; Howard, L.R.; Prior, R.L. Processing and storage effects on monomeric anthocyanins, percent polymeric color, and antioxidant capacity of processed blueberry products. J. Food Sci. 2008, 73, H72–H79. [Google Scholar] [CrossRef] [PubMed]
  47. Yilmaz, Y.; Toledo, R. Antioxidant activity of water-soluble Maillard reaction products. Food Chem. 2005, 93, 273–278. [Google Scholar] [CrossRef]
Figure 1. Process flow diagram for the preparation of pear-RCW, apple-RCW, strawberry-RCW, and blueberry-RCW beverages; t1 refers to the time passed to reach the F 100 10 value and t2 refers to the F 100 10 value holding time.
Beverages 03 00015 g001
Figure 2. Time-temperatures graphs and F 100 10 values of pasteurization A (top) and B (bottom) lots: (a) apple-RCW, strawberry-RCW, and blueberry-RCW beverages; (b) pear-RCW beverage. Tair refers to autoclave; TP1 refers to the core of bottles put at the top of autoclave’s chamber; TP2 refers to the core of bottles put at the bottom of autoclave’s chamber; F1 is the F 100 10 value of the top bottle; F2 is the F 100 10 value of the bottom bottle.
Beverages 03 00015 g002
Figure 3. Reflectance spectra of water, ricotta-cheese whey (RCW), commercial pectin-free juices diluted to 14% SSC with water (fruit juice), and beverages before pasteurization (RCW-fruit): (a) apple and pear ‘yellow’ beverages; (b) strawberry and blueberry ‘red’ beverages.
Beverages 03 00015 g003
Figure 4. Reflectance spectra of RCW-fruit based drinks before (TQ) and after the pasteurization for each lot (lot A and lot B) and average reflectance spectra after pasteurization (mean lots).
Beverages 03 00015 g004
Figure 5. Differences in total phenolic content (ΔTPC, mg GAE/100 mL) and antioxidant activity (ΔAntOx, mg GAE/100 mL) occurring with pasteurization in A and B lots of ‘yellow’ fruit-RCW beverages and significance of Student’s t test (p-value). Bars refer to standard error (n = 3). 1 Significance of Student’s t testis expressed with asterisks: * p < 0.05, ** p < 0.01 and *** p < 0.001.
Beverages 03 00015 g005
Table 1. Significative influence (* p < 0.05; ** p < 0.01; *** p < 0.001) of the main factors juice used in the preparation of the RCW-based beverages (J), heat treatment (H) and their interaction on physicochemical parameters and antioxidants of ‘yellow’ and ‘red’ fruit-RCW beverages. Non-significant differences are given as exact p-value.
EffectsTASSCpHNTUTPCAntOxMAPPCL*h°C*E*
‘yellow’ beverages
J***0.58************ ************
H********0.12*** ************
J × H0.460.21*********** ************
‘red’ beverages
J**********************************
H0.52************0.17***0.10*******
J × H0.14*************************0.23***
Notes: TA, titratable acidity; SSC, soluble solid content; NTU, turbidity; TPC, total phenolic content; AntOx, antioxidant activity; MAP, total monomeric anthocyanin pigment; PC, percent polymeric color; L*, lightness; h°, hue; C*, chroma; E*, color index.
Table 2. Significative influence (* p < 0.05; ** p < 0.01; *** p < 0.001) of the main factors juice used in the preparation of the RCW-based beverages (J), heat treatment (H) and their interaction on changes in antioxidants and color parameters occurring with pasteurization of ‘yellow’ and ‘red’ fruit-RCW beverages. Non-significant differences are given as exact p-value.
Effects∆TPC∆AntOx∆MAP∆PCL*h°C*∆Eab*∆E00*
‘yellow’ beverages
J***0.55 ************
H0.52*** ******0.12******
J × H**** **************
‘red’ beverages
J*********0.07**************
H*0.27*0.43********
J × H*******0.06*****0.180.620.82
∆TPC, total phenolic content; ∆AntOx, antioxidant activity; ∆MAP, total monomeric anthocyanin pigment; ∆PC, percent polymeric color; ∆L*, lightness; ∆h°, hue; ∆C*, chroma; ∆Eab* and ∆E00*, color differences.
Table 3. Physicochemical analysis after pasteurization in A and B lots of fruit-RCW beverages and significance of Student’s t test (p-value) for comparison between lots within the same beverage and comparison between beverages within the same type.
‘Yellow’ Beverages
ApplePearp-value 1,2
lot Alot Bp-value 1lot Alot Bp-value 1
Titratable acidity (meq/100 mL)6.82 ± 0.136.70 ± 0.15NS3.48 ± 0.073.26 ± 0.05****
SSC (g/100 g)14.21 ± 0.1614.37 ± 0.01NS14.24 ± 0.0214.31 ± 0.01**NS
pH3.79 ± 0.00063.80 ± 0.0006NS4.27 ± 0.00054.51 ± 0.0006******
Turbidity (NTU)50.0 ± 1.025.3 ± 0.60***23.9 ± 0.5824.7 ± 0.58**
‘Red’ Beverages
BlueberryStrawberryp-value 1,2
lot Alot Bp-value 1lot Alot Bp-value 1
Titratable acidity (meq/100 mL)18.84 ± 0.3519.13 ± 0.54NS16.14 ± 0.1715.50 ± 0.22NS***
SSC (g/100 g)14.07 ± 0.1013.99 ± 0.01NS14.74 ± 0.0314.32 ± 0.04******
pH3.31 ± 0.00063.38 ± 0.0005***3.61 ± 0.00013.61 ± 0.0002NS***
Turbidity (NTU)190.0 ± 1.0188.5 ± 2.5NS91.7 ± 1.578.3 ± 1.5******
1 Significance of Student’s t testis expressed with asterisks: * p < 0.05, ** p <0.01 and *** p <0.001. 2 Significance of Student’s t test for comparison between fruit juices within the ‘yellow’ and ‘red’ fruit-RCW beverages. Values are mean (n = 3) ± standard deviation.
Table 4. Color parameters (L*, lightness; , hue angle (degrees); C*, chroma; E*, color index) of concentrated clear fruit juices diluted to 14% SSC with water (juice) and the corresponding 14% SSC Ricotta-cheese whey-based beverages (RCW-TQ) and significance of Student’s t test (p-value).
ApplePearBlueberryStrawberry
L*juice57.98 ± 0.0160.90 ± 0.0124.87 ± 0.0126.90 ± 0.01
RCW-TQ 51.29 ± 0.2956.68 ± 0.0825.13 ± 0.01a25.82 ± 0.01
p-value 1************
h°juice84.73 ± 0.0190.99 ± 0.04361.35 ± 0.15359.51 ± 0.06
RCW-TQ 81.76 ± 0.0888.63 ± 0.01354.09 ± 0.33374.73 ± 0.14
p-value 1************
C*juice35.87±0.0128.25±0.012.14±0.013.22±0.01
RCW-TQ 29.89±0.2226.81±0.062.41±0.023.41±0.01
p-value 1************
E*juice68.18±0.0167.13±0.0124.96±0.0127.09±0.01
RCW-TQ 59.36±0.3562.70±0.0625.24±0.0126.04±0.01
p-value 1************
1 Significance of Student’s t test is expressed with asterisks: * p < 0.05, ** p < 0.01 and *** p < 0.001. Values are mean (n = 3) ± standard deviation.
Table 5. Differences in lightness (ΔL*), chroma (ΔC*) and hue (Δh°) and ΔEab* and ΔE00* color differences occurring with pasteurization in ricotta-cheese whey-fruit beverages for A and B lots and significance of Student’s t test (p-value).
ApplePear
lot Alot Bp-value 1lot Alot Bp-value 1
ΔL*–5.55 ± 0.28+1.22 ± 0.35***–4.28 ± 0.08–4.62 ± 0.07**
ΔC*–3.65 ± 0.19+0.536 ± 0.10***–0.90 ± 0.12–1.11 ± 0.07NS
Δh°–4.16 ± 0.12+0.68 ± 0.07***–3.40 ± 0.02–3.53 ± 0.01***
ΔEab*6.94 ± 0.341.38 ± 0.35***4.64 ± 0.095.01 ± 0.05**
ΔE00*6.00 ± 0.301.27 ± 0.34***4.00 ± 0.584.67 ± 0.06NS
BlueberryStrawberry
lot Alot Bp-value 1lot Alot Bp-value 1
ΔL*–0.72 ± 0.01–0.69 ± 0.02NS–0.58 ± 0.03–0.70 ± 0.03**
ΔC*–1.63 ± 0.03–1.52 ± 0.05*–1.29 ± 0.02–1.10 ± 0.09*
Δh°–17.9 ± 2.2–10.3 ± 2.6*+1.62 ± 0.26+0.17 ± 1.04NS
ΔEab*1.83 ± 0.041.69 ± 0.06*1.42 ± 0.011.30 ± 0.03*
ΔE00*2.34 ± 0.062.14 ± 0.09*1.68 ± 0.011.46 ± 0.11*
1 Data are mean ± standard deviation (n = 3); significance of Student’s t test is expressed with asterisks: * p < 0.05, ** p < 0.01 and *** p < 0.001. For ΔL*, ΔC* and Δh° a minus sign indicates a decrease and a positive sign an increase of the value due to pasteurization respect to L*, C* and h° parameters of TQ samples (values in Table 4).
Table 6. Total phenolic content (TPC), antioxidant activity (AntOx) total monomeric anthocyanin content (MAP) and percent polymeric color of RCW-fruit drinks before pasteurization (TQ samples) and significance of Student’s t test (p-value).
‘Yellow’ DrinksApplePearp-value 1
TPC (mg GAE/100 mL)48.7 ± 0.9534.6 ± 0.35***
AntOx (mg GAE/100 mL)3.07 ± 0.071.99 ± 0.04***
‘Red’ DrinksBlueberryStrawberryp-value 1
TPC (mg GAE/100 mL)310.7 ± 1.9245.2 ± 1.8***
MAP (mg C3GE/100 mL)170.2 ± 6.045.8 ± 1.5***
AntOx (mg GAE/100 mL)36.20 ± 0.9631.33 ± 0.55**
Polymeric color (%)39.14 ± 0.6171.41 ± 5.33***
1 Data are mean ± standard deviation (n = 3); significance of Student’s t test is expressed with asterisks: * p < 0.05, ** p < 0.01 and *** p < 0.001.
Table 7. Differences in total phenolic content (∆TPC), antioxidant activity (∆AntOx) total monomeric anthocyanin content (∆MAP) and percent polymeric color (∆PC) occurring with pasteurization in A and B lots of ‘red’fruit-RCW beverages and significance of Student’s t test (p-value).
BlueberryStrawberry
Past APast Bp-value 1Past APast Bp-value 1
ΔTPC (mg GAE/100 mL)–58.8 ± 5.3–32.2 ± 5.7**–23.5 ± 0.5–33.1 ± 5.2*
ΔAntOx (mg GAE/100 mL)–1.3 ± 0.5–5.9 ± 1.2**+1.2 ± 2.0+4.2 ± 0.7NS
ΔMAP (mg C3GE/100 mL)–58.6 ± 7.1–43.7 ± 4.7*–14.4 ± 1.9–12.3 ± 2.2NS
ΔPC (%)+8.8 ± 1.8+18.2 ± 4.3*+22.1 ± 7.2+17.9 ± 6.2NS
1 Data are mean ± standard deviation (n = 3); significance of Student’s t test is expressed with asterisks: * p < 0.05, ** p < 0.01 and *** p < 0.001.

